FISCAL 2016 SECOND QUARTER EARNINGS PRESENTATION - …
19
SECOND QUARTER FISCAL YEAR 2016 EARNINGS PRESENTATION December 17, 2015
Transcript of FISCAL 2016 SECOND QUARTER EARNINGS PRESENTATION - …

SECOND QUARTER FISCAL YEAR 2016 EARNINGS PRESENTATION
December 17, 2015

2
Forward-Looking Statements
This presentation contains certain forward‐looking statements,including information concerning the Company's intention tocommence a modified Dutch auction tender offer. Such forward‐looking statements are subject to various risks and uncertainties,including the conditions of the children’s book and educationalmaterials markets and acceptance of the Company’s products inthose markets, and other risks and factors identified from time totime in the Company’s filings with the Securities and ExchangeCommission. Actual results could differ materially from thosecurrently anticipated.

3
Regulation G
Today’s comments include references to certain non‐GAAPfinancial measures as defined in Regulation G. Thereconciliation of these non‐GAAP financial measures with therelevant GAAP financial information and other informationrequired by Regulation G is provided in the Company’s earningsrelease, which is posted on the Company’s investor relationswebsite at investor.scholastic.com.

4
Dick Robinson
Chief Executive Officer, Presidentand Chairman

Repurchase of Up to $200 Million Common Stock
5
• Board of Directors approved share repurchase of up to $200 million through a modified “Dutch Auction” tender offer
• In addition, approximately $60 million remains available for open‐market share repurchases under previous authorizations
• The Company expects to launch the tender offer by the end of the calendar year
• The tender offer will be subject to various terms and conditions to be described in the offer materials to be filed with the SEC and distributed to stockholders at the commencement of the offer
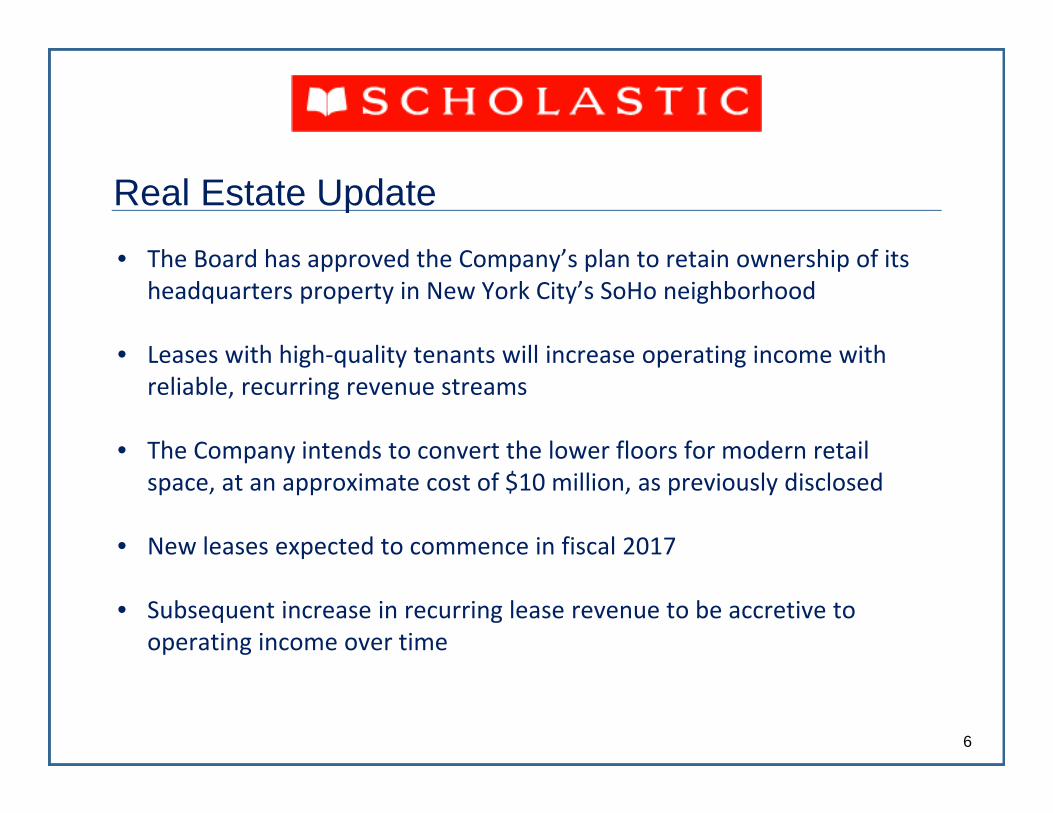
Real Estate Update
6
• The Board has approved the Company’s plan to retain ownership of its headquarters property in New York City’s SoHo neighborhood
• Leases with high‐quality tenants will increase operating income with reliable, recurring revenue streams
• The Company intends to convert the lower floors for modern retail space, at an approximate cost of $10 million, as previously disclosed
• New leases expected to commence in fiscal 2017
• Subsequent increase in recurring lease revenue to be accretive to operating income over time

Second Quarter 2016 Results
7
• Revenue increased +$7.9 million to $619.0 million, excluding negative impact foreign exchange of $17.2 million in the quarter
• Strong trade publishing sales in children’s books globally
• Record classroom magazine circulation with paid subscriptions reaching over 14.5 million at quarter‐end
• US book fair revenue up +6% on higher revenue per fair and number of fairs held
• US reading club business impacted by later school openings
• Positive climate for quality children’s books continued in the quarter
• 2016 Sales and EPS guidance revised on foreign currency headwinds and labor action in Ontario schools

8

Children’s Book Publishing and Distribution
9
• Segment revenue up +$5.4 million, or 1% from prior year period
• A strong fall frontlist drove solid trade publishing results led by new releases in our most popular series• Star Wars: Jedi Academy #3: The Phantom Bully
• Wings of Fire Book 7: Winter Turning
• Captain Underpants and the Sensational Saga of Sir Stinks‐A‐Lot
• Harry Potter and the Sorcerer's Stone: The Illustrated Edition and Harry Potter Coloring Book
• Goosebumps®, in connection with the release of the film based on the series and its author R.L. Stine
• Lower school reading clubs revenue due to later school openings and year‐over‐year decline in Minecraft handbook sales
• Book Fairs revenue up 6% on higher revenue per fair and increase in the number of fairs held

10

Education
11
• Segment revenue up +$2.2 million, or 3% from prior year period
• High circulation in classroom magazines – doubled subscriber base in last four years to over 14.5 million
• Increased sales in custom publishing programs, as well as higher demand for the Company’s teaching resource workbooks
• Compelling growth opportunities driving increased investment in sales force and new marketing programs

International
12
• Segment revenue $115.7 million, versus $132.6 million in the prior year period
• Strong performance in trade in local currencies, led by Canada, Australia/New Zealand, India and Asia
• Growing middle class is continuing to drive demand for English‐language books and instructional materials in Asia
13
Maureen O’Connell
Executive Vice President,Chief Administrative Officer and CFO
14
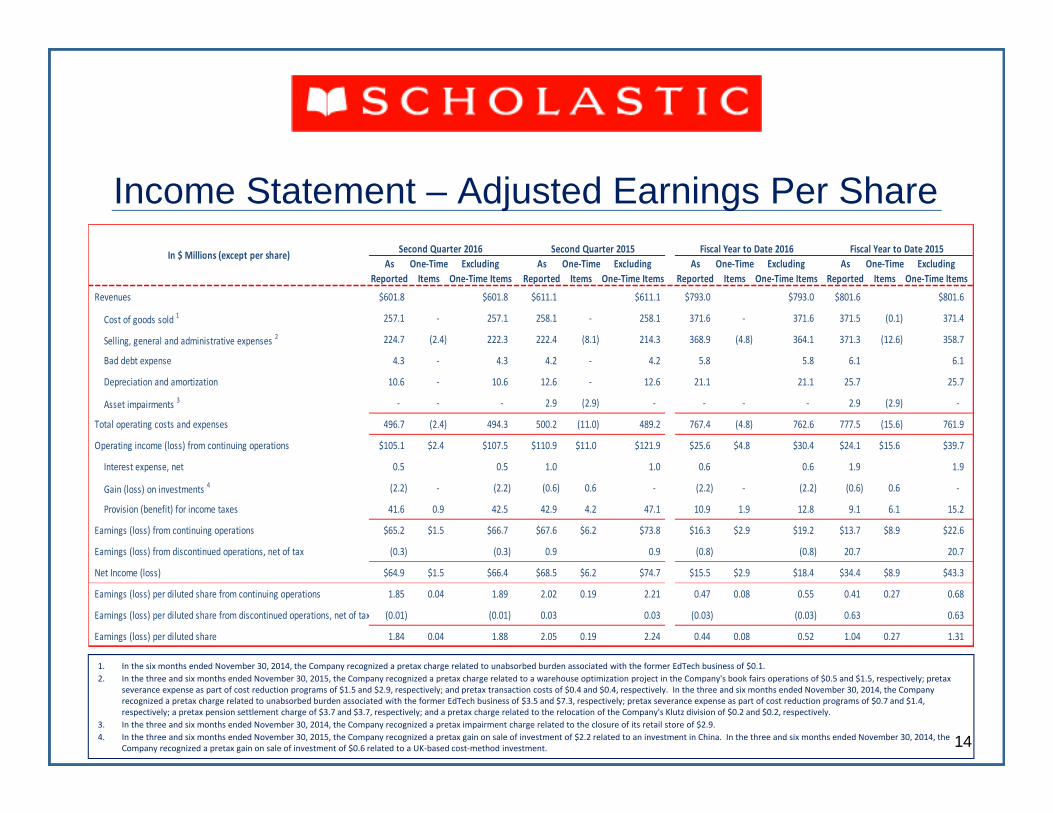
Income Statement – Adjusted Earnings Per Share
1. In the six months ended November 30, 2014, the Company recognized a pretax charge related to unabsorbed burden associated with the former EdTech business of $0.1.2. In the three and six months ended November 30, 2015, the Company recognized a pretax charge related to a warehouse optimization project in the Company's book fairs operations of $0.5 and $1.5, respectively; pretax
severance expense as part of cost reduction programs of $1.5 and $2.9, respectively; and pretax transaction costs of $0.4 and $0.4, respectively. In the three and six months ended November 30, 2014, the Company recognized a pretax charge related to unabsorbed burden associated with the former EdTech business of $3.5 and $7.3, respectively; pretax severance expense as part of cost reduction programs of $0.7 and $1.4, respectively; a pretax pension settlement charge of $3.7 and $3.7, respectively; and a pretax charge related to the relocation of the Company's Klutz division of $0.2 and $0.2, respectively.
3. In the three and six months ended November 30, 2014, the Company recognized a pretax impairment charge related to the closure of its retail store of $2.9. 4. In the three and six months ended November 30, 2015, the Company recognized a pretax gain on sale of investment of $2.2 related to an investment in China. In the three and six months ended November 30, 2014, the
Company recognized a pretax gain on sale of investment of $0.6 related to a UK‐based cost‐method investment.
As One‐Time Excluding As One‐Time Excluding As One‐Time Excluding As One‐Time ExcludingReported Items One‐Time Items Reported Items One‐Time Items Reported Items One‐Time Items Reported Items One‐Time Items
Revenues $601.8 $601.8 $611.1 $611.1 $793.0 $793.0 $801.6 $801.6
Cost of goods sold 1 257.1 ‐ 257.1 258.1 ‐ 258.1 371.6 ‐ 371.6 371.5 (0.1) 371.4
Selling, general and administrative expenses 2 224.7 (2.4) 222.3 222.4 (8.1) 214.3 368.9 (4.8) 364.1 371.3 (12.6) 358.7
Bad debt expense 4.3 ‐ 4.3 4.2 ‐ 4.2 5.8 5.8 6.1 6.1
Depreciation and amortization 10.6 ‐ 10.6 12.6 ‐ 12.6 21.1 21.1 25.7 25.7
Asset impairments 3 ‐ ‐ ‐ 2.9 (2.9) ‐ ‐ ‐ ‐ 2.9 (2.9) ‐
Total operating costs and expenses 496.7 (2.4) 494.3 500.2 (11.0) 489.2 767.4 (4.8) 762.6 777.5 (15.6) 761.9
Operating income (loss) from continuing operations $105.1 $2.4 $107.5 $110.9 $11.0 $121.9 $25.6 $4.8 $30.4 $24.1 $15.6 $39.7
Interest expense, net 0.5 0.5 1.0 1.0 0.6 0.6 1.9 1.9
Gain (loss) on investments 4 (2.2) ‐ (2.2) (0.6) 0.6 ‐ (2.2) ‐ (2.2) (0.6) 0.6 ‐
Provision (benefit) for income taxes 41.6 0.9 42.5 42.9 4.2 47.1 10.9 1.9 12.8 9.1 6.1 15.2
Earnings (loss) from continuing operations $65.2 $1.5 $66.7 $67.6 $6.2 $73.8 $16.3 $2.9 $19.2 $13.7 $8.9 $22.6
Earnings (loss) from discontinued operations, net of tax (0.3) (0.3) 0.9 0.9 (0.8) (0.8) 20.7 20.7
Net Income (loss) $64.9 $1.5 $66.4 $68.5 $6.2 $74.7 $15.5 $2.9 $18.4 $34.4 $8.9 $43.3
Earnings (loss) per diluted share from continuing operations 1.85 0.04 1.89 2.02 0.19 2.21 0.47 0.08 0.55 0.41 0.27 0.68
Earnings (loss) per diluted share from discontinued operations, net of tax (0.01) (0.01) 0.03 0.03 (0.03) (0.03) 0.63 0.63
Earnings (loss) per diluted share 1.84 0.04 1.88 2.05 0.19 2.24 0.44 0.08 0.52 1.04 0.27 1.31
In $ Millions (except per share) Fiscal Year to Date 2015Fiscal Year to Date 2016Second Quarter 2016 Second Quarter 2015
15
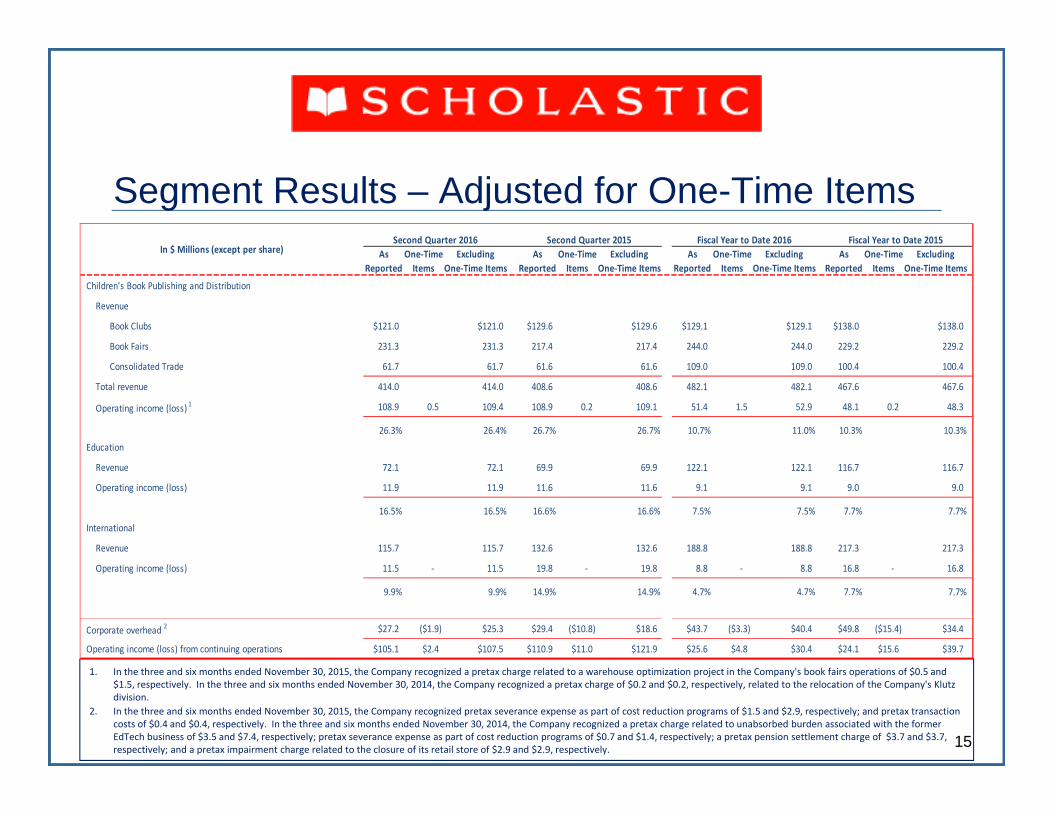
Segment Results – Adjusted for One-Time Items
1. In the three and six months ended November 30, 2015, the Company recognized a pretax charge related to a warehouse optimization project in the Company's book fairs operations of $0.5 and $1.5, respectively. In the three and six months ended November 30, 2014, the Company recognized a pretax charge of $0.2 and $0.2, respectively, related to the relocation of the Company's Klutz division.
2. In the three and six months ended November 30, 2015, the Company recognized pretax severance expense as part of cost reduction programs of $1.5 and $2.9, respectively; and pretax transaction costs of $0.4 and $0.4, respectively. In the three and six months ended November 30, 2014, the Company recognized a pretax charge related to unabsorbed burden associated with the former EdTech business of $3.5 and $7.4, respectively; pretax severance expense as part of cost reduction programs of $0.7 and $1.4, respectively; a pretax pension settlement charge of $3.7 and $3.7, respectively; and a pretax impairment charge related to the closure of its retail store of $2.9 and $2.9, respectively.
As One‐Time Excluding As One‐Time Excluding As One‐Time Excluding As One‐Time ExcludingReported Items One‐Time Items Reported Items One‐Time Items Reported Items One‐Time Items Reported Items One‐Time Items
Children's Book Publishing and Distribution
Revenue
Book Clubs $121.0 $121.0 $129.6 $129.6 $129.1 $129.1 $138.0 $138.0
Book Fairs 231.3 231.3 217.4 217.4 244.0 244.0 229.2 229.2
Consolidated Trade 61.7 61.7 61.6 61.6 109.0 109.0 100.4 100.4
Total revenue 414.0 414.0 408.6 408.6 482.1 482.1 467.6 467.6
Operating income (loss) 1 108.9 0.5 109.4 108.9 0.2 109.1 51.4 1.5 52.9 48.1 0.2 48.3
26.3% 26.4% 26.7% 26.7% 10.7% 11.0% 10.3% 10.3%
Education
Revenue 72.1 72.1 69.9 69.9 122.1 122.1 116.7 116.7
Operating income (loss) 11.9 11.9 11.6 11.6 9.1 9.1 9.0 9.0
16.5% 16.5% 16.6% 16.6% 7.5% 7.5% 7.7% 7.7%
International
Revenue 115.7 115.7 132.6 132.6 188.8 188.8 217.3 217.3
Operating income (loss) 11.5 ‐ 11.5 19.8 ‐ 19.8 8.8 ‐ 8.8 16.8 ‐ 16.8
9.9% 9.9% 14.9% 14.9% 4.7% 4.7% 7.7% 7.7%
Corporate overhead 2 $27.2 ($1.9) $25.3 $29.4 ($10.8) $18.6 $43.7 ($3.3) $40.4 $49.8 ($15.4) $34.4
Operating income (loss) from continuing operations $105.1 $2.4 $107.5 $110.9 $11.0 $121.9 $25.6 $4.8 $30.4 $24.1 $15.6 $39.7
In $ Millions (except per share)Fiscal Year to Date 2015Second Quarter 2016 Fiscal Year to Date 2016Second Quarter 2015

16
Free Cash Flow & Net Debt
1. Free cash flow (use) is defined by the Company as net cash provided by or used in operating activities (which includes royalty advances), reduced by spending on property, plant and equipment and pre‐publication and production costs
2. Net debt is defined by the Company as lines of credit and short‐term debt plus long‐term‐debt, net of cash and cash equivalents
In $ Millions Nov 30, 2015 Nov 30, 2014 Free cash flow (use) (3 month period ending)1 $101.8 $125.7
Free cash flow (use) (6 month period ending) excluding taxes paid on sale of EdTech1 ($15.4) $48.8
Accounts receivable, net $252.2 $244.4
Inventories, net $332.0 $333.0
Accounts payable $207.8 $174.6
Accrued royalties $36.9 $37.2
Total debt $12.0 $104.2
Cash and cash equivalents 360.9 42.9
Net debt2 ($348.9) $61.3

17
Revised FY 2016 Outlook
Metric Guidance
Revenue Approximately $1.65 billion
Earnings from Continuing Operations 1 Approximately $1.35 per diluted share
Free Cash Flow $35 ‐ $45 million
Capital Expenditures $40 ‐ $50 million
Prepublication/Production Spending $30 ‐ $40 million
1. Outlook for EPS and operating income excludes severance and other special one‐time items associated with restructuring actions, as well as non‐cash, non‐operating items.
2. Outlook for Free Cash Flow excludes taxes paid on the gain on the sale of EdTech.

18
Questions & Answers
Participants
• Richard Robinson
• Maureen O’Connell
• Judy Newman, School Book Clubs and E‐Commerce
• Ellie Berger, Trade Group

19