Summary of FY2017 Second Quarter Earnings · PDF file2 Contents I. Summary of FY2017 Second...
34
The English version is a translation of the original Japanese version. Please note that if there is any discrepancy, the Japanese version will take priority. Summary of FY2017 Second Quarter Earnings Results Electric Power Development Co., Ltd. Electric Power Development Co., Ltd. October 31, 2017 October 31, 2017
Transcript of Summary of FY2017 Second Quarter Earnings · PDF file2 Contents I. Summary of FY2017 Second...

0
The English version is a translation of the original Japanese version. Please note that if there is any discrepancy, the Japanese version will take priority.
Summary of FY2017 Second QuarterEarnings Results
Electric Power Development Co., Ltd.Electric Power Development Co., Ltd.
October 31, 2017October 31, 2017
1
Forward Looking Statements
The following contains statements that constitute forward-looking statements, plans for
the future, management targets, etc. relating to the Company and/or the J-POWER group.
These are based on current assumptions of future events, and there exist possibilities
that such assumptions are objectively incorrect and actual results may differ from those
in the statements as a result of various factors.
Furthermore, information and data other than those concerning the Company and its
subsidiaries/affiliates are quoted from public information, and the Company has not
verified and will not warrant its accuracy or appropriateness.
※Display of Figures
All figures are consolidated unless stated otherwise.
Amounts less than 100 million yen and electric power sales volume less than 100 million kWh shown in the consolidated financial data have been rounded down. Consequently, the sum of the individual amounts may not necessarily agree with figures shown in total columns.
2
Contents
I. Summary of FY2017 Second Quarter Earnings Results Summary of FY2017 Second Quarter Earnings Results 4 Key Data 5 FY2017 Second Quarter Earnings Results (Main Factors for Change) 7 Revenue / Expenditure Comparison 8 Balance Sheet 9
II. Summary of FY2017 Earnings Forecast Summary of FY2017 Earnings Forecast 11 Key Data 12 FY2017 Earnings Forecast (Main Factors for Change) 13
APPENDIX 14
3
I. Summary of FY2017 Second QuarterEarnings Results
4
Summary of FY2017 Second Quarter Earnings Results
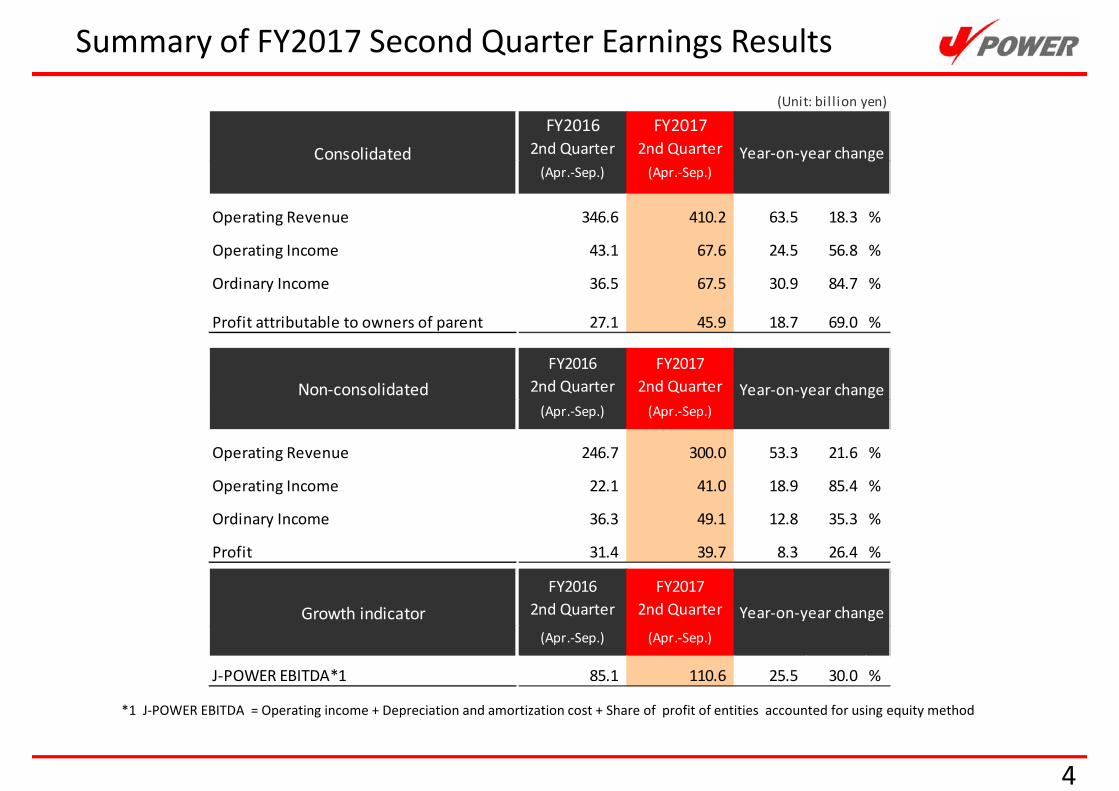
*1 J-POWER EBITDA = Operating income + Depreciation and amortization cost + Share of profit of entities accounted for using equity method
(Unit: bil lion yen)
(Apr.-Sep.) (Apr.-Sep.)
Operating Revenue 346.6 410.2 63.5 18.3 %
Operating Income 43.1 67.6 24.5 56.8 %
Ordinary Income 36.5 67.5 30.9 84.7 %
Profit attributable to owners of parent 27.1 45.9 18.7 69.0 %
(Apr.-Sep.) (Apr.-Sep.)
Operating Revenue 246.7 300.0 53.3 21.6 %
Operating Income 22.1 41.0 18.9 85.4 %
Ordinary Income 36.3 49.1 12.8 35.3 %
Profit 31.4 39.7 8.3 26.4 %
(Apr.-Sep.) (Apr.-Sep.)
J-POWER EBITDA*1 85.1 110.6 25.5 30.0 %
FY20162nd Quarter
FY20172nd Quarter
FY20162nd Quarter
FY20172nd Quarter
FY20162nd Quarter
FY20172nd QuarterGrowth indicator Year-on-year change
Non-consolidated
Year-on-year changeConsolidated
Year-on-year change
5
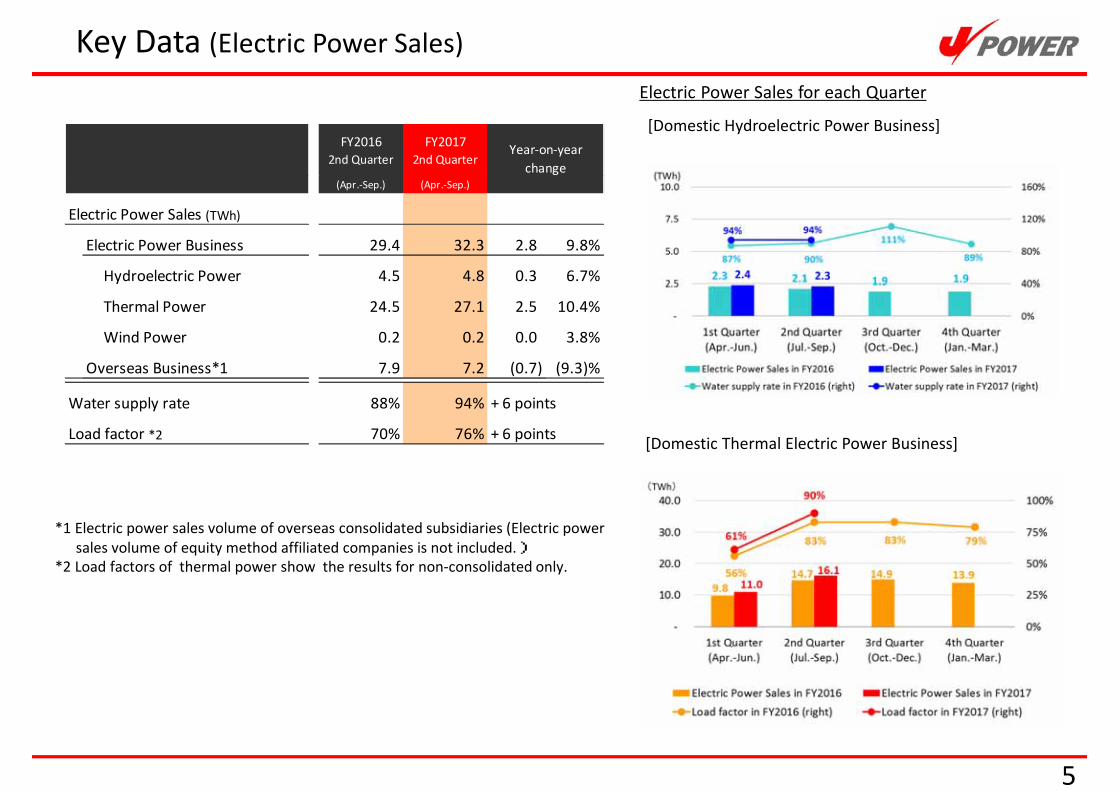
Key Data (Electric Power Sales)Electric Power Sales for each Quarter
[Domestic Hydroelectric Power Business]
[Domestic Thermal Electric Power Business]
*1 Electric power sales volume of overseas consolidated subsidiaries (Electric power sales volume of equity method affiliated companies is not included.)
*2 Load factors of thermal power show the results for non-consolidated only.
(Apr.-Sep.) (Apr.-Sep.)
Electric Power Sales (TWh)
Electric Power Business 29.4 32.3
Hydroelectric Power 4.5 4.8
Thermal Power 24.5 27.1
Wind Power 0.2 0.2
Overseas Business*1 7.9 7.2
Water supply rate 88% 94%
Load factor *2 70% 76%
Year-on-yearchange
FY20162nd Quarter
FY20172nd Quarter
2.8 9.8%
0.3 6.7%
2.5 10.4%
0.0 3.8%
(0.7) (9.3)%
+ 6 points
+ 6 points
6
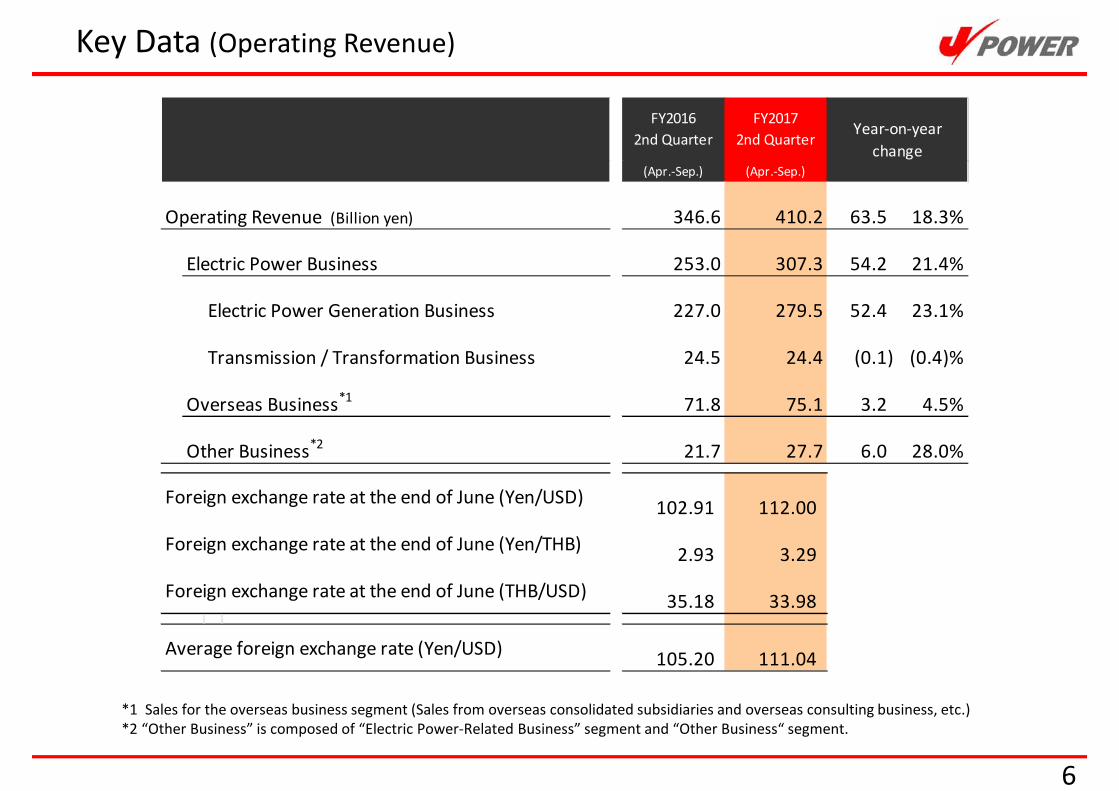
Key Data (Operating Revenue)
*1 Sales for the overseas business segment (Sales from overseas consolidated subsidiaries and overseas consulting business, etc.)*2 “Other Business” is composed of “Electric Power-Related Business” segment and “Other Business“ segment.
(Apr.-Sep.) (Apr.-Sep.)
Operating Revenue (Billion yen) 346.6 410.2
Electric Power Business 253.0 307.3
Electric Power Generation Business 227.0 279.5
Transmission / Transformation Business 24.5 24.4
Overseas Business*1 71.8 75.1
Other Business*2 21.7 27.7
102.91 112.00
2.93 3.29
35.18 33.98
105.20 111.04
Foreign exchange rate at the end of June (THB/USD)
Foreign exchange rate at the end of June (Yen/USD)
Foreign exchange rate at the end of June (Yen/THB)
Average foreign exchange rate (Yen/USD)
Year-on-yearchange
FY20162nd Quarter
FY20172nd Quarter
63.5 18.3%
54.2 21.4%
52.4 23.1%
(0.1) (0.4)%
3.2 4.5%
6.0 28.0%
67.5
36.5
(5.0)
(0.5)
+5.5
+3.0
+4.0
+2.5
+3.0
+3.5
+15.0
- 10.0 20.0 30.0 40.0 50.0 60.0 70.0
FY2017/2QOrdinaryIncome
FY2016/2QOrdinaryIncome
7
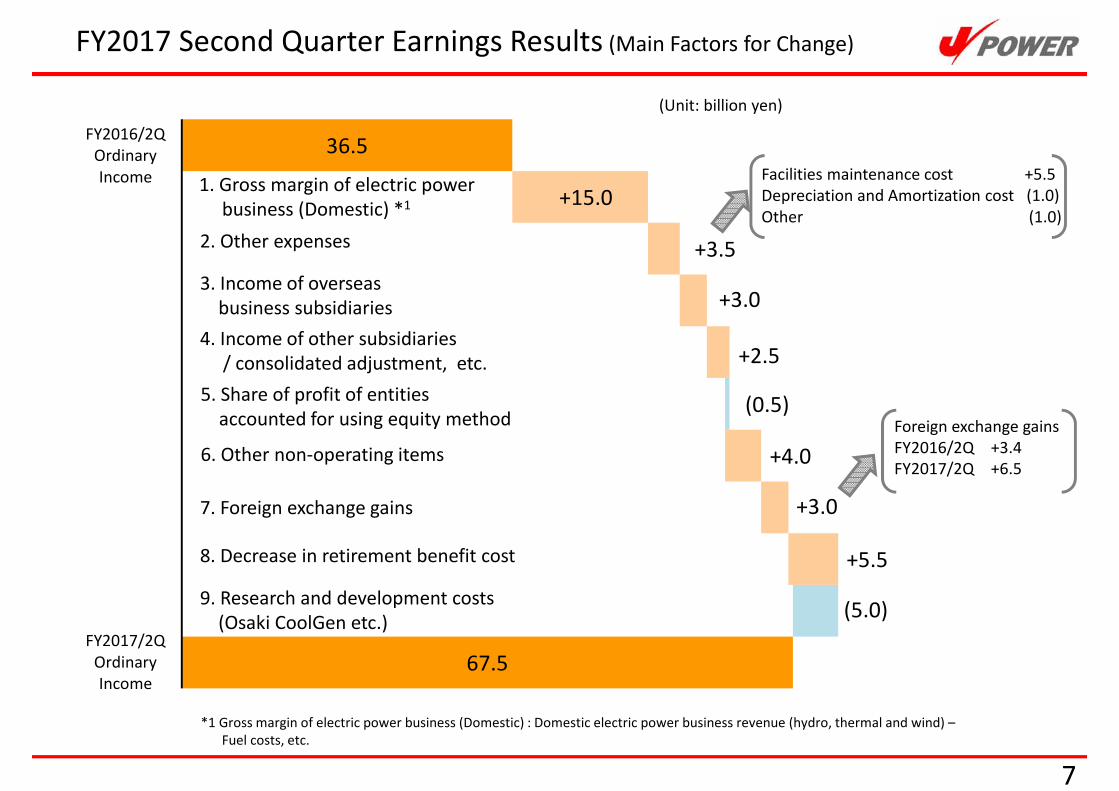
FY2017 Second Quarter Earnings Results (Main Factors for Change)
(Unit: billion yen)
3. Income of overseasbusiness subsidiaries
7. Foreign exchange gains
1. Gross margin of electric powerbusiness (Domestic) *1
8. Decrease in retirement benefit cost
2. Other expenses
5. Share of profit of entitiesaccounted for using equity method
4. Income of other subsidiaries/ consolidated adjustment, etc.
6. Other non-operating items
9. Research and development costs(Osaki CoolGen etc.)
Facilities maintenance cost +5.5Depreciation and Amortization cost (1.0)Other (1.0)
*1 Gross margin of electric power business (Domestic) : Domestic electric power business revenue (hydro, thermal and wind) –Fuel costs, etc.
Foreign exchange gainsFY2016/2Q +3.4FY2017/2Q +6.5
8
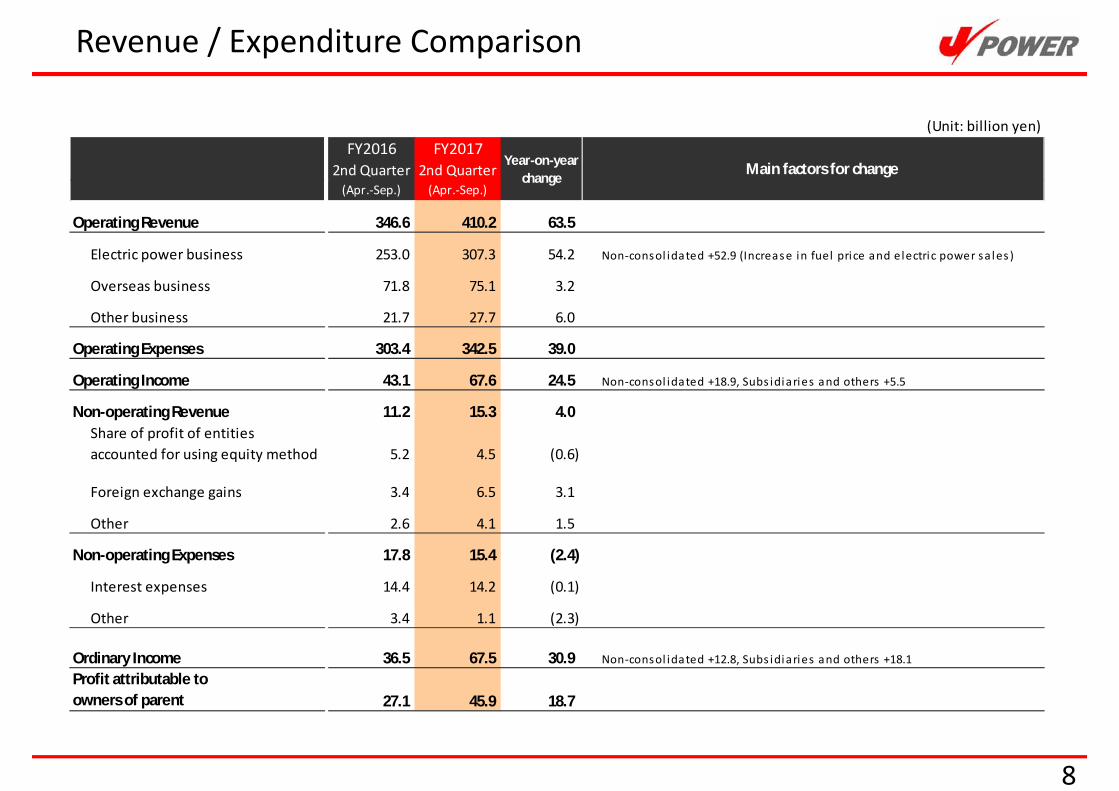
Revenue / Expenditure Comparison
(Unit: billion yen)
(Apr.-Sep.) (Apr.-Sep.)
Operating Revenue 346.6 410.2 63.5
Electric power business 253.0 307.3 54.2 Non-consol idated +52.9 (Increas e in fuel price and electric power sa les )
Overseas business 71.8 75.1 3.2
Other business 21.7 27.7 6.0
Operating Expenses 303.4 342.5 39.0
Operating Income 43.1 67.6 24.5
Non-operating Revenue 11.2 15.3 4.0Share of profit of entitiesaccounted for using equity method 5.2 4.5 (0.6)
Foreign exchange gains 3.4 6.5 3.1
Other 2.6 4.1 1.5
Non-operating Expenses 17.8 15.4 (2.4)
Interest expenses 14.4 14.2 (0.1)
Other 3.4 1.1 (2.3)
Ordinary Income 36.5 67.5 30.9
27.1 45.9 18.7Profit attributable toowners of parent
Non-consol idated +12.8, Subs idiaries and others +18.1
Year-on-yearchange Main factors for change
FY20162nd Quarter
FY20172nd Quarter
Non-consol idated +18.9, Subs idiaries and others +5.5
9
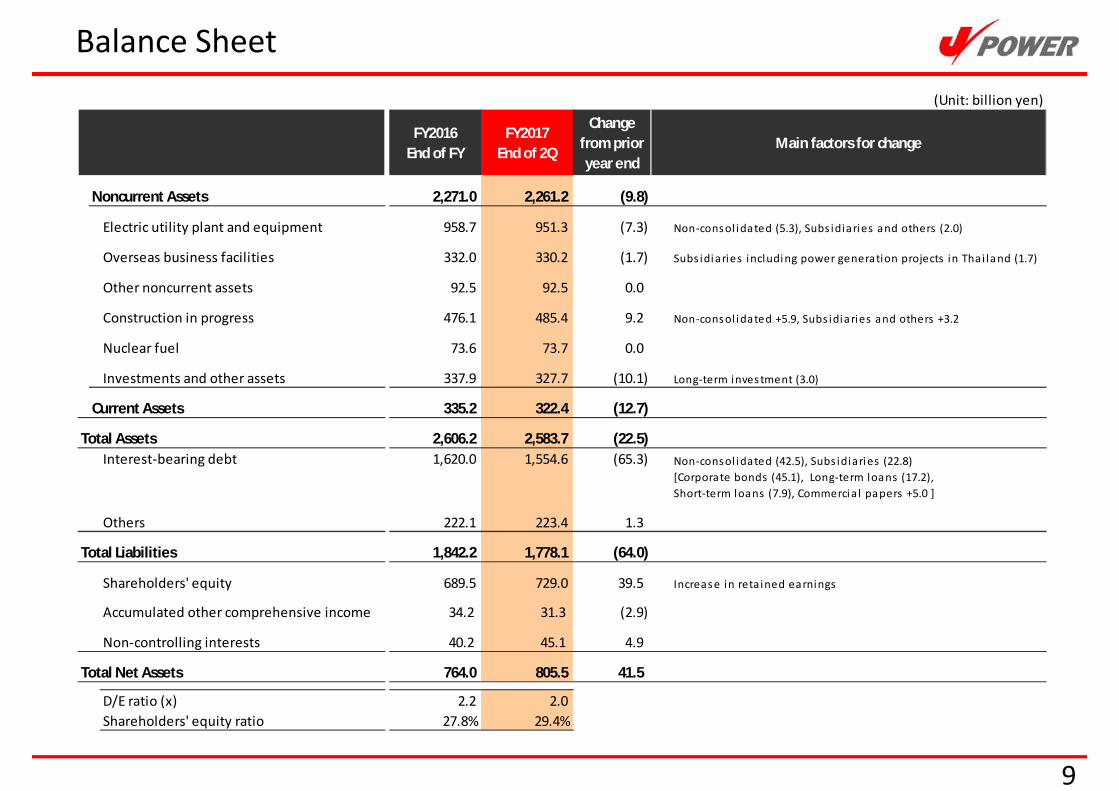
Balance Sheet(Unit: billion yen)
Noncurrent Assets 2,271.0 2,261.2 (9.8)
Electric utility plant and equipment 958.7 951.3 (7.3)
Overseas business facilities 332.0 330.2 (1.7)
Other noncurrent assets 92.5 92.5 0.0
Construction in progress 476.1 485.4 9.2
Nuclear fuel 73.6 73.7 0.0
Investments and other assets 337.9 327.7 (10.1)
Current Assets 335.2 322.4 (12.7)
Total Assets 2,606.2 2,583.7 (22.5)Interest-bearing debt 1,620.0 1,554.6 (65.3)
Others 222.1 223.4 1.3
Total Liabilities 1,842.2 1,778.1 (64.0)
Shareholders' equity 689.5 729.0 39.5
Accumulated other comprehensive income 34.2 31.3 (2.9)
Non-controlling interests 40.2 45.1 4.9
Total Net Assets 764.0 805.5 41.5
D/E ratio (x) 2.2 2.0 Shareholders' equity ratio 27.8% 29.4%
FY2016End of FY
FY2017End of 2Q
Changefrom prioryear end
Main factors for change
Non-consol idated (5.3), Subs idiaries and others (2.0)
Subs idiaries including power generation projects in Thai la nd (1.7)
Non-consol idated +5.9, Subs idia ries and others +3.2
Long-term investment (3.0)
Non-consol idated (42.5), Subs idiaries (22.8)[Corporate bonds (45.1), Long-term loans (17.2),Short-term loans (7.9), Commercia l papers +5.0 ]
Increase in reta ined earnings
10
II. Summary of FY2017 Earnings Forecast
11
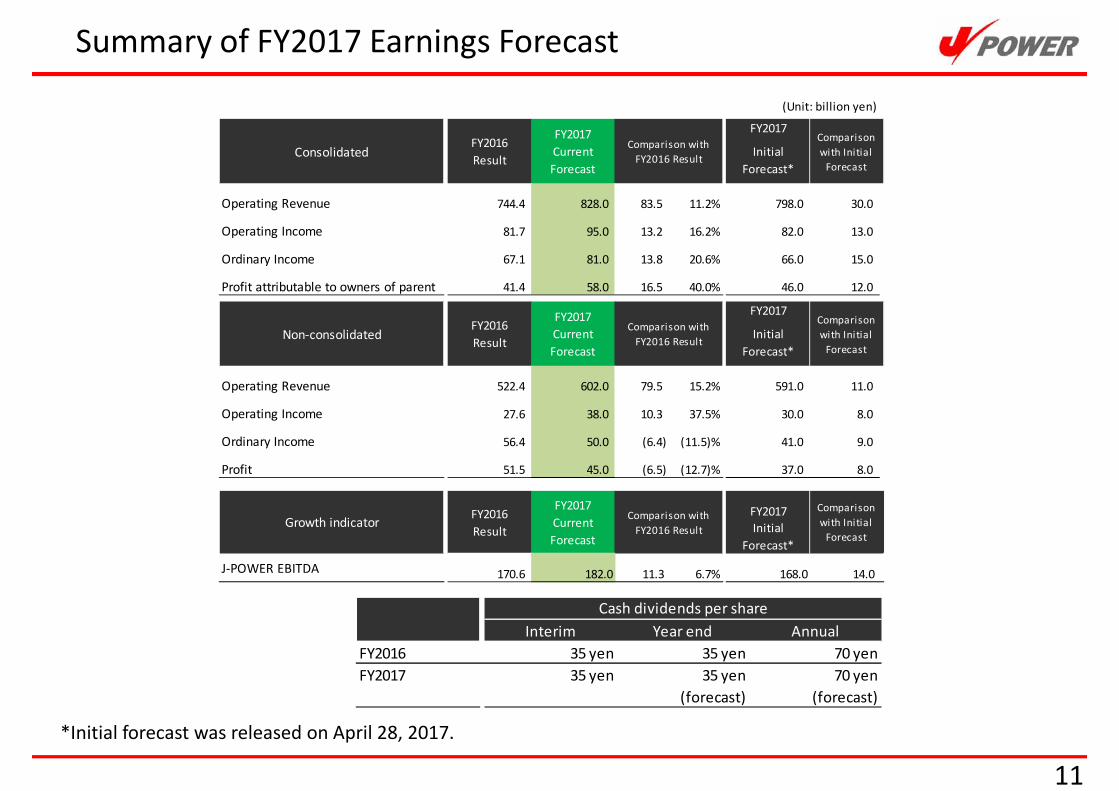
Summary of FY2017 Earnings Forecast
*Initial forecast was released on April 28, 2017.
Interim Year end AnnualFY2016 35 yen 35 yen 70 yenFY2017 35 yen 35 yen
(forecast)70 yen
(forecast)
Cash dividends per share
(Unit: billion yen)
FY2017
Operating Revenue 744.4 828.0 83.5 11.2% 798.0 30.0
Operating Income 81.7 95.0 13.2 16.2% 82.0 13.0
Ordinary Income 67.1 81.0 13.8 20.6% 66.0 15.0
Profit attributable to owners of parent 41.4 58.0 16.5 40.0% 46.0 12.0
FY2017
Operating Revenue 522.4 602.0 79.5 15.2% 591.0 11.0
Operating Income 27.6 38.0 10.3 37.5% 30.0 8.0
Ordinary Income 56.4 50.0 (6.4) (11.5)% 41.0 9.0
Profit 51.5 45.0 (6.5) (12.7)% 37.0 8.0
FY2017
J-POWER EBITDA 170.6 182.0 11.3 6.7% 168.0 14.0
Growth indicator FY2016Result
FY2017CurrentForecast
Comparison withFY2016 Result
Comparisonwith Initial
ForecastInitial
Forecast*
FY2016Result
FY2017CurrentForecast
Comparison withFY2016 Result
Comparisonwith Initial
ForecastInitial
Forecast*
FY2016Result
FY2017CurrentForecast
Comparison withFY2016 Result
Comparisonwith Initial
ForecastInitial
Forecast*Consolidated
Non-consolidated
Key Data
12
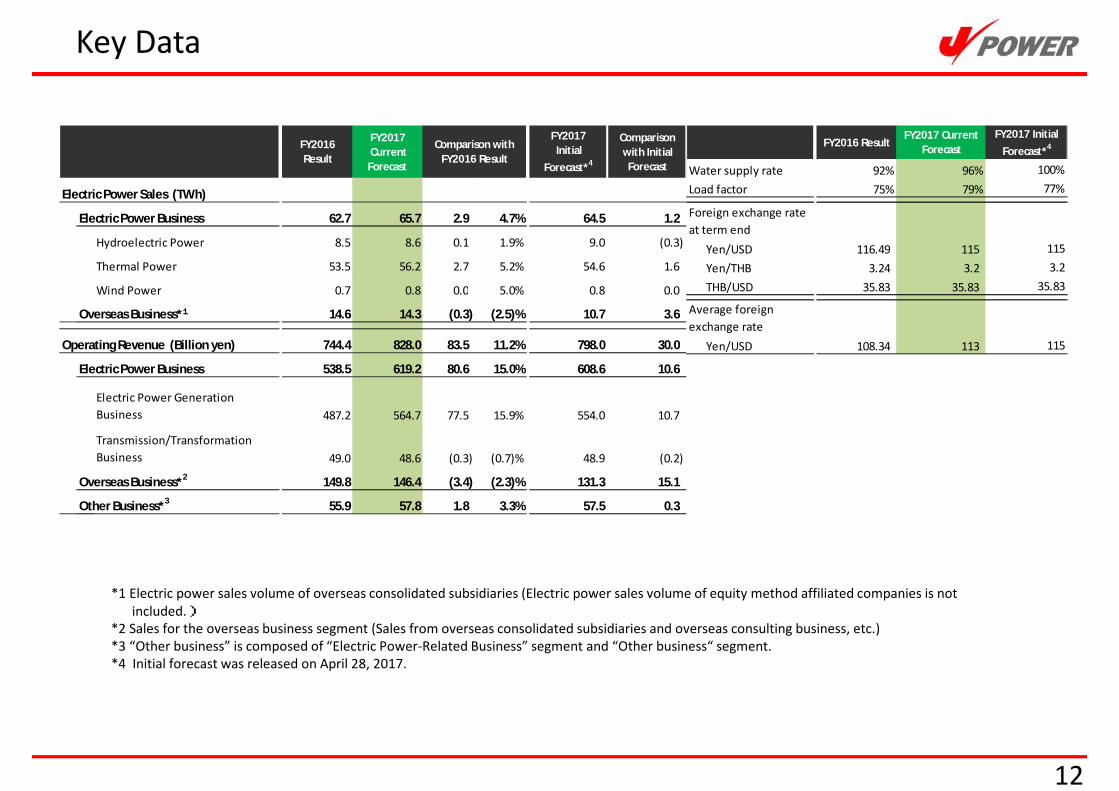
*1 Electric power sales volume of overseas consolidated subsidiaries (Electric power sales volume of equity method affiliated companies is not included.)
*2 Sales for the overseas business segment (Sales from overseas consolidated subsidiaries and overseas consulting business, etc.)*3 “Other business” is composed of “Electric Power-Related Business” segment and “Other business“ segment. *4 Initial forecast was released on April 28, 2017.
Electric Power Sales (TWh)
Electric Power Business 62.7 65.7 64.5 1.2
Hydroelectric Power 8.5 8.6 9.0 (0.3)
Thermal Power 53.5 56.2 54.6 1.6
Wind Power 0.7 0.8 0.8 0.0
Overseas Business*¹ 14.6 14.3 10.7 3.6
Operating Revenue (Billion yen) 744.4 828.0 798.0 30.0
Electric Power Business 538.5 619.2 608.6 10.6
487.2 564.7 554.0 10.7
49.0 48.6 48.9 (0.2)
Overseas Business*2 149.8 146.4 131.3 15.1
Other Business*3 55.9 57.8 57.5 0.3
FY2017Initial
Forecast*4
Comparisonwith Initial
Forecast
1.8 3.3%
(3.4) (2.3)%
(0.3) (0.7)%
77.5 15.9%
80.6 15.0%
83.5 11.2%
(0.3) (2.5)%
0.0 5.0%
2.7 5.2%
0.1 1.9%
2.9 4.7%
FY2016Result
FY2017 CurrentForecast
Comparison withFY2016 Result
Electric Power GenerationBusiness
Transmission/TransformationBusiness
Water supply rate 92% 96% 100%Load factor 75% 79% 77%
Yen/USD 116.49 115 115Yen/THB 3.24 3.2 3.2THB/USD 35.83 35.83 35.83
Yen/USD 108.34 113 115
FY2017 InitialForecast*4FY2016 Result
FY2017 CurrentForecast
Foreign exchange rateat term end
Average foreignexchange rate
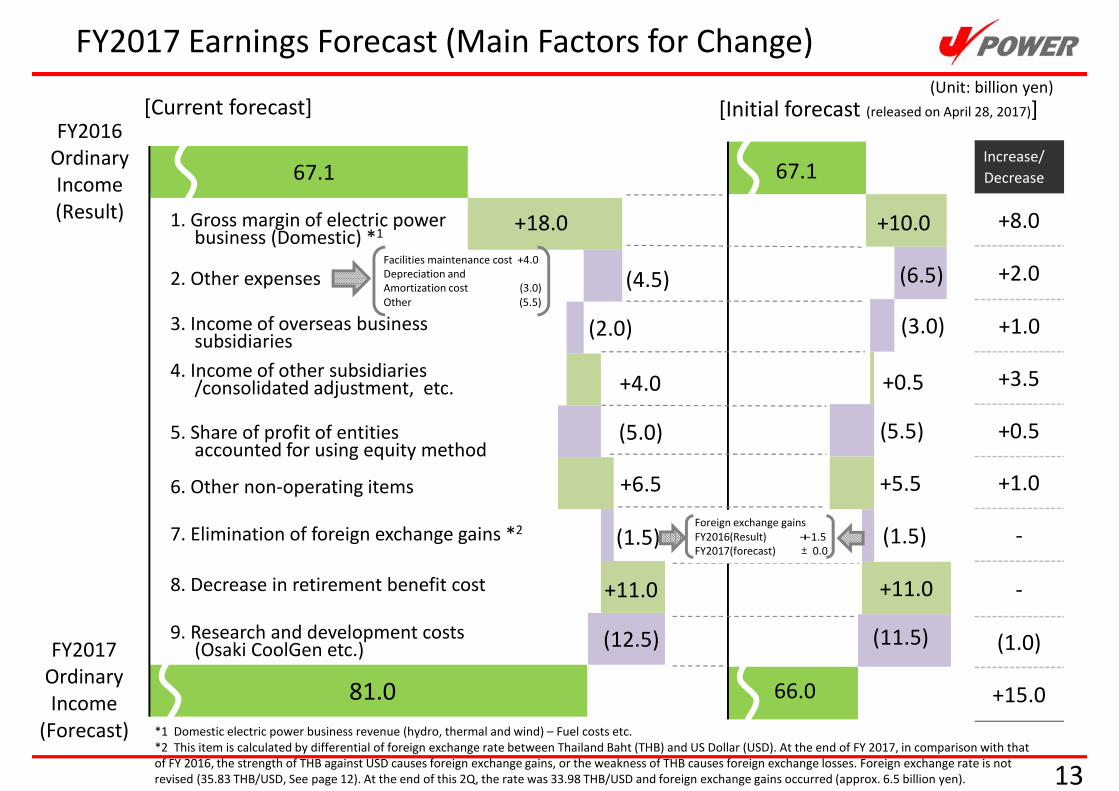
(3.0)
(6.5)
+11.0
- 10.0 20.0 30.0
FY2017OrdinaryIncome
FY2016OrdinaryIncome
81.0
(12.5)
(1.5)
+4.0
(2.0)
(4.5)
- 10.0 20.0 30.0 40.0 50.0 60.0
FY2017OrdinaryIncome
(Forecast)
FY2016OrdinaryIncome(Result)
+11.0
13
FY2017 Earnings Forecast (Main Factors for Change)
Increase/Decrease
+8.0
+2.0
+1.0
+3.5
+0.5
+1.0
-
-
(1.0)
+15.0
(Unit: billion yen)
(5.0)
+6.5
+18.0
[Current forecast] [Initial forecast (released on April 28, 2017)]
+10.0
+0.5
(5.5)
(1.5)
67.1
66.0
67.1
+5.5
(11.5)
3. Income of overseas business subsidiaries
8. Decrease in retirement benefit cost
1. Gross margin of electric power business (Domestic) *1
9. Research and development costs (Osaki CoolGen etc.)
2. Other expenses
5. Share of profit of entities accounted for using equity method
4. Income of other subsidiaries /consolidated adjustment, etc.
7. Elimination of foreign exchange gains *2
6. Other non-operating items
*1 Domestic electric power business revenue (hydro, thermal and wind) – Fuel costs etc.*2 This item is calculated by differential of foreign exchange rate between Thailand Baht (THB) and US Dollar (USD). At the end of FY 2017, in comparison with that of FY 2016, the strength of THB against USD causes foreign exchange gains, or the weakness of THB causes foreign exchange losses. Foreign exchange rate is not revised (35.83 THB/USD, See page 12). At the end of this 2Q, the rate was 33.98 THB/USD and foreign exchange gains occurred (approx. 6.5 billion yen).
Facilities maintenance cost +4.0Depreciation and Amortization cost (3.0)Other (5.5)
Foreign exchange gainsFY2016(Result) +1.5FY2017(forecast) ±0.0

APPENDIX
14
15
APPENDIX Contents
New Coal-fired Power Projects in Japan 16Ohma Nuclear Power Project 17Response to the New Safety Standards at the Ohma Nuclear Power Plant 18Overseas Projects under Development 21Osaki CoolGen Project: Demonstration Test of Oxygen- blown IGCC 23Consolidated: Revenues and Expenses 24Non-consolidated: Revenues and Expenses 25Consolidated: Segment Information 26Consolidated: Cash Flow 27Consolidated: Key Ratios and Key Data 28
Monthly Electricity Sales 29
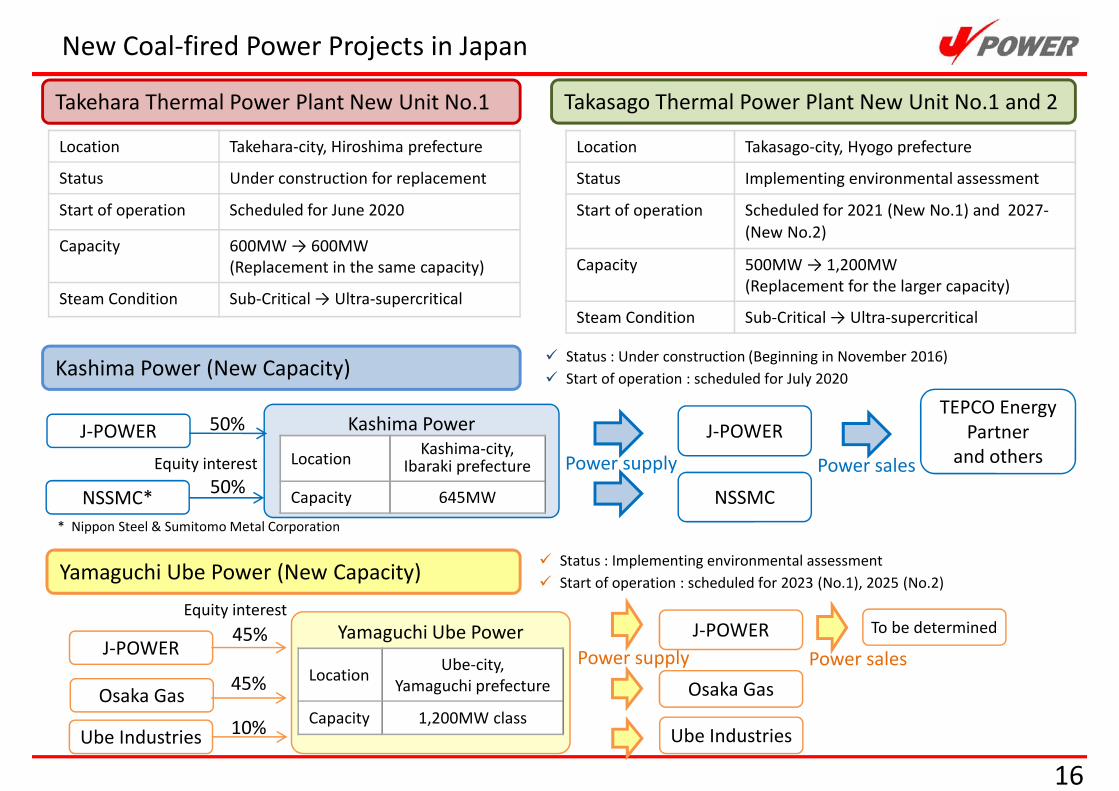
New Coal-fired Power Projects in Japan
16
Takehara Thermal Power Plant New Unit No.1
Kashima Power (New Capacity)
Yamaguchi Ube Power (New Capacity)
Status : Under construction (Beginning in November 2016) Start of operation : scheduled for July 2020
Status : Implementing environmental assessment Start of operation : scheduled for 2023 (No.1), 2025 (No.2)
Location Takehara-city, Hiroshima prefecture
Status Under construction for replacement
Start of operation Scheduled for June 2020
Capacity 600MW → 600MW(Replacement in the same capacity)
Steam Condition Sub-Critical → Ultra-supercritical
Takasago Thermal Power Plant New Unit No.1 and 2
Location Takasago-city, Hyogo prefecture
Status Implementing environmental assessment
Start of operation Scheduled for 2021 (New No.1) and 2027-(New No.2)
Capacity 500MW → 1,200MW(Replacement for the larger capacity)
Steam Condition Sub-Critical → Ultra-supercritical
Yamaguchi Ube PowerJ-POWER
Osaka GasLocation Ube-city,
Yamaguchi prefecture
Capacity 1,200MW class
J-POWER
Osaka Gas
To be determined
Ube Industries
45%
45%
10% Ube Industries
Power supply Power sales
Kashima PowerJ-POWER
NSSMC*
Location Kashima-city, Ibaraki prefecture
Capacity 645MW
Equity interest
J-POWER
NSSMC
Power supply
TEPCO Energy Partner
and othersPower sales
50%
50%
* Nippon Steel & Sumitomo Metal Corporation
Equity interest
17
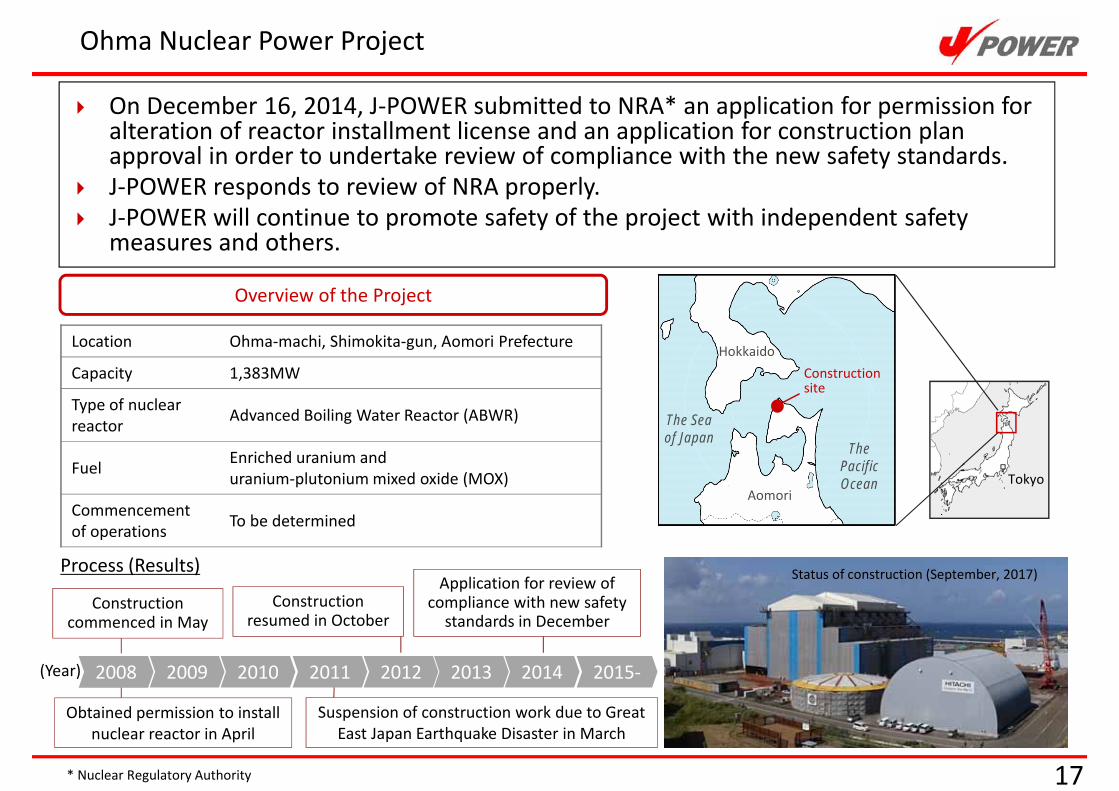
On December 16, 2014, J-POWER submitted to NRA* an application for permission for alteration of reactor installment license and an application for construction plan approval in order to undertake review of compliance with the new safety standards.
J-POWER responds to review of NRA properly. J-POWER will continue to promote safety of the project with independent safety
measures and others.
Location Ohma-machi, Shimokita-gun, Aomori Prefecture
Capacity 1,383MW
Type of nuclear reactor Advanced Boiling Water Reactor (ABWR)
Fuel Enriched uranium anduranium-plutonium mixed oxide (MOX)
Commencement of operations To be determined
Tokyo
The Pacific Ocean
The Sea of Japan
Status of construction (September, 2017)
Aomori
Hokkaido
Overview of the Project
Process (Results)
Construction commenced in May
Suspension of construction work due to Great East Japan Earthquake Disaster in March
Construction resumed in October
(Year)
Obtained permission to install nuclear reactor in April
Construction site
2008 2009 2010 2011 2012 2013 2014 2015-
Application for review of compliance with new safety
standards in December
* Nuclear Regulatory Authority
Ohma Nuclear Power Project
18建設状況 (2013年1月現在)
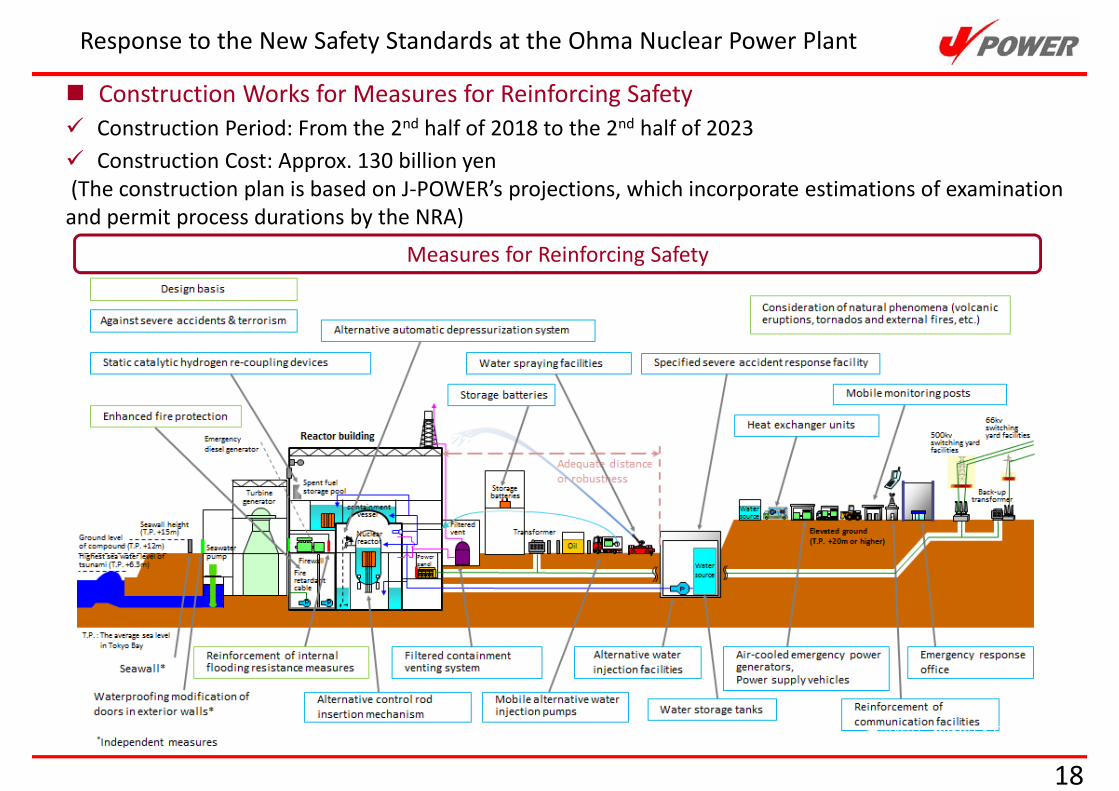
Measures for Reinforcing Safety
Construction Works for Measures for Reinforcing Safety Construction Period: From the 2nd half of 2018 to the 2nd half of 2023 Construction Cost: Approx. 130 billion yen (The construction plan is based on J-POWER’s projections, which incorporate estimations of examination and permit process durations by the NRA)
Response to the New Safety Standards at the Ohma Nuclear Power Plant
19
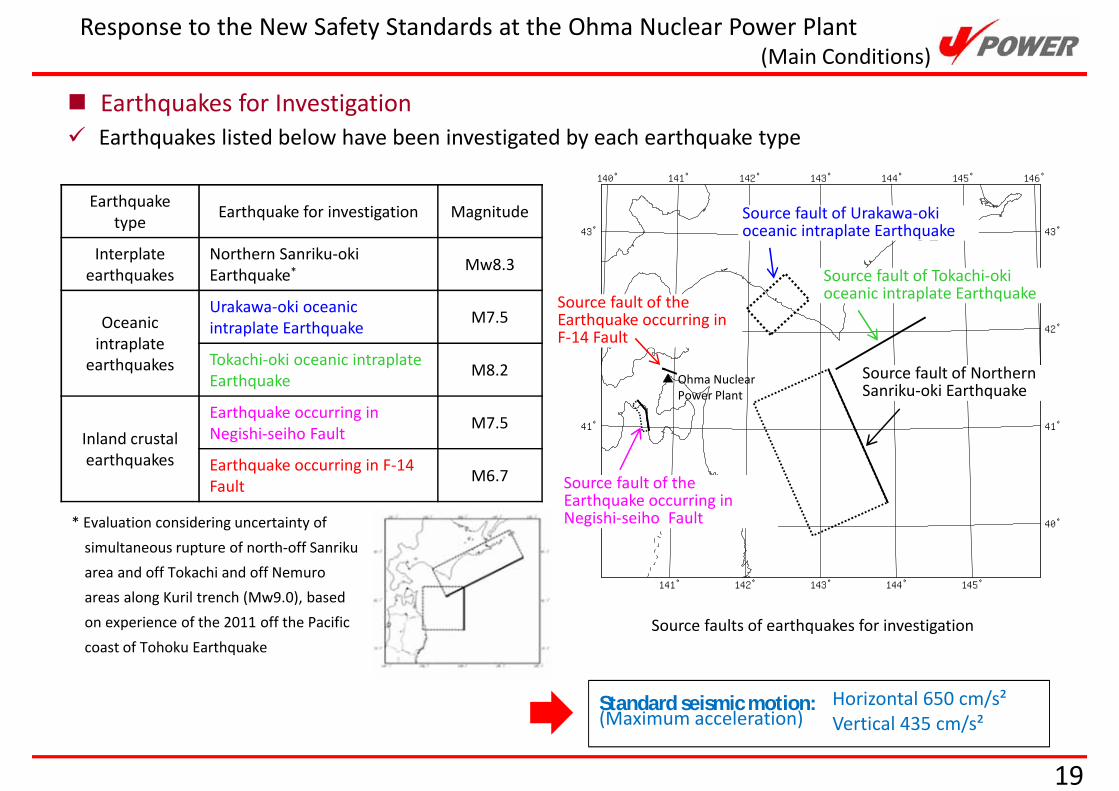
Earthquakes for Investigation Earthquakes listed below have been investigated by each earthquake type
Earthquake type Earthquake for investigation Magnitude
Interplateearthquakes
Northern Sanriku-okiEarthquake* Mw8.3
Oceanic intraplate
earthquakes
Urakawa-oki oceanic intraplate Earthquake M7.5
Tokachi-oki oceanic intraplateEarthquake M8.2
Inland crustal earthquakes
Earthquake occurring in Negishi-seiho Fault M7.5
Earthquake occurring in F-14 Fault M6.7
* Evaluation considering uncertainty of simultaneous rupture of north-off Sanrikuarea and off Tokachi and off Nemuroareas along Kuril trench (Mw9.0), based on experience of the 2011 off the Pacific coast of Tohoku Earthquake
140゚
141゚
141゚
142゚
142゚
143゚
143゚
144゚
144゚
145゚
145゚ 146゚
40゚ 40゚
41゚ 41゚
42゚ 42゚
43゚ 43゚
Source faults of earthquakes for investigation
Source fault of Urakawa-okioceanic intraplate Earthquake
Source fault of Tokachi-okioceanic intraplate Earthquake
Source fault of Northern Sanriku-oki Earthquake
Source fault of the Earthquake occurring in Negishi-seiho Fault
Source fault of the Earthquake occurring in F-14 Fault
Ohma Nuclear Power Plant
Standard seismic motion:(Maximum acceleration)
Horizontal 650 cm/s²Vertical 435 cm/s²
Response to the New Safety Standards at the Ohma Nuclear Power Plant (Main Conditions)
20
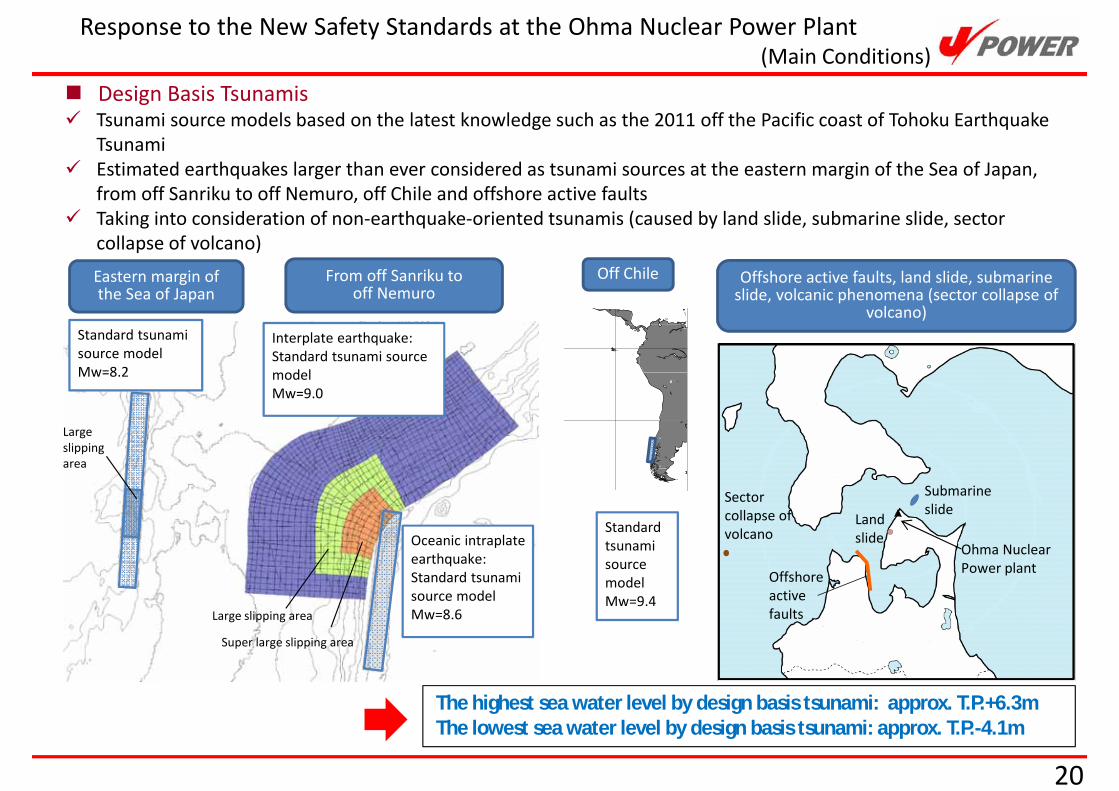
Design Basis Tsunamis Tsunami source models based on the latest knowledge such as the 2011 off the Pacific coast of Tohoku Earthquake
Tsunami Estimated earthquakes larger than ever considered as tsunami sources at the eastern margin of the Sea of Japan,
from off Sanriku to off Nemuro, off Chile and offshore active faults Taking into consideration of non-earthquake-oriented tsunamis (caused by land slide, submarine slide, sector
collapse of volcano)Eastern margin of the Sea of Japan
From off Sanriku to off Nemuro
Standard tsunami source modelMw=8.2
Large slipping area
Interplate earthquake:Standard tsunami source modelMw=9.0
Oceanic intraplateearthquake:Standard tsunami source modelMw=8.6Large slipping area
Super large slipping area
Off Chile
Land slide
Submarine slide
Offshore active faults
Offshore active faults, land slide, submarine slide, volcanic phenomena (sector collapse of
volcano)
Sector collapse of volcanoStandard
tsunami source modelMw=9.4
The highest sea water level by design basis tsunami: approx. T.P.+6.3mThe lowest sea water level by design basis tsunami: approx. T.P.-4.1m
Response to the New Safety Standards at the Ohma Nuclear Power Plant (Main Conditions)
Ohma Nuclear Power plant
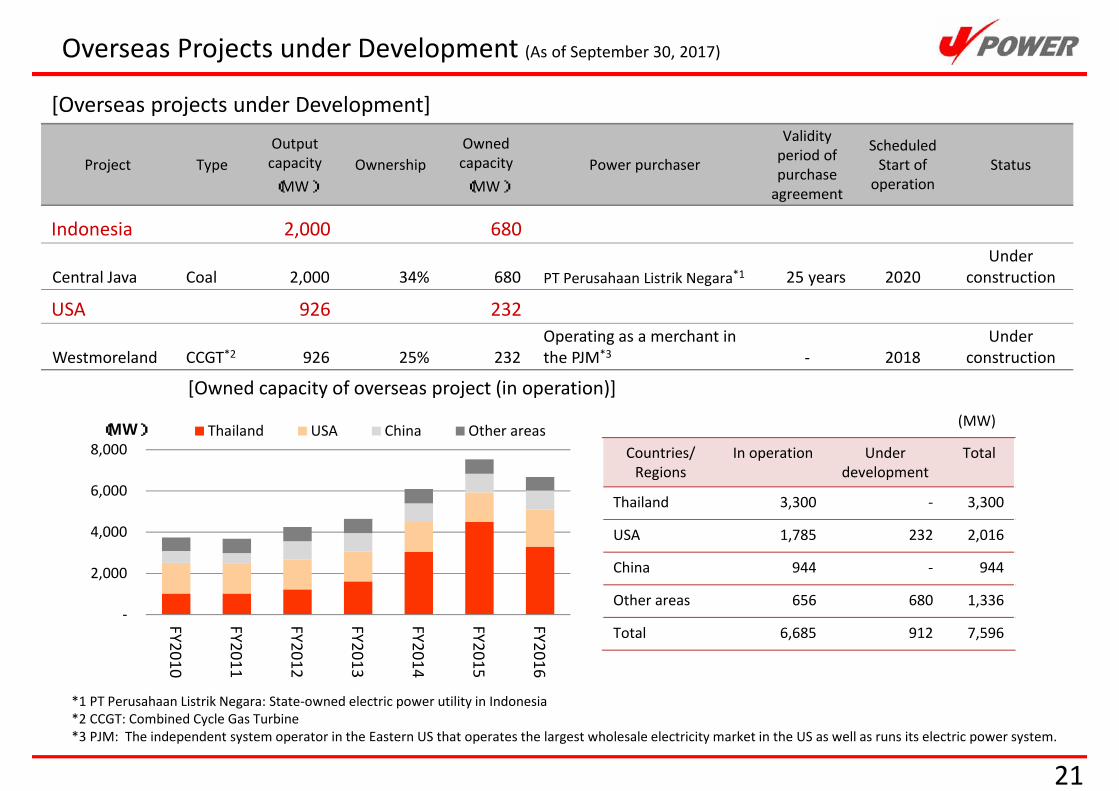
Overseas Projects under Development (As of September 30, 2017)
21
[Owned capacity of overseas project (in operation)]
-
2,000
4,000
6,000
8,000
FY2010
FY2011
FY2012
FY2013
FY2014
FY2015
FY2016
(MW) Thailand USA China Other areasCountries/
RegionsIn operation Under
developmentTotal
Thailand 3,300 - 3,300
USA 1,785 232 2,016
China 944 - 944
Other areas 656 680 1,336
Total 6,685 912 7,596
(MW)
Project TypeOutput capacity(MW)
OwnershipOwned capacity(MW)
Power purchaser
Validity period of purchase
agreement
Scheduled Start of
operationStatus
Indonesia 2,000 680
Central Java Coal 2,000 34% 680 PT Perusahaan Listrik Negara*1 25 years 2020Under
construction
USA 926 232
Westmoreland CCGT*2 926 25% 232Operating as a merchant in the PJM*3 - 2018
Under construction
[Overseas projects under Development]
*1 PT Perusahaan Listrik Negara: State-owned electric power utility in Indonesia *2 CCGT: Combined Cycle Gas Turbine*3 PJM: The independent system operator in the Eastern US that operates the largest wholesale electricity market in the US as well as runs its electric power system.
22
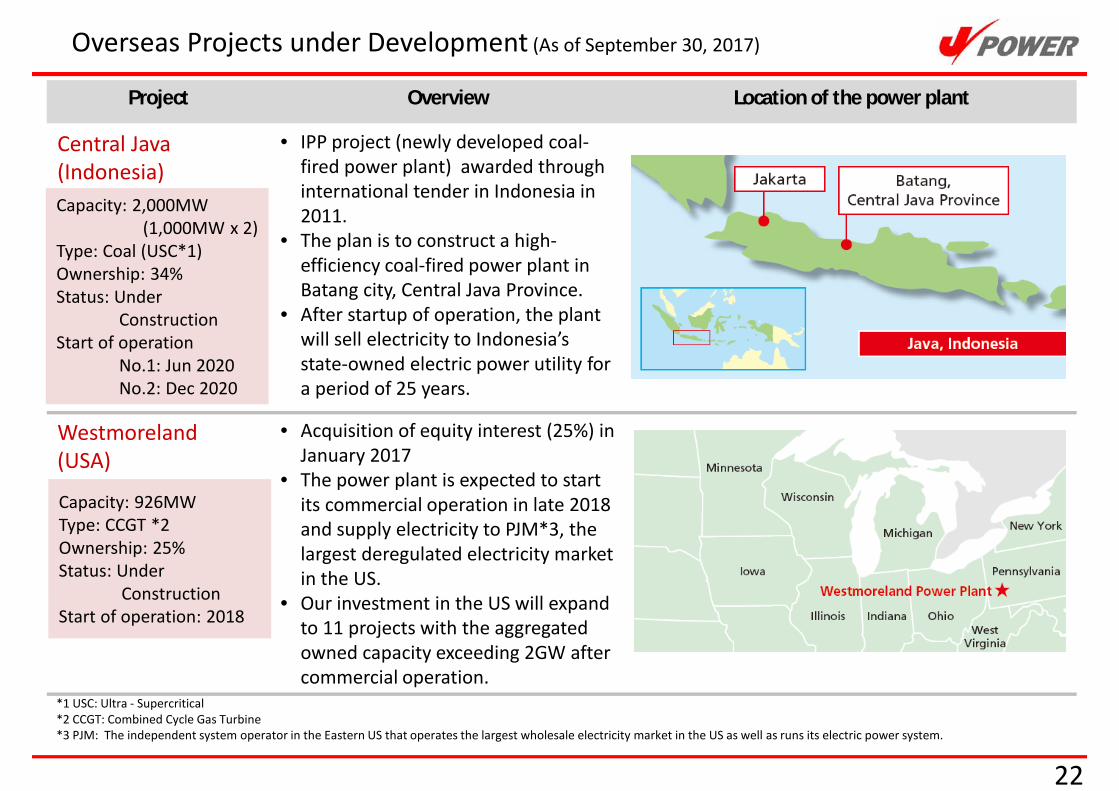
Project Overview Location of the power plant
Central Java(Indonesia)
• IPP project (newly developed coal-fired power plant) awarded through international tender in Indonesia in 2011.
• The plan is to construct a high-efficiency coal-fired power plant in Batang city, Central Java Province.
• After startup of operation, the plant will sell electricity to Indonesia’s state-owned electric power utility for a period of 25 years.
Westmoreland(USA)
• Acquisition of equity interest (25%) in January 2017
• The power plant is expected to start its commercial operation in late 2018 and supply electricity to PJM*3, the largest deregulated electricity market in the US.
• Our investment in the US will expand to 11 projects with the aggregated owned capacity exceeding 2GW after commercial operation.
*1 USC: Ultra - Supercritical*2 CCGT: Combined Cycle Gas Turbine*3 PJM: The independent system operator in the Eastern US that operates the largest wholesale electricity market in the US as well as runs its electric power system.
Overseas Projects under Development (As of September 30, 2017)
Capacity: 2,000MW(1,000MW x 2)
Type: Coal (USC*1)Ownership: 34%Status: Under
ConstructionStart of operation
No.1: Jun 2020No.2: Dec 2020
Capacity: 926MWType: CCGT *2Ownership: 25%Status: Under
ConstructionStart of operation: 2018
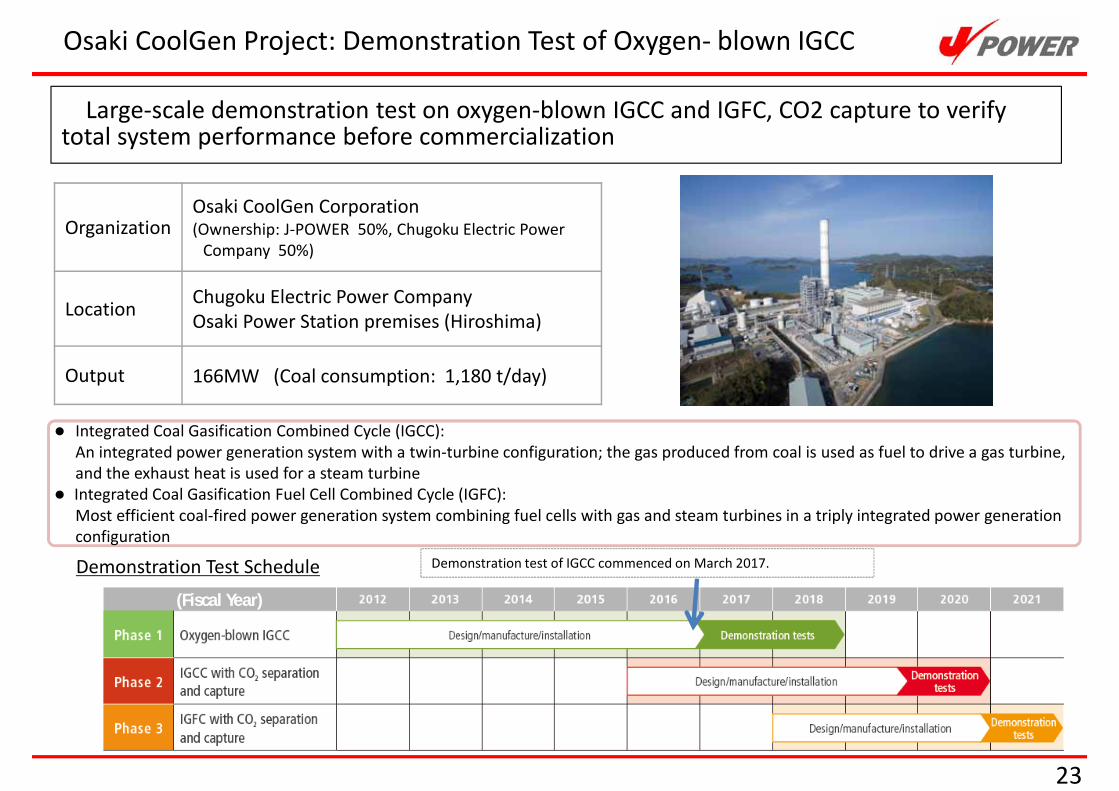
Osaki CoolGen Project: Demonstration Test of Oxygen- blown IGCC
23
Large-scale demonstration test on oxygen-blown IGCC and IGFC, CO2 capture to verify total system performance before commercialization
OrganizationOsaki CoolGen Corporation(Ownership: J-POWER 50%, Chugoku Electric Power
Company 50%)
Location Chugoku Electric Power Company Osaki Power Station premises (Hiroshima)
Output 166MW (Coal consumption: 1,180 t/day)
(Fiscal Year)
Demonstration Test Schedule Demonstration test of IGCC commenced on March 2017.
Architecture rendering
Integrated Coal Gasification Combined Cycle (IGCC): An integrated power generation system with a twin-turbine configuration; the gas produced from coal is used as fuel to drive a gas turbine, and the exhaust heat is used for a steam turbine
Integrated Coal Gasification Fuel Cell Combined Cycle (IGFC):Most efficient coal-fired power generation system combining fuel cells with gas and steam turbines in a triply integrated power generation configuration
24
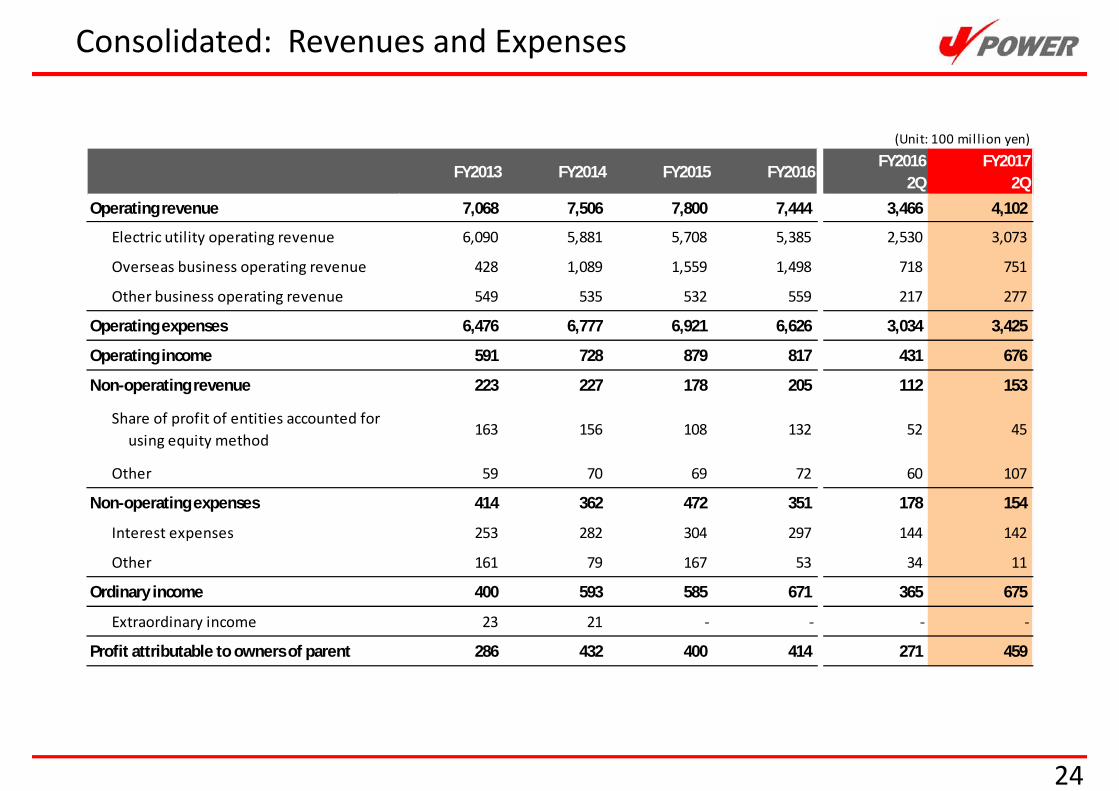
Consolidated: Revenues and Expenses
(Unit: 100 mil lion yen)
FY2013 FY2014 FY2015 FY2016FY2016
2QFY2017
2QOperating revenue 7,068 7,506 7,800 7,444 3,466 4,102
Electric utility operating revenue 6,090 5,881 5,708 5,385 2,530 3,073
Overseas business operating revenue 428 1,089 1,559 1,498 718 751
Other business operating revenue 549 535 532 559 217 277
Operating expenses 6,476 6,777 6,921 6,626 3,034 3,425
Operating income 591 728 879 817 431 676
Non-operating revenue 223 227 178 205 112 153
Share of profit of entities accounted for using equity method
163 156 108 132 52 45
Other 59 70 69 72 60 107
Non-operating expenses 414 362 472 351 178 154
Interest expenses 253 282 304 297 144 142
Other 161 79 167 53 34 11
Ordinary income 400 593 585 671 365 675
Extraordinary income 23 21 - - - -
Profit attributable to owners of parent 286 432 400 414 271 459
25
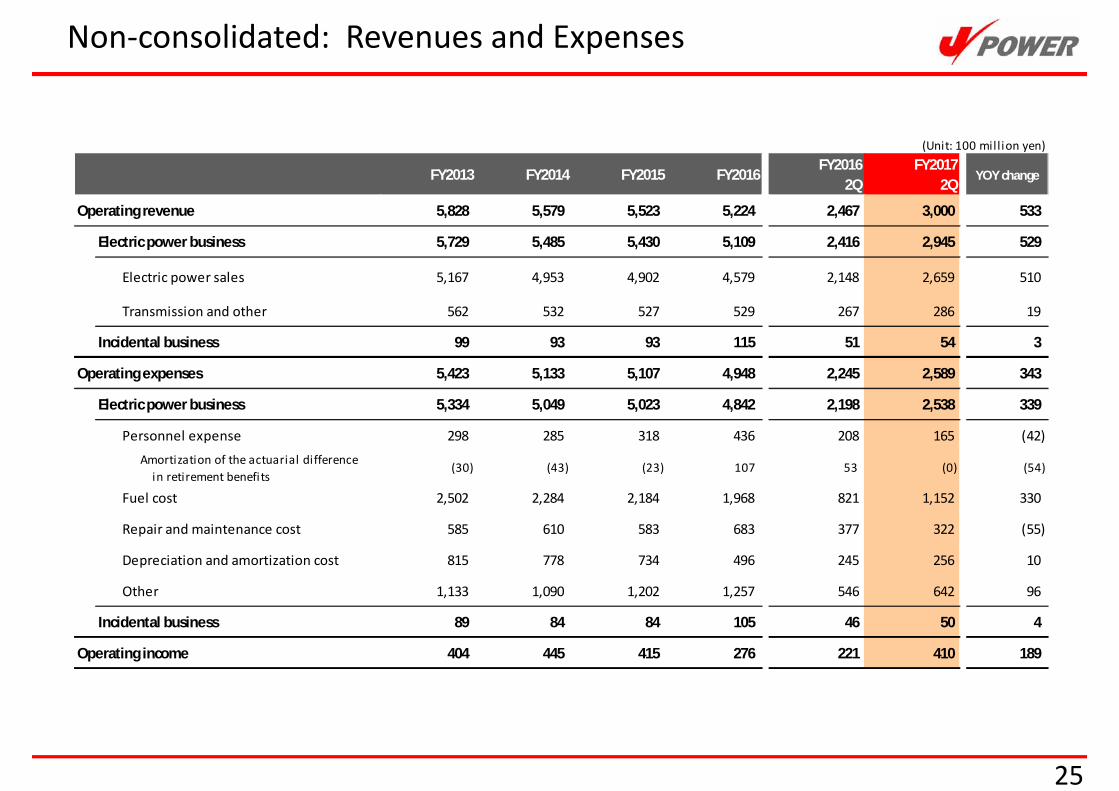
Non-consolidated: Revenues and Expenses
(Unit: 100 mill ion yen)
FY2013 FY2014 FY2015 FY2016FY2016
2QFY2017
2QYOY change
Operating revenue 5,828 5,579 5,523 5,224 2,467 3,000 533
Electric power business 5,729 5,485 5,430 5,109 2,416 2,945 529
Electric power sales 5,167 4,953 4,902 4,579 2,148 2,659 510
Transmission and other 562 532 527 529 267 286 19
Incidental business 99 93 93 115 51 54 3
Operating expenses 5,423 5,133 5,107 4,948 2,245 2,589 343
Electric power business 5,334 5,049 5,023 4,842 2,198 2,538 339
Personnel expense 298 285 318 436 208 165 (42) Amortization of the actuarial difference in retirement benefits
(30) (43) (23) 107 53 (0) (54)
Fuel cost 2,502 2,284 2,184 1,968 821 1,152 330
Repair and maintenance cost 585 610 583 683 377 322 (55)
Depreciation and amortization cost 815 778 734 496 245 256 10
Other 1,133 1,090 1,202 1,257 546 642 96
Incidental business 89 84 84 105 46 50 4
Operating income 404 445 415 276 221 410 189
26
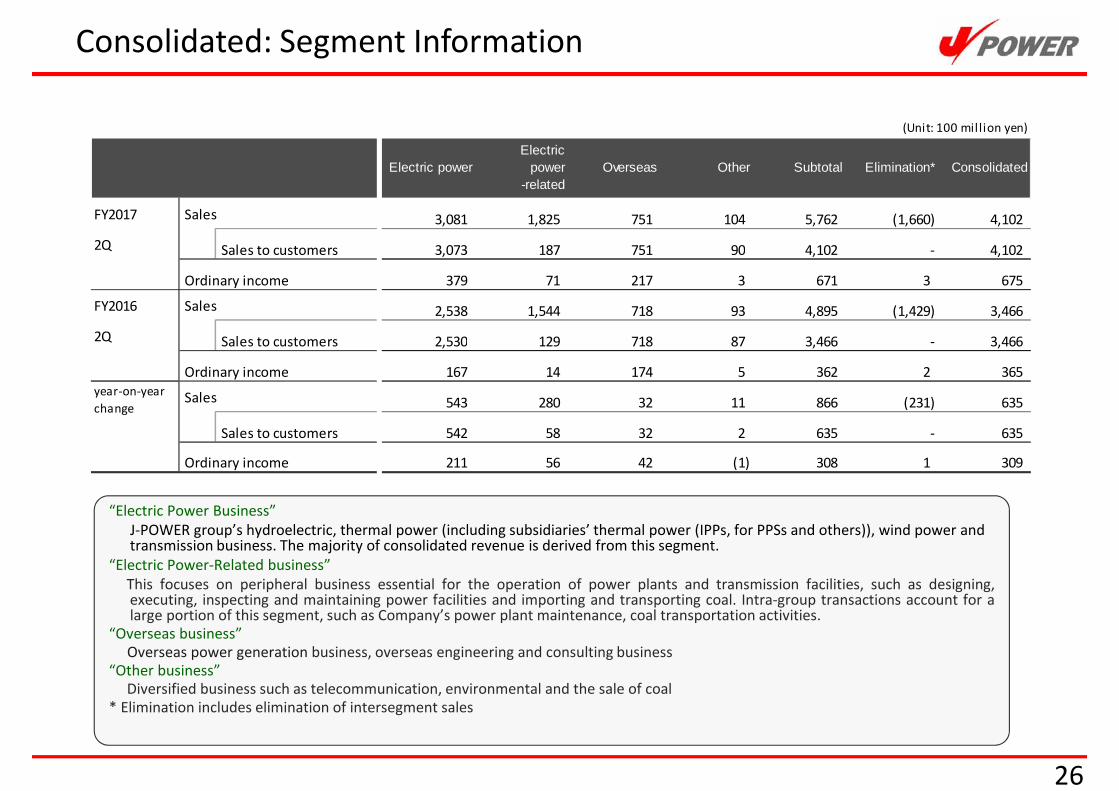
Consolidated: Segment Information
“Electric Power Business”J-POWER group’s hydroelectric, thermal power (including subsidiaries’ thermal power (IPPs, for PPSs and others)), wind power andtransmission business. The majority of consolidated revenue is derived from this segment.
“Electric Power-Related business”This focuses on peripheral business essential for the operation of power plants and transmission facilities, such as designing,executing, inspecting and maintaining power facilities and importing and transporting coal. Intra-group transactions account for alarge portion of this segment, such as Company’s power plant maintenance, coal transportation activities.
“Overseas business”Overseas power generation business, overseas engineering and consulting business
“Other business”Diversified business such as telecommunication, environmental and the sale of coal
* Elimination includes elimination of intersegment sales
(Unit: 100 mil lion yen)
Electric powerElectric
power-related
Overseas Other Subtotal Elimination* Consolidated
FY2017 Sales 3,081 1,825 751 104 5,762 (1,660) 4,102
2Q Sales to customers 3,073 187 751 90 4,102 - 4,102
Ordinary income 379 71 217 3 671 3 675
FY2016 Sales 2,538 1,544 718 93 4,895 (1,429) 3,466
2Q Sales to customers 2,530 129 718 87 3,466 - 3,466
Ordinary income 167 14 174 5 362 2 365
Sales 543 280 32 11 866 (231) 635
Sales to customers 542 58 32 2 635 - 635
Ordinary income 211 56 42 (1) 308 1 309
year-on-yearchange
27
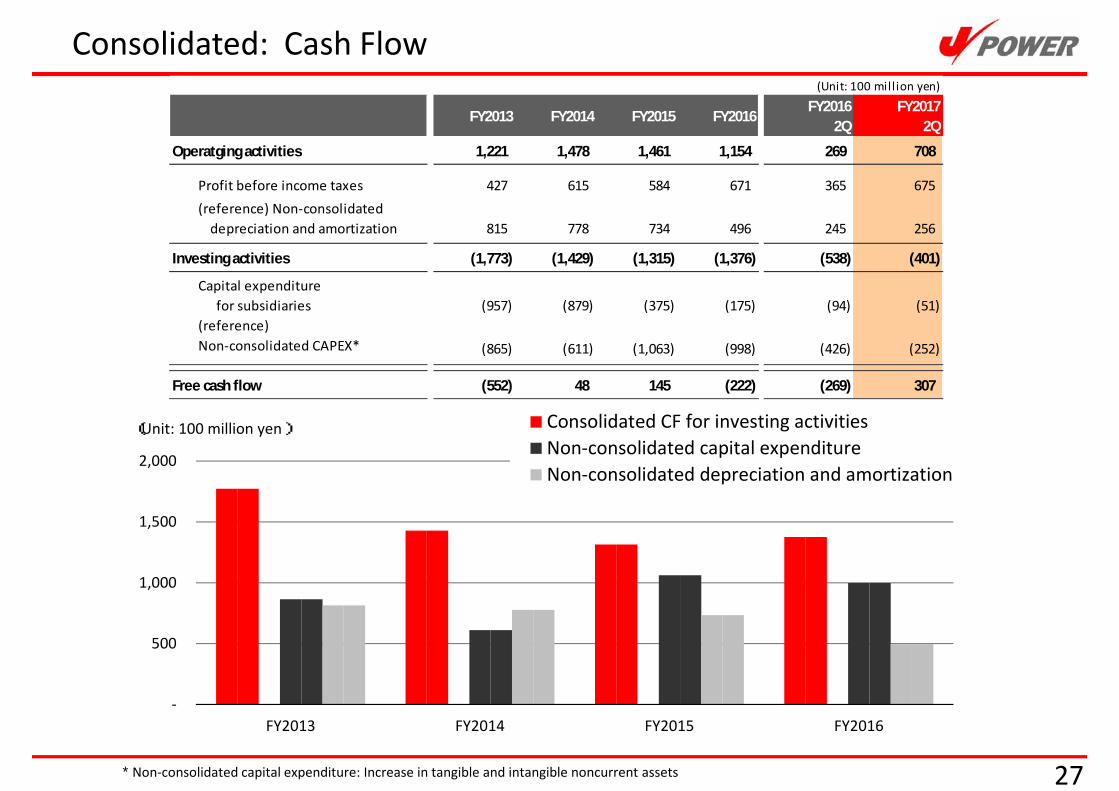
Consolidated: Cash Flow
-
500
1,000
1,500
2,000
FY2013 FY2014 FY2015 FY2016
(Unit: 100 million yen) Consolidated CF for investing activitiesNon-consolidated capital expenditureNon-consolidated depreciation and amortization
* Non-consolidated capital expenditure: Increase in tangible and intangible noncurrent assets
(Unit: 100 mill ion yen)
FY2013 FY2014 FY2015 FY2016FY2016
2QFY2017
2Q
Operatging activities 1,221 1,478 1,461 1,154 269 708
Profit before income taxes 427 615 584 671 365 675(reference) Non-consolidated depreciation and amortization 815 778 734 496 245 256
Investing activities (1,773) (1,429) (1,315) (1,376) (538) (401)
Capital expenditure for subsidiaries (957) (879) (375) (175) (94) (51)(reference)Non-consolidated CAPEX* (865) (611) (1,063) (998) (426) (252)
Free cash flow (552) 48 145 (222) (269) 307
28
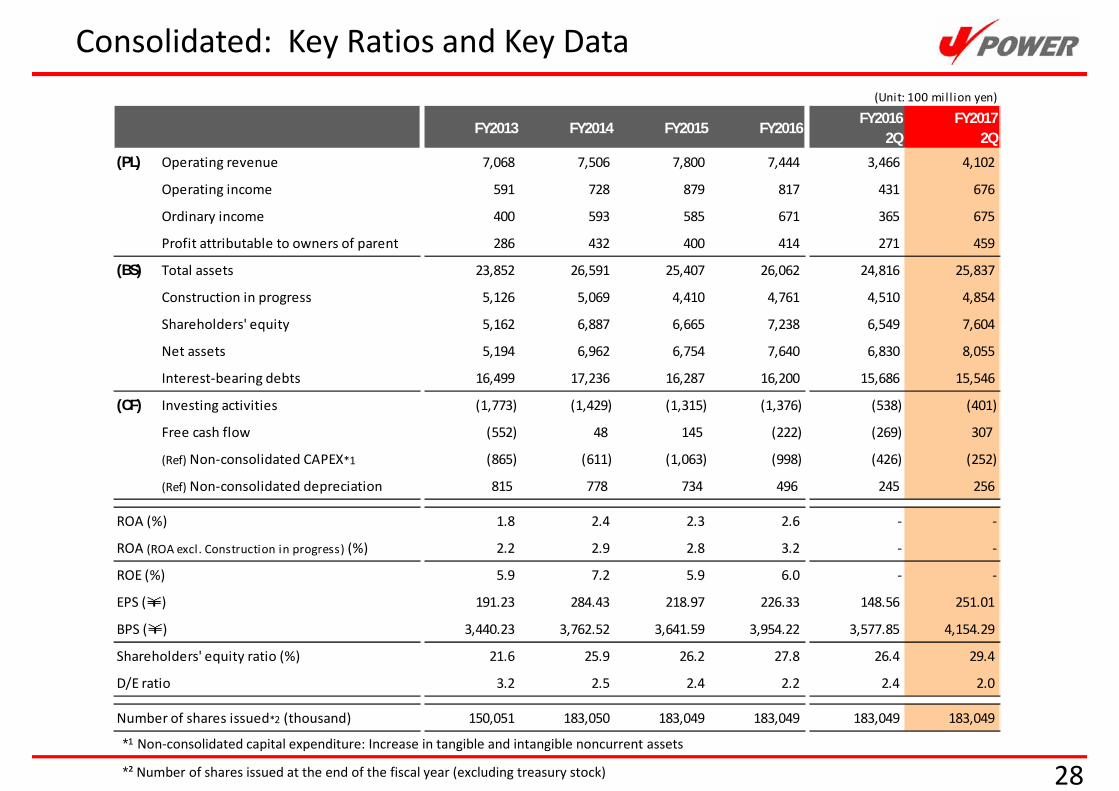
Consolidated: Key Ratios and Key Data
*¹ Non-consolidated capital expenditure: Increase in tangible and intangible noncurrent assets
*² Number of shares issued at the end of the fiscal year (excluding treasury stock)
(Unit: 100 mill ion yen)
FY2013 FY2014 FY2015 FY2016FY2016
2QFY2017
2Q
(PL) Operating revenue 7,068 7,506 7,800 7,444 3,466 4,102
Operating income 591 728 879 817 431 676
Ordinary income 400 593 585 671 365 675
Profit attributable to owners of parent 286 432 400 414 271 459
(BS) Total assets 23,852 26,591 25,407 26,062 24,816 25,837
Construction in progress 5,126 5,069 4,410 4,761 4,510 4,854
Shareholders' equity 5,162 6,887 6,665 7,238 6,549 7,604
Net assets 5,194 6,962 6,754 7,640 6,830 8,055
Interest-bearing debts 16,499 17,236 16,287 16,200 15,686 15,546
(CF) Investing activities (1,773) (1,429) (1,315) (1,376) (538) (401)
Free cash flow (552) 48 145 (222) (269) 307
(Ref) Non-consolidated CAPEX*1 (865) (611) (1,063) (998) (426) (252)
(Ref) Non-consolidated depreciation 815 778 734 496 245 256
ROA (%) 1.8 2.4 2.3 2.6 - -
ROA (ROA excl. Construction in progress) (%) 2.2 2.9 2.8 3.2 - -
ROE (%) 5.9 7.2 5.9 6.0 - -
EPS (¥) 191.23 284.43 218.97 226.33 148.56 251.01
BPS (¥) 3,440.23 3,762.52 3,641.59 3,954.22 3,577.85 4,154.29
Shareholders' equity ratio (%) 21.6 25.9 26.2 27.8 26.4 29.4
D/E ratio 3.2 2.5 2.4 2.2 2.4 2.0
Number of shares issued*2 (thousand) 150,051 183,050 183,049 183,049 183,049 183,049
29
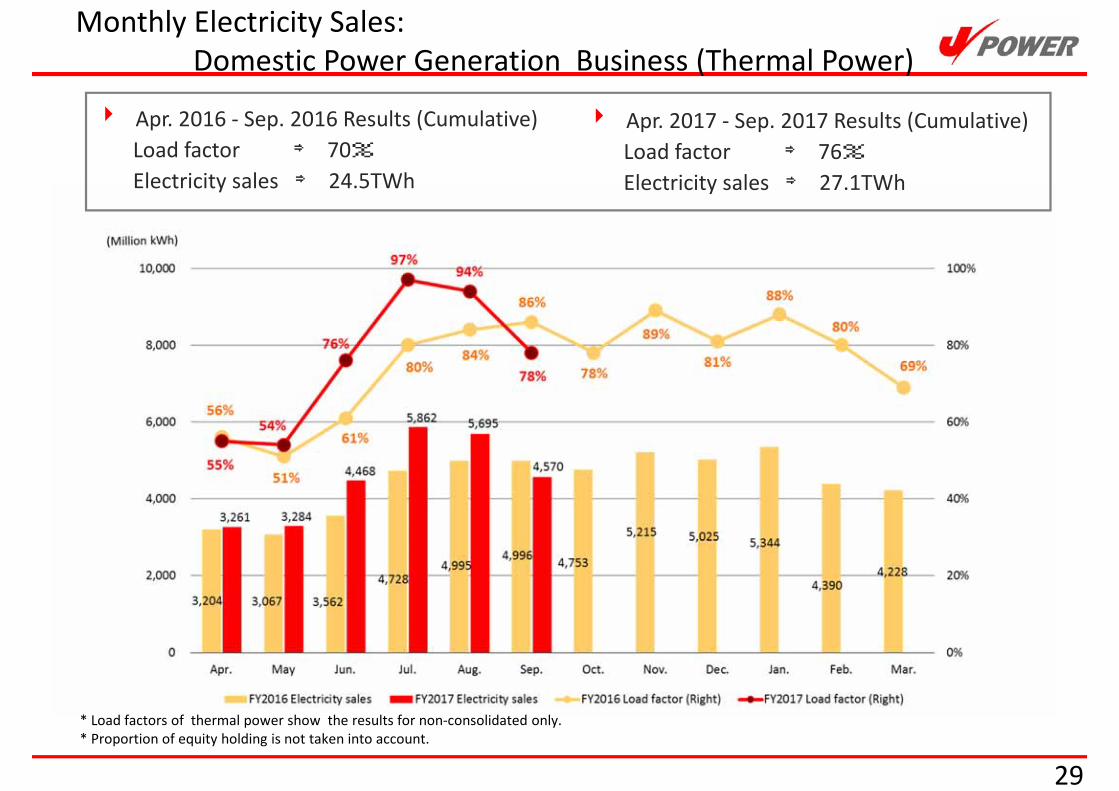
Monthly Electricity Sales: Domestic Power Generation Business (Thermal Power)
Apr. 2016 - Sep. 2016 Results (Cumulative)Load factor ⇒ 70%Electricity sales ⇒ 24.5TWh
Apr. 2017 - Sep. 2017 Results (Cumulative)Load factor ⇒ 76%Electricity sales ⇒ 27.1TWh
* Load factors of thermal power show the results for non-consolidated only.* Proportion of equity holding is not taken into account.
30
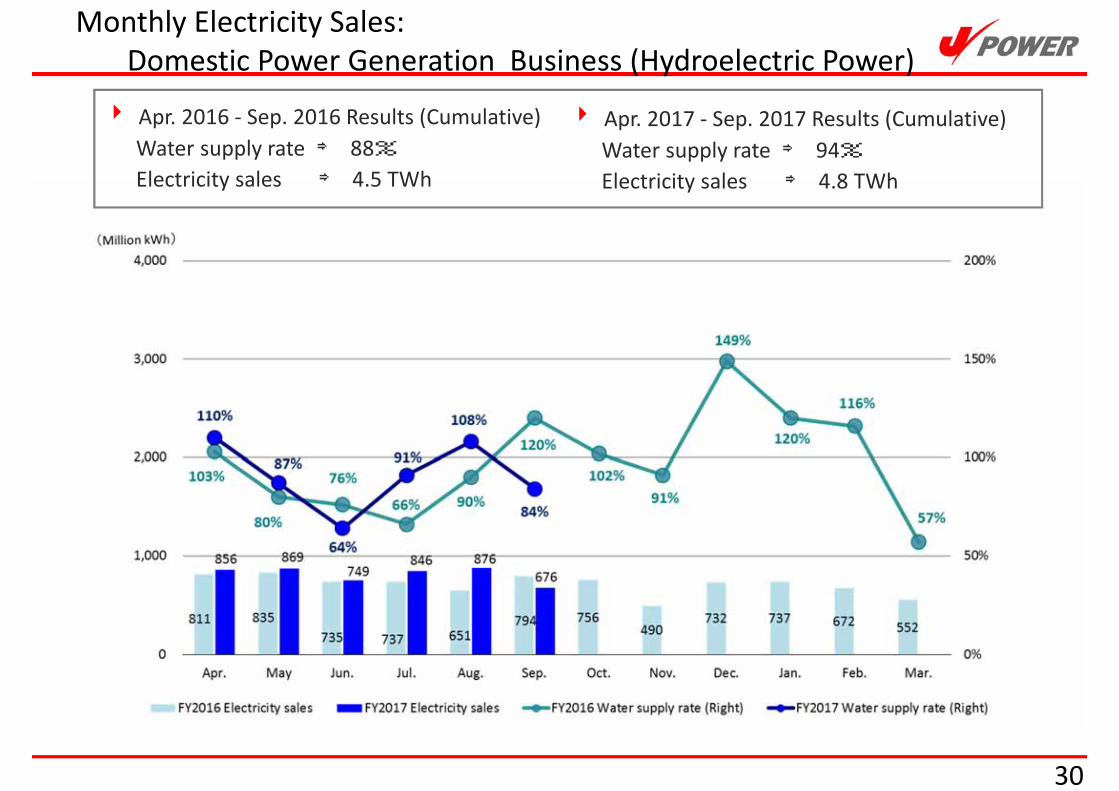
Monthly Electricity Sales: Domestic Power Generation Business (Hydroelectric Power)
Apr. 2016 - Sep. 2016 Results (Cumulative)Water supply rate ⇒ 88%Electricity sales ⇒ 4.5 TWh
Apr. 2017 - Sep. 2017 Results (Cumulative)Water supply rate ⇒ 94%Electricity sales ⇒ 4.8 TWh
31
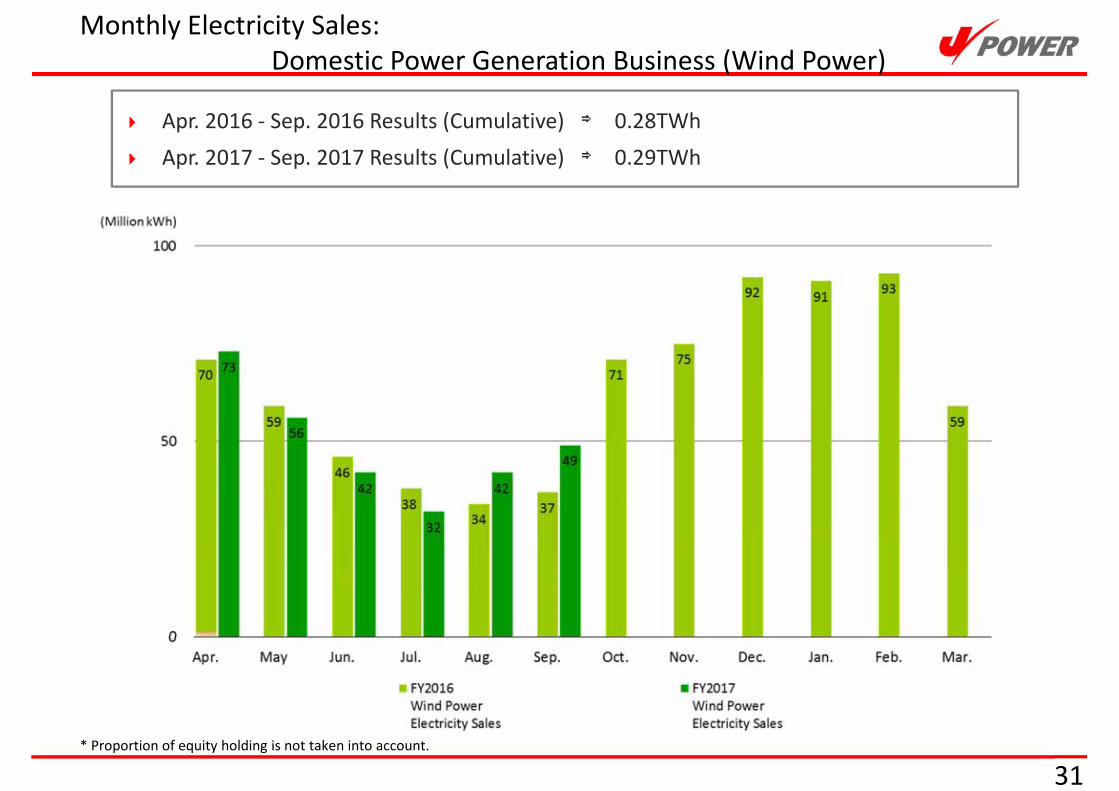
Monthly Electricity Sales: Domestic Power Generation Business (Wind Power)
Apr. 2016 - Sep. 2016 Results (Cumulative) ⇒ 0.28TWh Apr. 2017 - Sep. 2017 Results (Cumulative) ⇒ 0.29TWh
* Proportion of equity holding is not taken into account.
32
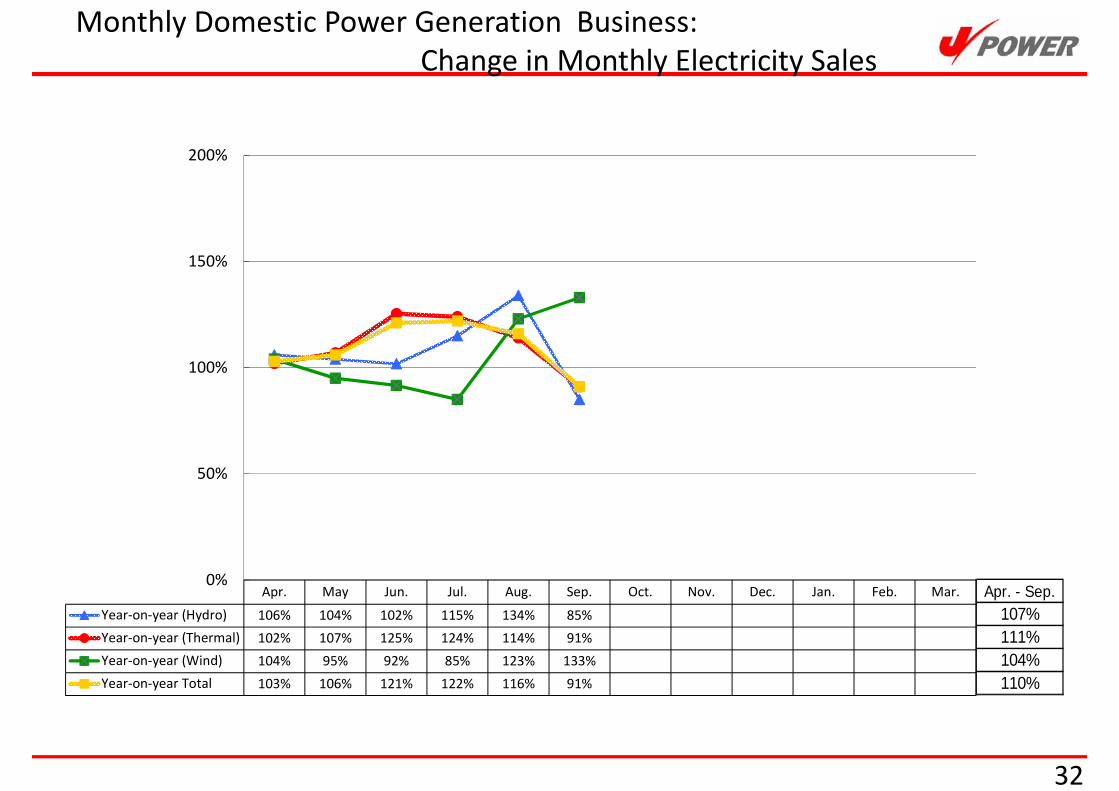
Monthly Domestic Power Generation Business: Change in Monthly Electricity Sales
Apr. May Jun. Jul. Aug. Sep. Oct. Nov. Dec. Jan. Feb. Mar.Year-on-year (Hydro) 106% 104% 102% 115% 134% 85%Year-on-year (Thermal) 102% 107% 125% 124% 114% 91%Year-on-year (Wind) 104% 95% 92% 85% 123% 133%Year-on-year Total 103% 106% 121% 122% 116% 91%
0%
50%
100%
150%
200%
Apr. - Sep.107%111%104%110%

33
電源開発株式会社電源開発株式会社
http://www.jpower.co.jp/english/