SBM-SWM Exposure Workshop Project: Process Document
108
TITLE SBM-SWM Exposure Workshop Project: Process Document PUBLISHER NATIONAL INSTITUTE OF URBAN AFFAIRS, DELHI CREDITS Dr. Shyamala Krishna Mani, Team Leader Swachh Bharat Mission Solid Waste Management Exposure Workshops Project 2016-2019 Prof. R.J Masilamani, BIMTECH, Greater Noida Ms. Paramita Datta Dey, Sr. Research Officer & Project Coordinator Swachh Bharat Mission Solid Waste Management Exposure Workshops Project 2018-19 Project Associate: Kaustubh Parihar Research Associates: Roquaiya, Tavishi Darbari, Kisslay Anand, Poulomy Banerjee, Umra Anees Intern: Aiswarya Krishnan DISCLAIMER While every effort has been made to ensure the correctness of data/information used in this report, neither the authors nor NIUA accept any legal liability for the accuracy or inferences drawn from the material contained therein or for any consequences arising from the use of this material. No part of this report may be reproduced in any form (electronic or mechanical) without prior permission from or intimation to NIUA.
Transcript of SBM-SWM Exposure Workshop Project: Process Document

TITLE
SBM-SWM Exposure Workshop Project: Process Document
PUBLISHER
NATIONAL INSTITUTE OF URBAN AFFAIRS, DELHI
CREDITS
Dr. Shyamala Krishna Mani, Team Leader Swachh Bharat Mission Solid Waste Management Exposure Workshops Project 2016-2019
Prof. R.J Masilamani, BIMTECH, Greater Noida
Ms. Paramita Datta Dey, Sr. Research Officer & Project Coordinator Swachh Bharat Mission Solid Waste Management Exposure Workshops Project 2018-19
Project Associate: Kaustubh Parihar
Research Associates: Roquaiya, Tavishi Darbari, Kisslay Anand, Poulomy Banerjee, Umra Anees
Intern: Aiswarya Krishnan
DISCLAIMER
While every effort has been made to ensure the correctness of data/information used in this report, neither the authors nor NIUA accept any
legal liability for the accuracy or inferences drawn from the material contained therein or for any consequences arising from the use of this
material. No part of this report may be reproduced in any form (electronic or mechanical) without prior permission from or intimation to NIUA.

Solid waste management initiative in Urban India
1
Contents
1. Solid Waste Scenario in Urban India ............................................................................................................................................................................ 3
1.1 Introduction ...................................................................................................................................................................................................... 3
1.2 Significance of SWM in MDGs and SDGs........................................................................................................................................................... 4
1.3 SWM initiatives in India .................................................................................................................................................................................... 4
1.4 Exposure cum Training Programme (Phase I, Phase II and Phase III) .............................................................................................................. 8
1.5 General Format of Phase III Workshop .......................................................................................................................................................... 12
1.6 Issues and Challenges...................................................................................................................................................................................... 15
2. Approach for an Effective Solid Waste Management- Some Good Practices ......................................................................................................... 21
3. Evaluation of Efficacy of SBM-SWM Exposure Workshop ......................................................................................................................................... 27
3.1 Background ..................................................................................................................................................................................................... 27
3.2 Methodology ................................................................................................................................................................................................... 28
3.3 Results ............................................................................................................................................................................................................. 40
3.3.1 Madhya Pradesh ................................................................................................................................................................................... 40
3.3.2 Odisha ................................................................................................................................................................................................... 43
3.3.3 Jharkhand .............................................................................................................................................................................................. 47
3.3.4 Tamil Nadu ............................................................................................................................................................................................ 51
3.3.5 Telangana .............................................................................................................................................................................................. 55
3.4 Key Findings and Conclusion ........................................................................................................................................................................... 60
3.5 Limitations of Evaluation Study ...................................................................................................................................................................... 62

Solid waste management initiative in Urban India
2
4. Assessment of Training Entities ................................................................................................................................................................................. 64
5. Overall Key Findings, Recommendations and Way Forward ..................................................................................................................................... 67
6. Swachh Survekshan 2020 .......................................................................................................................................................................................... 74
7. Swachh Bharat Mission (Urban) Funds .................................................................................................................................................................... 101
Annexure
Annexure 1: Madhya Pradesh
Annexure 2: Odisha
Annexure 3: Jharkhand
Annexure 4: Tamil Nadu
Annexure 5: Telangana
Annexure 6: Madhya Pradesh calculation Sheet
Annexure 7: Impact Questionnaire 2017-18
Annexure 8: Impact Questionnaire 2018-19
Annexure 9: Glossary
Annexure 10: Workshop Monitoring Checklist
Annexure 11: Review by Training Entity

Solid waste management initiative in Urban India
3
1. SOLID WASTE SCENARIO IN URBAN INDIA
1.1 Introduction
India’s urban growth has been increasing rapidly over the last few decades. As per census of India, in 1951, India had urban growth of 17.29%,
which increased up to 31.16% in 2011. Due to urbanization and change in lifestyle, India has had to deal with increased solid waste generation.
Dealing with waste has now become a global issue, which poses a threat to public health, environment and economy. Due to increasing
population, India’s basic necessities have sometimes been ignored. Greater focus on providing water, electricity, food for growing population,
sometimes leads to negligence of services like waste management.
Solid waste management is one of the 18 functions that comes under the purview of urban local bodies. Therefore, SBM SWM Exposure
Workshop Phase III, focused on capacity building of Class I (more than 1, 00,000 population), Class II (50,000 to 99,999 population) and Class III
(20,000 to 49,999 population) cities, as they are the major waste generator in urban India.
This chapter attempts to understand importance of Solid waste management in urban India and its linkage with MDGs and SDGs. it further
explains about major initiatives on solid waste management in India, particularly MSWM Rules 2000, SWM Rules 2016 and Swachh Bharat
Mission (Urban). SBM has various components and to implement one of its component i.e. capacity building on SWM, NIUA has been conducting
SWM Exposure workshop on behalf of MoHUA since 2016. Detailed format of these workshops has been explained and in the end of this chapter
issues and challenges identified by participants (ULBs and IAF) are also discussed. Besides that, the chapter also highlights problem faced by
community due to poor waste management.

Solid waste management initiative in Urban India
4
1.2 Significance of SWM in MDGs and SDGs
It is significant that Solid waste management (SWM) is one of the important targets mentioned under Millennium Development Goals (MDG,
2000 to 2015) and Sustainable Development Goals (SDG, 2015 to 2030). Although not explicitly mentioned in MDGs but linkage between
SWM and various global concerns which were stated in the MDGs, namely, eradication of extreme poverty and hunger (MDG 1), reducing
child mortality (MDG 4), improving maternal health (MDG 5) and ensuring environmental sustainability (MDG 7) is evident. However,
Significance of proper treatment of solid waste is recognized in Sustainable Development Goals (SDGs-2015 to 2030) and it is embedded
within the 17 goals of SDGs either explicitly or implicitly. SDG 11, “Make cities and human settlements inclusive, safe, resilient and
sustainable”, explicitly discusses about SWM. Target no. 11.6 of SDG 11, says, member states decided to “by 2030, reduce the adverse per
capita environmental impact of cities, including by paying special attention to air quality and municipal and other waste management”. Waste
management has strong linkage to a range of global challenges, such as health (SDG 3), climate change (SDG 13), poverty reduction (SDG 1),
clean water and sanitation (SDG 6), food and resources security (SDG 2) and sustainable production and consumption (SDG 12). It is also
observed that, a significant proportion of the population of many large cities depends on solid waste management for their livelihood,
whether employed by formal or informal organizations for street sweeping, waste collection, waste sorting, recycling and others.
1.3 Solid Waste Management Initiatives in India
1.3.1 MSWM Rules 2000 and SWM Rules 2016
The first comprehensive solid waste management rules were passed in 2000 by Ministry of Environment, Forest and Climate Change (MoEFCC).
The rules provide detailed guidelines on various aspects of municipal solid waste management (MSWM) and identify the Central Pollution Control

Solid waste management initiative in Urban India
5
Board (CPCB) and the State Pollution Control Boards (SPCBs) as nodal agencies to monitor its implementation directly in the union territories
and the states respectively. Thereafter, 16 years later, after poor implementation led to diseases and wide scale protests (Hindustan Times 2016;
Annepu 2014; The Hindu 2012; Times of India 2016) in several states of India, the rules were revised in 2016 by the Ministry of Environment,
thus releasing the latest Solid Waste Management (SWM) Rules in 2016, to regulate effective collection and disposal of municipal solid waste in
India. Under these rules, responsibility of management of Solid Waste has been entrusted with Urban Development Departments and Urban
Local Bodies. All Municipal Corporations have been directed to prepare a Solid Waste Management Plan. Besides that, to operationalize the
SWM Rules 2016, the Ministry of Housing and Urban Affairs (MoHUA) through Central Public Health Environment Engineering Organization
(CPHEEO), published a manual in October 2016 which has incorporated the necessary specifications and actions for ULBs to implement them in
their cities.
The key features of the solid waste management rules, 2016 are:
i. A mandate for all waste generators to segregate waste, but with specific penalty on non-compliers to be announced through bye-laws
ii. A mandate for bulk generators (any institution with an area greater than 5,000 square meters) to manage their own waste, but with
penalty mentioned for non-compliance of the same to be announced through bye-laws.
iii. An extended producer responsibility on brand owners to set up a collect back scheme for managing waste produced during packaging.
iv. Promotion of options like Biomethanation, Waste to Fuel Oil, composting other than incineration are among the WTE (waste-to-energy)
plants and inclusion of Market Development Mechanisms in addition to the directive to the Department of Fertilizers to market city
compost along with chemical fertilizers.

Solid waste management initiative in Urban India
6
v. Provision for local bodies to levy waste collection fees on waste generators, with both fees and penalty on non-compliance to be
announced through bye-laws.
1.3.2 Swachh Bharat Mission (Urban), 2014
Swachh Bharat Mission (SBM) was launched on October 2nd 2014. The initiative has two thrust areas - SBM (U) and SBM (R). SBM (U) operates
under the Ministry of Housing and Urban Affairs and SBM (R) operates under the Ministry of Drinking Water and Sanitation. The key objectives
of SBM (U) are to address both elimination of open defecation and achieving solid waste management in all urban local bodies (ULBs) of India
by 2019. The mission has various components namely capacity building, construction of household toilets, where unavailable, community and
public toilets & urinals, IEC & Public awareness, Solid waste management and Open defecation free including fecal sludge management
protocols. To address primarily Solid Waste management issues, Swachh Bharat Mission launched a multipronged approach to counter the
cyclical effects of de-motivation and poor performance of ULBs by infusing enthusiasm, financial support, a feeling of accountability among ULB
staff towards cleanliness and organization of massive awareness campaigns among citizens who are the primary generators of solid waste in the
cities.
Achievement of SBM 1 (2014 - 2019) (Source: MoHUA)
Till date, urban areas of 23 states / UTs have become ODF. In all, 4,165 cities have declared themselves ODF, of which 3,620 cities have
been certified through third party verification.
This has been achieved by the construction of nearly 63.6 lakh Individual Household Toilets (against Mission target of 66 lakhs; i.e. 96%
constructed and under construction against target), and 5.2 lakh seats of community / public toilets (against Mission target of 5.08 lakh
seats; i.e. 103% constructed and under construction against target) under the Mission.

Solid waste management initiative in Urban India
7
MoHUA has launched the ODF+ and ODF++ protocols, with a focus on sustaining ODF outcomes and achieving holistic sanitation. While
ODF+ protocol focuses on O&M of community / public toilets by ensuring functionality and proper maintenance of CT/PTs for their
continued usage, ODF++ focuses on addressing safe management of fecal sludge from toilets, and ensuring that no untreated sludge is
discharged into open drains, water bodies or in the open.
Till date, 377 cities have been certified ODF+, and 167 cities have been certified ODF++
Achievement of SBM particularly on SWM
At the time of launch of the Swachh Bharat Mission, 95 lakh tonnes per annum of waste was the treatment capacity across processes
such as composting, bio-methanation, RDF and waste to energy plants (as per the Kasturirangan report). This has been enhanced
substantially in the last 4 years, and presently, designed input capacity of functional waste to energy and waste to compost plants is
approx. 238 Lakh TPA including decentralized capacity.
75,935 wards out of 84,420 wards (90% wards) are practicing door to door collection
As on date, approximately 54% of the total waste generated is being processed and 64% of wards are practicing source segregation.
As on date, India have 685 functional waste to compost plants (centralized) with capacity to process 188 lakh tonnes waste per annum,
and another 232 plants are under construction, with approximate input capacity of 47 lakhs tonnes per annum.
As on date, India have 7 functional Waste to Electricity plants with Production Capacity of 88.4 MW, and another 56 plants under
construction with Production Capacity of 415 MW.
Additionally, 384 bio gas and bio-methanation plants with input capacity of 33 lakh tonnes per annum, and another 21 plants under
construction with potential input capacity of 25 lakh metric tonnes.
Protocol for garbage free cities was also launched during SBM 1. This protocol is based on 12 parameters, follows a SMART framework –
Single metric, Measurable, Achievable, Rigorous verification mechanism and Targeted towards outcomes – and has been devised in a
holistic manner including components such as cleanliness of drains & water bodies, plastic waste management, managing construction

Solid waste management initiative in Urban India
8
& demolition waste, etc. which are critical drivers for achieving garbage free cities. It is a single metric rating system, based on multiple
parameters of SWM. It is envisioned that star rating initiative will also enable institutionalization of good practices such as source
segregation, scientific processing of waste, dumpsite remediation, penalties & spot fines for littering, and compliance of bulk waste
generators, amongst others. As on date, 3 cities (Indore, Ambikapur and Mysuru) have been rated as 5-star cities, and 53 cities have been
rated as 3-star cities.
1.4 Exposure cum training programme, Phase I (2016), Phase II (2017) and Phase III (2018-19)
As part of the capacity building programme under the SBM, NIUA has been engaged in conducting Exposure Workshops on Solid Waste
Management (SWM) for the Urban Local bodies (ULBs). These have been spread over three phases - Phase I (2016), Phase II (2017) and Phase
III (2018-19). The purpose of the SWM Exposure Workshop was to recognize the issues, challenges and constraints of SWM, understand the
SWM Rule 2016, various approaches, technologies and their financial implementation and prepare a plan to implement solutions in their city.
In 2016, NIUA conducted twelve SBM-SWM Exposure workshops at United Service Institute of India, New Delhi. Each workshop comprised 2-3
senior officials from ULBs and covered 108 ULBs of 25 states and UTs and trained 224 municipal officials. A similar set of twelve workshops were
conducted in 2017 at India habitat Center, New Delhi, covering 178 ULBs from 27 states and 5 UTs and trained 423 municipal officials. These
workshops (Phase I – 2016 and Phase II - 2017) were conducted from May to October and duration of workshop were four to five-day, wherein
the first day was devoted to theoretical aspects while the next two days were site visit days wherein the ULB officials were taken to different
locations in Delhi NCR and explained the nuances of establishing and running different plants for treatment of different components of solid
waste generated in a city. The fourth and fifth days were again devoted to explanation of technologies, exercises and competitions to assess
best groups who could plan and submit good DPRs. These workshops were named SWM Exposure Workshops because they provided the

Solid waste management initiative in Urban India
9
required exposure to the participants regarding the SWM Rules 2016 and the ways and means for achieving compliance with it.
The third phase (2018-19) kick- started on 20th June 2018 with a three-day workshop that witnessed participation from 42 Urban Local Bodies
(ULBs) of the National Capital Region (NCR). This was followed by a five-day national level master trainers’ workshop from August 20-24, 2018 at
India Habitat Centre, New Delhi. In this workshop, master trainers from thirteen Training Entities (TEs), selected through a competitive process
(RFP process), were trained. This was followed by seventy-nine City Cluster Workshops, spread over 42 locations spread across India, beginning
from 17th September 2018 to 15th February, 2019. Including the workshop conducted by NIUA at Delhi for the ULBs of the NCR, a total of 80
workshops were conducted in 43 locations. Each of these workshops was spread over three days. A total of 3439 representatives from 1789
ULBs participated from 27 states and 4 UTs.
Figure 1 PROJECT SEQUENCE FOR PHASE III (2018-19)
At least one resource person from NIUA attended each of these workshops. In addition to monitoring, the representative from NIUA conducted
sessions on Swachh Survekshan, ODF, ODF+, ODF++ Protocol, Star Rating of Garbage Free Cities and accessing SBM funds.

Solid waste management initiative in Urban India
10
The Map below shows 43 locations where the workshops were held and the location of Urban Local Bodies (ULBs) that nominated officials to attend
these workshops.
Solid waste management initiative in Urban India
11
Map showing workshop locations and ULBs covered
Total Workshops conducted in Phase III = 80 Total no. of Locations = 43 Total no. of ULBs participated = 1789 Total no. of participants = 3439

Solid waste management initiative in Urban India
12
1.5 General Format of Phase III workshops (2018-19)
Day 1: Orientation and Technical Session
The first day involved inaugural and orientation sessions. In most of the workshops, senior administrative representatives such as commissioners,
elected representatives such as mayors, and senior representatives from State Government and SBM Directorates were present in the inaugural
session as chief guests. The lectures and panel discussions on this day included presentation on the provisions in the latest waste management
rules. This covered the SWM Rules 2016, Plastic Waste Management Rules 2016, E-Waste Management Rules 2016, Biomedical Waste
Management Rules 2016, Construction and Demolition (C&D) Waste Management Rules 2016. In addition to this, a session was dedicated for the
discussion of the technologies available for management of solid waste in both centralized and decentralized manner.
Inauguration session of the workshop

Solid waste management initiative in Urban India
13
Day 2: Field visits
Participants were taken to field visits on the second day. The purpose of the field visit was to demonstrate to the participants, centralized as well
as decentralized waste management technologies in solid waste management as alternatives to dumping. Some of these included the following:
Door to door collection of waste
Landfill sites including bioremediation and Secured Landfill sites
Waste to Energy Plants – Biomethanation, Composting, Incineration (if any)
Construction and Demolition Waste Recycling Plant
Decentralized wet waste composting at the community and household level by Residents’ Welfare Associations (RWAs) and Non-Governmental
Organizations (NGOs)
Material Recovery Facilities (MRF) and SLRM centres where applicable
Kitchen waste-based biomethanation plant by Bulk Garbage Generators (BGG)
Fecal Sludge Treatment Plant (FSTP)
Apart from this, attempts were made to take the participants to certain innovative initiatives in solid waste management like making agarbattis
and perfumes from flower waste by a start- up company run by young entrepreneurs in collaboration with the Ahmedabad Municipal
Corporation. The Mahabodhi temple at Bodhgaya has partnered with a social enterprise called Matr for converting floral waste to natural dyes
used for khadi textiles. Young entrepreneurs in Guwahati are helping to tackle the problem of plastic waste by using it to make light-weight
bricks for the construction industry.
A noteworthy example is that of Saswad Municipal Council in Pune that has installed 'Hygiene' boxes that disinfects the used sanitary napkins
Solid waste management initiative in Urban India
14
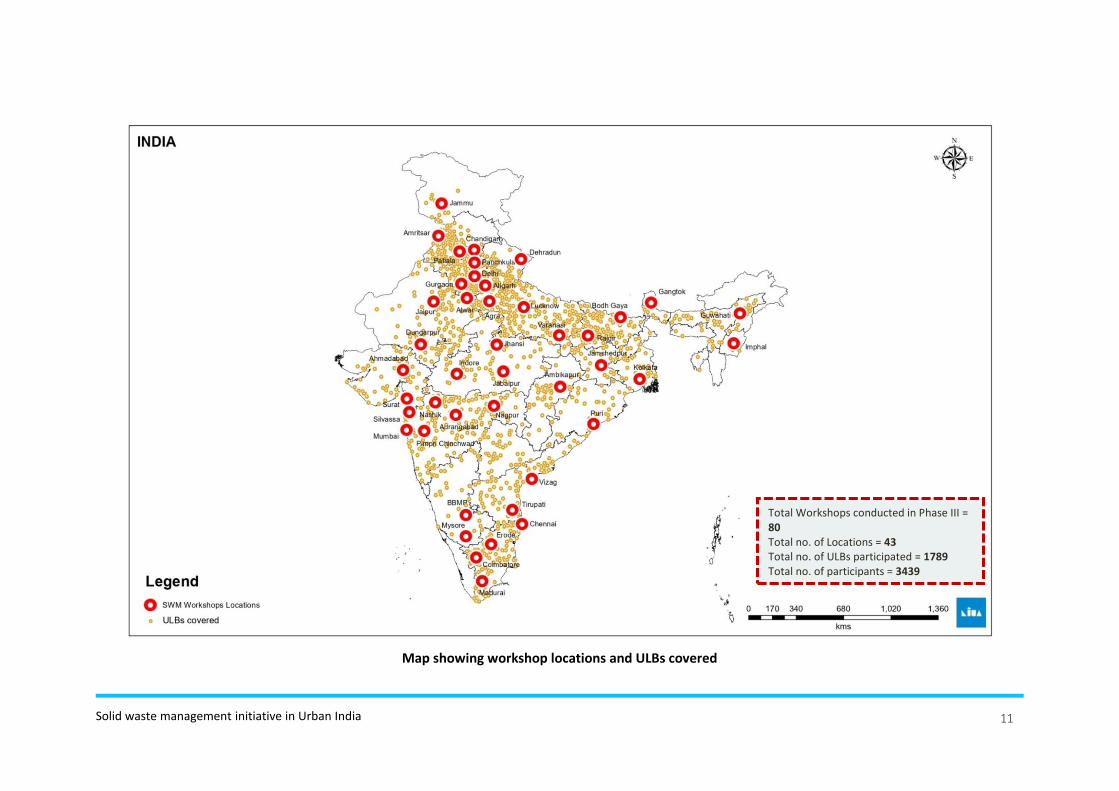
before disposal, thus safeguarding municipal workers from health hazards.
Day 3: Group Activities
The third day comprised recapitulation session of the first two days, followed by a session on the business models of waste management and the
financial aspects of SBM. During the latter half of the day, individual quiz and group activities were conducted.
For the group activities, participants were divided into smaller groups of 5 to 6 members each. Efforts were made to ensure heterogeneous
composition of groups, i.e. each group had members representing different ULBs and varied backgrounds.
During the first group activity, participants were asked to highlight common and unique issues and challenges associated with solid waste
Demonstration being given to the participants during field visits

Solid waste management initiative in Urban India
15
management in their cities. In the second group activity, participants were asked to select a hypothetical city, town or ward for which, they
selected approaches and technologies to make the projects economically viable and bankable. The groups ascertained certain capital costs,
calculated recurring costs pertaining to salary of manpower, electricity, fuel, water charges etc. and identified sources of revenue to make the
plan sustainable.
The workshop ended with a valedictory session where participation certificates were awarded. Prizes were given to the winners of the quiz and
group activities.
1.6 Issues and challenges 1.6.1 Identified by Urban Local Bodies (ULBs)
Presentations of group activities by participants

Solid waste management initiative in Urban India
16
Process and Implementation: The predominant issue to be flagged was lack of systematic door to door collection and the difficulty in extending door
to door collection in the entire city.
Social and Behavioral: These include the attitude towards waste management. The most important concern flagged by ULB representatives was that
of lack of awareness among people regarding source segregation. Another issue flagged by participants included the lack of IEC and dissemination of
knowledge by ULBs and the government.
Infrastructure related: This includes non-availability of land for SWM, poor maintenance of existing infrastructure and lack of vehicles for collection
and transportation of waste.
Political issues and challenges: The collection of user charges and levy of spot fines is difficult due to political interference and inadequate and
committed city leadership. These are important initiatives for strengthening revenue generation of ULBs.
Administrative issues and challenges: Lack of public accountability, communication gap between various ULB departments, and lack of proper
institutional structure were highlighted as major bottlenecks.
Planning and policy related issues: Lack of long term waste management plans were flagged as concerns. Inadequate management of waste from
religious premises, festival sites, slaughter houses, gardens and horticultural parks and lack of mechanism for incentive based user charge collection
emerged as other issues emphasized by participants. The absence of buy back policies of ULBs to purchase products from recycling plants like C&D
waste management plant, paper recycling plants and composting plants were also raised.
Other related issues and challenges: Lack of knowledge and skilled expertise in selection and implementation of appropriate technology based on
the size of the city or town, quantity and composition of waste generated and cost effectiveness were areas of concern.
Human Resources Management: Lack of capacity building of ULB staff, proper training of existing staff and shortage of manpower were other issues.
These resulted in loss of motivation for the workers, which further reflected in the quality of their work. Absence of health facilities for workers was
another concern flagged by ULBs.

Solid waste management initiative in Urban India
17
Below is the bar chart representing consolidated pattern of issues and challenges identified by participants in the city cluster workshops during
Phase I, Phase II and Phase III. It is interesting to observe that problems such as process and implementation of waste, treatment of waste,
infrastructure facility, social & behavioral change and administration, which were considered as major problems in 2016, have dropped
remarkably in 2018 but other problems such as political interference, lack of people’s participation and raising funds for the projects are the
emerging problems of 2018-19.
Graph 1: Consolidated bar graph showing pattern of issues and challenges identified by participants in the city cluster workshops

Solid waste management initiative in Urban India
18
Graph 2: Consolidated bar graph showing pattern of issues and challenges changed over the time
1.6.2 Identified by Indian Air Force (IAF)
India Air Force officials also participated in our last few workshops. While conducting group activity 1 we it was emphasized that due to poor
management of solid waste, the risk of bird hits to aircrafts had increased in the recent past, which caused both economic loss as loss of man
power in the IAF, one of the major problems faced by Indian Air Force. Usually, people residing near airports throw their garbage here and there,
which attracts flies, insects and birds and rising population of birds in airport air lead to bird hitting incidents. Bird hitting is one of the major

Solid waste management initiative in Urban India
19
causes of air crashes in our country, which is leading to losses of costly defense aircrafts and loss of invaluable lives of pilots.
1.6.3 Problem faced by community due to poor management of waste
Poor management of waste not only creates community health issues but it also degrades the environment and affects socio-economic status
of poor people who can become further impoverished due to increased expenditure on health.
Effects on community health: The US Public Health Service has identified 22 human diseases that are linked to improper solid waste
management (MIT Urban Development Sector Unit 1999). Several studies have been published that link asthma, heart attack, and emphysema
to burning garbage. Dump yards which are frequently known to catch fires, are pumping tonnes of cancer-causing smoke into the air. Pollution
caused by burning plastic, leather, etc are also one of the reasons of increasing cancer incidents and skin irritation problems among those living
near such dumpsites and waste industries.
Effects on environment: Burning garbage is classified as the third biggest cause of greenhouse emission in India—apart from the impact on
human health, the effect on land, water and food pollution is a matter of grave concern1. Burning releases carbon monoxide, nitrogen oxide,
sulphur dioxide, and carcinogenic hydrocarbons, apart from particulate matter into the air, resulting in India releasing 6% of methane emissions
only from garbage (compared to a 3% global average) (Planning Commission 2014). If no action is taken, dumpsites will account for 10% of
Greenhouse Gas Emissions by 20252. Therefore, closing dumpsites is one of the ways in which we can move towards meeting the sustainable
development goals.
1 M., SWAMINATHAN. (2018, April 21). How Can India's Waste Problem See a Systemic Change? Retrieved June 16, 2019, from https://www.epw.in/engage/article/institutional-framework-implementing-solid-waste-management-india-macro-analysis 2 http://closingdumpsites.iswa.org/why/sustainable-development-goals/

Solid waste management initiative in Urban India
20
Leachate from rotting garbage contains heavy metals and toxic liquid; with such emissions ending up either being absorbed into the soil or
flowing into water bodies today (Awasthi 2013), the entire food chain can be affected when this contaminated water is utilised for agriculture,
human consumption and animal consumption.
Effects on waste picker
An estimated two million waste-pickers exist in India today (Chaturvedi 2010); these are families that live off dump yards through collection and
sale of recyclables from the dumped mixed waste. While some estimates state that nearly 40% of the waste-pickers are children aged below 18
years, what is definite is that these families live in unhygienic environments, succumbing to malnutrition, extreme poverty, and adverse health
impacts. With no physical protection such as gloves, uniforms, shoes or masks, most children scourge for metals with magnets attached to sticks,
thus putting their health to extreme risk.

Solid waste management initiative in Urban India
21
2. APPROACHES FOR AN EFFECTIVE SOLID WASTE MANAGEMENT – Some good practices
o Adherence to SWM Rules 2016 / Framing of Bye-laws
The SWM Rules, 2016 aim to achieve 100% door to door collection and source segregation of waste to ensure efficient treatment and scientific
disposal of waste. In addition to this, it promulgates reduction in generation of waste by reusing and recycling waste before discarding in tandem
with proper segregation and treatment practices.
Indore, Bengaluru, Ambikapur, Mysuru, Nawashahr, Muzaffarpur are some of the cities that have framed the Solid Waste Management bye-
laws in accordance with the SWM Rules, 2016. Cities like Indore, Alappuzha, Panchgani, Thiruvananthapuram, Gangtok, Mysuru, Vengurla and
Vaijapur have done well in enforcing many provisions of the Plastic Waste Management Rules.
C & D waste management facilities have been put in place by Indore, East Delhi Municipal Corporation, Ahmedabad and Chandigarh.
o Leadership and Coordination among agencies/ Political will
Public accountability, coordination between various ULB departments and a proper institutional structure are pre-requisites of an effective
implementation of SWM. For example, in Ahmedabad, a call to action was given by Municipal Commissioner to all officials in November 2018 to
ensure compulsory segregation of waste. To facilitate the same, a mass triggering activity was organized on 2nd December, 2018 where 45,000
officials and staff of Ahmedabad Municipal Corporation participated to spread the message of source segregation covering every corner of the
city. Simultaneously, efforts were also taken to improve the technical capacity of waste management in the city by improving the Material
Recovery Facilities (MRFs) with support from women Self Help Groups.

Solid waste management initiative in Urban India
22
Coordination between higher officials and supervisors in Indore helped the city to achieve ODF+ status of the city. Supervisors were appointed
to carry out random checks of CT/PTs during the day. The commissioner and assistant commissioner also carried out surprise checks to confirm
the maintenance of these facilities as per set standards. The data received on the 311 app was continuously monitored by the Municipal
commissioner himself and non-resolution of issues resulted in the area inspector of the concerned area being taken to task.
o IEC/ Citizen Engagement
Community engagement and participation has a direct bearing on efficient Solid Waste Management (SWM) by advocating attitude and
behavioural change towards SWM.
In Indore, radio jingles, television, print advertisements, and slogans painted on one-and-a-half lakh square metres of wall space across the city
have built a strong awareness campaign. “Ashra Mubarak”, an annual religious event of the Bohra community and “Jatra”, an annual culture
event of the Maratha community, that took place in Indore in 2018 were both citizen-led events organized with the ‘Zero waste concept’
In Panchkula, Swachhata Pride Rally was organized on 26th January where awareness programmes related to cleanliness and solid waste
management included nukkad nataks and live demonstration on streets using sweeping and cleaning equipment. Efforts were also made by the
city administration to reach out to the citizens and demonstrate to them regarding source segregation of waste and home composting with
“Aaga” and “Khamba” composters.
Popular cartoon character “Chhota Bheem” was selected as the Swachhata ambassador in Chhattisgarh to create awareness and encourage
participation during awareness drives held at school, college and ward level.
Morning processions at Nawanshahr, popularly known as “Prabhat Pheri for Swachhta” has facilitated holistic inclusion of the community in
cleanliness drives.

Solid waste management initiative in Urban India
23
o Involvement of Informal Sector in Collection, Transportation and Processing
As per the SWM Rules, 2016, Urban Local Bodies (ULBs) need to formalize the informal sector and issue identity cards to them. Also, the informal
sector has to be incentivized by selling dry recyclable waste. Pune as well as Bengaluru has been a pioneer in getting the local communities
engaged in segregation of waste at source. Pune’s “SWaCH”, a wholly owned co-operative of informal waste pickers, bridges two entirely
separate systems of waste management, the formal municipal solid waste system and the market driven informal secondary materials recovery
system. Waste collectors of SWaCH provide daily door to door waste collection services to households, offices, businesses and shops covering
54% of the city. “HasiruDala”, an NGO from Bengaluru strives to integrate marginalized informal waste workers including waste pickers in the
solid waste management framework by utilizing their expertise in the domain. Their work includes collection, sorting, grading and transportation
of waste for recycling which is foundational to both green and circular economies. Harisu Dala members provide service to more than 13,000
households in Bengaluru.
o Convergence of Missions
Convergence between Government schemes helps in enabling better utilization of resources as well as improving the livelihood of citizens.
Implementation of the Swachh Bharat Mission (SBM) and National Urban Livelihoods Mission (NULM) has helped in achieving holistic social
development goals.
In case of Ambikapur, the innovative solid waste management model involves SHG members to effect 100% source segregation of the 45 MT
waste produced by the city daily, under the Swachh Ambikapur Mission.

Solid waste management initiative in Urban India
24
The Greater Vishakhapatnam Municipal Corporation (GVMC) in collaboration with Water and Sanitation for the Urban Poor (WSUP) has
constituted a ward level Open Defection Free Coordination Committee (ODF CC), that has become a key vehicle for informing households about
the subsidy provided under SBM for the construction of Individual Households Toilets conducting IEC programmes for Solid Waste Management.
o Fines/ Enforcement
In Indore, spot fines are imposed on people violating norms of the Indore Municipal Corporation.
In case of Surat, fines of up to Rs. 1 crore are collected every year from citizens, shopkeepers and residential localities for violations such as
littering and not keeping their premises clean.
Fines also act as a source of revenue generation for the City Corporations.
o Emphasis on Decentralized Waste Management
The SWM Rules, 2016 focuses on “decentralized processing” facilities for maximizing the processing of biodegradable waste and recovery of
recyclables closest to the source of generation so as to minimize transportation of waste for processing or disposal.
The city of Bangalore has followed decentralized processing of waste based streams. The Municipal Corporation has created wad-wise micro
plan for management and execution of SWM services. The city has 164 Dry Waste Collection Centres (DWCC), 13 biomethanation units, 7 Organic
Waste Composting Centres, 4 Leaf Litter Processing Units and 10 waste Processing Plants.

Solid waste management initiative in Urban India
25
In Gurugram, the “Alag Karo – Har Din Teen Bin” Program is one such decentralized initiative that was launched on September, 2017 with the
objective to inspire, handhold and implement source segregation of waste in residential complexes, educational and commercial establishments
and also to develop capacities of waste workers to improve waste recycling. The project has already connected with 32 RWAs, 19 schools and
has reached out to 499 waste workers. Among these 32 societies, 14 are also successful in managing their wet waste on-site.
In Kerala, the government issued necessary directions to Local Self Government Institutions (LSGLs) to constitute the support system for field
level waste management. The field level management came to be known as ‘Haritha Karma Sena’ or ‘Green Task Force’ and consisted .of a
trained team of a group of SHG women whose task was to provide technical services and solutions on waste management pertaining to
collection, transportation, processing, disposal, and management of waste in collaboration with the respective LSGLs.
o Initiatives by Small Cities
Suryapet in Telangana, Gangtok in Sikkim, and Bobbili in Andhra Pradesh are carrying out 100% door to door collection. Tirunelveli in Tamil Nadu,
Vengurla in Maharashtra, and Uttarpara-Kotrung in West Bengal have not only attained 100 per cent door-to-door collection but also 100%
segregation. In Bobbili, the municipal workers segregate the waste. These towns have gone one step further by composting all their wet waste.
In Alappuzha in Kerala, the Municipal Corporation does not collect wet waste; it is processed by residents at their home through composting or
bio-gas.
o Promoting Social Entrepreneurship in Solid Waste Management

Solid waste management initiative in Urban India
26
Swachh Bharat Mission has not only helped in livelihood generation, but has also given impetus to social enterprises and start-ups to solve the
waste management issues by innovations and context-specific solutions.
Launched in 2013, Saahas Zero Waste (SZW) is a social enterprise that has redefined waste management and believes in a circular economy,
converting waste to resources. SZW currently manages 25 tonnes of waste per day across Bangalore and Chennai, and is also operational in
Gurugram, Surat, Hubballi, and Ballari.
Brook and Bloom, a startup based in Ahmedabad, has been working with flower waste from temples and religious precincts and have successfully
converted the waste into incense sticks and cones.
Chanu Associates, run by a 29-year-old young woman entrepreneur from Manipur, has brought in a new era of eco-friendly entrepreneurship in
the form of environment-friendly pen and pencils under the brand name ‘Envi’. It deals with products ranging from environmental pens with
seeds, pencils, direct filling ball pens, paper bags, non-woven bags etc.
For detailed description, please refer “Solid Waste Management Initiatives in Urban India: A Compendium”

Solid waste management initiative in Urban India
27
3. EVALUATION OF EFFICACY OF SBM SWM EXPOSURE WORKSHOP
3.1 Background
To evaluate the impact of these workshops, NIUA conducted impact assessment survey during the capacity building workshops. A detailed
klquestionnaire was prepared on SWM rule 2016. It covers range of questions like, IEC adopted to reduce waste generation, collection and
transportation, treatment and disposal, SWM plan and percentage of SWM plan implementation in ULBs for effective solid waste management.
For present study, 2017-18 data is considered as baseline and compared with 2018-19 data to evaluate the impact of the workshop. Five states
have been selected and analyzed on various parameters of SWM. The objective of the study is to understand and analyze the nature of issues
and challenges faced by ULBs and understand how SBM-SWM exposure workshop has been helpful in improving solid waste management in
their respective areas.

Solid waste management initiative in Urban India
28
3.2 Methodology
3.2.1 Data sampling and collection
Data is sampled from phase II (2017-18) and phase III (2018-19) workshops. In 2017-18, 423 municipal officials from 178 ULBs of 27 states and 5
UTs trained and in 2018-19, 3439 municipal officials from 27 states and 4 UTs trained. There were two primary criteria for selecting the
participants for the workshops which was consistently maintained all through in 2017-18 and 2018-19. First, they must be a member of an Urban
Local Body (ULB) or an individual associated with an ULB of India, and second, they must have prior knowledge and experience related to solid
waste management. However, no such criteria regarding number of years of experience of the participating individuals were required. Written
as well as telephonic invitations were sent to Commissioners/ Mayors of ULBs to depute officials dealing with SWM in their respective ULBs.
Whoever registered for the workshop was welcomed on first come basis. The process of selection of participants was uniform and consistent
throughout. Thus, “Exclusion principle” was not introduced while selection which made it possible to include participants from a wide spectrum.
Out of the population of 423 participants in 2017-18 and 3439 participants in 2018-19, we consider one participants from each ULB and data is
recorded according to that. From the recorded data of 178 in 2017-18 and 1789 in 2018-19, data is analyzed from the 57 valid responses in 2017-
18 and 1147 valid response in 2018-19.
We selected five states across India, namely, Madhya Pradesh, Odisha, Telangana, Jharkhand and Tamil Nadu to conduct a comparative analysis
for years 2017-18 and 2018-19. The selection of states were random and capture impact of SBM-SWM Exposure workshops on all states whether
it is the best performing state or slow mover states. A total of 14 valid responses received in 2017-18 and 58 valid responses in 2018-19 from
Madhya Pradesh. Similarly, a total of 7 and 23 valid responses from Odisha, a total of 6 and 41 valid from Telangana, a total of 5 and 26 valid

Solid waste management initiative in Urban India
29
responses from Jharkhand and a total of 5 and 158 valid responses from Tamil Nadu received in 2017-18 and 2018-19 respectively. Thus, the
sample selected was a fairly representative one which enabled us to arrive at results, which can help us improve future training progamme.
Sample Size (No. of ULBs)
States 2017-18 2018-19
o Madhya Pradesh 14 58
o Odisha 7 23
o Telangana 6 41
o Jharkhand 5 26
o Tamil Nadu 5 158
3.2.2 Selection of parameters
Out of range of questions such as, awareness of SWM Rule 2016, IEC adopted to reduce waste generation, collection and transportation,
treatment and disposal etc., five parameters have been selected for the analysis. The selected parameter includes components of solid waste
management chain, i.e. waste segregation, collection, transportation, wet and dry waste processing and waste disposal. The selection of the
parameters is aligned with the objectives of the Swachh Bharat mission - Urban (SBM-U) which aims to ensure source segregation, door-to-door
garbage collection, treatment and proper disposal of municipal solid waste (MSW) in all urban areas by 2019.

Solid waste management initiative in Urban India
30
Shown below is the list of selected parameters along with the questions to which responses were sought.
Parameters Questions
1. Waste segregation at source
1.1 Does your ULB have any kind of source segregation?
1.2 Types of segregation?
2. Segregated storage and collection of waste 2.1 Have you organized segregated collection of waste in your ULB?
3. Door to Door collection and transportation
3.1 Does your ULB have provision for Door to Door waste collection and transportation?
3.2 Frequency of waste collection in each zone/wards in your ULB?
4. Processing of streams of waste 4.1 Does your ULB have waste processing facilities?
4.2 In which different streams is waste segregated (material recovery facility, composting,
micro composting center, facility for dry waste shredding/baling & selling to recyclers, C&D
waste, Bio methanation, waste to energy, any other)?
4.3 Is domestic hazardous waste (e.g. CFL, tube-lights, batteries, pesticides) collected
separately in your ULB?
4.4 Is Sanitary waste (Sanitary pads, diapers) collected separately in your ULB?
5. Scientific disposal
5.1 Does your ULB have a scientific landfill site?

Solid waste management initiative in Urban India
31
Once selection of the parameters finalized, certain weightage is assigned to each parameter from SS 2019 tool kit. Toolkit covers survey (Swachh
Survekshan) methodology and help cities to improve their service delivery level by achieving a higher score during the survey. The objective of
the Swachh survekshan is to encourage large scale citizen participation, ensure sustainability of initiatives taken towards garbage free and open
defecation free cities, provide credible outcomes which would be validated by third party certification. Moreover, the survey intends to foster a
spirit of healthy competition among towns and cities to improve their service delivery to citizens, towards creating cleaner cities (SS 2019). City
level workshop was conducted by NIUA on behalf of MoHUA to familiarize ULBs with the survey methodology, survey process and indicators,
and also clarifying their expectation from the survey.
3.2.3 Weights assignment
i. Weights to selected parameters
A total of 5000 marks was in SS 2019 toolkit, out of which 1250 marks was for service level progress (SLP) for 7 indicators, in which 27% weights
assigned to collection & transportation, 30% to Processing & disposal and remaining percentages were assigned to sustainable sanitation,
capacity building, bye laws and IEC. We assigned weights to selected parameters according to the percentage allocated for collection &
transportation and processing & disposal in the SLP.

Solid waste management initiative in Urban India
32
Figure 2 Score distribution in SS 2019 toolkit
Shown below is the weights of each parameter along with the questions to which responses were sought
Parameters Percentage assigned out
of 100%
Questions Weights assigned
1. 1. Waste segregation at
source
15% = 15 1.1 Does your ULB have any kind of source segregation? 50% of 15%
= 7.5
1.2 Type of segregation? 50% of 15%
= 7.5

Solid waste management initiative in Urban India
33
2. 2. Segregated storage and
collection of waste
15% = 15 2.1 Have you organized segregated collection of waste in
your ULB?
100% of 15% = 15
3. 3. Door to Door collection
and transportation
20% = 20 3.1 Does your ULB have provision for Door to Door waste
collection and transportation?
50% of 20%
= 10
3.2 Frequency of waste collection in each wards/zones in
your ULB?
50% of 20%
= 10
4. 4. Processing of streams of
waste
35% = 35 4.1 Does your ULB have waste processing facility? 40% of 35%
= 14
4.2 In which different streams waste is segregated
(material recovery facility, composting, micro
composting center, facility for dry waste
shredding/baling & selling to recyclers, C&D waste, Bio
methenation, waste to energy, any other)
20% of 35%
= 7
4.3 Is domestic hazardous waste (e.g. CFL, tube-lights,
batteries, pesticides) collected separately in your ULB?
20% of 35%
= 7
4.4 Is Sanitary waste (Sanitary pads, diapers) collected
separately in your ULB?
20% of 35%
= 7
5. 5. Scientific disposal 15% = 15 5.1 Does your ULB have scientific landfill site? 100% of 15%
Solid waste management initiative in Urban India
34
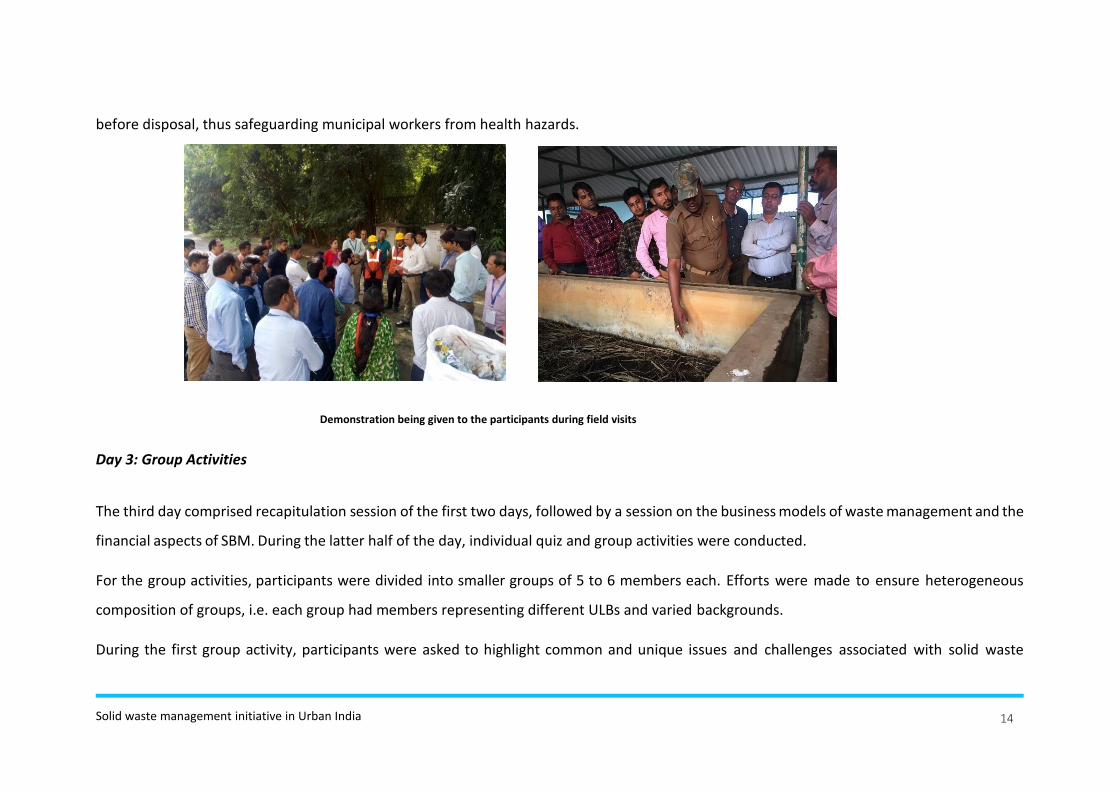
Similarly, weights have been assigned to each questions of selected parameters to calculate states performance. Questions having options as
yes or no achieve 100 percent or zero marks respectively while score for questions having multiple options assigned on the basis of most desirable
response. For instant, ULBs practicing 5-way segregation will achieve 100 percent score while ULBs practicing 4-way, 3-way and 2-way will
achieve 75 percent, 50 percent and 25 percent score respectively.
ii. Weights to questions
Type of segregation
Options: 2-way, 3-way, 4-way and 5-way segregation
Percentage to each option is assigned according to the ways of segregation. Higher the streams of segregation better is the segregation system.
Therefore, ULBs practicing 5-way (dry, wet, domestic hazardous, sanitary waste and C & D waste) segregation achieve 100% score in this
category. Similarly, ULB practicing 4-way (dry, wet, domestic hazardous and sanitary waste) segregation achieve 75%, 3-way (dry, wet and
domestic hazardous) segregation achieve 50% and 2-way (dry and wet waste) segregation achieve 25% score in this category.
= 15
Total 100%=100 Total score 100
Solid waste management initiative in Urban India
35
Does your ULB have provision for Door to Door waste collection and transportation
Options: Door to Door collection using non-motorized/motorized small vehicles
Others (includes collection by tipper trucks by ULB or PPP from community bins)
Collection from source is essential for effective SWM. So, 100 percent of score is assigned to Door to Door collection of waste by ULB/PPP by
non-motorized or motorized small vehicles and 50 percent of score is assigned to the ULBs, collecting waste by tipper trucks from community
bins.
Frequency of waste collection from each wards/zones in your ULB?
Options: once a day, Twice a day, others (twice a week, thrice a week and no response)
Score is assigned to each option according to the frequency of waste collection by ULB from each wards/zones. Higher the waste collection
frequency from each wards/ zones, cleaner the city. Hence, ULB collecting waste twice a day achieve 100% score in this category. Similarly, ULBs
collecting waste once a day achieve 66% of score and 33% score is assigned to the ULBs collecting waste twice a week, thrice a week or no
response.
In which different streams waste is segregated?

Solid waste management initiative in Urban India
36
Options: material recovery facility, composting, micro composting center, facility for dry waste shredding/baling & selling to recyclers, C&D
waste, Bio methenation, waste to energy, any other
Score to each option is assigned according to nature of centralized/decentralized facility. Higher score has been allocated to the facility having
no or less impact on human and environment.
Therefore, Percentage and score assigned to the different streams of waste segregation is,
o Material recovery facility = 15% of 7 (max score) = 1.05
o Composting = 20% of 7 (max score) = 1.4
o Micro composting center (decentralized composting) = 25% of 7 (max score) = 1.75
o Facility for dry waste shredding/baling & selling to recyclers = 4% of 7 (max score) = 0.28
o C&D waste = 15% of 7 (max score) = 1.05
o Bio methanation = 15% of 7 (max score) = 1.05
o Waste to energy = 4% of 7 (max score) = 0.28
o Any other = 2% of 7 (max score) = 0.14
After assigning weights to each parameters and questions, performance of selected states, i.e., Madhya Pradesh, Odisha, Jharkhand, Tamil
Nadu and Telangana has been calculated and analyzed below.
Combined analysis

Solid waste management initiative in Urban India
37
Parameters Questions Madhya Pradesh Odisha Jharkhand Telangana Tamil Nadu
2017-18 2018-19 2017-18 2018-19 2017-18 2018-19 2017-18 2018-19 2017-18 2018-19
1. Waste
segregation at source
Status of source
segregation
5.925 6.225 3.225 3.9 3 6.634 6.225 6 7.5 7.35
Type of segregation 1.875 2.343 1.875 2.031 1.875 2.03 1.875 2.329 1.875 2.537
2. Segregated
storage and collection
of waste
organized segregated
collection of waste
11.85 10.65 2.1 4.5 0 10.35 7.5 10.2 6 13.35
3. Door to Door
collection and
transportation
Door to Door waste
collection and
transportation
10 8.103 7.857 9.565 7 9.038 7.5 9.87 10 9.208
Frequency of waste
collection
8.057 6.893 7.085 7.043 6.6 6.861 6.6 6.375 6.6 6.7
waste processing facility 7 9.66 9.94 3.04 5.6 3.78 11.62 8.54 14 11.06

Solid waste management initiative in Urban India
38
4. Processing of
streams of waste
Different streams of
waste processing
1.856 2.315 0 1.554 1.4 2.254 2.436 1.637 3.388 3.305
domestic hazardous
waste collection
0.49 1.96 0 1.82 0 0.77 0 2.24 0.7 3.08
Sanitary waste collection 0.49 2.31 0.98 0.91 0 0.84 1.19 1.4 0 2.1
5. Scientific
disposal
Scientific landfill site 8.55 10.8 2.14 12.4 0 11.55 4.95 4.8 6 6.75
Total Score achieved 56.09 61.25 35.20 46.76 25.47 54.10 49.89 53.39 56.06 65.4
Combined inferences
States SS 2018
Rank
SS 2019
Rank
Performance in SWM-SBM
Workshop
Inferences

Solid waste management initiative in Urban India
39
Madhya Pradesh 4th 4th
• All the states show improvement in
relevant aspects of solid waste
management.
• Odisha and Tamil Nadu shows
improvement in SS 2019 ranking while
slight drop in Telangana and Jharkhand is
recorded. This could be because more
lenient parameters during SS 2018 as
compared to SS 2019
• Only Telangana shows less improvement
in 2018-19 as compared to 2017-18. The
reason could be that Telangana had
capacity building training after SS 2019.
Odisha 22nd 17th
Telangana 7th 8th
Jharkhand 1st 2nd
Tamil Nadu 13th 12th
2017-18
: 56
2018-19
: 61.2
2017-18
: 36.2
2018-19
: 46.7
2017-18
: 49.8
2018-19
: 53.3
2017-18
: 25.4
2018-19
: 54.1
2017-18
: 56.06
2018-19
: 65.4

Solid waste management initiative in Urban India
40
Please refer result section for individual state analysis.
4.1 Results
3.3.1 Madhya Pradesh
Parameters Percentage
assigned to
parameters
Questions
Score
assigned to
each question
Score achieved Result
2017-18 2018-19
1. Waste
segregation at
source
15% 1.1 Does your ULB have any kind of
source segregation
50% of 15%
= 7.5
5.9 6.2 o 2018-19 showed better
performance.
o It achieved a score of 7.77 in
2017-18 and a score of 8.582 in
2018-19 under waste
segregation at source
parameter.
1.2 Type of segregation 50% of 15%
= 7.5
1.87 2.382
2. Segregated
storage and
collection of
waste
15% 2.1 Have you organized segregated
collection of waste in your ULB
100% of 15%
= 15
11.8 10.6 o 2017-18 showed better
performance.
o It achieved a score of 11.8 in
2017-18 and a score of 10.6 in

Solid waste management initiative in Urban India
41
2018-19 under segregated
storage and collection of waste
parameter.
3. Door to Door
collection and
transportation
20% 3.1 Does your ULB have provision
for Door to Door waste collection
and transportation
50% of 20%
= 10
10 8.103 o 2017-18 showed better
performance.
o It achieved a score of 10 in
2017-18 and a score of 8.103 in
2018-17 under Door to Door
collection and transportation
parameter.
3.2 Frequency of waste collection
in your ULB
50% of 20%
= 10
8.05 6.89
4. Processing of
streams of
waste
35% 4.1 Does your ULB have waste
processing facility
40% of 35%
= 14
7 9.66 o 2018-19 showed better
performance.
o It achieved a score of 8.856 in
2017-18 and a score of 11.975 in
2018-19 under processing of
streams of waste parameter.
4.2 In which different streams
waste is segregated (material
recovery facility, composting,
micro composting center, facility
for dry waste shredding/baling &
selling to recyclers, C&D waste, Bio
20% of 35%
= 7
1.856 2.315

Solid waste management initiative in Urban India
42
methenation, waste to energy, any
other)
4.3 Is domestic hazardous waste
(e.g. CFL, tube-lights, batteries,
pesticides) collected separately in
your ULB
20% of 35%
= 7
0.49 1.96
4.4 Is Sanitary waste (Sanitary
pads, diapers) collected separately
in your ULB
20% of 35%
= 7
0.49 2.31
5. Scientific
disposal
15% 5.1 Does your ULB have designated
landfill site
100% of 15%
= 15
8.55 10.8 o 2018-19 showed better
performance.
o It achieved a score of 8.55 in
2017-18 and a score of 10.8 in
2018-19 under scientific
disposal parameter.
Total
Percentage
100% Total Score 100 56 61.2

Solid waste management initiative in Urban India
43
From the above table it is evident that ULBs in Madhya Pradesh have improved their performance. Madhya Pradesh achieved a score of 56 in
2017-18 and a score of 61.2 in 2018-19, which shows state improved in relevant aspects of solid waste management in 2018-19 as compared to
2017-18. As per SS 2018 and SS 2019, MP attained 4th rank which may be because of its consistent performance. For detailed description and
weights calculation, please refer Annexure 1 and Annexure 6 respectively.
3.3.2 Odisha
Parameters Percentage
assigned to
parameters
Questions
Score assigned to
each question
Score achieved Result
2017-18 2018-19
1. Waste
segregation at
source
15% 1.1 Does your ULB have
any kind of source
segregation
50% of 15%
= 7.5
3.225 3.9 o 2018-19 showed better
performance.
o It achieved a score of 5.1 in
2017-18 and a score of 5.931 in
2018-19 under waste
segregation at source
parameter.
1.2 Type of segregation 50% of 15%
= 7.5
1.875 2.031

Solid waste management initiative in Urban India
44
2. Segregated
storage and
collection of
waste
15% 2.1 Have you organized
segregated collection of
waste in your ULB
100% of 15%
= 15
2.1 4.5 o 2018-19 showed better
performance.
o It achieved a score of 2.1 in
2017-18 and a score of 4.5 in
2018-19 under segregated
storage and collection of waste
parameter.
3. Door to Door
collection and
transportation
20% 3.1 Does your ULB have
provision for Door to
Door waste collection
and transportation
50% of 20%
= 10
7.857 9.565 o 2018-19 showed better
performance.
o It achieved a score of 14.942 in
2017-18 and a score of 16.608 in
2018-19 under Door to Door
collection and transportation
parameter.
3.2 Frequency of waste
collection from each
wards/zones in your ULB
50% of 20%
= 10
7.085 7.043
4. Processing of
streams of
waste
35% 4.1 Does your ULB have
waste processing facility
40% of 35%
= 14
9.94 3.04 o 2017-18 showed better
performance.
o It achieved a score of 10.92 in
2017-18 and a score of 7.324 in

Solid waste management initiative in Urban India
45
4.2 In which different
streams waste is
segregated (material
recovery facility,
composting, micro
composting center,
facility for dry waste
shredding/baling &
selling to recyclers, C&D
waste, Bio methenation,
waste to energy, any
other)
20% of 35%
= 7
0 1.554 2018-19 under processing of
streams of waste parameter.
4.3 Is domestic
hazardous waste (e.g.
CFL, tube-lights,
batteries, pesticides)
collected separately in
your ULB
20% of 35%
= 7
0 1.82

Solid waste management initiative in Urban India
46
From the above table it is clear that ULBs in Odisha have improved their performance. Odisha achieved a score of 36.2 in 2017-18 and a score of
46.7 in 2018-19, which shows that ULBs in the state improved in relevant aspects of solid waste management over the period studied. In
addition, according to SS 2018 and SS 2019 data, Odisha, which was ranked at 22 in 2018, improved to 17 in 2019. For detailed description and
weights calculation, please refer Annexure 2.
4.4 Is Sanitary waste
(Sanitary pads, diapers)
collected separately in
your ULB
20% of 35%
= 7
0.98 0.91
5. Scientific
disposal
15% 5.1 Does your ULB have
designated landfill site
100% of 15%
= 15
2.14 12.4 o 2018-19 showed better
performance.
o It achieved a score of 2.14 in
2017-18 and a score of 12.4 in
2018-19 under scientific
disposal parameter.
Total
Percentage
100% Total Score 100 36.2 46.7

Solid waste management initiative in Urban India
47
3.3.3 Jharkhand
Parameters Percentage
assigned to
parameters
Questions
Score assigned to
each question
Score achieved Result
2017-18 2018-19
1. Waste
segregation at
source
15% 1.1 Does your ULB have
any kind of source
segregation
50% of 15%
= 7.5
3 6.634 o 2018-19 showed better
performance.
o It achieved a score of 4.875 in
2017-18 and a score of 8.664 in
2018-19 under waste segregation
at source parameter. 1.2 Type of segregation 50% of 15%
= 7.5
1.875 2.03
2. Segregated
storage and
collection of
waste
15% 2.1 Have you organized
segregated collection of
waste in your ULB
100% of 15%
= 15
0 10.35 o 2018-19 showed better
performance.
o It achieved no score in 2017-18
and 10.35 in 2018-19 under
segregated storage and collection
of waste parameter.

Solid waste management initiative in Urban India
48
3. Door to Door
collection and
transportation
20% 3.1 Does your ULB have
provision for Door to
Door waste collection
and transportation
50% of 20%
= 10
7 9.038 o 2018-19 showed better
performance.
o It achieved a score of 13.6 in
2017-18 and a score of 15.899 in
2018-19 under Door to Door
collection and transportation
parameter.
3.2 Frequency of waste
collection in your ULB
50% of 20%
= 10
6.6
6.861
4. Processing of
streams of
waste
35% 4.1 Does your ULB have
waste processing facility
40% of 35%
= 14
5.6 3.78 o 2018-19 showed better
performance.
o It achieved a score of 7 in 2017-18
and a score of 7.644 in 2018-19

Solid waste management initiative in Urban India
49
4.2 In which different
streams waste is
segregated (material
recovery facility,
composting, micro
composting center,
facility for dry waste
shredding/baling &
selling to recyclers, C&D
waste, Bio methenation,
waste to energy, any
other)
20% of 35%
= 7
1.4 2.254 under processing of streams of
waste parameter.
4.3 Is domestic
hazardous waste (e.g.
CFL, tube-lights,
batteries, pesticides)
collected separately in
your ULB
20% of 35%
= 7
0 0.77

Solid waste management initiative in Urban India
50
From the above table it is evident that ULBs in Jharkhand have improved their performance in 2017-18 as compared to 2017-18. Jharkhand
achieved a score of 25.48 in 2017-18 and a score of 54.11 in 2018-19, which shows state improved in relevant aspects of solid waste management.
However, as per SS 2018 Jharkhand was ranked number 1 state in 2018 and dropped to rank 2nd in SS 2019. This could be because more lenient
parameters during SS 2018 as compared to SS 2019. For detailed description and weights calculation, please refer Annexure 3.
4.4 Is Sanitary waste
(Sanitary pads, diapers)
collected separately in
your ULB
20% of 35%
= 7
0 0.84
5. Scientific
disposal
15% 5.1 Does your ULB have
designated landfill site
100% of 15%
= 15
0 11.55 o 2018-19 showed better
performance.
o It achieved no score in 2017-18
and a score of 11.55 in 2018-19
under scientific disposal
parameter.
Total
Percentage
100% Total Score 100 25.48 54.11

Solid waste management initiative in Urban India
51
3.3.4 Tamil Nadu
Parameters Percentage
assigned to
parameters
Questions
Score assigned to
each question
Score achieved Result
2017-18 2018-19
1. Waste
segregation at
source
15% 1.1 Does your ULB have any
kind of source segregation
50% of 15%
= 7.5
7.5 7.35 o 2017-18 showed better
performance.
o It achieved a score of 9.375 in
2017-18 and a score of 9.175 in
2018-19 under waste
segregation at source
parameter.
1.2 Type of segregation 50% of 15%
= 7.5
1.875 2.5
2. Segregated
storage and
collection of
waste
15% 2.1 Have you organized
segregated collection of
waste in your ULB
100% of 15%
= 15
6 13.35 o 2018-19 showed better
performance.
o It achieved a score of 6 in 2017-
18 and a score of 13.35 in 2018-
19 under segregated storage
and collection of waste
parameter.

Solid waste management initiative in Urban India
52
3. Door to Door
collection and
transportation
20% 3.1 Does your ULB have
provision for Door to Door
waste collection and
transportation
50% of 20%
= 10
10 9.208 o 2017-18 showed better
performance.
o It achieved a score of 16.6 in
2017-18 and a score of 15.908
in 2018-19 under Door to Door
collection and transportation
parameter.
3.2 Frequency of waste
collection in your ULB
50% of 20%
= 10
6.6 6.70
4. Processing of
streams of
waste
35% 4.1 Does your ULB have
waste processing facility
40% of 35%
= 14
14 11.06 o 2018-19 showed better
performance.
o It achieved a score of 18.08 in
2017-18 and a score of 19.545

Solid waste management initiative in Urban India
53
4.2 In which different
streams waste is segregated
(material recovery facility,
composting, micro
composting center, facility
for dry waste
shredding/baling & selling to
recyclers, C&D waste, Bio
methenation, waste to
energy, any other)
20% of 35%
= 7
3.388 3.305 in 2018-19 under processing of
streams of waste parameter.
4.3 Is domestic hazardous
waste (e.g. CFL, tube-lights,
batteries, pesticides)
collected separately in your
ULB
20% of 35%
= 7
0.7 3.08
4.4 Is Sanitary waste
(Sanitary pads, diapers)
20% of 35%
= 7
0 2.1

Solid waste management initiative in Urban India
54
It is evident that ULBs in Tamil Nadu have improved their performance. As per the above table, Tamil Nadu achieved a score of 56.06 in 2017-18
and a score of 65.44 in 2018-19, which shows state improved in relevant aspects of solid waste management in 2018-19 as compared to 2017-
18. This is corroborated by the SS 2018 and SS 2019 results. Whereas TN was ranked 13th in 2018, it attained 12th rank 2019. For detailed
description and weights calculation, please refer Annexure 4.
collected separately in your
ULB
5. Scientific
disposal
15% 5.1 Does your ULB have
designated landfill site
100% of 15%
= 15
6 6.75 o 2018-19 showed better
performance.
o It achieved a score of 6 in 2017-
18 and a score of 6.75 in 2018-
19 under scientific disposal
parameter.
Total
Percentage
100% Total Score 100 56.06 65.44

Solid waste management initiative in Urban India
55
3.3.5 Telengana
Parameters Percentage
assigned to
parameters
Questions
Score assigned to
each question
Score achieved Result
2017-18 2018-19
1. Waste
segregation at
source
15% 1.1 Does your ULB have any
kind of source segregation
50% of 15%
= 7.5
6.225 6 o 2017-18 showed better
performance.
o It achieved a score of 8.1 in
2017-18 and a score of 8.3 in
2018-19 under waste
segregation at source
parameter.
1.2 Type of segregation 50% of 15%
= 7.5
1.875 2.329
2. Segregated
storage and
collection of
waste
15% 2.1 Have you organized
segregated collection of
waste in your ULB
100% of 15%
= 15
7.5 10.2 o 2018-19 showed better
performance.
o It achieved a score of 7.5 in
2017-18 and a score of 10.2 in
2018-19 under segregated
storage and collection of
waste parameter.
Solid waste management initiative in Urban India
56
3. Door to Door
collection and
transportation
20% 3.1 Does your ULB have
provision for Door to Door
waste collection and
transportation
50% of 20%
= 10
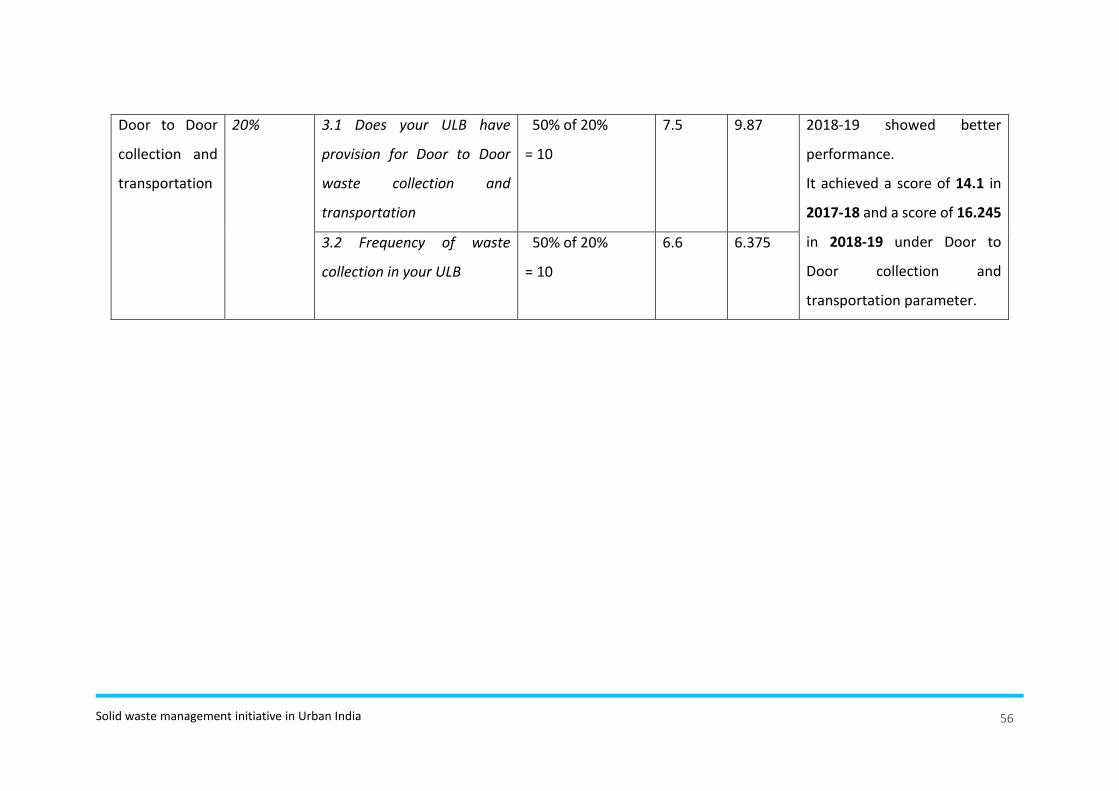
7.5 9.87 o 2018-19 showed better
performance.
o It achieved a score of 14.1 in
2017-18 and a score of 16.245
in 2018-19 under Door to
Door collection and
transportation parameter.
3.2 Frequency of waste
collection in your ULB
50% of 20%
= 10
6.6
6.375
Solid waste management initiative in Urban India
57
4. Processing of
streams of
waste
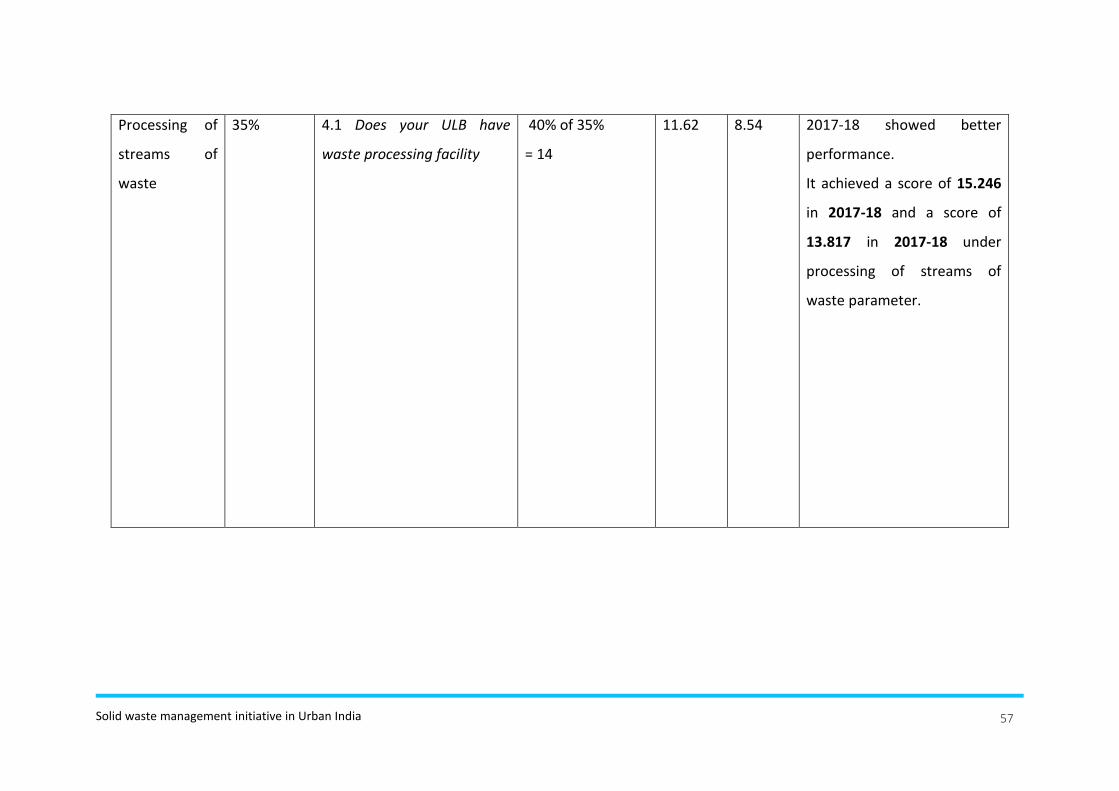
35% 4.1 Does your ULB have
waste processing facility
40% of 35%
= 14
11.62 8.54 o 2017-18 showed better
performance.
o It achieved a score of 15.246
in 2017-18 and a score of
13.817 in 2017-18 under
processing of streams of
waste parameter.

Solid waste management initiative in Urban India
58
4.2 In which different
streams waste is segregated
(material recovery facility,
composting, micro
composting center, facility
for dry waste
shredding/baling & selling to
recyclers, C&D waste, Bio
methenation, waste to
energy, any other)
20% of 35%
= 7
2.436 1.637
4.3 Is domestic hazardous
waste (e.g. CFL, tube-lights,
batteries, pesticides)
collected separately in your
ULB
20% of 35%
= 7
0 2.24
4.4 Is Sanitary waste
(Sanitary pads, diapers)
20% of 35%
= 7
1.19 1.4

Solid waste management initiative in Urban India
59
From the above table it is evident that ULBs in Telangana have improved their performance. From the above table, it can be seen that Telangana
achieved a score of 49.8 in 2017-18 and a score of 53.3 in 2018-19, which shows state improved in relevant aspects of solid waste management
in 2018-19 as compared to 2017-18. The gap between performance of the state in both the years is less. According to the SS results, the rank of
Telangana was 7th in 2018 and dropped to 8th in 2019. For detailed description and weights calculation, please refer Annexure 5.
Upon doing the impact analysis of capacity building SBM SWM Exposure workshops conducted by NIUA for ULB officials from 2016, it is evident
that there is substantial improvement in the SBM parameters such as segregation, processing and safe disposal as derived from the answers to
questionnaires filled by the workshop participants from various ULBs in 2017 and 2018-19. Added below are the key findings and
recommendations of the analyses from the selected states.
collected separately in your
ULB
5. Scientific
disposal
15% 5.1 Does your ULB have
designated landfill site
100% of 15%
= 15
4.95 4.8 o 207-18 showed better
performance.
o It achieved a score of 4.95 in
2017-18 and a score of 4.8 in
2018-19 under scientific
disposal parameter.
Total
Percentage
100% Total Score 100 49.8 53.3

Solid waste management initiative in Urban India
60
3.4 Key Findings and Conclusion of Evaluation Study
o Decentralized model
In 2018-19, eighty workshops were conducted in 43 locations across the country. Conducting workshops in different location helped ULBs to
reflect challenges of their own place and contextualize the issue while it was also convenient to attend decentralized workshops due to ease of
travel. More number of such training is required to create awareness on the issue of SWM.
o Improvement in relevant aspect of SWM
Study results demonstrate that percentage of source segregation increased in 2018-19 as compared to 2017-18. It shows ULBs have developed
understanding of streams of waste and now many ULBs are practicing, 3-way, 4-way and 5-way waste segregation. Almost every state shows
that segregated collection of hazardous and sanitary waste has increased. This implies an increase in awareness among citizens and ULBs
regarding such waste. It also implies that concern for environment and health has increased over period of time. More ULBs are now aware
about waste processing and implementing trash to cash approaches. Streams of waste processing like micro composting, Bio methenation, C&D
waste recycling and MRF facilities have increased. Only Telangana shows less improvement in 2018-19 as compared to 2017-18. The reason
could be that Telangana had capacity building training after SS 2019 assessment.
o Result corroboration with Swachh Survekshan 2019
Study results corroborated with SS 2019. Odisha and Tamil Nadu show improvement in SS 2019 ranking while there is slight drop in the
performance of Telangana and Jharkhand. This could be due to more lenient parameters during SS 2018. Study result also shows that there are

Solid waste management initiative in Urban India
61
some instances where some processing facilities set up in 2017-18 had to be shut down because of poor selection of technology, design,
unavailability of feedstock etc. that’s why city not performing well as compared to previous year (2017-18).
o Increase in outreach
Study evaluated the impact of capacity building workshop on ULBs. It shows that participation of municipal officers from different cities and
states has improved. In 2017, 423 municipal officials were trained while this number increased up to 3384 in 2018-19. Decentralized model is
adopted in 2018-19. Participants found it convenient to attend due to ease of travel.
o Impact of workshop
Our study results confirm that understanding and performance of municipal officers improved in 2018-19 as compared to 2017-18. Over 50 cities
are now more than 50% compliant to SWM Rules 2016, while in 2016-17, very few cities were able to achieve this. It is evident that continuous
training has a positive impact on performance of states and cities and to sustain the impact, workshop has been planned and executed in such
a manner, so as to bring about a behavioral change among the participants. Workshop is designed to incorporate a learner’s previous experiences
in order to enhance their current and future learning. There should be more exposure to such kinds of workshops to strengthen the
understanding and implementation of SWM Rules and plans.
o Group Activity during workshop
Our study results confirm that understanding and performance of municipal officers improved in 2018-19 as compared to 2017-18. Analysis of
the group activities show that challenges have shifted from technology and citizen engagement in 2016, 2017 respectively to requirement of
funds in 2018-19.

Solid waste management initiative in Urban India
62
3.5 Limitations of Evaluation Study
o Sample size
Although the number of participating states in both the years were same, i.e. twenty-seven, the number of participants varied from 423 in 2017-
18 to 3439 in 2018-19. Due to this variation, the sample size chosen for the 2017-18 study is different from the sample size chosen for 2018-19
study. However, the study under these limitations tries to do an exploratory analysis to understand the variation in the states of the chosen
parameters for the year 2017-18 and 2018-19. Another fact to be highlighted is that the study reflects their understanding from responses
obtained from the participants during the workshops.
o Comparative study
Twenty-seven states were covered in both the years but municipal officials from different cities within the states were trained and their
responses elicited from the questionnaire in 2017-18 and 2018-19. In both years, officials from class I, II and III cities were selected for training
(i.e. SBM-SWM Exposure Phase II and Phase III workshops). However, we could get representative data from only some states. Furthermore,
same individuals were not asked to fill the questionnaires and neither the same cities taken in the selected state. This was a limitation which
could not be overcome.
o Result interpretation
Since the process of capacity building of municipal officials for complying with SWM Rules 2016 started only in 2016-17, there is a possibility
that some of the responses of the participants to some questions regarding source segregation, collection and processing of different streams
of waste could be reflecting a certain lack of understanding of the terminology and stringency of standards that needed to be met which may
Solid waste management initiative in Urban India
63
be causing discrepancy in the results. Better training and clarity in understanding the SWM Rules 2016 in 2018-19 have helped in eliciting honest
and distinct responses to similar questions.
The above mentioned limitations have been taken note of while analyzing the data, interpreting it and recommending improvements for
subsequent training initiatives and follow up on implementation. Efforts would be made to have larger representative samples to minimize the
above limitations in the coming years.

Solid waste management initiative in Urban India
64
4. Assessment of Training Entities
4.1 Background
Thirteen training entities were selected by NIUA through a competitive process (RFP process) as partner organizations to conduct the SBM-SWM
city cluster exposure workshops for 1600 Urban Local Bodies (ULB) and 3200 ULB officials in India. These training entities were assessed by NIUA
(using the monitoring checklist attached in Annexure 9) and were ranked based on the methodology given below.
4.2 Methodology
The workshops were conducted in 43 different locations in partnership with the 13 training entities and one was conducted by NIUA at Delhi. At
least one resource person from NIUA and MoHUA attended each workshop to monitor. The questions in the monitoring checklist was divided
into 5 major heads such as logistics, topics covered in workshop, workshop reports and field visit manual, group activity 1 and 2 as well as site
visits. Each workshop organized by the training entity was assessed based on these five parameters, each parameter carrying a maximum of 10
marks. For training entities, which has conducted, more than one workshop average score of the all workshops conducted was considered.
Based on the scores, training entities were ranked. Training entities were also asked to send a feedback form (attached in Annexure 10) on behalf
of NIUA to assess the challenges they have faced in conducting the workshop and their suggestions for improvement of this training program.

Solid waste management initiative in Urban India
65
Rank Training Entities Number of
workshops
Total
Marks
Challenges experienced in organizing the workshop (As mentioned in
feedback form given to Training entities)
1 Core CarbonX, Hyderabad 6 42 1. Difficulty in ensuring participation due to SS 2019
2 WMRC- AIILSG, Mumbai 8 41 Faced no difficulties in conducting workshops
3 TERI, Delhi 6 40 Difficulty in arranging accommodation and venue for the workshop
4 TERI, Guwahati 6 40 1.Difficulty in arranging transportation for the workshop
2. Coordination issues with ULB officials
3.Difficulty in ensuring participation
4.Difficulty in arranging the dignitaries
5 TNIUS, Coimbatore 6 39 1. Difficulty in ensuring participation from Kerala &Tamil Nadu due to flood
and cyclone
2. Difficulty in arranging the dignitaries as the honorarium and TA allotted was
insufficient
6 Feedback foundation,
Gurugram
8 39 1. Difficulty in ensuring participation
2. Difficulty in arranging accommodation and venue for the workshop
7 AIILSG, Delhi 6 38 1.Difficulty in arranging venue for the workshop
2. Coordination issues with ULB officials
8 Hasiru Dala, Bengaluru 6 37 Faced no difficulties in conducting workshops
9 Environ, Guwahati 2 37 Faced no difficulties in conducting workshops

Solid waste management initiative in Urban India
66
10 Engineering Staff College of
India, Hyderabad
8 36 Faced no difficulties in conducting workshops
11 SMS Envocare, Ghaziabad 6 36 1. Difficulty in arranging field visit for the workshop
2.Coordination issues with ULB officials 3.Difficulty in ensuring participation
12 ICUC Consultants and IPCA,
Delhi
6 35 1. Difficulty in arranging venue for the workshop
2. Coordination issues with ULB officials
3. Delay in receiving permission from state government for conducting the
workshop
13 ICLEI South Asia 5 34 Difficulty in arranging venue and accommodation for the workshop
4.3 Conclusion
While all the partner TEs were effective in delivering the number of workshops that they were supposed to and as per the MOU signed by them
with NIUA, some were better than others in conducting the workshop.

Solid waste management initiative in Urban India
67
5. OVERALL KEY FINDINGS, RECOMMENDATION AND WAY FORWARD
The City Cluster Workshops brought to light several challenges faced by Urban Local Bodies (ULBs) in the field of Solid Waste Management
(SWM) as well as strategies and good approaches adopted by certain ULBs in resolving and mitigating these challenges. The current section
elaborates key finding, recommendations and way forward based on the experience and collective wisdom of the NIUA Team and partner
Training Entities (TEs) after conducting the workshops all over the country. They have been substantiated by discussions between participants,
SWM Experts and elected representatives during the technical sessions of the workshops. In addition to this, interaction between participants,
site-in-charges and entrepreneurs during the field visits and consolidated feedback of the participants regarding SWM has helped in giving a final
shape to the recommendations and way forward.
5.1 Key Findings
o Effective dissemination of knowledge
Training entities have been selected through competitive process (through RFP), so that they had prior knowledge and experience of SWM and
in conducting capacity building workshops.
o On ground exposure
Besides orientation and technical session, participants also got a chance to visit best practices which are centralized and decentralized facilities
of solid waste management. It enables complete experience of the subject and helps in learning through experience.

Solid waste management initiative in Urban India
68
o Green feature
The salient feature of the workshops held in this series is that all the workshops were green events. For instance, the participants were provided
with file folders, bags, pens, manuals and note books made from recycled material made by NGOs in and around Delhi. Single use plastics were
avoided to the maximum extent possible; for instance participants were provided reusable metal water bottles and other material in reusable
bags, containers etc. It helped in habit formation among the participants.
o Effective and convenient model
Conducting workshops in different locations helped ULBs to reflect challenges of their own place and contextualize the issue while it was also
convenient to attend decentralized workshops due to ease of travel. More number of such training is required to create awareness on the issue
of SWM.
o Effective knowledge sharing
Module is designed in such as way that the participants can discuss their problems and challenges with the other participants through group
activities and while they are provided a platform for peer learning by sharing personal experience and knowledge with others.
o Focus on knowledge sharing
The key objective of the workshop is to design sessions as a knowledge sharing platform. Workshop had two brainstorming group activities
which helped them to think about possible and sustainable solutions for sustainable SWM.

Solid waste management initiative in Urban India
69
Figure 3 Overall Key Findings

Solid waste management initiative in Urban India
70
5.2 Recommendations
o Focus on making the module more structured
The training module should incorporate certain necessary modifications and tweaks in the 3-day training sessions, and emphasis should be laid
more in making it specific rather than subjective.
o Session of SWM Rules to be made more precise and succinct
The session on SWM Rules can be made more precise and interesting by the use of charts and infographics. Sessions on EPR, Bye laws formulation
and notification, regulating Bulk Waste Generators (BWGs) etc., can be included.
o Incorporation of ICT component within the training module
Highlighting the importance of biometrics, RFID, sensor based SWM assets, use of Swachhta App, Citizen validation and use of MIS for better
performance in Swachh Survekshan should be important components within the module.
o Dedicated session for Training of Trainers (TOT)
To ensure that the capacity building exercise is continuous and reaches the grass-root workers of SWM, a session should be dedicated as to how
the training so provided would be imparted by the trainees to their colleagues and other workers down the hierarchy.
o Linking Waste Management with job creation
Solid waste management initiative in Urban India
71
Elimination of single use plastic by promoting the use of reusables and upcycled products, and simultaneously facilitating skill development of
marginalized groups in preparation of such products should be encouraged.
o Emphasis on health outcomes of SWM
The training should stress on the impact of SWM and cleanliness in ensuring public health, preventing spread of diseases and epidemics thereby
promoting a healthier community. Concepts on ODF, ODF+, ODF++, Sustainable Sanitation should be emphasized.
o Creation of a National Resource Base
Regional workshops to be conducted not only for the Training Institutes (TIs) but also for individual resource persons to expose them to regional
good practices in SWM. Thus the capacity building exercise should cater to both the individuals/ institutions.
o Workshops for elected representatives
Dedicated workshops for orientation of elected representatives should be conducted. Additionally, a combination of inter-state as well as intra
state workshops would not only help in peer learning, but would also take care in optimizing travel time and cost.

Solid waste management initiative in Urban India
72
5.3 Way Forward
o Cross Learning
Participants expressed the desire for cross-learning - that is, officials from a particular region wanted to see initiatives in another city of a similar
size as theirs and having similar geographical terrain e.g. small municipalities, hilly cities, pilgrimage cities etc. This is helpful since cities with
similar situations learn from each other. The similarities could be in terms of population size and demography, administrative set-up and financial
status.
o Twinning of cities
It is a tested method of peer learning. In this approach, the city that has achieved considerable success at scale is the mentor and helps another
recipient city to imbibe lessons and implement good initiatives. This also includes handholding by experts that have been instrumental in the
achievements of the mentor city.
o Capacity building for smaller cities
Exclusive workshops can be designed for smaller towns with population of up to 10,000, 20,000 to 50,000. Many a times, such cities do not have
dedicated staff to work on solid waste management. In such cases, it is imperative to sensitize the decision makers like administrative heads and
elected representatives even at the state level.
o Capacity building of elected representatives

Solid waste management initiative in Urban India
73
In most cities, the ULB officials have stated that success also depends on how well the elected representatives, administrative officials and
experts work in tandem to make and keep a city clean. For this to happen it is very important to also have similar exposure workshops and
capacity building of elected representatives like the Mayors and Councilors.
o Focus on Convergence
Dedicated workshops can be delivered focusing on convergence programmes related to solid waste management, livelihood generation and skill
training.
o Continuous capacity building
Lastly, capacity building is a continuous process. If capacity building and handholding are clubbed together, chances of success become higher.
For example, the exposure workshops can be followed by handholding workshops with cities on preparing sustainable action plans, technology
selection tools and business models for Solid Waste Management in their cities.

Solid waste management initiative in Urban India
74
Swachh Survekshan 2020
“Swachh Bharat Mission” (Urban) was launched on 2nd October 2014 for 5-year period with the objective of achieving 100% open defecation
free (ODF) status and putting in place systems to achieve 100% solid waste management in all Urban Local Bodies (ULBs) in the country. In order
to foster a healthy competition between cities for improving cleanliness standards, a ranking exercise named ‘Swachh Survekshan’ was
introduced by the Government to assess the cities and towns for their levels of cleanliness and active implementation of the Swachhta mission
initiatives in a timely and innovative manner.
The objective of the survey has been to encourage large scale citizen participation, ensure sustainability of initiatives taken towards garbage free
and open defecation free cities, provide credible outcomes which would be validated by third party certification, institutionalize existing systems
through online processes and create awareness amongst all sections of society about the importance of working together towards making towns
and cities a better place to live in. Additionally, the survey also intends to foster a spirit of healthy competition among towns and cities to improve
their service delivery to citizens, towards creating cleaner cities and towns.
The first Swachh Survekshan was conducted by The Ministry of Housing and Urban Affairs (MoHUA) in the year January 2016. 73 cities were
ranked under Swachh Survekshan 2016. This was followed by ‘Swachh Survekshan-2017’ conducted in January-February 2017 where 434 cities
were ranked. The third round of survey ‘Swachh Survekshan-2018’ was a quantum leap of scale as it was conducted across 4,203 cities, in a
record time of 66 days, becoming the largest ever sanitation survey in the world, impacting around 40 crore people. For the year 2019, the
survey was conducted across 4,237 towns and cities between January 4th – 31st , 2019. It was a completely digital and paperless survey completed
in a record time of 28 days.
Solid waste management initiative in Urban India
75
SS 2019 was not only significantly wider than the earlier editions in terms of scale but it also brought about substantial impact on the ground
through a holistic citizen centric engagement. Some of the key highlights of SS 2019 are as follows:
90,000 residential/ commercial areas were inspected
64 lakhs citizen feedback were collected
18,000 Garbage Vulnerable Points were transformed
84,000 waste pickers were integrated into Urban Local Bodies
There was a Social media outreach of 4.5 crores
1 crore citizens participated in the Survekshan through Swachh Manch.
6.1 Swachh Survekshan 2020
The 5th edition of the annual cleanliness survey of urban India was launched on June 6th 2019 at the Ministry of Housing and Urban Affairs
(MoHUA), New Delhi. With the objective of ensuring sustainability of the on ground performance of cities along with continuous monitoring of
service level performance when it comes to cleanliness, Swachh Survekshan 2020 is designed to conduct quarterly cleanliness assessment
(Swachh Survekshan League 2020) of cities and towns and the performance of which shall be integrated with Swachh Survekshan 2020 to be
conducted between January - February 2020 by MoHUA. For Swachh Survekshan-2020 (SS-2020) assessments, cities will be asked to upload
documents in support of the progress claimed during SSLeague-2020. If any discrepancy is observed between the document and progress claimed
for Swachh Survekshan League-2020, adjustment/ negative marking will be applied appropriately and marks will be revised accordingly. The
revision in marks may also lead to correction in the rank achieved.

Solid waste management initiative in Urban India
76
6.2 SS league 2020
Swachh Survekshan League 2020 (SS League 2020) has been introduced with the objective of sustaining the on ground performance of cities
along with continuous monitoring of service level performance when it comes to cleanliness. SS League 2020 will be conducted in 2 quarters
from April- June and July – September 2019. SS 2020 shall be conducted in the and October- December 2019 quarter. A weightage of 2000 marks
is dedicated for each quarter of SS league 2020 to be evaluated on the basis of monthly updation of SBM-U online MIS by cities along with
citizen’s validation on the 12 service level progress indicators through outbound calls. The assessment of SS league 2020 in the two quarters will
together determine the quarterly ranking of cities. Ranks will be assigned in two categories, namely, cities with population of one lakh and above
and cities with population of less than 1 lakh. The performance of cities in SS League 2020 will be crucial to their ranking in Swachh Survekshan
2020 due to the 25% weightage of the quarterly assessments to be included in the annual survey in January 2020.

Solid waste management initiative in Urban India
77
Solid waste management initiative in Urban India
78
6.3 Comparing the Structure of the SS 2019 and SS 2020:
As compared to Swachh Survekshan 2019, which was of total 5000 marks, Swachh Survekshan 2020 has a total mark limit of 4000 marks. Of the
total 4000 marks,
25% (1000 marks) has been assigned to Direct Observation under SS 2020.
25% (1000 marks) has been assigned for SS2020 –certifications.
25% (1000 marks) has been assigned for SLP (Service Level Progress) and Citizens Feedback, and
25% (1000 marks) has been assigned for SS league 2020.

Solid waste management initiative in Urban India
79

Solid waste management initiative in Urban India
80
6.4 SS league 2020 has two main parameters:
Service Level Progress: For the assessment of service level progress, SBM on-line MIS portal has to be updated on a monthly basis (by
5thday of following month). In case of resource constraints in ULBs to collate/update monthly MIS, the same may be outsourced through
a private company/agency under Capacity Building budget. Ward level data will have to be provided in MIS, wherever relevant. No
documents are required to be uploaded for the quarterly assessments.
• Citizens Validation: 12 Service Level Progress Indicators will be validated through outbound calls to Citizens. Population wise samples
have to be collected for citizen validation. (Refer SS league 2020 guidelines for further details). Indicators that are chosen for citizen
validation are discussed as below:

Solid waste management initiative in Urban India
81
S.No Questions Indicators to be Validated
1 Is your waste collected daily from your
house?
1.1 Percentage of Wards covered with operational Door to Door Collection of
waste
2 Whether you are asked to give segregated dry
and wet waste to your waste collector?
1.2 Percentage of Wards practicing source segregation of waste which is
maintained
till processing/disposal site.
Hazardous waste to be collected separately (in a separate bag/container)
3 Are you satisfied with the cleanliness level of
your surroundings?
1.6 100% Wards are Clean in the Urban Local Body (ULB)
4 Do you see use of polythene bag/200 ml
water bottles/single use plastic glasses for
water/juice in social functions/events
conducted in your city?
1.8 Plastic Waste Management Rules: Whether City has banned single use
plastic
including plastic with <50 micron from all festivals/social gatherings/events?
5 Do you see messaging or practice around
Waste Exchange Program/Crockery
Bank/Foodbank/Re-use and Recycle of goods
etc. in your city?
1.9 3R Principles: Whether measures taken to reduce generation of Dry/Wet
Waste? If yes, share details

Solid waste management initiative in Urban India
82
6 Do you see Construction & Demolition Waste
material lying unattended for >2 days in your
neighborhood?
2.6 Any mechanism in place to manage Construction & Demolition (C&D) waste
as per C&D Waste Management Rule, 2016? Whether plans in place to initiate
processing of C&D Waste?
7 Do you know ‘Home Composting’ is being
promoted in your community/city or do you
practice ‘Home Composting’?
2.11 Percentage of households processing their wet waste at Home/
Community Level (Households under RWAs will qualify under the BWG
definition)
8 Do you use Google Map to locate the nearest
Public Toilet or do you know location of Public
Toilets in your city are available on google
maps?
3.8 Percentage of Public Toilets (PTs) mapped on Google Maps
9 Are you aware that ranking of hotels, schools,
hospitals, RWA/Mohalla, Government Offices
and market areas is conducted in your city
4.1 Whether quarterly rankings of Swachh Hotel, School, Hospital (Healthcare
facility), RWA/Mohalla , Government Offices and Market Association
conducted?
10 Have you ever come across opportunities to
survey our city under Swachh Bharat Mission
(Urban) or do you see private
sector/NGO/SHG are supporting your city
under SBM?
4.2 Whether RWAs/NGOs/SHGs/Private Sector engaged through CSR to keep
your city clean –nature of engagement to be shared

Solid waste management initiative in Urban India
83
Of the 1000 marks under SS league 2020, 20% i.e. 800 marks are for service level progress and remaining 5% i.e. 200 marks are for average
ranking attained in quarter 1 and quarter 2 assessments.
6.5 Indicators under ‘Service Level Progress’ in SS League 2020
Some stark differences can be observed on comparing the service level parameters under SS 2019 and SS league 2020. In the SS league 2020
more emphasis has been laid on the Processing & Disposal of solid waste along with Capacity building and IEC components.
11 Do you know your city is participating in
‘Swachh Survekshan League 2020’?
4.3 Whether ‘Swachh SurvekshanLeague-2020’ promoted in your city?
12 Do you find Community/Public Toilets of your
cities are well maintained?
5.1 Whether Caretakers deployed at CT/PT are trained (as per SOPs on O&M
of CT-PT) on maintaining their facilities?

Solid waste management initiative in Urban India
84
The indicators for assessing each of the five parameters under SS League 2020 are discussed as below:
1. Parameter: Collection & Transportation:
Weightage: 25%;
Total Marks: 500;
Total Indicators: 9

Solid waste management initiative in Urban India
85
S.No Indicator Description Marks
1.1 Percentage of Wards covered
with operational Door to Door
Collection of waste
This parameter examines whether your ULB has a system in place for door-
to-door collection of waste. Coverage of wards means each and every unit of
household, commercial establishment and shops in the ward.
100
1.2 Percentage of Wards practicing
source segregation of waste
which is maintained
till processing/disposal site.
Hazardous waste to be collected
separately (in a separate
bag/container)
This parameter examines whether your ULB has a system in place for
collection of waste in segregated manner (Wet and dry waste). The
segregated waste thus collected should be maintained in two streams until
it reaches the processing plant/site or Material Recovery Facilities (MRF).
Coverage of wards means all households/commercial establishment in the
ward.
125
1.3 ICT based Monitoring Mechanism
in place for: Ward wise Collection
and Transportation (C&T),
Collection from Gates,
Monitoring of Garbage
This indicator examines the ICT enabled mechanisms by which the ULB
monitors its efficiency of the collection and transportation system, regularity
of its staff and sustaining the transformation/cleanliness of Garbage
Vulnerable Points. Cities with <1 lakh population can monitor Collection &
Transportation through a manual system.
40

Solid waste management initiative in Urban India
86
Vulnerable Points (GVPs) and
Sanitation Staff.
(Cities with <1 Lakh population
may opt for mobile phone based
monitoring. However, remote
areas if affected by network
issue, may monitor manually)
1.4 Percentage of Informal Waste
Pickers formally integrated into
Sustainable Livelihoods
Formally integrating the informal waste pickers helps improve the living
standards of urban poor by engaging them in areas including collection &
transportation, processing (Material Recovery Facilities etc.), construction/
maintenance of toilets. or engaged with National Urban Livelihood Mission
(NULM) and Skill India etc.
25
1.5 Benefits extended to all Sanitary
workers including Informal
Waste Pickers i.e. workforce
engaged under/through
Jaagirdari system, SHG, NGO,
SWM Rules 2016 mandates provision of Personal Protective Equipment(PPE)
to all workers involved in handling solid/liquid waste (engaged under
Jaagirdari, SHG, NGO, private Agency, regular/casual workers etc.).
40

Solid waste management initiative in Urban India
87
private agency, informal waste
pickers etc.
All Workers have been facilitated to link with at least two eligible government
schemes i.e, Ayushman Bharat/Pradhan Mantri Awas Yojna/Accidental
Insurance/Life Insurance/Ujjawala/Saubhagya/integration of NULM etc. or
any other state schemes.
Monthly recognition of best performing workers (name of workers and
reason for recognition to be shared)
Training imparted to workers on components under Swachh Bharat Missions
1.6 100% Wards are Clean in the
Urban Local Body (ULB)
Twice a day sweeping (including night sweeping) in all commercial areas,
once a day sweeping in all residential areas, transformation of Garbage
Vulnerable Points(GVP), no solid waste visible in storm water drains/water
bodies, up keeping of slums and old city areas e.g. no water logging,
roads/by-lanes are well maintained with no littering/dumping of waste etc.
50
1.7 Whether Storm Water Drains and
Water Bodies in all wards clean?
Storm water drains is designed to drain excess rain and ground water from
impervious surfaces such as paved streets, car parks, parking lots, footpaths,
40

Solid waste management initiative in Urban India
88
sidewalks, and roofs. Storm drains vary in design from small residential dry
wells to large municipal systems. ULBs are expected to make sure that storm
water drains are not choked with solid waste for free flow of the water.
Similarly, water bodies are an integral part of eco-system – need to get
protected from waste with scheduled cleaning and maintenance work.
1.8 Plastic Waste Management
Rules: Whether City has banned
single use plastic
including plastic with <50 micron
from all festivals/social
gatherings/events?
Single-use plastics, or disposable plastics, are used only once before they are
thrown away or recycled. These items are things like plastic bags, straws,
coffee stirrers, soda and water bottles and most food packaging.
This indicator would assess the extent of enforcement for discouraging one-
time use ‘Plastic’ in the city.
Considering the environmental degradation caused by one-time use plastics,
cities should work towards discouraging
its citizens from using single-use plastics in events conducted throughout the
year.
30
1.9 3R Principles: Whether measures
taken to reduce generation of
This indicator would assess the ULB’s effort to reduce the waste generated
by household/commercial/industrial establishments in the city and should
adopt the 3R principles. The focus should be on reducing the amount of
50

Solid waste management initiative in Urban India
89
Dry/Wet Waste? If yes, share
details
waste which is finally transported to the processing/disposal site or
processed through on-site composting.
2. Parameter: Processing & Disposal
Weightage: 35%;
Total Marks: 700;
Total Indicators: 13

Solid waste management initiative in Urban India
90
S.No Indicators Description Marks
2.1 Whether capacity of wet waste processing
facility/facilities in the city is matching with the
total wet waste generated by the city?
The indicator would assess whether a city has adequate
facility/infrastructure to process the wet waste generated
50
2.2 Percentage of total wet waste generated is
treated, either by decentralized or centralized
processing.
This indicator assesses the extent of decentralized and centralized
management of wet waste generated. The amount of wet waste
being sent to the landfill should be minimized.
150
2.3 Percentage of total dry waste (excluding plastic
and domestic hazardous waste) collected is
treated/re-used/recycled, either by
decentralized or centralized processing
This indicator assesses the extent of decentralized and centralized
management of dry waste generated. Is the dry waste of the city
being recycled or reused?
60
2.4 Percentage of total plastic waste collected is
treated/re-used/recycled, either by
decentralized or centralized processing
This indicator assesses the extent of decentralized and centralized
management of dry waste generated. Is the dry waste of the city
being recycled or reused?
40

Solid waste management initiative in Urban India
91
2.5 Percentage of total hazardous waste collected is
treated, either by decentralized or centralized
processing
This indicator assesses the extent of decentralized and centralized
management of hazardous waste generated in the city.
30
2.6
Any mechanism in place to manage Construction
& Demolition (C&D) waste as per C&D Waste
Management Rule, 2016? Whether plans in place
to initiate processing of C&D Waste?
This indicator assesses the extent of decentralized and centralized
management of C&D waste generated. The indicator would also
assess the extent of utilization of C&D waste in the city. How city is
tracking random dumping? Whether C&D Waste Helpline in place?
Availability of dedicated Vehicles? How C&D waste is being
managed? Any penalty system for throwing C&D waste in open
areas?
50
2.7 Remediation of existing dumpsites undertaken
and the stage of the same or no legacy waste
(dumpsite)
This parameter assesses whether remediation is being practiced or
whether the city is dumping waste in an unplanned manner as per the
SMW 2016 rules.
60

Solid waste management initiative in Urban India
92
2.8 Is the landfill in the city a sanitary landfill?
Or landfill not required/ Zero landfill city
This parameter assesses whether the land fill site of the ULB is
scientific/ planned in nature or in accordance with SWM 2016 rules.
50
2.9 Percentage of Bulk Waste Generators (BWG),
including those generating more than 100 Kgs (or
less as notified by the State/city) of waste per
day, practicing on site processing of their wet
waste or outsourced to private agency -
processing not outsourced to ULB. However,
cities with <1 Lakh population can outsource to
ULB on a commercial rate.
This parameter assesses whether the bulk waste generators in a city
(including RWAs) are practicing on site composting at their premises
or not. All such establishments generating more than 100 Kgs (or as
notified by the State/city) of waste per day are being considered as
bulk waste generator. Outsourcing of waste processing through ULB
will not be considered for marking against this indicator.
50
2.10 Whether City has empaneled service provider(s)
managing collection and processing of dry/wet
waste to cater Bulk Waste Generators (BWGs)
or households not being covered under Door-to-
Door Collection (details should be available on
public domain).
In cities with less than 10 Lakh population, ULBs
can provide similar arrangement (including
through NGO/SHG)
This indicator would check the coverage of waste collection and
processing of waste from establishment which otherwise could not
be catered through ULBs existent collection mechanism. This
arrangement will be like ‘On Call’ service for Gate to Gate collection
along with any social/public event. ULB should empanel private
service providers as a back-up of already established collection &
processing mechanism. Such agencies will act as a back-up
arrangement for the main collection and transportation services
provided by the ULB .
30

Solid waste management initiative in Urban India
93
2.11 Percentage of households processing their wet
waste at Home/ Community Level (Households
under RWAs will qualify under the BWG
definition)
This indicator assesses the extent of home composting being
practiced to manage wet waste generated in the city. IEC campaign
supported by proper handholding will help citizens to opt for home
composting, thus taking ownership of their wet waste
50
2.12 Percentage of Swachhta App/Local App
complaints covers issues related with
littering/garbage dumping/overflowing litter
bins
This indicator would assess the extent of complaints pertaining to
SWM received on Swachhta App/Local App. The ULBs efforts towards
maintaining cleanliness till date should be sustained.
40
2.13 What percentage of the operational cost of
Sanitation and Solid Waste Management is
covered by Property Tax, (SWM/sanitation sub
head), User Charges (for SWM/ sanitation
related services, Sale of city compost and
Advertisement rights on CT/PT and Litter Bins?
Salary expenses to Daily wagers, contractual or
outsourced staff through service providers(
against vacant posts) will be added along with
cost
To assess extent of cost recovery in solid waste management services 40

Solid waste management initiative in Urban India
94
3. Parameter 3: Sustainable Sanitation
Weightage: 30%;
Total Marks: 600;
Total Indicators: 11
S.No Indicators Description Marks
3.1 ULB/Development Authority/Cantonment Board
has prepared FSSM Action Plan or has notified San-
Benchmarks(prescribed in FSSM Policy at the least
adhering to all conditions defined for SBM ODF++,
in municipal bye-laws(or equivalent) and published
the same in atleast two dailies with wide reach OR
This indicator would assess the extent of planning done by ULBs
for Faecal Sludge and Septage Management and ODF++
certification. The ULB should disseminate the same with citizens
40

Solid waste management initiative in Urban India
95
it is not required if the city is 100% covered through
sewerage system.
3.2 What percentage of Households, Commercial
Institutions, Establishments and Public area
CTs/PTs are connected to a closed system such as
sewerage, septic tank + soak pit, twin-pit system
etc.
This indicator will ascertain whether the city has adequate
coverage of sewerage network or septic tanks
100
3.3 What percentage of faecal sludge collected from
Households/Commercial Establishments/ CTs/PTs
is treated at FSTP/STP-Scientific processing of
faecal sludge
This indicator will ascertain whether majority of the faecal sludge in
the city is being processed scientifically and not being discharged in
the open
120
3.4 Whether capacity of FSTP (Vs Collected)/STP(Vs
generated) in the city is matching with the total
faecal sludge generated by the city?
This indicator would assess whether the infrastructure to treat
entire faecal sludge generated in the city is available or not
60
3.5
Are de-sludging operators( de-sludging staff)
trained on safety related issues, registered with the
ULB and being monitored by the ULB (including Self
Help Groups registered under de-sludging activity)
This indicator assesses whether the de-sludging activities are being
monitored by the ULB or not. Uncontrolled dumping of faecal
matter within the city /outside city should be prohibited. This
50

Solid waste management initiative in Urban India
96
indicator will not be applicable on Cities with 100% sewerage
coverage –maximum Marks will be given
3.6 The city has issued and notified fines against
persons/de-sludging operators dumping untreated
faecal sludge in drains and/or open areas
This indicator assesses the regulatory control of the ULB to curb
dumping of untreated faecal sludge in drains or open areas
60
3.7 Whether plans are in place to reuse/recycle the
waste water to reduce the burden on fresh water?
Acknowledging the shortage of fresh water and efforts to conserve
fresh water, ULBs need to consider reuse and recycling of waste
water. Waste water can be re-used for irrigation, horticulture etc.
50
3.8 Percentage of Public Toilets (PTs) mapped on
Google Maps
Easy access to Public toilet will improve Public toilet usage. Floating
population will also get benefited by searching and accessing the
‘SBM toilets’ on google map.
60
3.9 Percentage of CT/PTs open from 6.00 am to 10.00
pm?
Easy and timely access to Community and Public toilet will improve
Community/Public toilet usage.
20
3.10
What percentage of Operations and Maintenance
costs of Community/Public Toilet are being
recovered through revenue streams viz. Property
This indicator would assess the sustainability of city’s infrastructure
towards Faecal Sludge and Septage Management.
20

Solid waste management initiative in Urban India
97
4. Parameter 4: IEC & Behaviour Change
Weightage: 10%;
Total Marks: 200;
Total Indicators: 3
tax (sanitation specific), User charges,
monetization of CT/PT etc.
3.11
What percentage of Operations and Maintenance
costs of FSTP and ULB owned vacuum tankers are
being recovered through revenue streams viz.
Property tax (sanitation specific), User charges, etc.
This indicator would assess the sustainability of city’s infrastructure
towards Faecal Sludge and Septage Management.
20

Solid waste management initiative in Urban India
98
S.No Indicators Description Marks
4.1 Whether quarterly rankings of Swachh
Hotel, School, Hospital (Healthcare
facility), RWA/Mohalla , Government
Offices and Market Association
conducted?
A sense of competition for cleanliness among Hotels, Schools,
RWAs/Mohalla, Hospital, Government Offices and registered
Market Associations will lead to improved overall experience
of places with maximum footfall of citizens. ULB need to
conduct ranking by June 2019.
70
4.2 Whether RWAs/NGOs/SHGs/Private
Sector engaged through CSR to keep your
city clean –nature of engagement to be
shared
This indicator would assess the ULB’s efforts to engage
citizens and stakeholders proactively. The idea is to ensure all
citizens and stakeholders take ownership of cleanliness
aspects in the city.
Private sector needs to be approached by the ULB for seeking
active contribution via CSR funds towards city’s infrastructure
requirements for cleanliness.
All such activities to be updated on Swachh Manch.
70

Solid waste management initiative in Urban India
99
5. Parameter 5: Capacity Building
Weightage: 5%;
Total Marks: 100;
Total Indicators: 3
4.3 Whether ‘Swachh SurvekshanLeague-
2020’ promoted in your city?
Cities are expected to promote Swachh Survekshan-2019
creative are placed at all prominent places of high citizen foot
fall to ensure participation. Besides, traditional approach, cities
are also encouraged to use ICT Based technology supporting
behavior change viz. interactive games/value added services
for creating better awareness and mobilizing citizens.
60

Solid waste management initiative in Urban India
100
S.No Indicators Description Marks
5.1 Whether Caretakers deployed at CT/PT
are trained (as per SOPs on O&M of CT-
PT) on maintaining their facilities?
The indicator would assess the extent to which caretakers are aware
about safe sanitation and cleanliness practices which would benefit
in the overall cleanliness of CT/PT to which they are assigned
40
5.2 Percentage of Sanitary Workers trained
and equipped for cleaning water
bodies/drains and installing waste
screening systems/filters in drains
This indicator would assess whether sanitary workers are aware and
equipped for cleaning water bodies , maintaining/installing waste
screening systems/filters.
40
5.3 Number of Gastro + Respiratory related
cases registered in the dispensary and/or
hospital of the Government between
April 2019 to June 2019 in comparison to
patients registered between April2018 to
June 2018
This indicator would assess whether Gastro +Respiratory disease
burden in the ULB/Cantt Board reduced in comparison with the
previous year
20

Solid waste management initiative in Urban India
101
6. Swachh Bharat Mission (Urban) Funds
Swachh Bharat Mission is one of the flagship programmes of Government of India having key objective to address both elimination of open
defecation and achieving solid waste management in all urban local bodies (ULBs) of India by 2019. The estimated cost of implementation of
SBM Urban is Rs. 62,009/-Crore, including Government of India share of Rs. 14,600/- Crore. The SBM guidelines have been revised upwards to
35% of project cost to ULBs as Central share (from 20% earlier) for SWM (Handbook of Urban Statistics, 2019)
It is estimated that another 25 per cent of the total cost would be borne by states/ULBs. The remaining funds are proposed to be generated
through other sources such as private sector participation, market borrowing, user charges, Corporate Social Responsibility (CSR), and the
Swachh Bharat Kosh. In FY 2019-20, GoI allocated 2,750 crores to the scheme, an increase of 10 per cent from the previous year's allocated
funds.

Solid waste management initiative in Urban India
102
Budget and Fund releases under the Mission
Total estimated funds for SBM Urban is Rs. 62,009/-Crore out of which 14600 Cr is shared by GoI on following components of SBM-U.
Construction of Individual Household Latrines (IHHLs), including conversion of insanitary toilets into pour flush latrines, Construction of
Community Toilets (CTs) and Construction of Public Toilets (PTs)- Approx. Rs. 4,800/- Crores has been allocated for ODF (these three
components)

Solid waste management initiative in Urban India
103
Solid Waste Management (SWM)- Approx. Rs. 7,400/- has been allocated
Information, Education and Communication (IEC) and Public Awareness. - Approx. Rs. 1,800/- Crores has been allocated
Capacity Building and Administration (CB&A). - Approx. Rs. 600/- Crores has been allocated
About Rs 4,874/- Crores is shared by state government and balance funds (Rs. 42,535/- Crore) to be generated through other sources.
Released till date (31st March, 2019) – Rs. 8720 crores have been released under various Mission components till date. The breakup of Mission
allocation of various components and year-wise releases are given in the table below:
SWACHH BHARAT MISSION (URBAN) - FINANCIAL PROGRESS - FIGURES ARE IN CRORE
Year
Release (Rs. In crores) for various components
IHHL CP/PT SWM IEC CB Total
2014-2015 367.61 85.03 287.50 95.59 23.75 859.48
2015-2016 694.68 35.04 286.46 79.15 13.04 1108.16
2016-2017 699.11 157.60 916.70 307.58 56.38 2137.38
2017-2018 531.84 225.96 1302.59 345.17 136.16 2541.74
2018-2019 (till 31st March) 427.44 93.74 1347.22 141.26 64.27 2073.96
Total (Till 31st March, 2019) 2740.48 597.39 4140.48 968.78 293.61 8720.74
Mission allocation 4819.79 7365.82 1827.85 609.27 14622.73
Similarly, followings tables shows funds allocated to states and funds release till 31st march, 2019 (Source: Handbook of Urban Statics, 2019)

Solid waste management initiative in Urban India
104
Sl.
No. State/UT
Mission Allocation
IHHL CT SWM IEC CB Total
1 A&N Islands 0.43 0.10 2.50 0.39 0.10 3.52
2 Andhra Pradesh 184.08 27.95 308.54 40.61 10.15 571.33
3 Arunachal Pradesh 13.40 0.35 7.25 12.22 3.06 36.28
4 Assam 81.95 2.31 76.76 66.62 16.66 244.30
5 Bihar 218.90 45.27 259.96 47.64 11.91 583.68
6 Chandigarh 2.45 0.53 22.24 2.24 0.56 28.02
7 Chhattisgarh 140.76 34.40 131.53 40.93 10.23 357.85
8 Dadra & Nagar Haveli 1.20 0.17 2.27 0.39 0.10 4.13
9 Daman & Diu 0.29 0.06 1.57 0.53 0.13 2.58
10 Delhi 50.16 5.15 263.68 24.61 6.15 349.75
11 Goa 3.21 0.48 9.29 3.29 0.82 17.09
12 Gujarat 162.56 32.22 536.22 82.52 20.63 834.15
13 Haryana 86.67 10.61 181.80 30.40 7.60 317.08
14 Himachal Pradesh 14.02 0.90 15.22 11.05 2.76 43.95
15 Jammu & Kashmir 102.63 3.69 67.99 21.06 5.26 200.63
16 Jharkhand 92.41 21.08 122.68 18.03 4.51 258.71
17 Karnataka 355.35 44.31 512.52 84.62 21.16 1017.96
18 Kerala 70.62 1.53 121.35 21.19 5.30 219.99
19 Madhya Pradesh 292.79 65.42 434.01 102.26 25.56 920.04
20 Maharashtra 359.90 57.57 1081.84 142.79 35.70 1677.80
21 Manipur 47.46 0.28 14.72 16.51 4.13 83.10
22 Meghalaya 5.82 0.16 8.69 7.56 1.89 24.12
23 Mizoram 18.08 0.08 13.22 14.11 3.53 49.02
24 Nagaland 26.59 0.19 11.69 12.02 3.00 53.49
25 Odisha 161.33 33.82 138.05 31.06 7.76 372.02
26 Puducherry 6.78 1.57 17.30 2.63 0.66 28.94

Solid waste management initiative in Urban India
105
27 Punjab 78.66 8.45 220.97 44.75 11.19 364.02
28 Rajasthan 225.01 35.73 363.46 65.01 16.25 705.46
29 Sikkim 2.63 0.06 3.42 4.33 1.08 11.52
30 Tamil Nadu 338.02 93.52 689.87 186.47 46.62 1354.50
31 Telangana 133.31 20.24 223.43 29.41 7.35 413.74
32 Tripura 68.65 0.12 15.51 12.87 3.22 100.37
33 Uttar Pradesh 473.28 80.03 940.91 197.41 49.35 1740.98
34 Uttarakhand 30.30 1.59 57.57 18.03 4.51 112.00
35 West Bengal 315.33 24.82 487.79 66.72 16.68 911.34
STATE/UT 4165.03 654.76 7365.82 1462.28 365.57 14013.46
MOUD 365.57 243.70 609.27
TOTAL 14622.73
Sl.
No. State/UT
Released
IHHL CT SWM IEC CB Total
1 A&N Islands 0.06 0.94 0.40 0.29 0.00 1.69
2 Andhra Pradesh 110.47 54.72 308.54 26.50 9.64 509.86
3 Arunachal Pradesh 7.72 0.28 6.84 9.08 2.51 26.43
4 Assam 70.20 2.31 76.76 19.26 5.60 174.13
5 Bihar 150.02 35.21 182.19 8.77 9.75 385.95
6 Chandigarh 1.59 0.26 13.45 0.85 0.34 16.50
7 Chhattisgarh 140.76 39.00 126.93 40.93 10.23 357.85
8 Dadra & Nagar Haveli 0.64 0.05 0.00 0.39 0.03 1.11
9 Daman & Diu 0.29 0.06 0.00 0.27 0.10 0.71
10 Delhi 25.08 5.15 116.24 11.20 0.21 157.88
11 Goa 2.36 0.22 5.93 2.93 0.42 11.86
12 Gujarat 171.55 13.99 536.22 51.44 12.80 786.00

Solid waste management initiative in Urban India
106
13 Haryana 32.96 24.10 57.66 2.69 5.30 122.70
14 Himachal Pradesh 4.38 1.33 12.16 3.67 1.53 23.07
15 Jammu & Kashmir 46.39 10.39 39.45 12.77 3.59 112.59
16 Jharkhand 71.30 4.16 113.74 15.24 4.99 209.44
17 Karnataka 157.80 41.03 313.51 29.66 17.62 559.62
18 Kerala 31.67 0.00 51.64 11.45 2.42 97.18
19 Madhya Pradesh 262.83 65.42 301.75 80.13 11.24 721.36
20 Maharashtra 317.32 45.46 453.05 28.88 13.28 857.99
21 Manipur 27.78 0.28 9.61 5.86 1.84 45.36
22 Meghalaya 2.70 0.04 4.09 1.41 0.11 8.35
23 Mizoram 7.10 2.63 8.21 11.14 2.81 31.89
24 Nagaland 17.12 1.45 7.14 9.01 2.00 36.72
25 Odisha 75.03 28.53 28.29 11.67 2.32 145.84
26 Puducherry 4.54 1.11 2.12 0.83 2.87 11.48
27 Punjab 41.00 15.95 120.38 14.78 1.08 193.19
28 Rajasthan 166.25 41.18 344.26 45.50 14.16 611.35
29 Sikkim 0.59 0.75 2.52 1.57 0.52 5.95
30 Tamil Nadu 209.84 71.38 579.04 105.88 9.63 975.77
31 Telangana 66.91 1.34 111.72 11.61 4.67 196.25
32 Tripura 7.61 1.97 7.76 7.72 1.93 26.99
33 Uttar Pradesh 367.89 172.70 427.73 176.09 48.80 1193.20
34 Uttarakhand 22.95 7.18 7.55 3.43 1.69 42.80
35 West Bengal 167.14 8.27 199.80 24.02 11.19 410.42
STATE/UT 2789.86 698.82 4576.67 786.93 217.20 9069.48
MOUD 361.41 112.80 474.21
TOTAL 9543.69

Solid waste management initiative in Urban India
107