Robert P. Hartwig, Ph.D., CPCU, President
89
Insurance & The Insurance Cycle Medical Professional Liability & the P/C Insurance Industry Robert P. Hartwig, Ph.D., CPCU, President Insurance Information Institute 110 William Street New York, NY 10038 Tel: (212) 346-5520 Fax: (212) 732-1916 [email protected] 31 st Annual Physician Insurance Association of America Meeting Philadelphia, PA May 15, 2008
-
Upload
signe-donaldson -
Category
Documents
-
view
22 -
download
0
description
Medical Malpractice Insurance & The Insurance Cycle Medical Professional Liability & the P/C Insurance Industry. 31 st Annual Physician Insurance Association of America Meeting Philadelphia, PA May 15, 2008. Robert P. Hartwig, Ph.D., CPCU, President - PowerPoint PPT Presentation
Transcript of Robert P. Hartwig, Ph.D., CPCU, President
Medical Malpractice Insurance & TheInsurance Cycle
Medical Professional Liability & the P/C Insurance Industry
Robert P. Hartwig, Ph.D., CPCU, PresidentInsurance Information Institute 110 William Street New York, NY 10038
Tel: (212) 346-5520 Fax: (212) 732-1916 [email protected] www.iii.org
31st Annual Physician Insurance Association of America Meeting
Philadelphia, PAMay 15, 2008
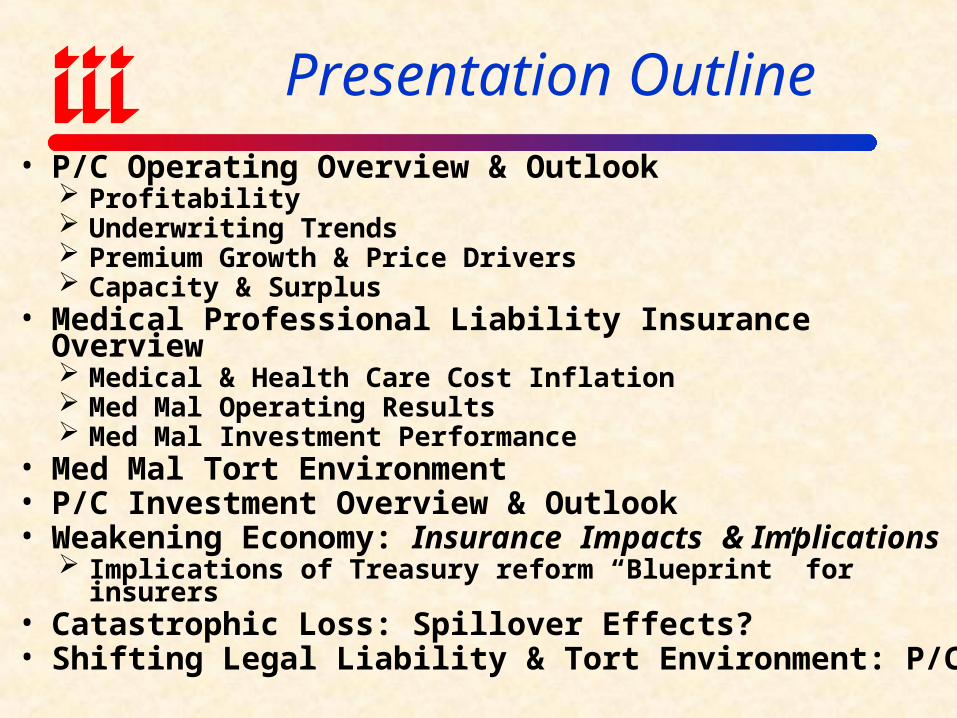
Presentation Outline
• P/C Operating Overview & Outlook Profitability Underwriting Trends Premium Growth & Price Drivers Capacity & Surplus
• Medical Professional Liability Insurance Overview Medical & Health Care Cost Inflation Med Mal Operating Results Med Mal Investment Performance
• Med Mal Tort Environment• P/C Investment Overview & Outlook• Weakening Economy: Insurance Impacts & Implications
Implications of Treasury reform “Blueprint” for insurers• Catastrophic Loss: Spillover Effects? • Shifting Legal Liability & Tort Environment: P/C
P/C INSURANCE OPERATING OVERVIEW
The Cycle is Alive and Well
PROFITABILITY
Insurer Profits in 2006/07 Reached Their Cyclical Peak
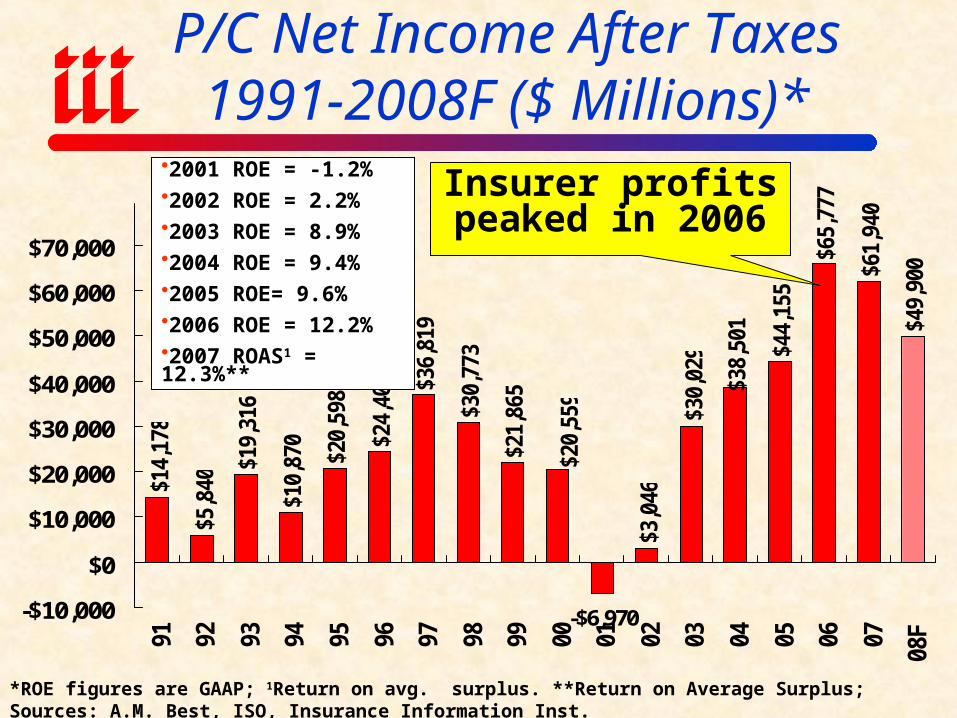
P/C Net Income After Taxes1991-2008F ($ Millions)*$1
4,17
8
$5,8
40
$19,
316
$10,
870
$20,
598
$24,
404 $3
6,81
9
$30,
773
$21,
865
$3,0
46
$30,
029
$61,
940
$49,
900
-$6,970
$65,
777
$44,
155
$20,
559
$38,
501
-$10,000
$0
$10,000
$20,000
$30,000
$40,000
$50,000
$60,000
$70,000
91 92 93 94 95 96 97 98 99 00 01 02 03 04 05 06 07
08F
*ROE figures are GAAP; 1Return on avg. surplus. **Return on Average Surplus; Sources: A.M. Best, ISO, Insurance Information Inst.
2001 ROE = -1.2%2002 ROE = 2.2%2003 ROE = 8.9%2004 ROE = 9.4%2005 ROE= 9.6%2006 ROE = 12.2%2007 ROAS1 = 12.3%**
Insurer profits peaked in 2006
-5%
0%
5%
10%
15%
20%
87 88 89 90 91 92 93 94 95 96 97 98 99 00 01 02 03 04 05 06 07
08F
US P/C Insurers All US Industries
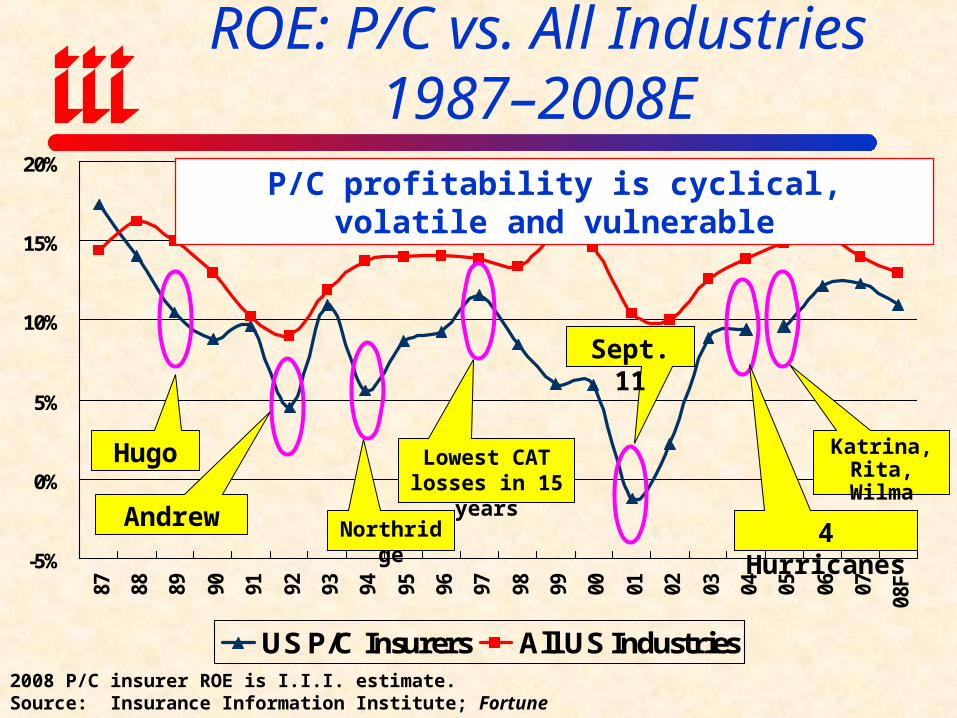
ROE: P/C vs. All Industries 1987–2008E
2008 P/C insurer ROE is I.I.I. estimate.Source: Insurance Information Institute; Fortune
Andrew Northridge
Hugo Lowest CAT losses in 15 years
Sept. 11
4 Hurricanes
Katrina, Rita, Wilma
P/C profitability is cyclical, volatile and vulnerable
-5%
0%
5%
10%
15%
20%
25%
75 76 77 78 79 80 81 82 83 84 85 86 87 88 89 90 91 92 93 94 95 96 97 98 99 00 01 02 03 04 05 0607
E08
F
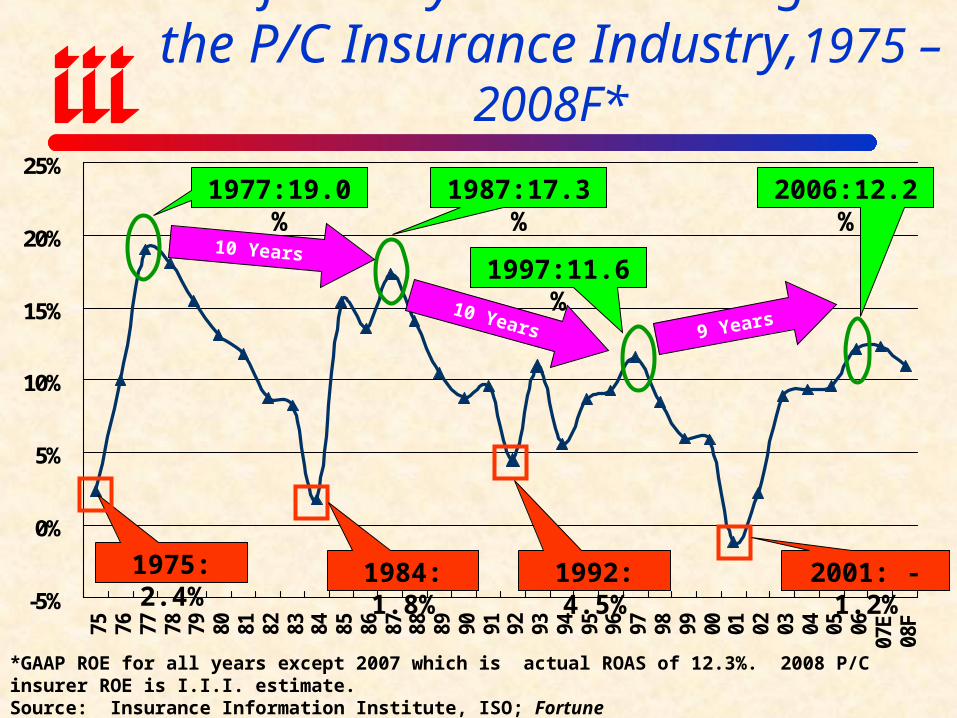
Profitability Peaks & Troughs in the P/C Insurance Industry,1975 – 2008F*
1975: 2.4%
1977:19.0% 1987:17.3%
1997:11.6%
2006:12.2%
1984: 1.8% 1992: 4.5% 2001: -1.2%
10 Years
10 Years 9 Years
*GAAP ROE for all years except 2007 which is actual ROAS of 12.3%. 2008 P/C insurer ROE is I.I.I. estimate.Source: Insurance Information Institute, ISO; Fortune
-4%
-2%
0%
2%
4%
6%
8%
10%
12%
14%
16%
18%
91 92 93 94 95 96 97 98 99 00 01 02 03 04 05 06 07
ROE Cost of Capital
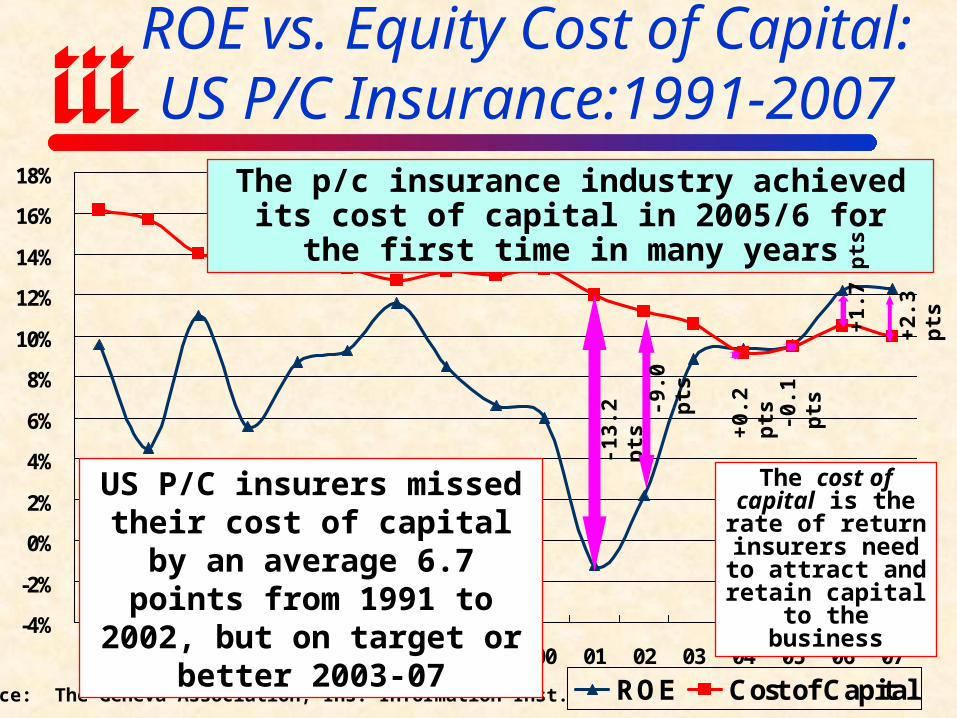
ROE vs. Equity Cost of Capital:US P/C Insurance:1991-2007
Source: The Geneva Association, Ins. Information Inst.
The p/c insurance industry achieved its cost of capital in 2005/6 for the first time in many years
-13.
2 p
ts
+0.
2 p
ts
US P/C insurers missed their cost of capital by an average 6.7 points from 1991 to 2002, but on
target or better 2003-07
-0.1
pts
+1.
7 p
ts
-9.0
pts
The cost of capital is the rate of return
insurers need to attract and retain
capital to the business
+2.
3 p
ts
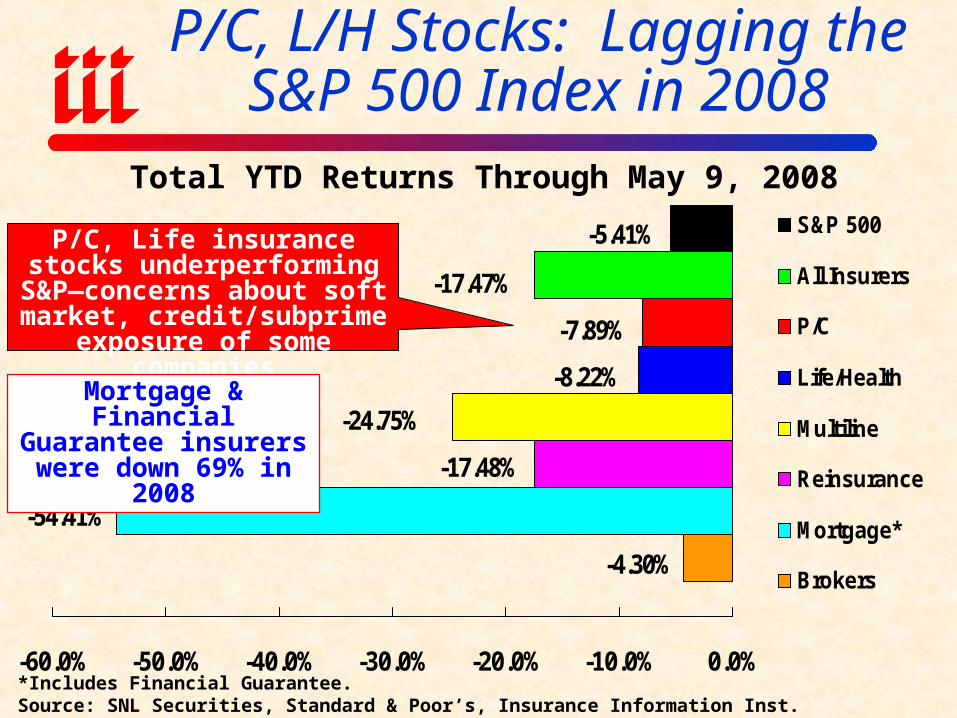
P/C, L/H Stocks: Lagging the S&P 500 Index in 2008
-4.30%
-54.41%
-17.48%
-24.75%
-8.22%
-7.89%
-17.47%
-5.41%
-60.0% -50.0% -40.0% -30.0% -20.0% -10.0% 0.0%
S&P 500
All Insurers
P/C
Life/Health
Multiline
Reinsurance
Mortgage*
Brokers
*Includes Financial Guarantee.Source: SNL Securities, Standard & Poor’s, Insurance Information Inst.
Total YTD Returns Through May 9, 2008
P/C, Life insurance stocks underperforming S&P—
concerns about soft market, credit/subprime exposure of
some companies
Mortgage & Financial Guarantee insurers were
down 69% in 2008
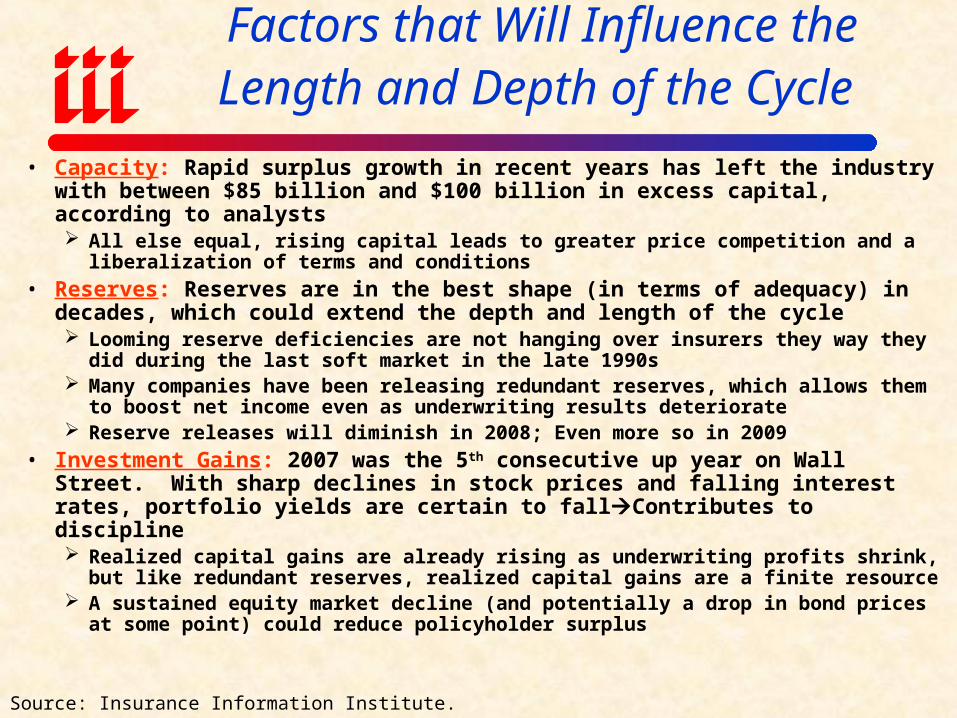
Factors that Will Influence theLength and Depth of the Cycle
• Capacity: Rapid surplus growth in recent years has left the industry with between $85 billion and $100 billion in excess capital, according to analysts All else equal, rising capital leads to greater price competition and a liberalization of
terms and conditions
• Reserves: Reserves are in the best shape (in terms of adequacy) in decades, which could extend the depth and length of the cycle Looming reserve deficiencies are not hanging over insurers they way they did during
the last soft market in the late 1990s Many companies have been releasing redundant reserves, which allows them to boost
net income even as underwriting results deteriorate Reserve releases will diminish in 2008; Even more so in 2009
• Investment Gains: 2007 was the 5th consecutive up year on Wall Street. With sharp declines in stock prices and falling interest rates, portfolio yields are certain to fallContributes to discipline Realized capital gains are already rising as underwriting profits shrink, but like
redundant reserves, realized capital gains are a finite resource A sustained equity market decline (and potentially a drop in bond prices at some
point) could reduce policyholder surplus
Source: Insurance Information Institute.
Factors that Will Influence the Length and Depth of the Cycle (cont’d)
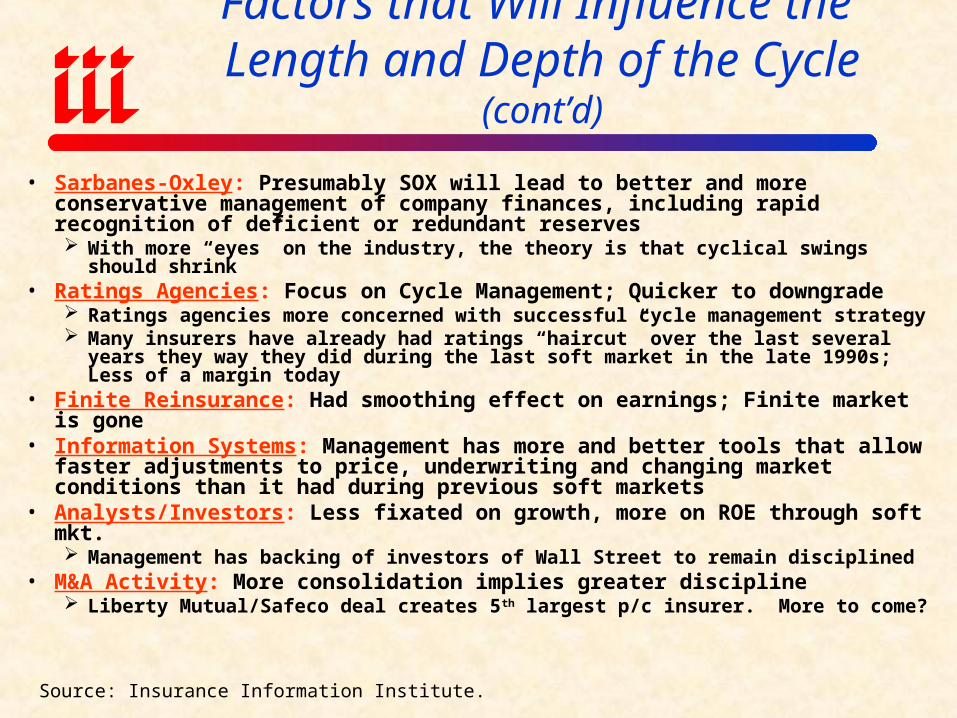
• Sarbanes-Oxley: Presumably SOX will lead to better and more conservative management of company finances, including rapid recognition of deficient or redundant reserves With more “eyes” on the industry, the theory is that cyclical swings should shrink
• Ratings Agencies: Focus on Cycle Management; Quicker to downgrade Ratings agencies more concerned with successful cycle management strategy Many insurers have already had ratings “haircut” over the last several years they
way they did during the last soft market in the late 1990s; Less of a margin today• Finite Reinsurance: Had smoothing effect on earnings; Finite market is gone• Information Systems: Management has more and better tools that allow
faster adjustments to price, underwriting and changing market conditions than it had during previous soft markets
• Analysts/Investors: Less fixated on growth, more on ROE through soft mkt. Management has backing of investors of Wall Street to remain disciplined
• M&A Activity: More consolidation implies greater discipline Liberty Mutual/Safeco deal creates 5th largest p/c insurer. More to come?
Source: Insurance Information Institute.
FINANCIAL STRENGTH &
RATINGS Industry Has Weathered
the Storms Well, But Cycle May Takes Its Toll
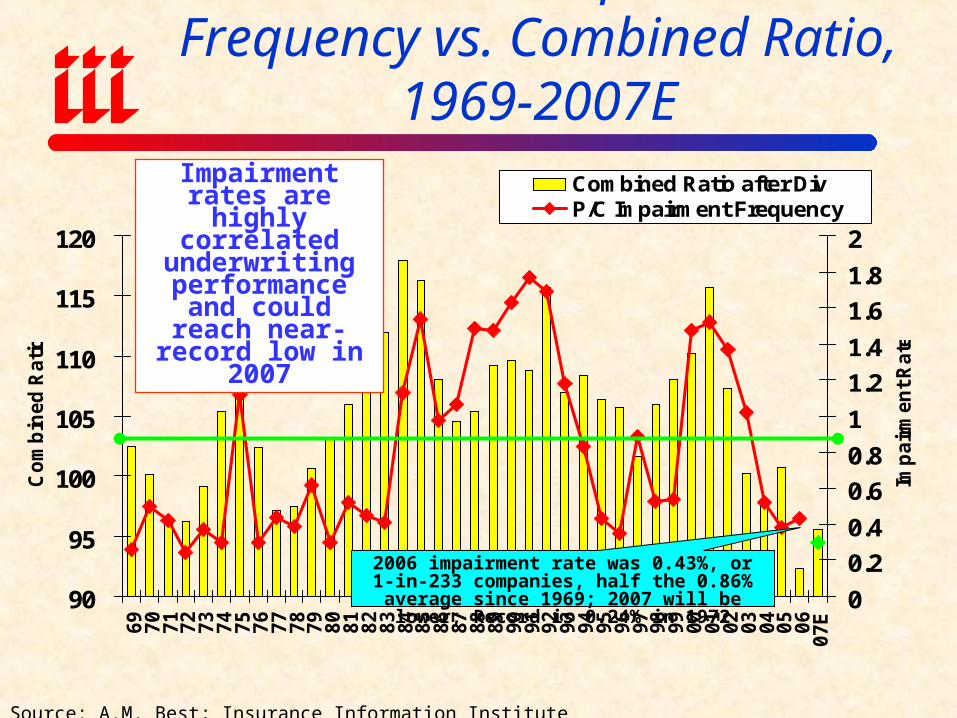
P/C Insurer Impairment Frequency vs. Combined Ratio, 1969-2007E
90
95
100
105
110
115
120
69
70
71
72
73
74
75
76
77
78
79
80
81
82
83
84
85
86
87
88
89
90
91
92
93
94
95
96
97
98
99
00
01
02
03
04
05
06
07E
Co
mb
ined
Ratio
0
0.2
0.4
0.6
0.8
1
1.2
1.4
1.6
1.8
2
Imp
air
men
t R
ate
Combined Ratio after DivP/C Impairment Frequency
Impairment rates are highly correlated
underwriting performance and could reach near-record low in 2007
Source: A.M. Best; Insurance Information Institute
2006 impairment rate was 0.43%, or 1-in-233 companies, half the 0.86% average since 1969;
2007 will be lower; Record is 0.24% in 1972
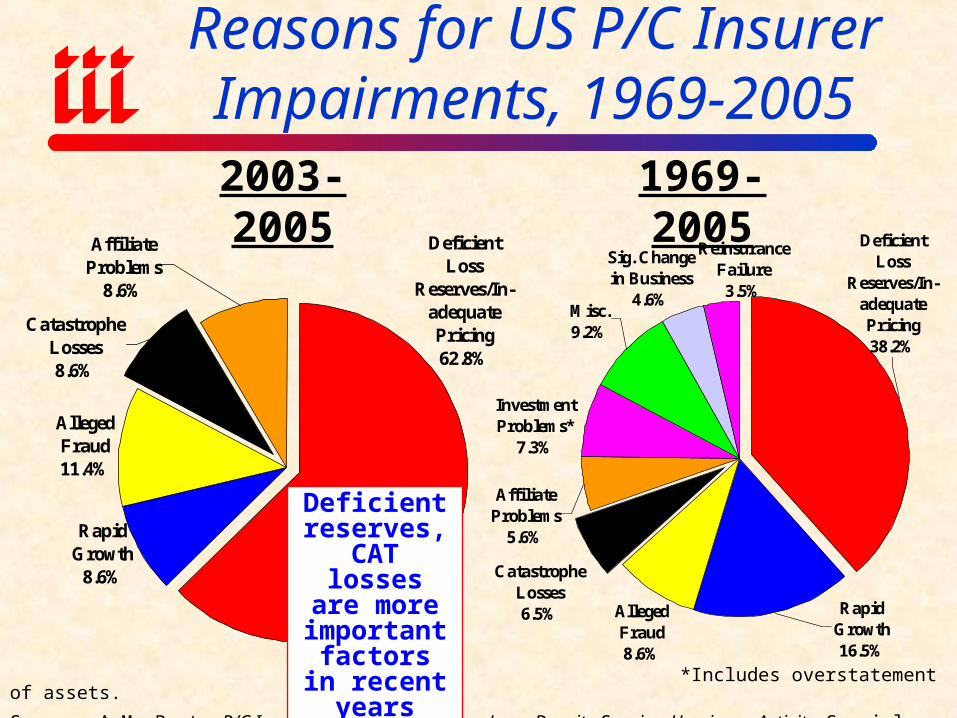
Reasons for US P/C Insurer Impairments, 1969-2005
*Includes overstatement of assets.
Source: A.M. Best: P/C Impairments Hit Near-Term Lows Despite Surging Hurricane Activity, Special Report, Nov. 2005;
Catastrophe Losses8.6%
Alleged Fraud11.4%
Deficient Loss
Reserves/In-adequate Pricing62.8%
Affiliate Problems
8.6%
Rapid Growth
8.6%
2003-2005 1969-2005
Deficient reserves,
CAT losses are more important factors in
recent years
Reinsurance Failure3.5%
Rapid Growth16.5%
Misc.9.2%
Affiliate Problems
5.6%
Sig. Change in Business
4.6%
Deficient Loss
Reserves/In-adequate Pricing38.2%
Investment Problems*
7.3%
Alleged Fraud8.6%
Catastrophe Losses6.5%

UNDERWRITINGTRENDS
Extremely Strong 2006/07;Relying on Momentum &
Discipline for 2008
90
95
100
105
110
115
120
70
71
72
73
74
75
76
77
78
79
80
81
82
83
84
85
86
87
88
89
90
91
92
93
94
95
96
97
98
99
00
01
02
03
04
05
06
07
08F
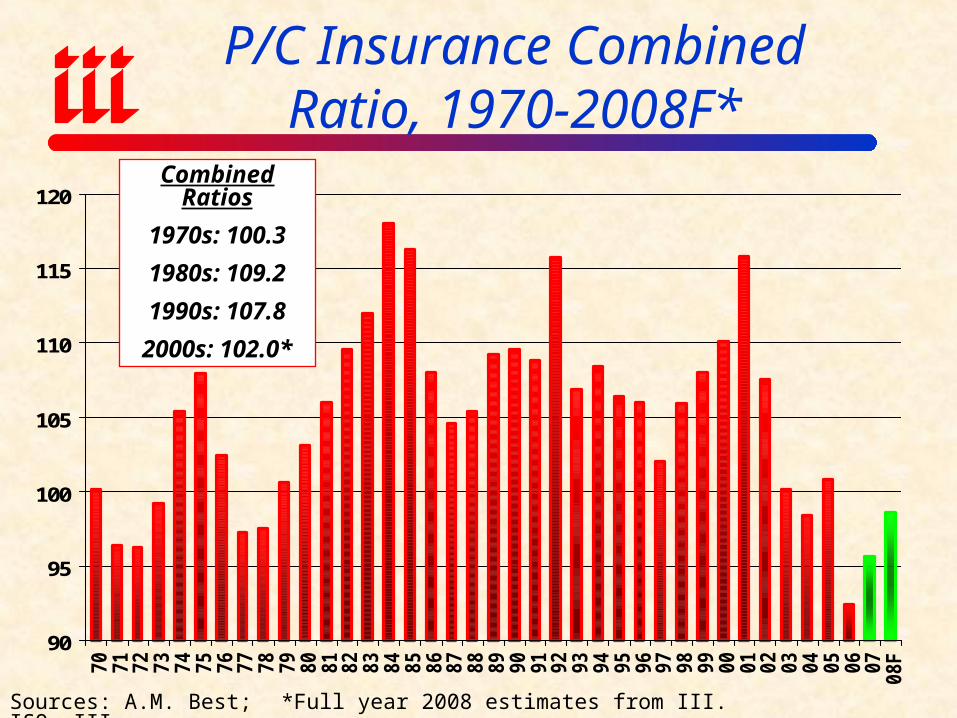
Combined Ratios
1970s: 100.3
1980s: 109.2
1990s: 107.8
2000s: 102.0*
Sources: A.M. Best; ISO, III *Full year 2008 estimates from III.
P/C Insurance Combined Ratio, 1970-2008F*
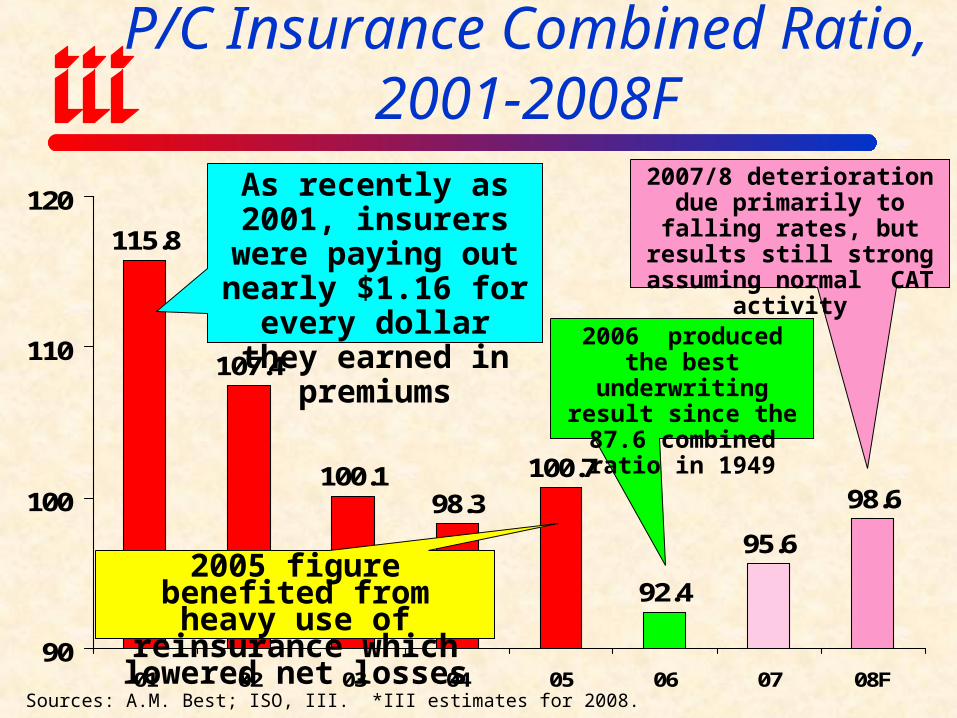
115.8
107.4
100.198.3
100.7
92.4
98.6
95.6
90
100
110
120
01 02 03 04 05 06 07 08F
P/C Insurance Combined Ratio, 2001-2008F
Sources: A.M. Best; ISO, III. *III estimates for 2008.
2005 figure benefited from heavy use of reinsurance which lowered net losses
2006 produced the best underwriting result
since the 87.6 combined ratio in 1949
As recently as 2001, insurers were paying out nearly $1.16 for
every dollar they earned in premiums
2007/8 deterioration due primarily to falling rates, but results still strong assuming
normal CAT activity
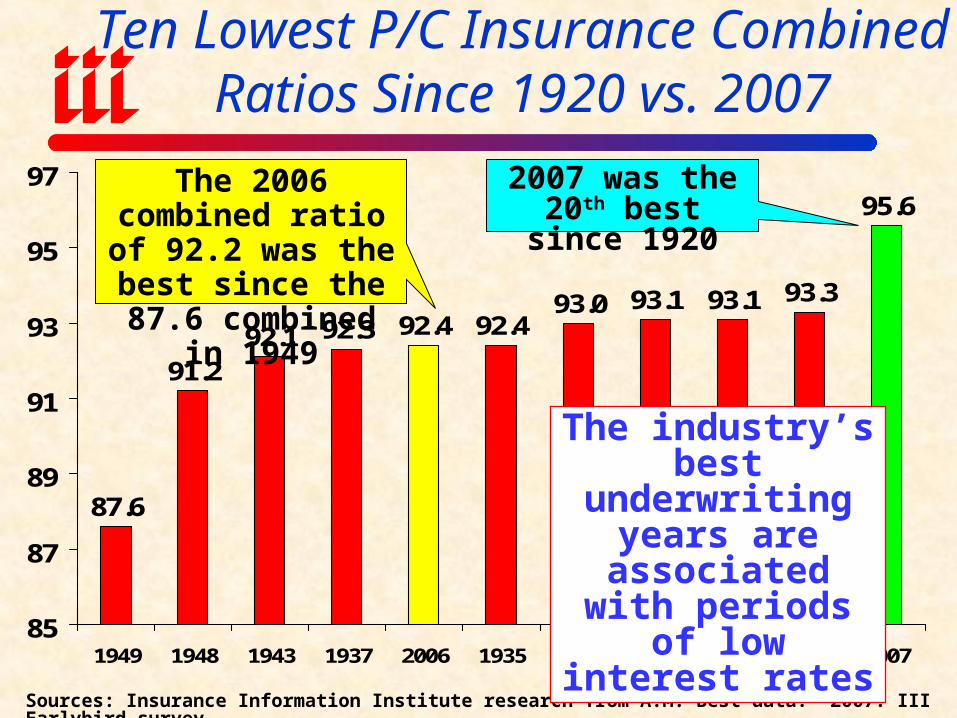
87.6
91.292.1 92.3 92.4 92.4
93.1 93.1 93.3
95.6
93.0
85
87
89
91
93
95
97
1949 1948 1943 1937 2006 1935 1950 1939 1953 1936 2007
Ten Lowest P/C Insurance Combined Ratios Since 1920 vs. 2007
Sources: Insurance Information Institute research from A.M. Best data. *2007: III Earlybird survey.
2007 was the 20th best since 1920
The industry’s best underwriting years are associated with
periods of low interest rates
The 2006 combined ratio of 92.2 was the best since the 87.6 combined in 1949
-55-50-45-40-35-30-25-20-15-10-505
101520253035
75
76
77
78
79
80
81
82
83
84
85
86
87
88
89
90
91
92
93
94
95
96
97
98
99
00
01
02
03
04
05
06
07
08
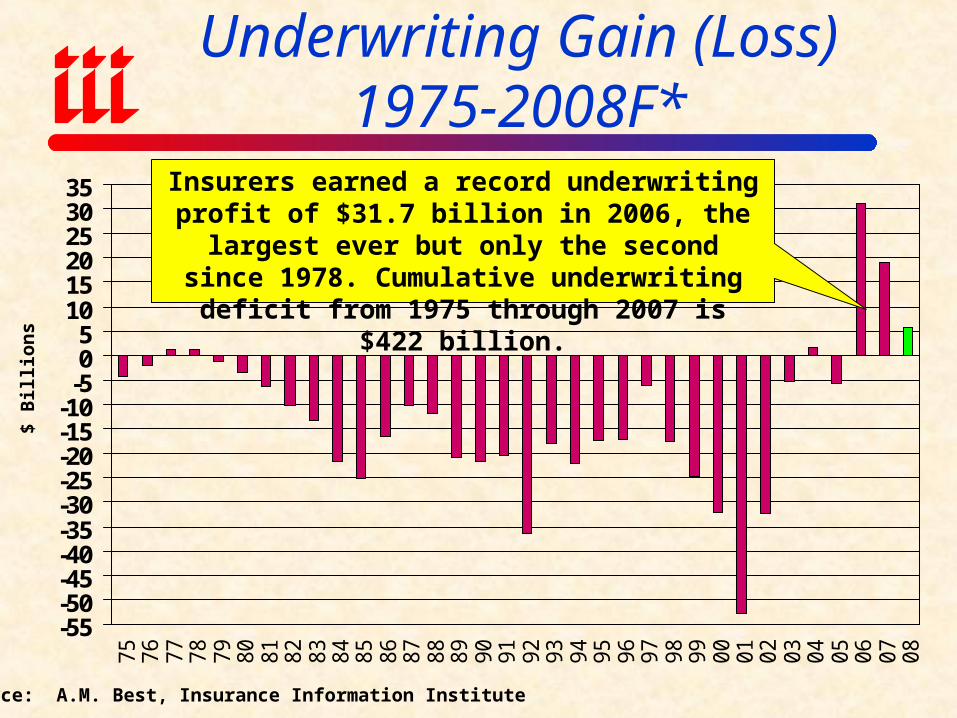
Source: A.M. Best, Insurance Information Institute
$ B
illi
ons
Insurers earned a record underwriting profit of $31.7 billion in 2006, the largest ever but only the
second since 1978. Cumulative underwriting deficit from 1975 through 2007 is $422 billion.
Underwriting Gain (Loss)1975-2008F*
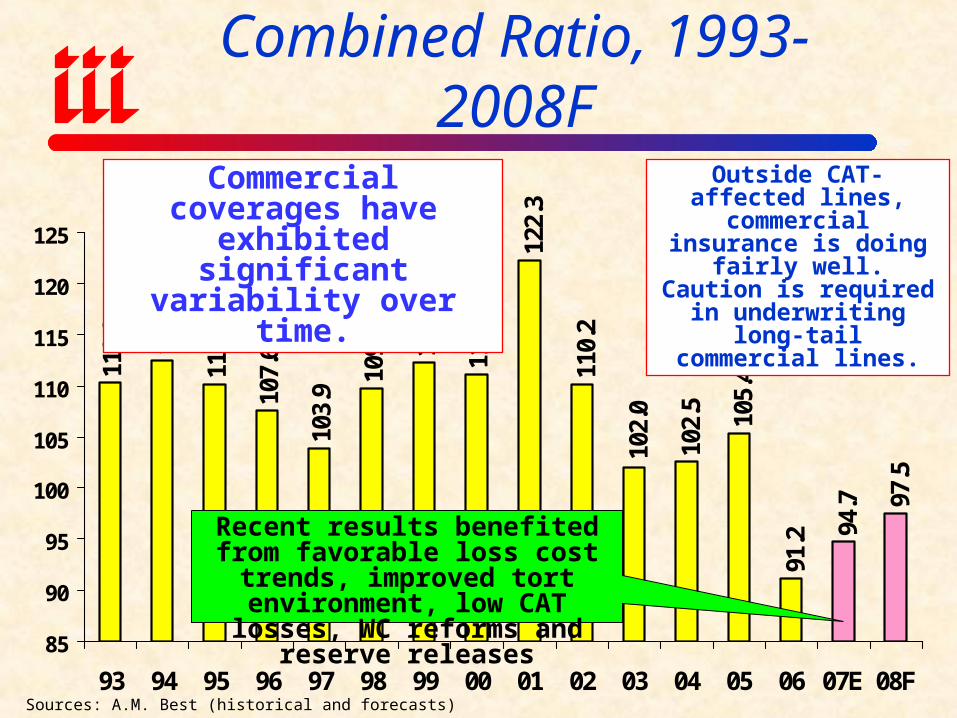
110.
3
110.
2
107.
6
103.
9
109.
7
112.
3
111.
1
122.
3
110.
2
102.
5
105.
4
91.2 94
.7 97.5
102.
0
112.
5
85
90
95
100
105
110
115
120
125
93 94 95 96 97 98 99 00 01 02 03 04 05 06 07E 08F
Recent results benefited from favorable loss cost trends, improved tort environment, low CAT losses, WC reforms and reserve releases
Commercial coverages have exhibited significant
variability over time.
Commercial Lines Combined Ratio, 1993-2008F
Outside CAT-affected lines, commercial insurance is
doing fairly well. Caution is required in underwriting
long-tail commercial lines.
Sources: A.M. Best (historical and forecasts)
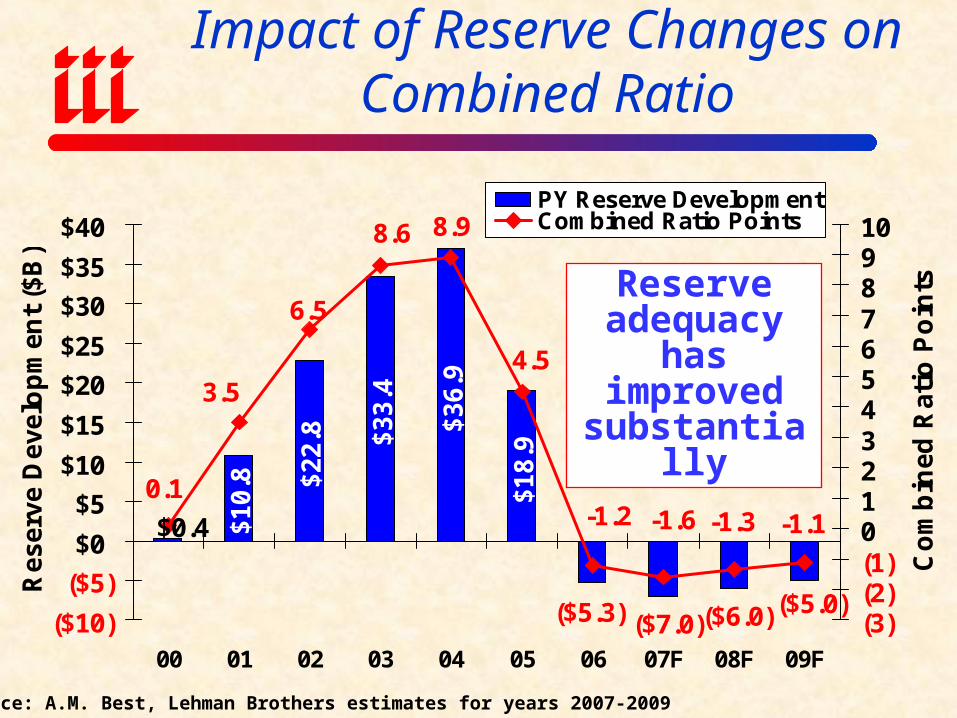
$1
0.8 $
22
.8 $3
3.4
$3
6.9
$1
8.9
($5.0)($6.0)($5.3)
$0.4
($7.0)
8.9
-1.1-1.3-1.6
4.5
-1.20.1
3.5
8.6
6.5
($10)
($5)
$0
$5
$10
$15
$20
$25
$30
$35
$40
00 01 02 03 04 05 06 07F 08F 09F
Re
se
rve
De
ve
lop
me
nt
($B
)
(3)(2)(1)012345678910
Co
mb
ine
d R
ati
o P
oin
ts
PY Reserve DevelopmentCombined Ratio Points
Impact of Reserve Changes on Combined Ratio
Source: A.M. Best, Lehman Brothers estimates for years 2007-2009
Reserve adequacy has
improved substantially

PREMIUM GROWTH
At a Virtual Standstillin 2007/08
-10%
-5%
0%
5%
10%
15%
20%
25%
1970
1971
1972
1973
1974
1975
1976
1977
1978
1979
1980
1981
1982
1983
1984
1985
1986
1987
1988
1989
1990
1991
1992
1993
1994
1995
1996
1997
1998
1999
2000
2001
2002
2003
2004
2005
2006
2007F
2008F
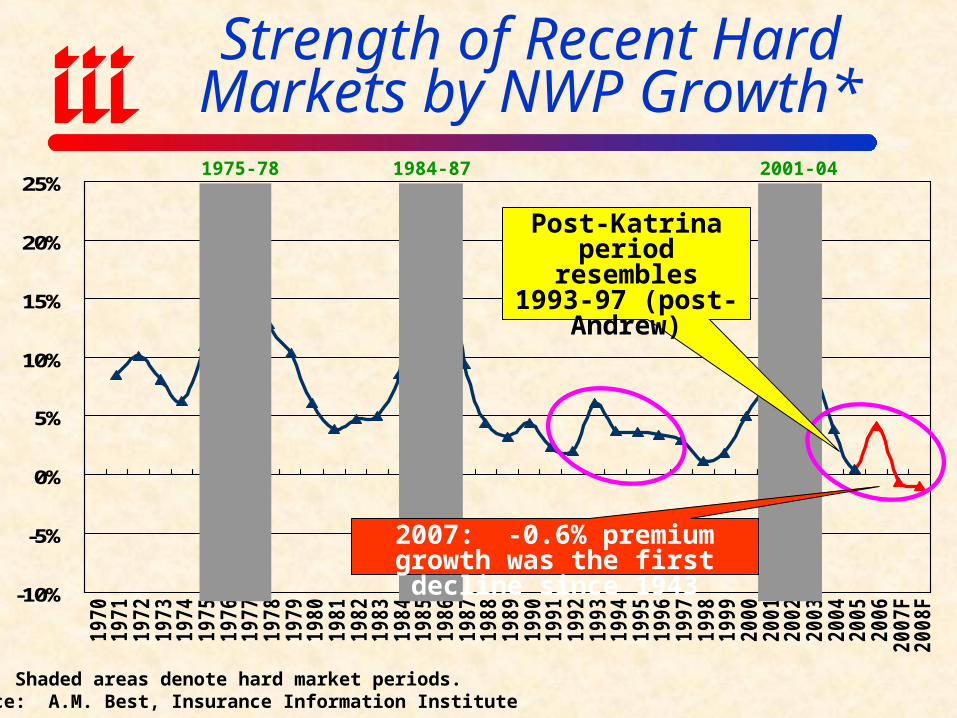
Note: Shaded areas denote hard market periods.Source: A.M. Best, Insurance Information Institute
Strength of Recent Hard Markets by NWP Growth*
1975-78 1984-87 2001-04
Post-Katrina period resembles
1993-97 (post-Andrew)
2007: -0.6% premium growth was the first decline since 1943
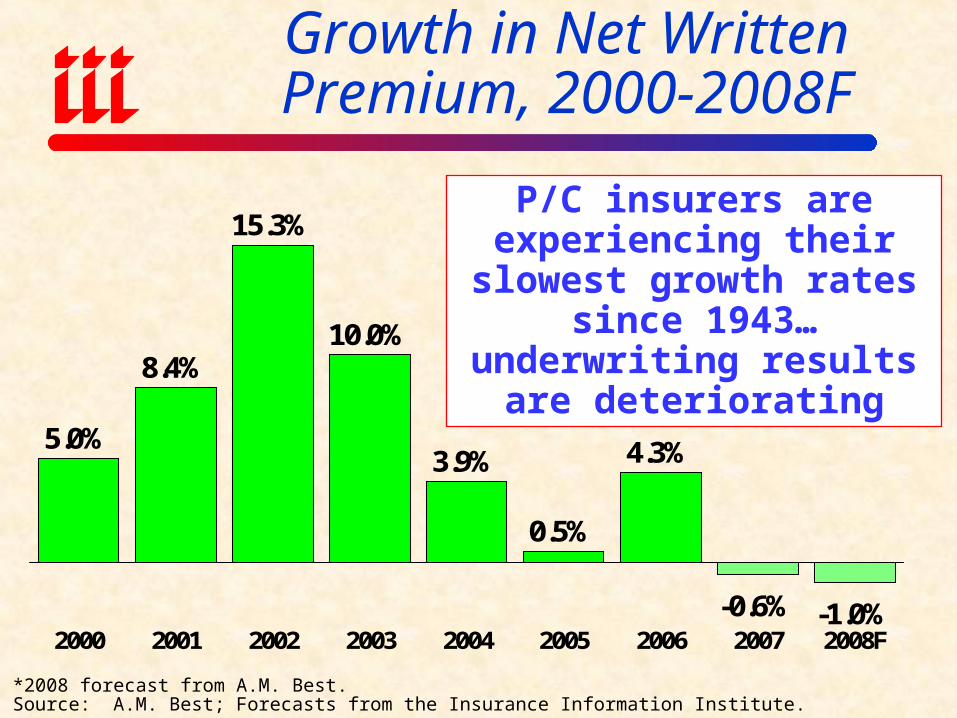
Growth in Net Written Premium, 2000-2008F
*2008 forecast from A.M. Best.Source: A.M. Best; Forecasts from the Insurance Information Institute.
5.0%
8.4%
15.3%
10.0%
3.9%
0.5%
4.3%
-0.6% -1.0%2000 2001 2002 2003 2004 2005 2006 2007 2008F
P/C insurers are experiencing their slowest growth rates since 1943… underwriting results are deteriorating
WEAK PRICING
Under Pressure in 2007/08, Especially Commercial Lines
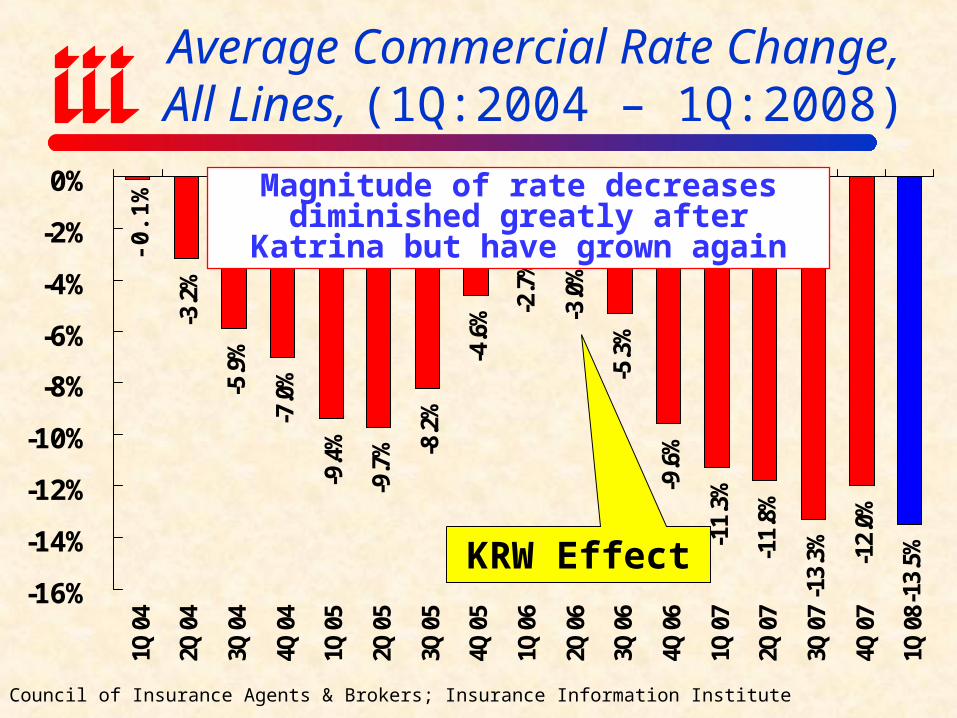
Average Commercial Rate Change,All Lines, (1Q:2004 – 1Q:2008)
-3.2
%
-5.9
%
-7.0
%
-9.4
%
-9.7
% -8.2
%
-4.6
% -2.7
%
-3.0
%
-5.3
%
-9.6
%
-11.
3%
-11.
8%
-13.
3% -12.
0%
-13.
5%
-16%
-14%
-12%
-10%
-8%
-6%
-4%
-2%
0%
1Q04
2Q04
3Q04
4Q04
1Q05
2Q05
3Q05
4Q05
1Q06
2Q06
3Q06
4Q06
1Q07
2Q07
3Q07
4Q07
1Q08
Source: Council of Insurance Agents & Brokers; Insurance Information Institute
Magnitude of rate decreases diminished greatly after Katrina but have grown again
KRW Effect
-0.1
%
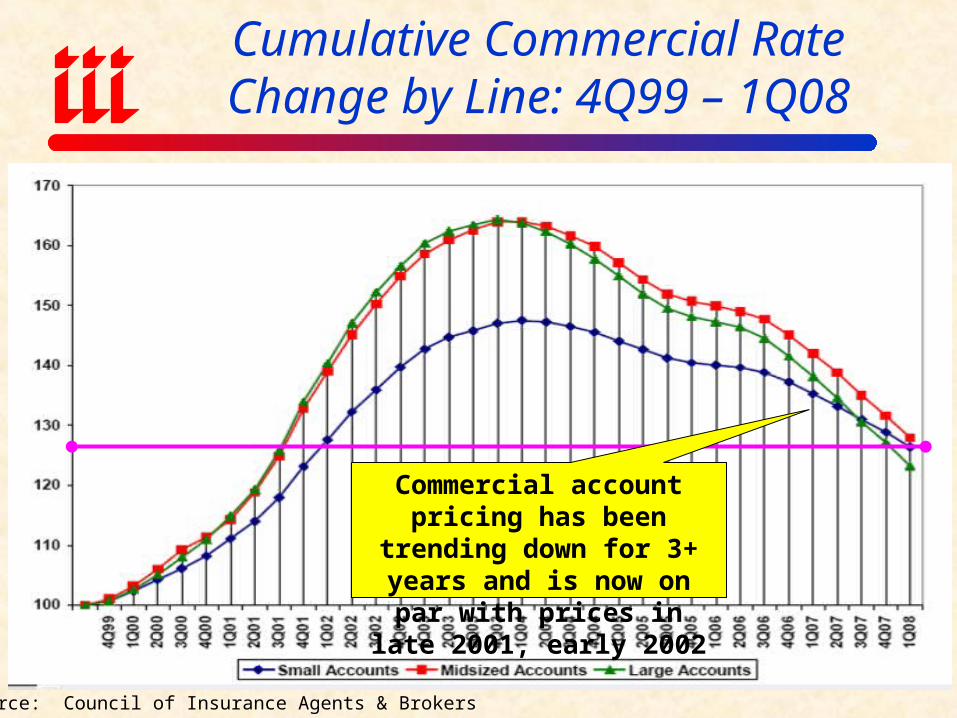
Cumulative Commercial Rate Change by Line: 4Q99 – 1Q08
Source: Council of Insurance Agents & Brokers
Commercial account pricing has been trending down for 3+ years and is now on par with prices in late 2001, early 2002
CAPACITY/SURPLUS
Accumulation of Capital/ Surplus Depresses ROEs
$0
$50
$100
$150
$200
$250
$300
$350
$400
$450
$500
$550
75 76 77 78 79 80 81 82 83 84 85 86 87 88 89 90 91 92 93 94 95 96 97 98 99 00 01 02 03 04 05 06 07
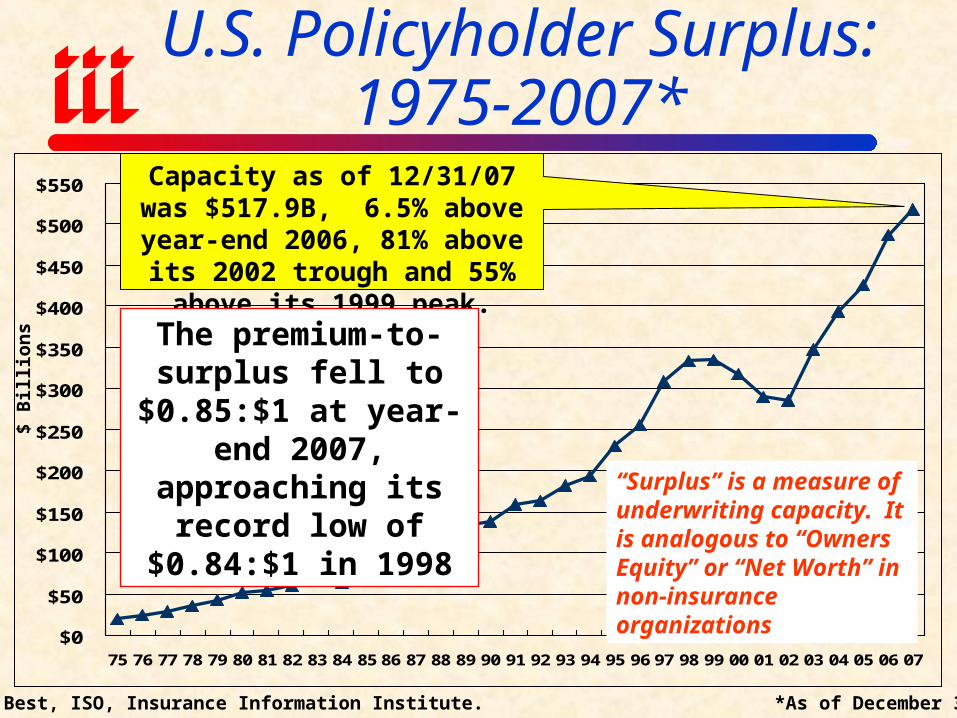
U.S. Policyholder Surplus: 1975-2007*
Source: A.M. Best, ISO, Insurance Information Institute. *As of December 31, 2007
$ B
illi
ons
“Surplus” is a measure of underwriting capacity. It is analogous to “Owners Equity” or “Net Worth” in non-insurance organizations
Capacity as of 12/31/07 was $517.9B, 6.5% above year-end
2006, 81% above its 2002 trough and 55% above its 1999 peak.
The premium-to-surplus fell to $0.85:$1 at year-end 2007, approaching
its record low of $0.84:$1 in 1998
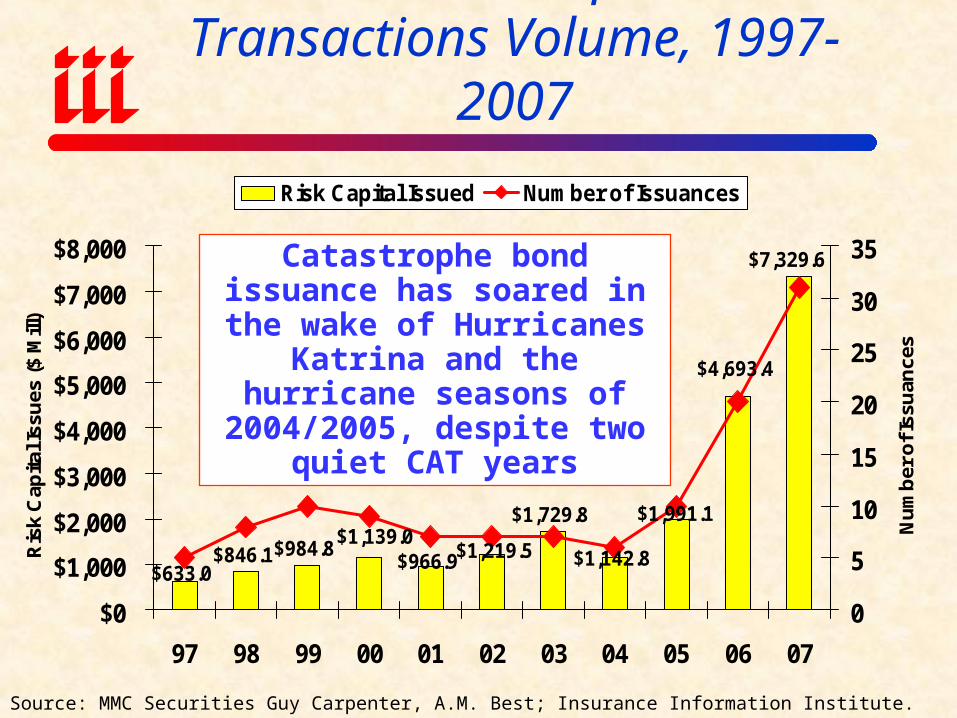
Annual Catastrophe Bond Transactions Volume, 1997-2007
$1,729.8
$966.9
$7,329.6
$4,693.4
$1,991.1
$1,142.8$1,219.5$846.1$984.8$1,139.0
$633.0
$0
$1,000
$2,000
$3,000
$4,000
$5,000
$6,000
$7,000
$8,000
97 98 99 00 01 02 03 04 05 06 07
Ris
k C
apita
l Iss
ues
($ M
ill)
0
5
10
15
20
25
30
35
Nu
mb
er o
f Iss
uan
ces
Risk Capital Issued Number of Issuances
Source: MMC Securities Guy Carpenter, A.M. Best; Insurance Information Institute.
Catastrophe bond issuance has soared in the wake of Hurricanes
Katrina and the hurricane seasons of 2004/2005, despite two
quiet CAT years
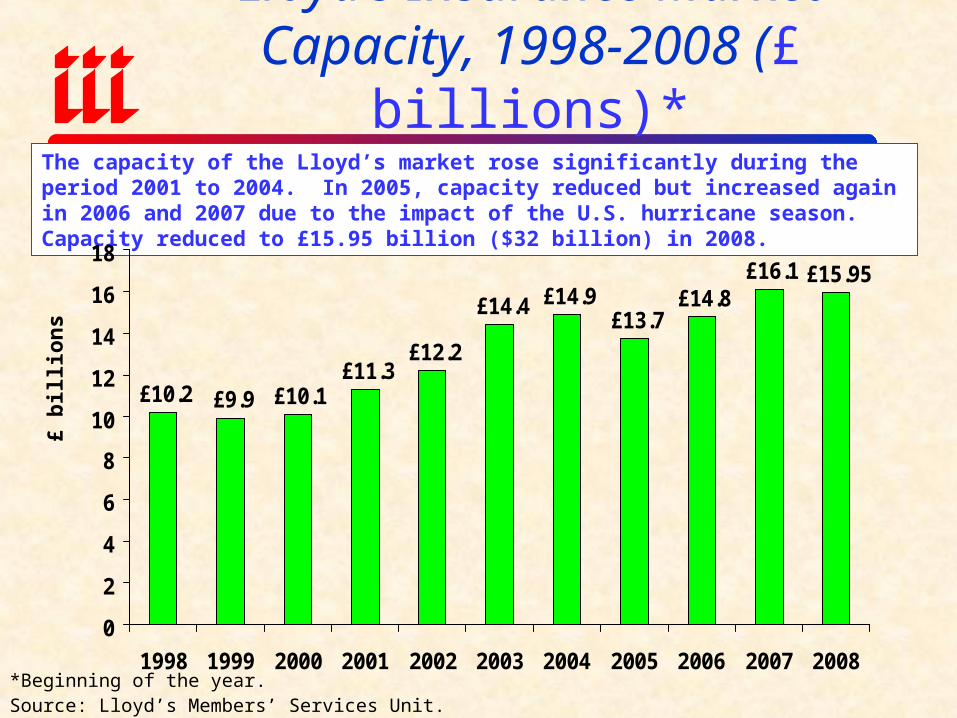
Lloyd’s Insurance Market Capacity, 1998-2008 (£ billions)*
*Beginning of the year.Source: Lloyd’s Members’ Services Unit.
The capacity of the Lloyd’s market rose significantly during the period 2001 to 2004. In 2005, capacity reduced but increased again in 2006 and 2007 due to the impact of the U.S. hurricane season. Capacity reduced to £15.95 billion ($32 billion) in 2008.
£15.95 £16.1 £14.8
£13.7 £14.9 £14.4
£12.2 £11.3
£10.1 £9.9 £10.2
0
2
4
6
8
10
12
14
16
18
1998 1999 2000 2001 2002 2003 2004 2005 2006 2007 2008
£ b
illio
ns
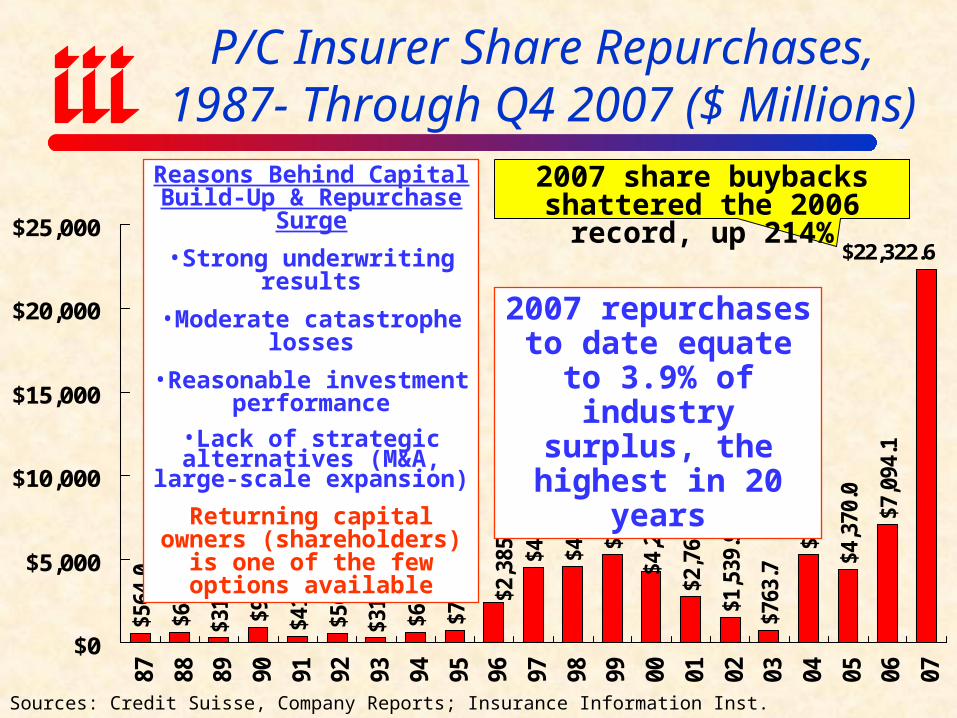
P/C Insurer Share Repurchases,1987- Through Q4 2007 ($ Millions)
$564
.0
$646
.9
$311
.0
$952
.4
$418
.1
$566
.8
$310
.1
$658
.8
$769
.2
$4,5
86.5
$5,2
66.0
$763
.7
$5,2
42.3
$4,3
70.0
$7,0
94.1
$22,322.6
$4,4
97.5
$1,5
39.9
$2,7
64.2
$2,3
85.6
$4,2
97.3
$0
$5,000
$10,000
$15,000
$20,000
$25,000
87 88 89 90 91 92 93 94 95 96 97 98 99 00 01 02 03 04 05 06 07
Sources: Credit Suisse, Company Reports; Insurance Information Inst.
2007 share buybacks shattered the 2006 record, up 214%
Reasons Behind Capital Build-Up & Repurchase Surge
•Strong underwriting results
•Moderate catastrophe losses
•Reasonable investment performance
•Lack of strategic alternatives (M&A, large-scale expansion)
Returning capital owners (shareholders) is one of the
few options available
2007 repurchases to date equate to 3.9% of industry surplus, the highest in 20 years

MEDICAL PROFESSIONAL
LIABILITY OVERVIEW
Significant Improvements
MEDICAL & HEALTH CARE
COST INFLATION
National Problem & Insurer Cost Driver
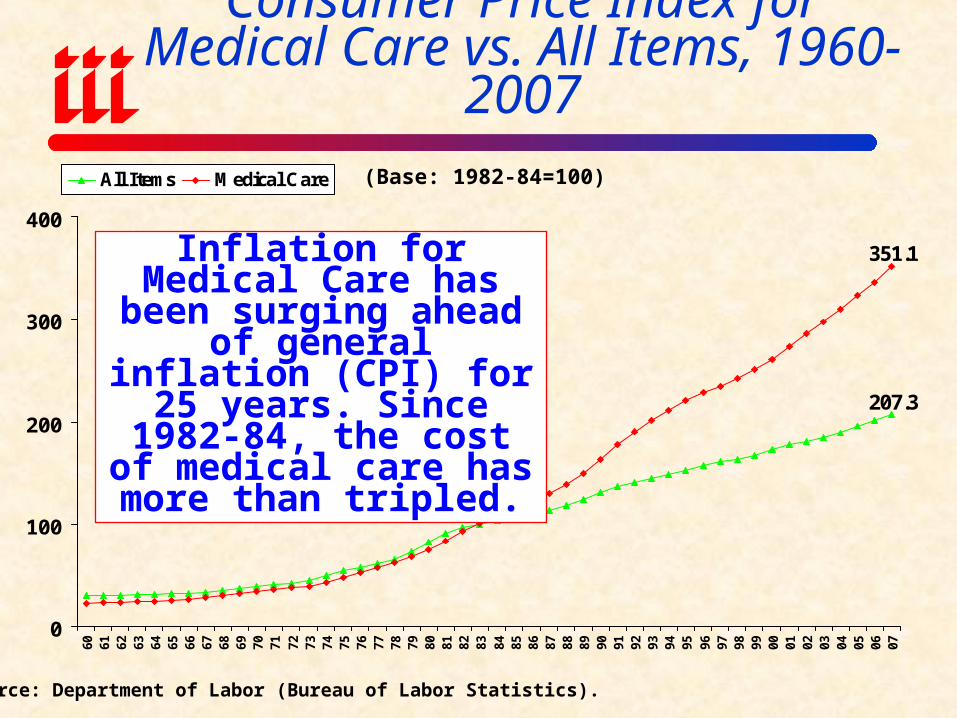
Consumer Price Index for Medical Care vs. All Items, 1960-2007
207.3
351.1
0
100
200
300
400
60 61 62 63 64 65 66 67 68 69 70 71 72 73 74 75 76 77 78 79 80 81 82 83 84 85 86 87 88 89 90 91 92 93 94 95 96 97 98 99 00 01 02 03 04 05 06 07
All Items Medical Care
Source: Department of Labor (Bureau of Labor Statistics).
(Base: 1982-84=100)
Inflation for Medical Care has been surging ahead of general inflation (CPI) for
25 years. Since 1982-84, the cost of medical care has more than tripled.
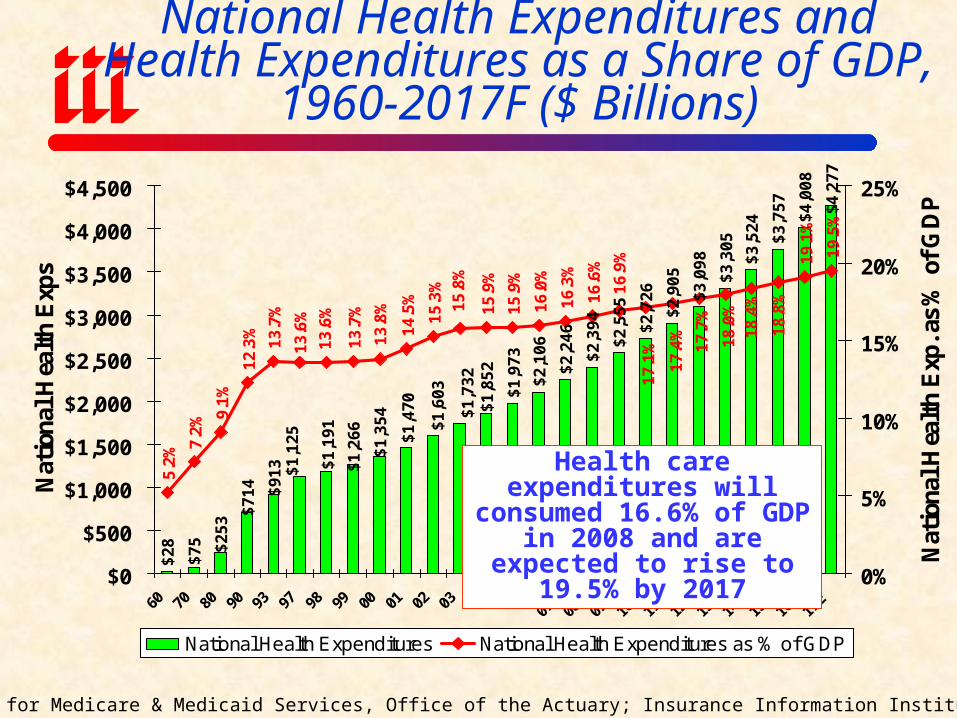
National Health Expenditures and Health Expenditures as a Share of GDP,
1960-2017F ($ Billions)$
28
$1
,97
3
$2
,10
6
$2
,24
6
$2
,39
4
$2
,55
5
$2
,72
6
$2
,90
5
$3
,09
8
$3
,30
5
$3
,52
4
$3
,75
7
$4
,00
8
$4
,27
7
$1
,60
3
$1
,73
2
$2
53
$7
14
$1
,35
4
$7
5
$1
,19
1
$1
,85
2
$1
,47
0
$1
,12
5$
91
3 $1
,26
6
5.2
% 7.2
% 9.1
%
13
.7%
14
.5%
15
.3%
15
.9%
15
.9%
16
.0%
16
.3%
16
.6% 1
9.1
%
19
.5%
16
.9%
17
.1%
17
.4%
17
.7%
18
.0%
18
.4%
18
.8%
12
.3%
13
.6%
13
.8% 1
5.8
%
13
.6%
13
.7%
$0
$500
$1,000
$1,500
$2,000
$2,500
$3,000
$3,500
$4,000
$4,500
60 70 80 90 93 97 98 99 00 01 02 03 04 05 06 07E
08E
09E
10E
11E
12E
13E
14E
15E
16E
17E
Nat
iona
l Hea
lth
Exp
s
0%
5%
10%
15%
20%
25%
Nat
iona
l Hea
lth
Exp
. as
% o
f G
DP
National Health Expenditures National Health Expenditures as % of GDP
Health care expenditures will consumed 16.6% of GDP in
2008 and are expected to rise to 19.5% by 2017
Source: Centers for Medicare & Medicaid Services, Office of the Actuary; Insurance Information Institute.
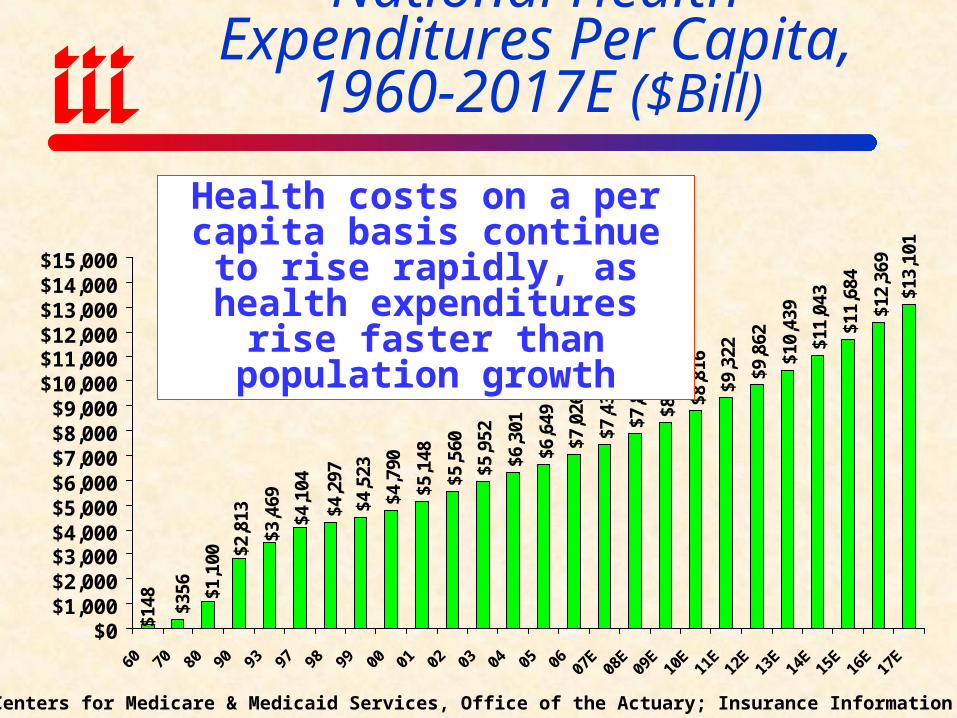
National Health Expenditures Per Capita, 1960-2017E ($Bill)
$4,5
23
$4,7
90
$5,1
48
$5,5
60
$5,9
52
$6,3
01
$6,6
49
$7,0
26
$7,4
39
$7,8
68
$8,3
29
$8,8
16
$9,3
22
$9,8
62
$10,
439
$11
,043
$11
,684
$12,
369
$13,
101
$356
$2,8
13
$1,1
00
$148
$3,4
69
$4,1
04
$4,2
97
$0$1,000$2,000$3,000$4,000$5,000$6,000$7,000$8,000$9,000
$10,000$11,000$12,000$13,000$14,000$15,000
60 70 80 90 93 97 98 99 00 01 02 03 04 05 06 07E
08E
09E
10E
11E
12E
13E
14E
15E
16E
17E
Source: Centers for Medicare & Medicaid Services, Office of the Actuary; Insurance Information Institute.
Health costs on a per capita basis continue to rise rapidly, as health expenditures rise faster
than population growth
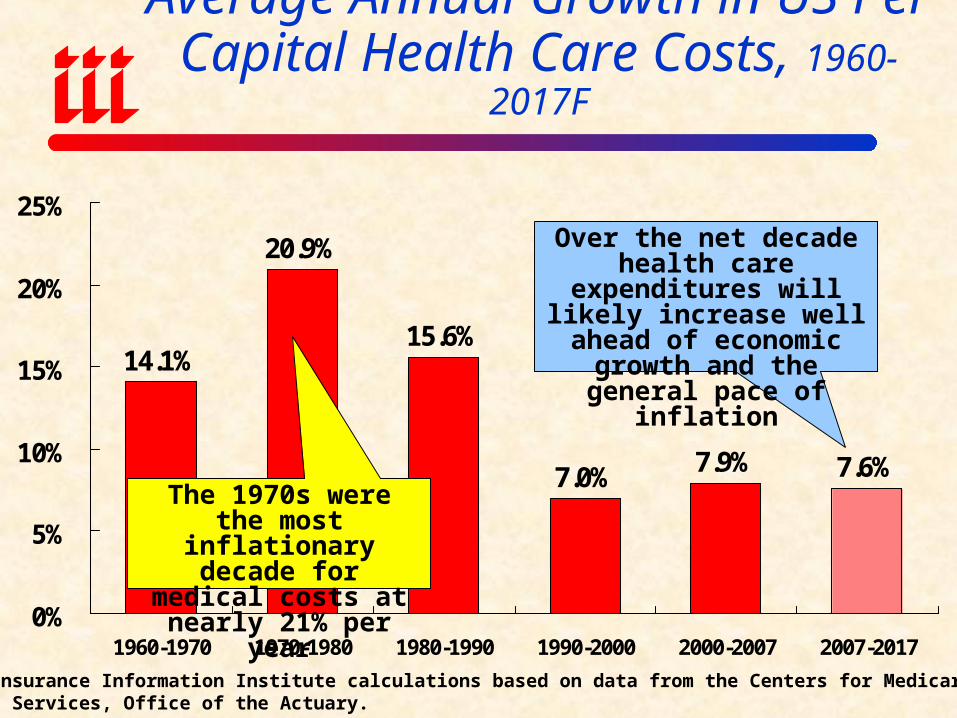
Average Annual Growth in US Per Capital Health Care Costs, 1960-2017F
14.1%
20.9%
15.6%
7.0% 7.9% 7.6%
0%
5%
10%
15%
20%
25%
1960-1970 1970-1980 1980-1990 1990-2000 2000-2007 2007-2017
The 1970s were the most inflationary decade for medical costs at nearly
21% per year
Over the net decade health care expenditures will likely
increase well ahead of economic growth and the general pace of inflation
Source: Insurance Information Institute calculations based on data from the Centers for Medicare & Medicaid Services, Office of the Actuary.
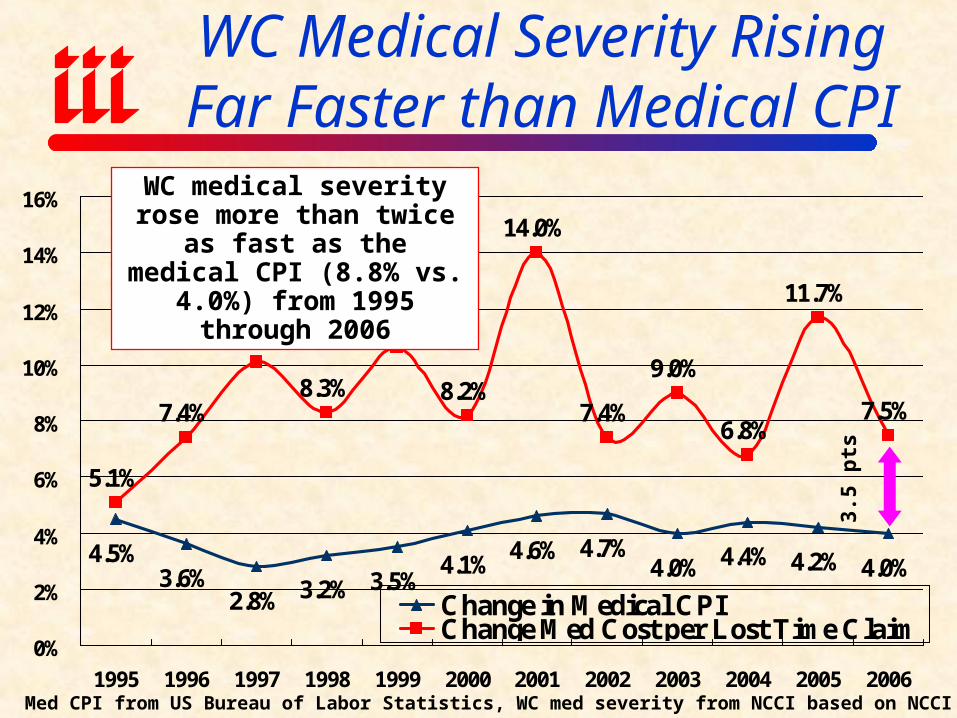
4.5%3.6%
2.8% 3.2% 3.5%4.1%
4.6% 4.7%4.0% 4.4% 4.2% 4.0%
5.1%
7.4%
10.1%
8.3%
10.6%
8.2%
14.0%
7.4%
9.0%
6.8%
11.7%
7.5%
0%
2%
4%
6%
8%
10%
12%
14%
16%
1995 1996 1997 1998 1999 2000 2001 2002 2003 2004 2005 2006
Change in Medical CPIChange Med Cost per Lost Time Claim
WC Medical Severity Rising Far Faster than Medical CPI
Sources: Med CPI from US Bureau of Labor Statistics, WC med severity from NCCI based on NCCI states.
3.5
pts
WC medical severity rose more than twice as fast as the medical CPI (8.8% vs. 4.0%)
from 1995 through 2006
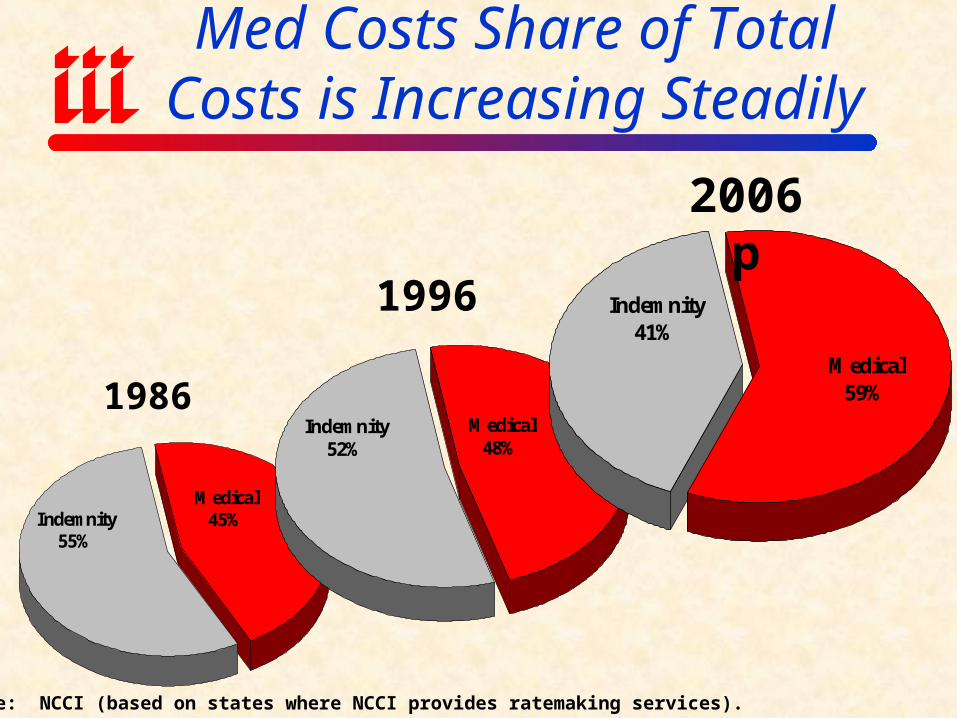
Med Costs Share of Total Costs is Increasing Steadily
Indemnity55%
Medical45%
Source: NCCI (based on states where NCCI provides ratemaking services).
Indemnity52%
Medical48%
Indemnity41%
Medical59%1986
1996
2006p
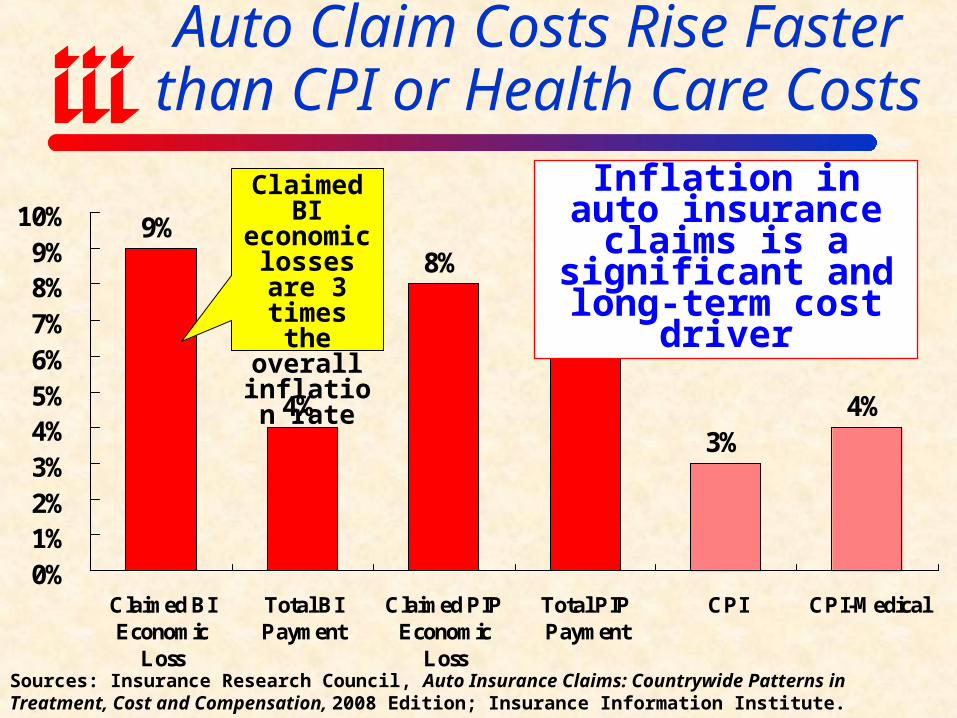
Auto Claim Costs Rise Faster than CPI or Health Care Costs
9%
4%
8%
6%
3%4%
0%1%2%3%4%5%6%7%8%9%
10%
Claimed BIEconomic
Loss
Total BIPayment
Claimed PIPEconomic
Loss
Total PIPPayment
CPI CPI-Medical
Sources: Insurance Research Council, Auto Insurance Claims: Countrywide Patterns in Treatment, Cost and Compensation, 2008 Edition; Insurance Information Institute.
Inflation in auto insurance claims is a significant and long-
term cost driver
Claimed BI economic
losses are 3 times the overall
inflation rate

MEDICAL MALPRACTICE
OPERATING ENVIRONMENT
Improved, But Still Vulnerable
10
3.7
10
8.0
96
.4 99
.8
10
6.6
10
7.9 11
5.7
12
9.7
13
3.7
15
4.7
14
2.5
13
7.5
111
.0
10
1.0
91
.2
83
.0
94
.5
10
8.8 11
5.7
10
7.0
10
8.3
10
6.7
10
6.0
10
2.0
10
5.9
10
8.0
110
.1 115
.8
10
7.5
10
0.1
98
.4
10
0.8
92
.5 95
.6 98
.6
12
7.9
80
90
100
110
120
130
140
150
160
170
91 92 93 94 95 96 97 98 99 00 01 02 03 04 05 06 07P 08E
Medical Malpractice All Lines Combined Ratio
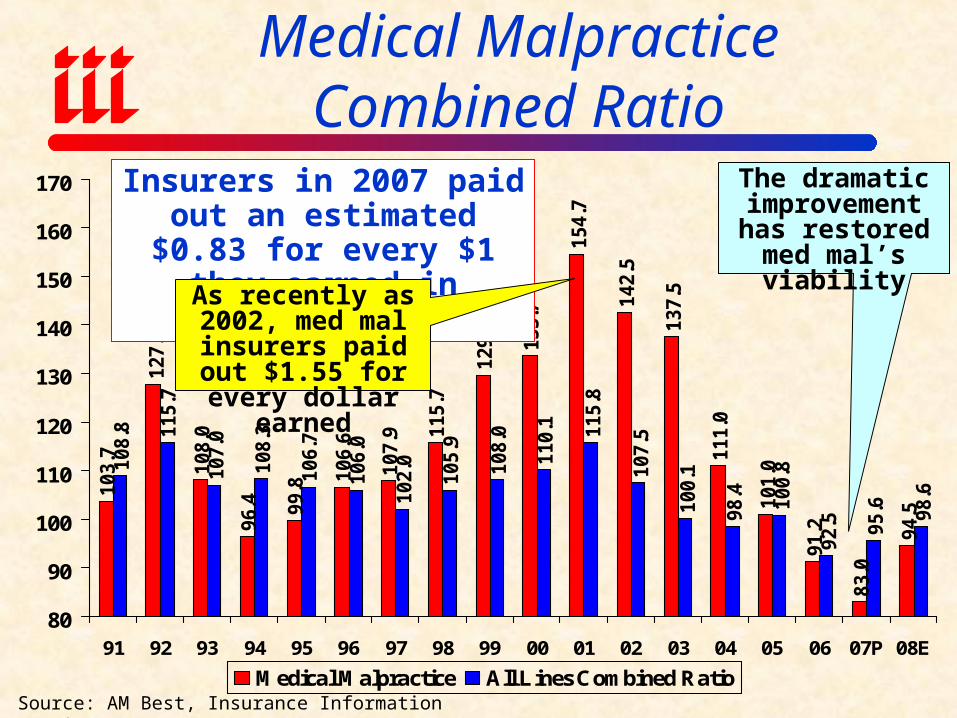
Medical Malpractice Combined Ratio
Source: AM Best, Insurance Information Institute
Insurers in 2007 paid out an estimated $0.83 for every $1
they earned in premiums.As recently as 2002,
med mal insurers paid out $1.55 for
every dollar earned
The dramatic improvement has
restored med mal’s viability
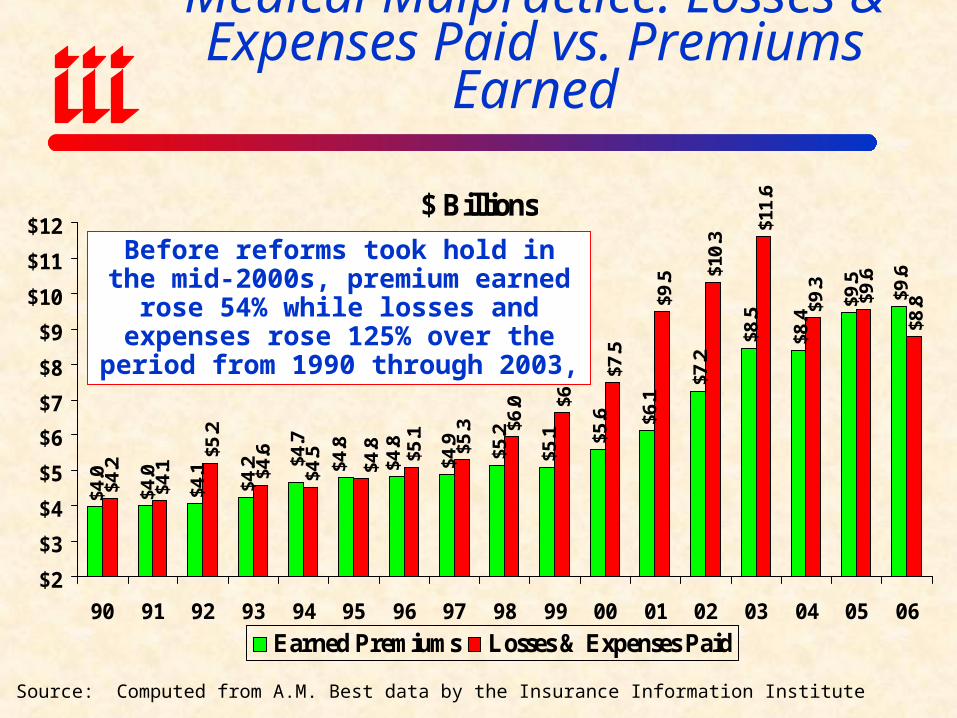
Medical Malpractice: Losses & Expenses Paid vs. Premiums Earned
$ Billions
$4.0
$4.0
$4.1
$4.2 $4
.9 $5.2
$5.1 $5
.6 $6.1
$7.2
$8.5
$8.4
$9.5
$9.6
$4.2
$4.1
$5.2
$4.6
$4.5 $5
.1
$5.3 $6
.0 $6.6 $7
.5
$9.5 $1
0.3
$11.
6
$9.3
$9.6
$8.8
$4.7
$4.8
$4.8
$4.8
$2
$3
$4
$5
$6
$7
$8
$9
$10
$11
$12
90 91 92 93 94 95 96 97 98 99 00 01 02 03 04 05 06
Earned Premiums Losses & Expenses Paid
Source: Computed from A.M. Best data by the Insurance Information Institute
Before reforms took hold in the mid-2000s, premium earned rose 54% while losses and expenses rose 125% over the
period from 1990 through 2003,
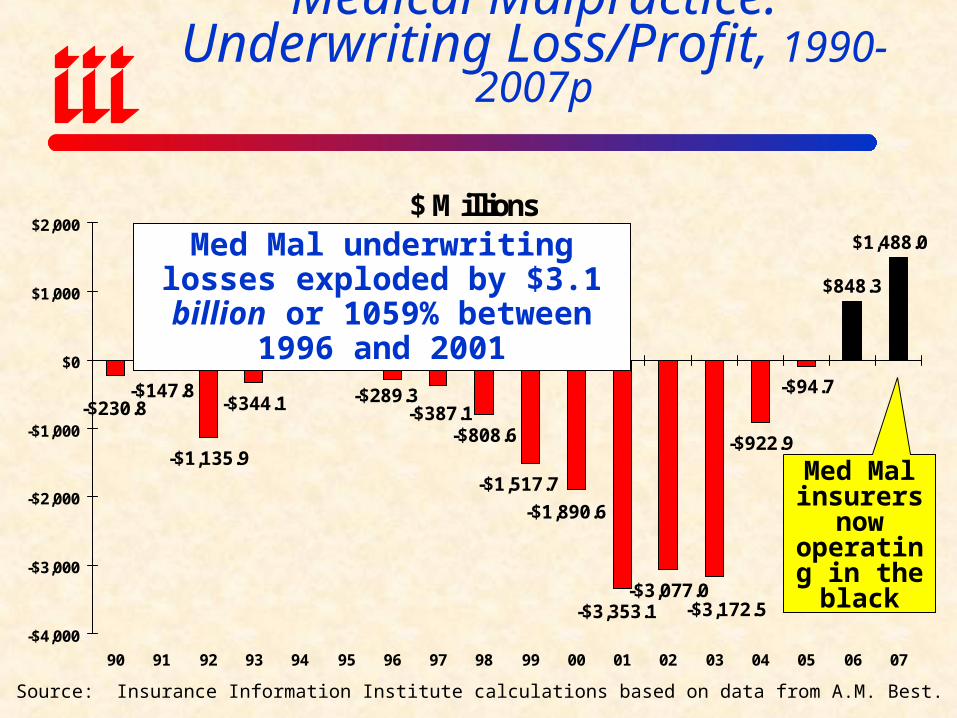
Medical Malpractice:Underwriting Loss/Profit, 1990-2007p
$ Millions
-$147.8
-$1,135.9
-$344.1
-$808.6
-$3,077.0
-$922.9
-$94.7
$848.3
$1,488.0
-$3,172.5-$3,353.1
-$1,890.6
-$1,517.7
-$387.1-$289.3
$111.6$14.4
-$230.8
-$4,000
-$3,000
-$2,000
-$1,000
$0
$1,000
$2,000
90 91 92 93 94 95 96 97 98 99 00 01 02 03 04 05 06 07
Source: Insurance Information Institute calculations based on data from A.M. Best.
Med Mal underwriting losses exploded by $3.1 billion or 1059%
between 1996 and 2001
Med Mal insurers
now operating
in the black
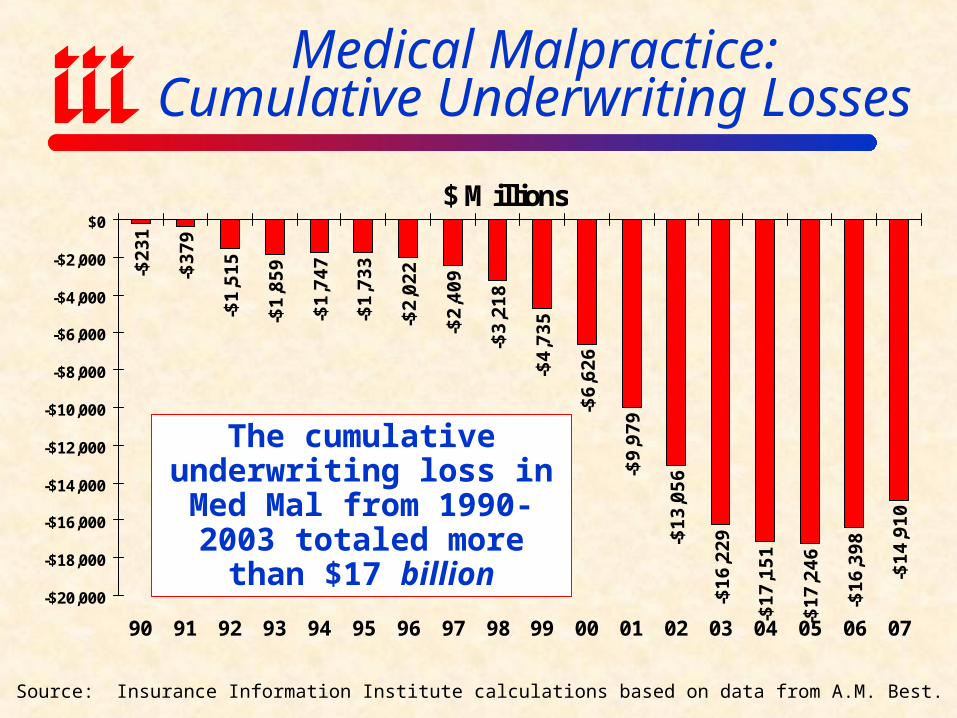
Medical Malpractice:Cumulative Underwriting Losses
$ Millions
-$2
31
-$3
79
-$1
,51
5
-$1
,85
9
-$1
,74
7
-$1
,73
3
-$2
,02
2
-$2
,40
9
-$3
,21
8
-$4
,73
5
-$6
,62
6
-$9
,97
9
-$1
3,0
56
-$1
6,2
29
-$1
7,1
51
-$1
7,2
46
-$1
6,3
98
-$1
4,9
10
-$20,000
-$18,000
-$16,000
-$14,000
-$12,000
-$10,000
-$8,000
-$6,000
-$4,000
-$2,000
$0
90 91 92 93 94 95 96 97 98 99 00 01 02 03 04 05 06 07
The cumulative underwriting loss in Med
Mal from 1990-2003 totaled more than $17 billion
Source: Insurance Information Institute calculations based on data from A.M. Best.
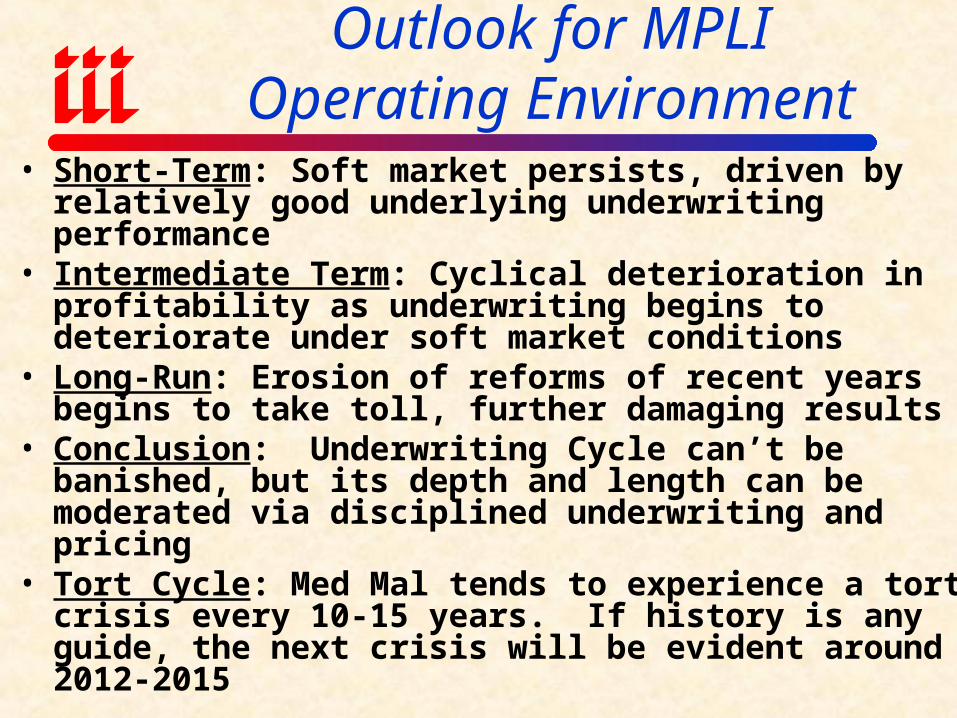
Outlook for MPLIOperating Environment
• Short-Term: Soft market persists, driven by relatively good underlying underwriting performance
• Intermediate Term: Cyclical deterioration in profitability as underwriting begins to deteriorate under soft market conditions
• Long-Run: Erosion of reforms of recent years begins to take toll, further damaging results
• Conclusion: Underwriting Cycle can’t be banished, but its depth and length can be moderated via disciplined underwriting and pricing
• Tort Cycle: Med Mal tends to experience a tort crisis every 10-15 years. If history is any guide, the next crisis will be evident around 2012-2015

Investment Componentof Medical Malpractice
Operating Results
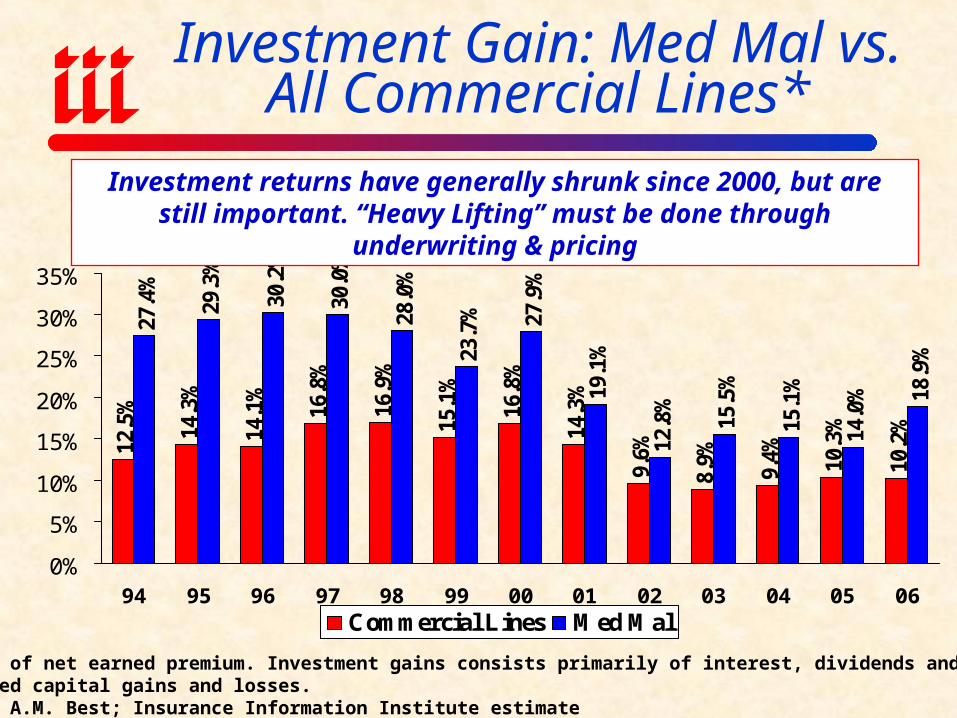
Investment Gain: Med Mal vs.All Commercial Lines*
*As a % of net earned premium. Investment gains consists primarily of interest, dividends and realized capital gains and losses.Source: A.M. Best; Insurance Information Institute estimate
12.5
%
14.3
%
14.1
%
16.8
%
16.9
%
15.1
%
16.8
%
14.3
%
9.6%
8.9%
9.4% 10
.3%
10.2
%
27.4
%
29.3
%
30.2
%
30.0
%
28.0
%
23.7
% 27.9
%
19.1
%
12.8
%
15.5
%
15.1
%
14.0
% 18.9
%
0%
5%
10%
15%
20%
25%
30%
35%
94 95 96 97 98 99 00 01 02 03 04 05 06
Commercial Lines Med Mal
Investment returns have generally shrunk since 2000, but are still important. “Heavy Lifting” must be done through underwriting & pricing
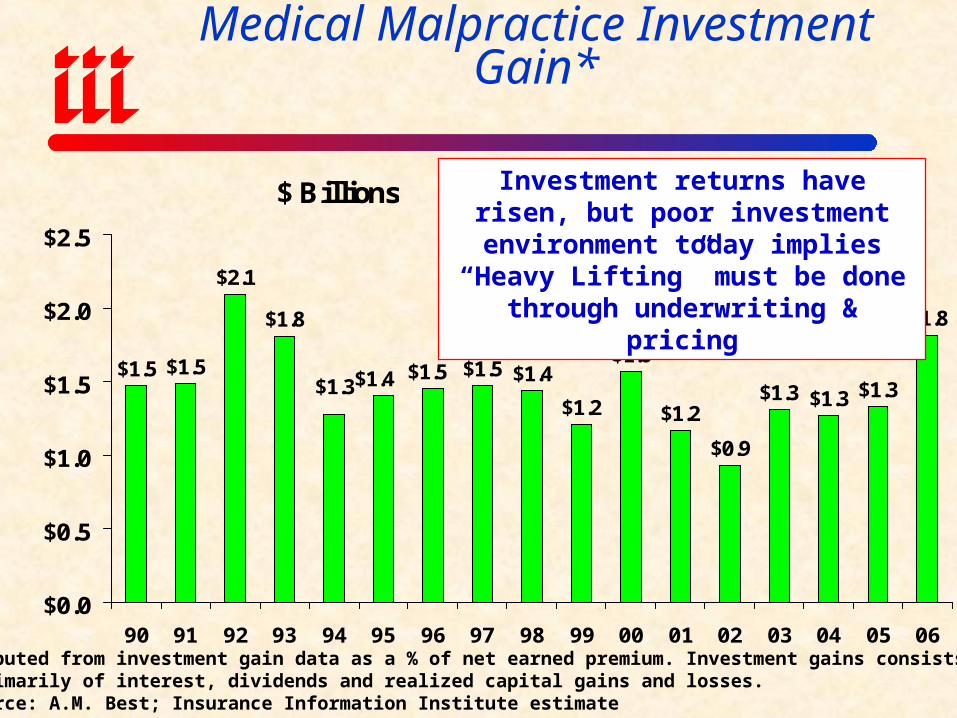
Medical Malpractice Investment Gain*
$ Billions
$1.5 $1.5
$2.1
$1.8
$1.5 $1.4
$1.2
$1.6
$1.2
$0.9
$1.3 $1.3 $1.3
$1.8
$1.3$1.4 $1.5
$0.0
$0.5
$1.0
$1.5
$2.0
$2.5
90 91 92 93 94 95 96 97 98 99 00 01 02 03 04 05 06*Imputed from investment gain data as a % of net earned premium. Investment gains consists primarily of interest, dividends and realized capital gains and losses.Source: A.M. Best; Insurance Information Institute estimate
Investment returns have risen, but poor investment environment today implies “Heavy Lifting” must be done through
underwriting & pricing
Medical Malpractice Tort
Environment
Harvesting the Fruitsof Reform
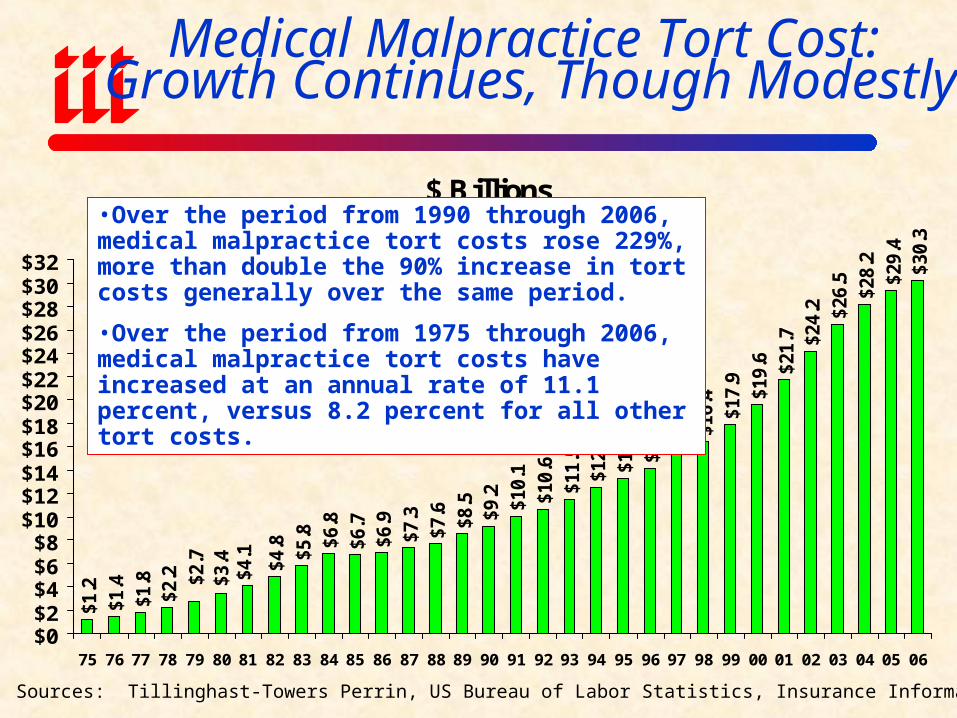
Medical Malpractice Tort Cost: Growth Continues, Though Modestly
$ Billions
$1.2
$1.4
$1.8
$2.2 $4
.8 $5.8 $6
.8
$6.7
$6.9
$7.3
$7.6
$8.5
$9.2
$10.
1
$10.
6
$11
.5$1
2.5
$13.
3
$14.
1
$15.
5$1
6.4
$17.
9
$19.
6
$21.
7 $24.
2 $26.
5
$28.
2
$29.
4$3
0.3
$2.7
$3.4
$4.1
$0$2$4$6$8
$10$12$14$16$18$20$22$24$26$28$30$32
75 76 77 78 79 80 81 82 83 84 85 86 87 88 89 90 91 92 93 94 95 96 97 98 99 00 01 02 03 04 05 06
Sources: Tillinghast-Towers Perrin, US Bureau of Labor Statistics, Insurance Information Institute
•Over the period from 1990 through 2006, medical malpractice tort costs rose 229%, more than double the 90% increase in tort costs generally over the same period.
•Over the period from 1975 through 2006, medical malpractice tort costs have increased at an annual rate of 11.1 percent, versus 8.2 percent for all other tort costs.
ME
NH
MA
CT
PA
WVVA
NC
LA
TX
OK
NE
ND
MN
MI
IL
IA
ID
WA
OR
AZ
HI
NJ
RI
MDDE
AL
VT
NY
DC
SC
GA
TN
AL
FL
MS
ARNM
KYMOKS
SDWI
IN
OH
MT
CA
NV
UT
WY
CO
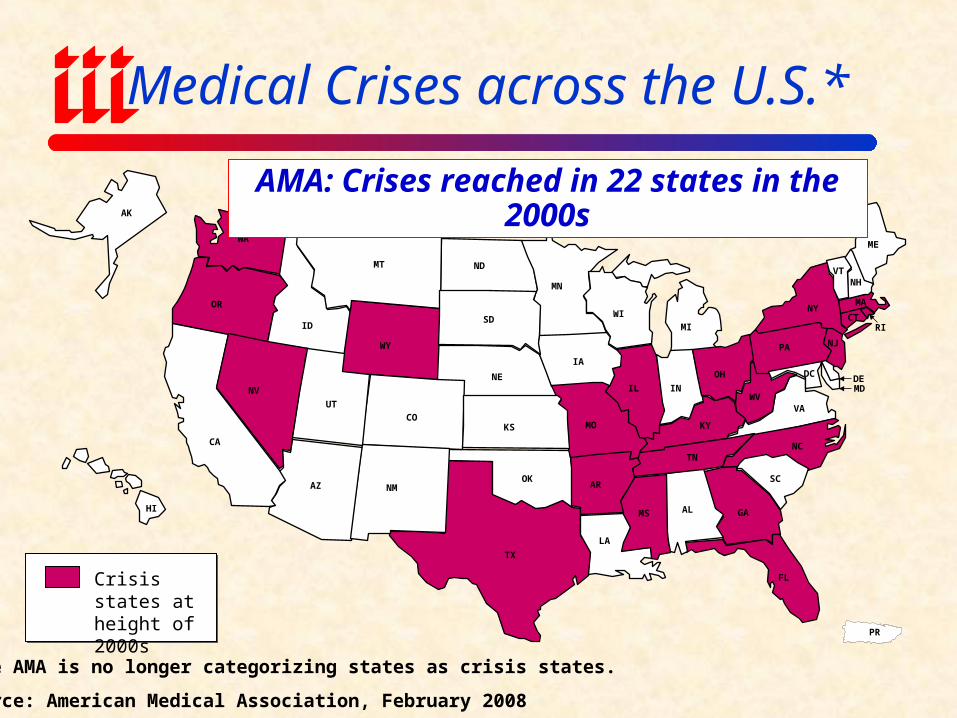
Medical Crises across the U.S.*
Crisis states at height of 2000s
AMA: Crises reached in 22 states in the 2000s
PR
AK
*The AMA is no longer categorizing states as crisis states.
Source: American Medical Association, February 2008
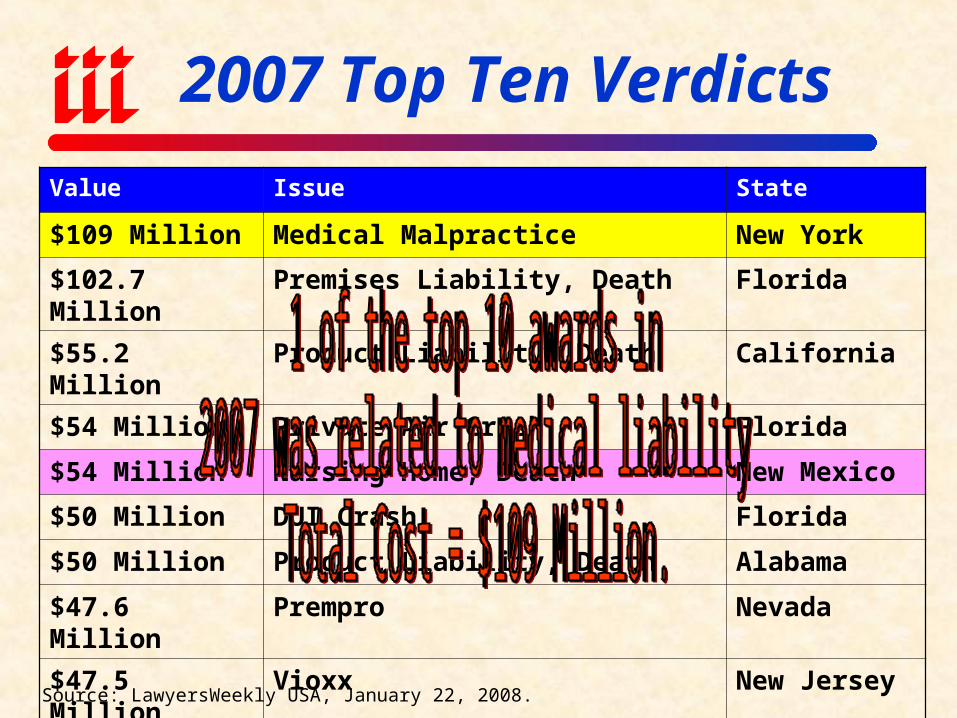
2007 Top Ten Verdicts
Source: LawyersWeekly USA, January 22, 2008.
Value Issue State
$109 Million Medical Malpractice New York
$102.7 Million Premises Liability, Death Florida
$55.2 Million Product Liability, Death California
$54 Million Private Air Crash Florida
$54 Million Nursing Home, Death New Mexico
$50 Million DUI Crash Florida
$50 Million Product Liability, Death Alabama
$47.6 Million Prempro Nevada
$47.5 Million Vioxx New Jersey
$45 Million Auto Crash, Death Florida
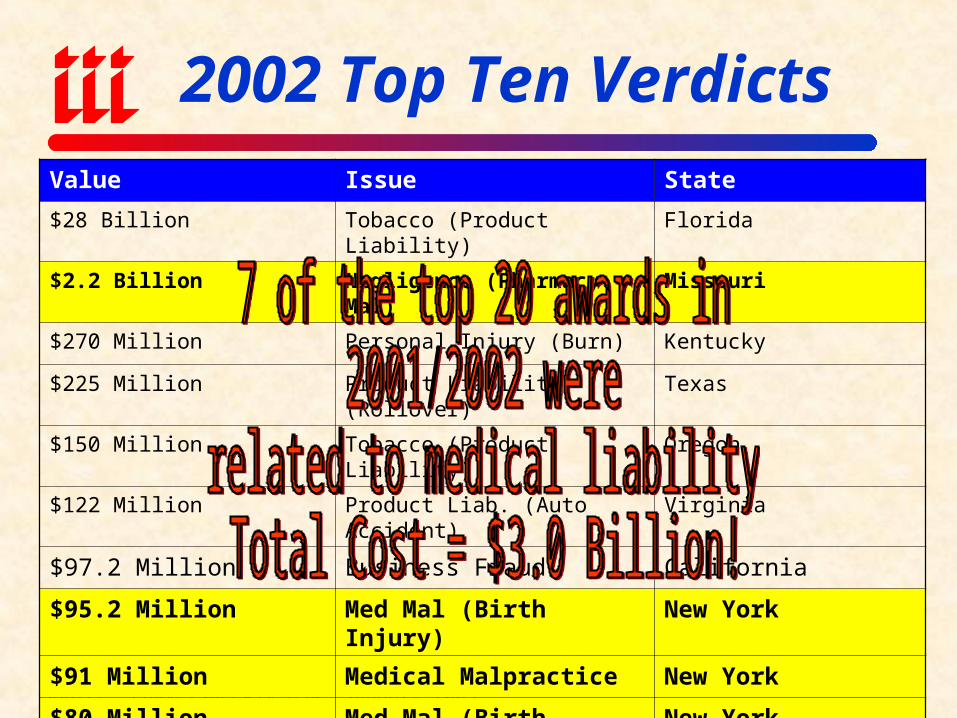
2002 Top Ten Verdicts
Source: LawyersWeekly USA, January 2003.
Value Issue State
$28 Billion Tobacco (Product Liability) Florida
$2.2 Billion Negligence (Pharmacy Mal) Missouri
$270 Million Personal Injury (Burn) Kentucky
$225 Million Product Liability (Rollover) Texas
$150 Million Tobacco (Product Liability) Oregon
$122 Million Product Liab. (Auto Accident) Virginia
$97.2 Million Business Fraud California
$95.2 Million Med Mal (Birth Injury) New York
$91 Million Medical Malpractice New York
$80 Million Med Mal (Birth Injury) New York
$80 Million Prod. Liab/Personal Inj. (Auto) Missouri
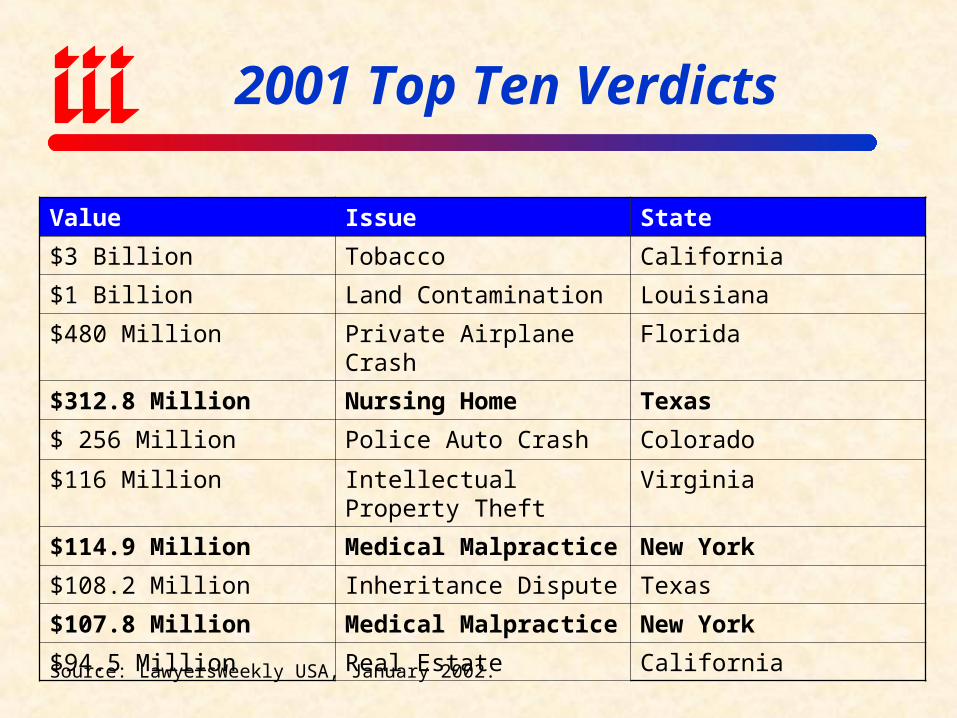
2001 Top Ten Verdicts
Source: LawyersWeekly USA, January 2002.
Value Issue State
$3 Billion Tobacco California
$1 Billion Land Contamination Louisiana
$480 Million Private Airplane Crash Florida
$312.8 Million Nursing Home Texas
$ 256 Million Police Auto Crash Colorado
$116 Million Intellectual Property Theft Virginia
$114.9 Million Medical Malpractice New York
$108.2 Million Inheritance Dispute Texas
$107.8 Million Medical Malpractice New York
$94.5 Million Real Estate California
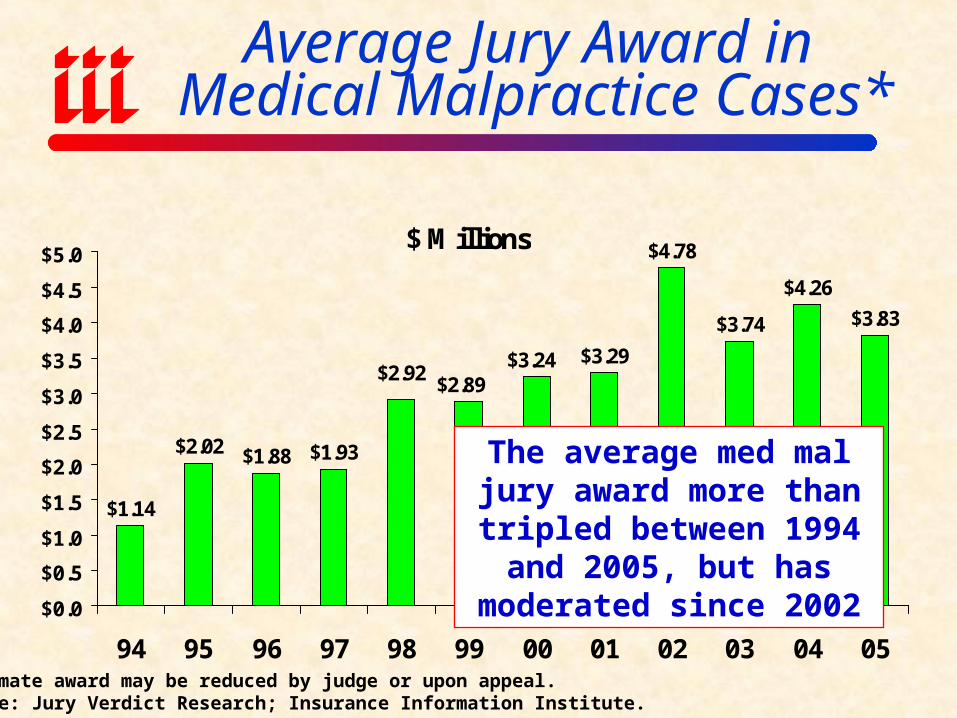
Average Jury Award in Medical Malpractice Cases*
$ Millions
$1.14
$2.02 $1.88 $1.93
$3.29
$4.78
$3.74
$4.26
$3.83
$2.92$2.89
$3.24
$0.0
$0.5
$1.0
$1.5
$2.0
$2.5
$3.0
$3.5
$4.0
$4.5
$5.0
94 95 96 97 98 99 00 01 02 03 04 05*Ultimate award may be reduced by judge or upon appeal.Source: Jury Verdict Research; Insurance Information Institute.
The average med mal jury award more than tripled
between 1994 and 2005, but has moderated since 2002
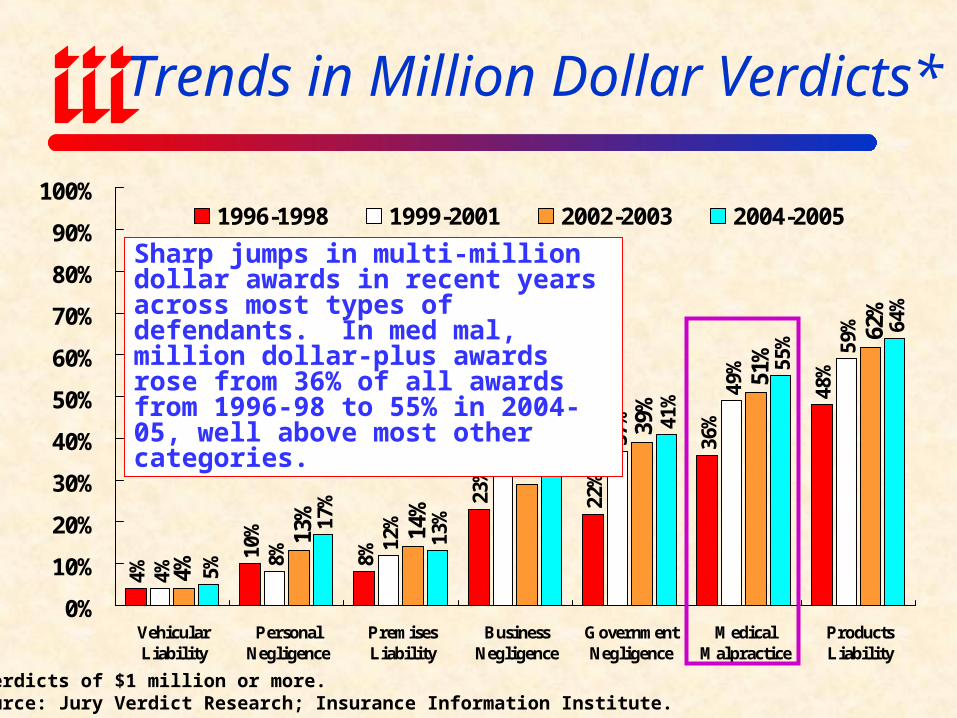
Trends in Million Dollar Verdicts*4%
10%
8%
23%
22%
36%
48%
4%
8%
12%
31% 37
%
49%
59%
13%
14%
29%
51%
62%
5%
17%
13%
32%
41%
55%
64%
4%
39%
0%
10%
20%
30%
40%
50%
60%
70%
80%
90%
100%
VehicularLiability
PersonalNegligence
PremisesLiability
BusinessNegligence
GovernmentNegligence
MedicalMalpractice
ProductsLiability
1996-1998 1999-2001 2002-2003 2004-2005
*Verdicts of $1 million or more.Source: Jury Verdict Research; Insurance Information Institute.
Sharp jumps in multi-million dollar awards in recent years across most types of defendants. In med mal, million dollar-plus awards rose from 36% of all awards from 1996-98 to 55% in 2004-05, well above most other categories.
MERGER & ACQUISITION
Catalysts for P/C Consolidation Growing
in 2008
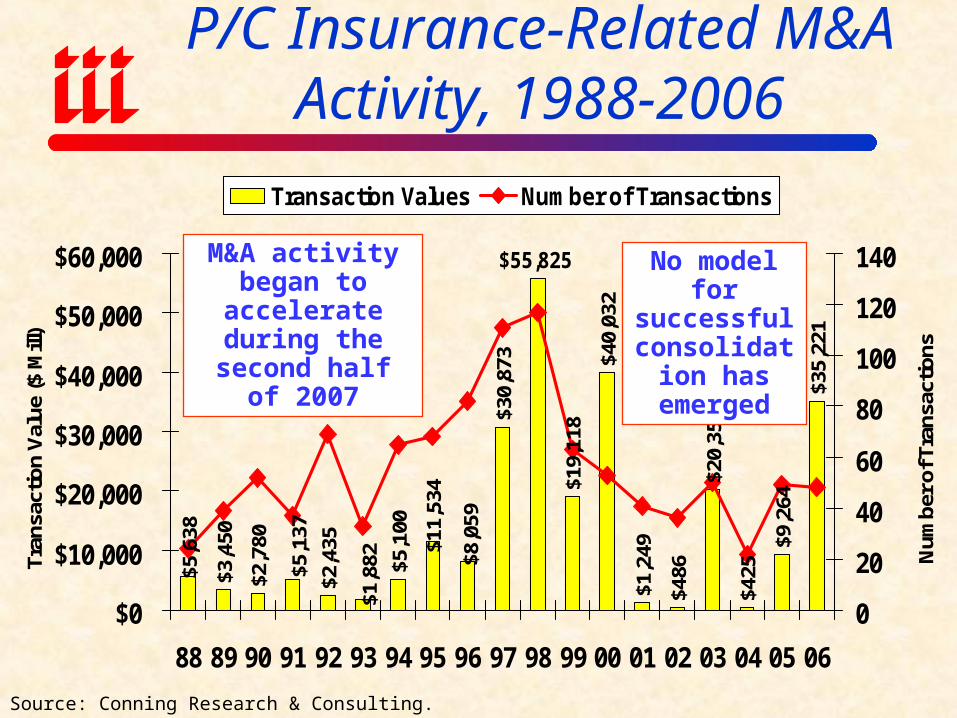
P/C Insurance-Related M&A Activity, 1988-2006
$2,4
35
$5,1
00
$19,
118
$40,
032
$1,2
49
$486
$20,
353
$425
$9,2
64
$35,
221
$55,825
$30,
873
$8,0
59
$11,
534
$1,8
82
$3,4
50
$2,7
80
$5,1
37
$5,6
38
$0
$10,000
$20,000
$30,000
$40,000
$50,000
$60,000
88 89 90 91 92 93 94 95 96 97 98 99 00 01 02 03 04 05 06
Tran
sact
ion
Val
ue ($
Mill
)
0
20
40
60
80
100
120
140
Num
ber o
f Tra
nsac
tions
Transaction Values Number of Transactions
Source: Conning Research & Consulting.
M&A activity began to accelerate during the second
half of 2007
No model for successful
consolidation has emerged
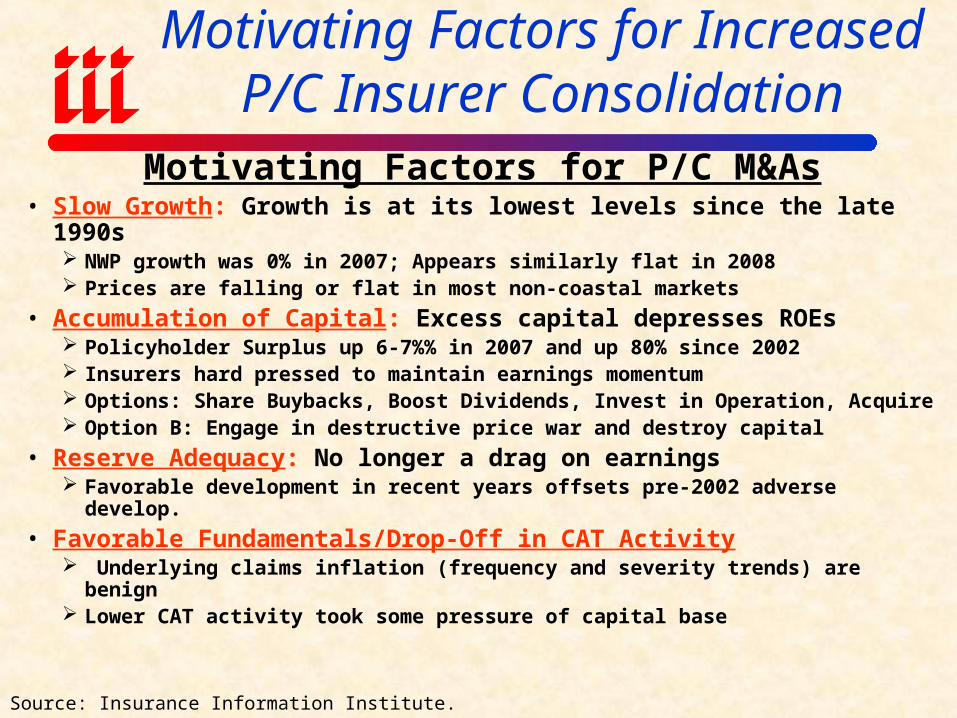
Motivating Factors for Increased P/C Insurer Consolidation
Motivating Factors for P/C M&As• Slow Growth: Growth is at its lowest levels since the late 1990s
NWP growth was 0% in 2007; Appears similarly flat in 2008 Prices are falling or flat in most non-coastal markets
• Accumulation of Capital: Excess capital depresses ROEs Policyholder Surplus up 6-7%% in 2007 and up 80% since 2002 Insurers hard pressed to maintain earnings momentum Options: Share Buybacks, Boost Dividends, Invest in Operation, Acquire Option B: Engage in destructive price war and destroy capital
• Reserve Adequacy: No longer a drag on earnings Favorable development in recent years offsets pre-2002 adverse develop.
• Favorable Fundamentals/Drop-Off in CAT Activity Underlying claims inflation (frequency and severity trends) are benign Lower CAT activity took some pressure of capital base
Source: Insurance Information Institute.

P/C INVESTMENT OVERVIEW
More Pain, Little Gain
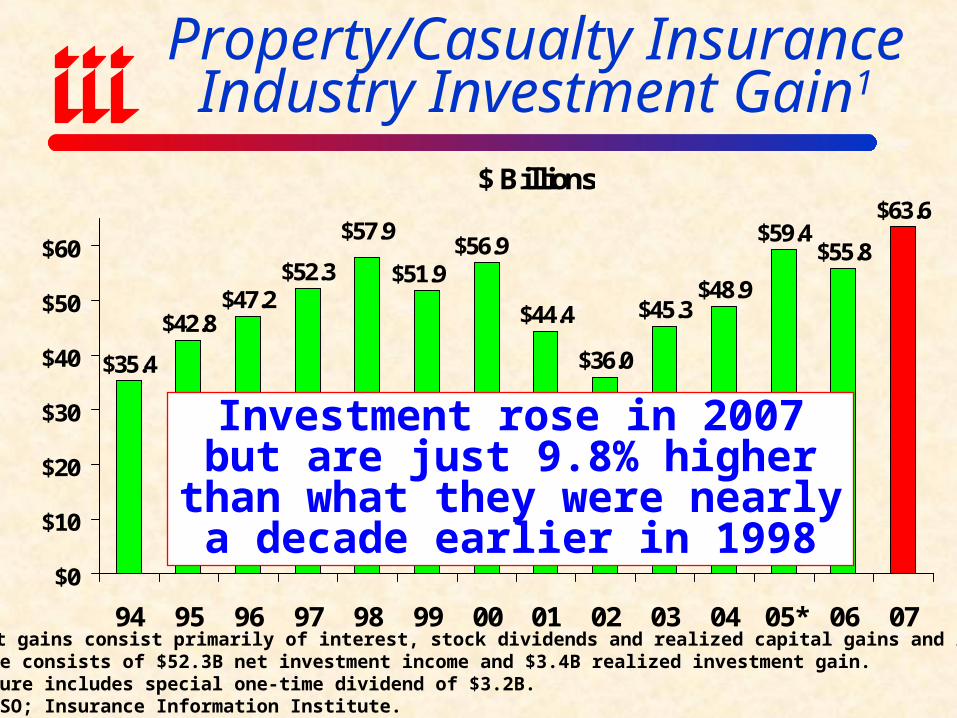
Property/Casualty Insurance Industry Investment Gain1
$ Billions
$35.4
$42.8$47.2
$52.3
$44.4
$36.0
$45.3$48.9
$59.4$55.8
$63.6
$56.9$51.9
$57.9
$0
$10
$20
$30
$40
$50
$60
94 95 96 97 98 99 00 01 02 03 04 05* 06 071Investment gains consist primarily of interest, stock dividends and realized capital gains and losses. 2006 figure consists of $52.3B net investment income and $3.4B realized investment gain. *2005 figure includes special one-time dividend of $3.2B. Sources: ISO; Insurance Information Institute.
Investment rose in 2007 but are just 9.8% higher than what they were
nearly a decade earlier in 1998
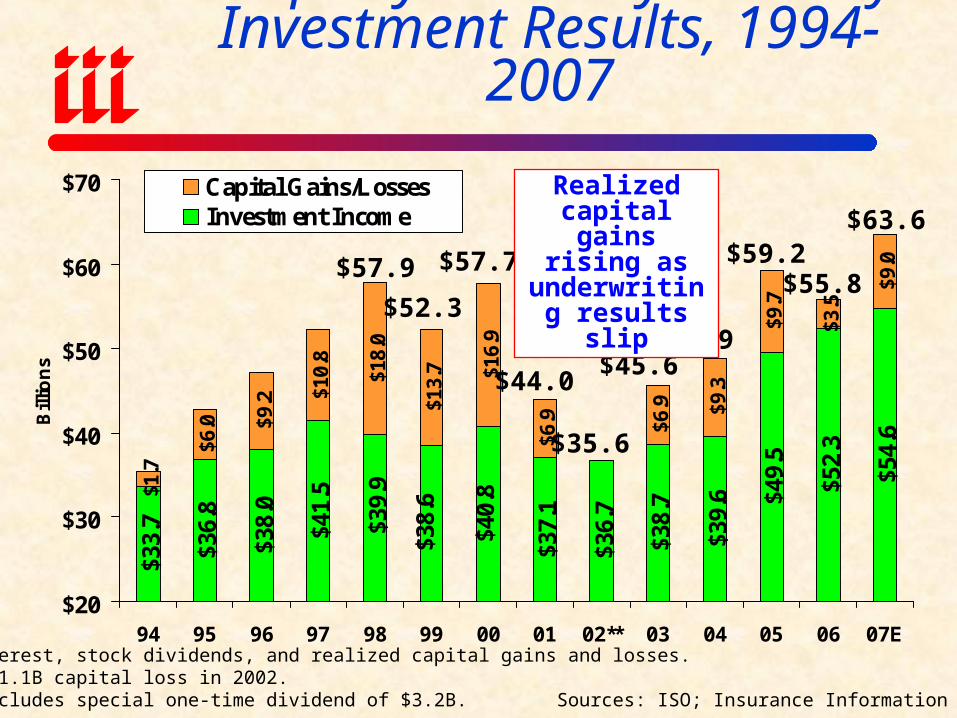
Property/Casualty Industry Investment Results, 1994-2007
$33.
7
$36.
8
$38.
0
$41.
5
$37.
1
$36.
7
$38.
7
$39.
6 $49.
5
$52.
3
$54.
6
$1.7
$6.0 $9
.2 $10.
8
$18.
0
$13.
7 $16.
9
$6.9 $6
.9 $9.3
$9.7
$3.5
$9.0
$40.
8
$38.
6
$39.
9
$20
$30
$40
$50
$60
$70
94 95 96 97 98 99 00 01 02** 03 04 05 06 07E
Bill
ion
s
Capital Gains/LossesInvestment Income
*Primarily interest, stock dividends, and realized capital gains and losses.**Not shown: $1.1B capital loss in 2002.2005 figure includes special one-time dividend of $3.2B. Sources: ISO; Insurance Information Institute.
$52.3
$57.7
$44.0
$35.6
$45.6$48.9
$59.2$55.8
$63.6Realized capital gains rising as underwriting
results slip$57.9
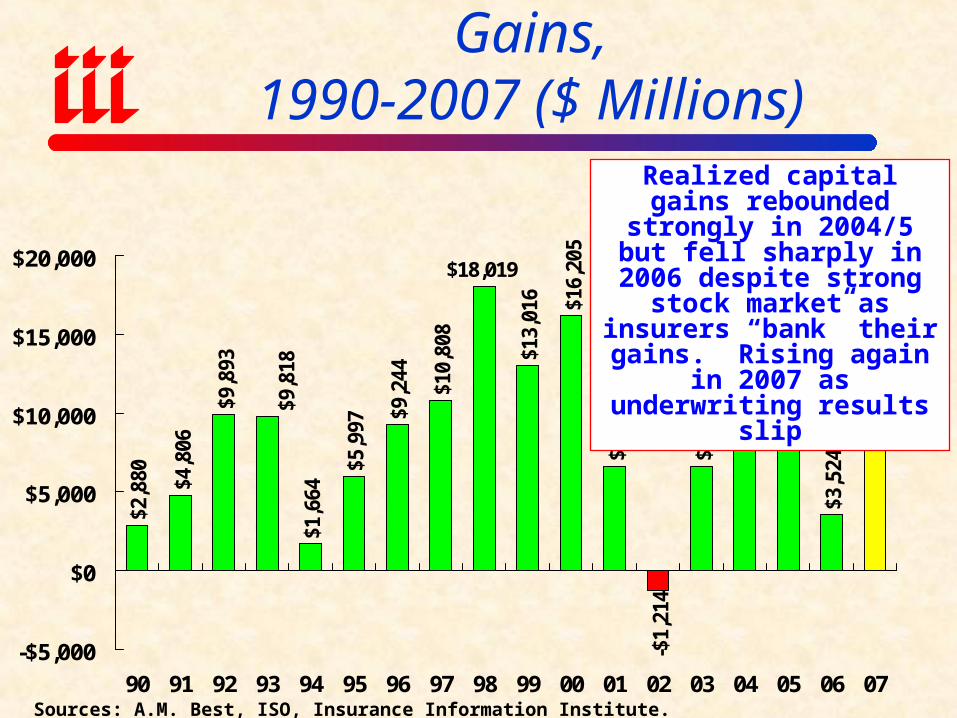
US P/C Net Realized Capital Gains,1990-2007 ($ Millions)
$2,8
80 $4,8
06
$9,8
93
$1,6
64
$5,9
97
$9,2
44
$10,
808
$13,
016 $1
6,20
5
$6,6
31
-$1,
214
$6,6
10 $8,9
71
$18,019
$3,5
24
$9,7
01
$9,1
25
$9,8
18
-$5,000
$0
$5,000
$10,000
$15,000
$20,000
90 91 92 93 94 95 96 97 98 99 00 01 02 03 04 05 06 07Sources: A.M. Best, ISO, Insurance Information Institute.
Realized capital gains rebounded strongly in 2004/5
but fell sharply in 2006 despite strong stock market
as insurers “bank” their gains. Rising again in 2007 as underwriting results slip
-30%
-20%
-10%
0%
10%
20%
30%
40%
19
70
19
72
19
74
19
76
19
78
19
80
19
82
19
84
19
86
19
88
19
90
19
92
19
94
19
96
19
98
20
00
20
02
20
04
20
06
20
08
Source: Ibbotson Associates, Insurance Information Institute. *Through May 9, 2008.
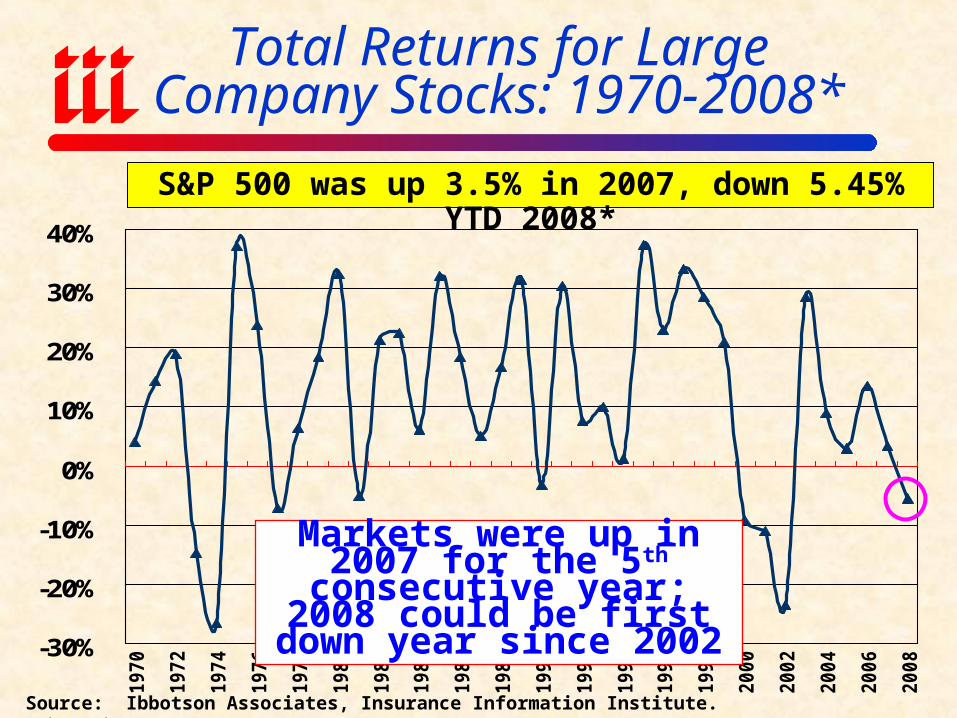
Total Returns for Large Company Stocks: 1970-2008*
S&P 500 was up 3.5% in 2007, down 5.45% YTD 2008*
Markets were up in 2007 for the 5th consecutive year; 2008
could be first down year since 2002
2%
3%
4%
5%
6%
7%
8%
9%
90 91 92 93 94 95 96 97 98 99 00 01 02 03 04 05 06 07 08*
P-C Inv Income/Inv Assets 10-Year Treasury Note
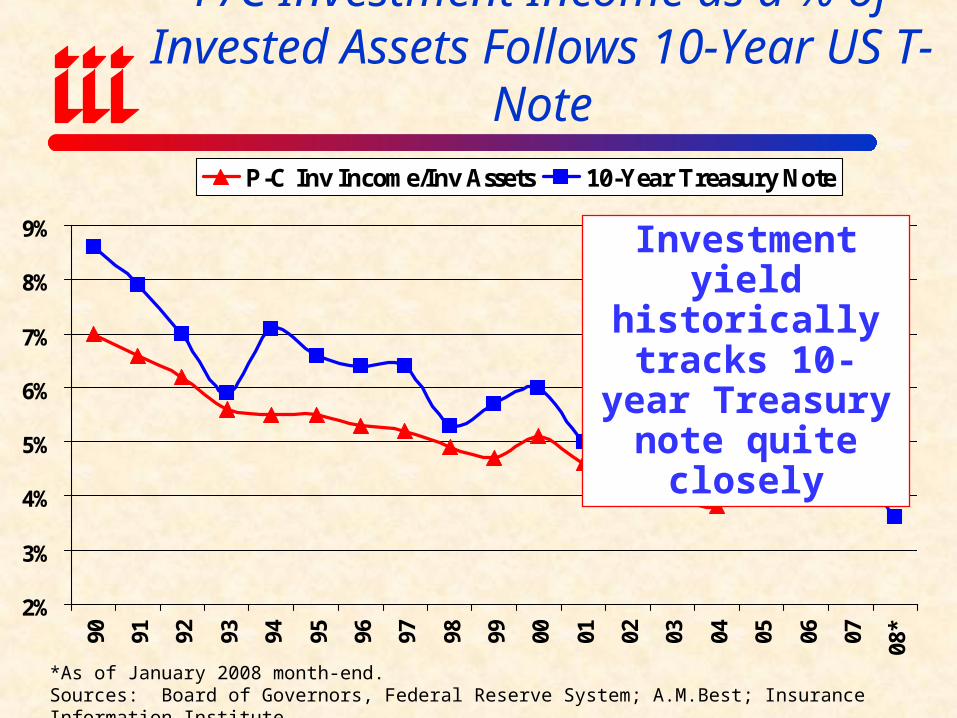
P/C Investment Income as a % of Invested Assets Follows 10-Year US T-Note
*As of January 2008 month-end.Sources: Board of Governors, Federal Reserve System; A.M.Best; Insurance Information Institute.
Investment yield historically tracks 10-year Treasury note quite closely
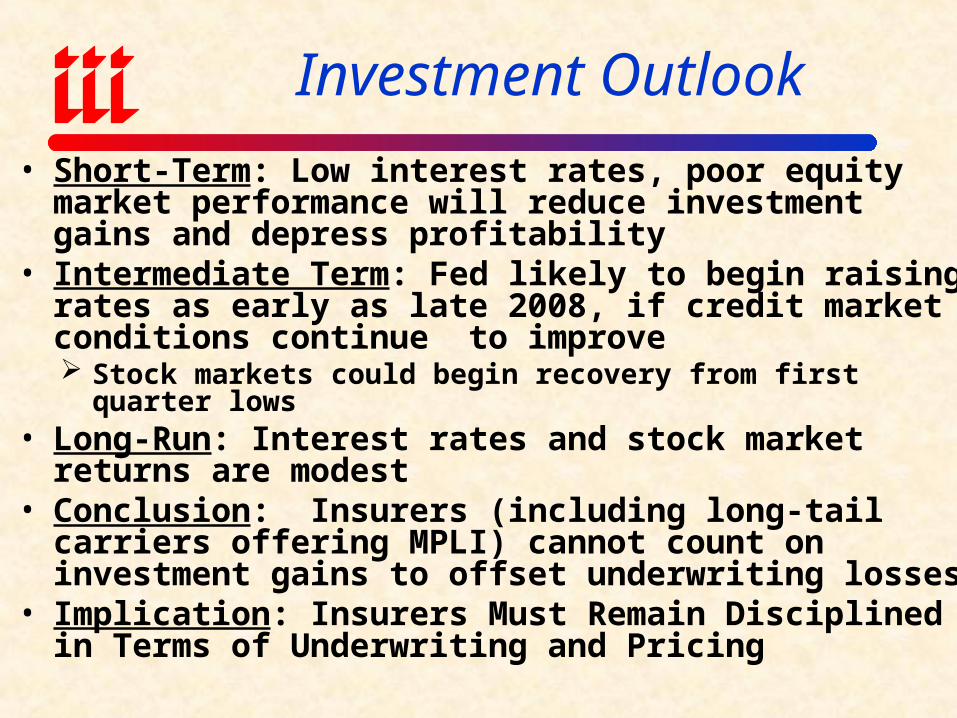
Investment Outlook
• Short-Term: Low interest rates, poor equity market performance will reduce investment gains and depress profitability
• Intermediate Term: Fed likely to begin raising rates as early as late 2008, if credit market conditions continue to improve Stock markets could begin recovery from first quarter lows
• Long-Run: Interest rates and stock market returns are modest
• Conclusion: Insurers (including long-tail carriers offering MPLI) cannot count on investment gains to offset underwriting losses
• Implication: Insurers Must Remain Disciplined in Terms of Underwriting and Pricing
REINSURANCE MARKETS
Reinsurance Prices are Falling in Non-Coastal Zones, Casualty Lines
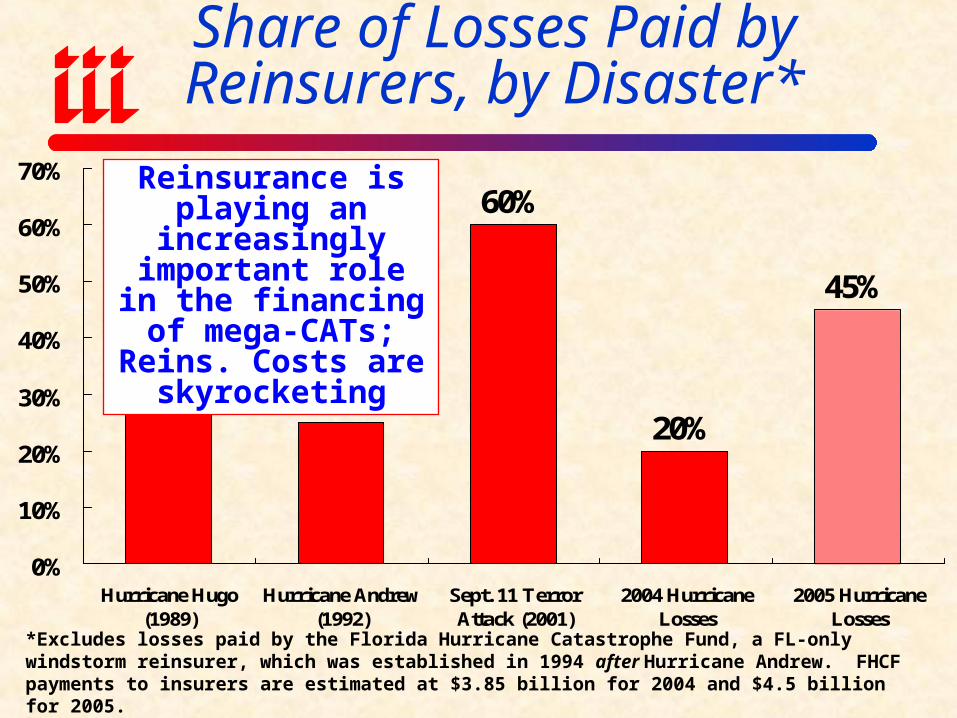
Share of Losses Paid by Reinsurers, by Disaster*
30%25%
60%
20%
45%
0%
10%
20%
30%
40%
50%
60%
70%
Hurricane Hugo(1989)
Hurricane Andrew(1992)
Sept. 11 TerrorAttack (2001)
2004 HurricaneLosses
2005 HurricaneLosses
*Excludes losses paid by the Florida Hurricane Catastrophe Fund, a FL-only windstorm reinsurer, which was established in 1994 after Hurricane Andrew. FHCF payments to insurers are estimated at $3.85 billion for 2004 and $4.5 billion for 2005.Sources: Wharton Risk Center, Disaster Insurance Project; Insurance Information Institute.
Reinsurance is playing an increasingly
important role in the financing of mega-CATs; Reins. Costs
are skyrocketing
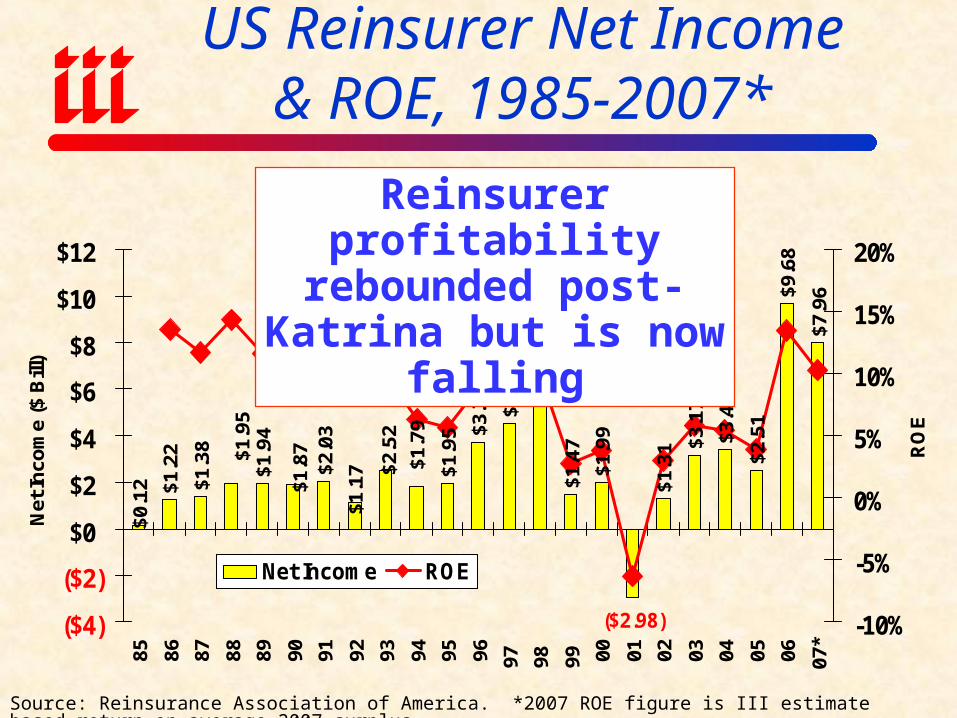
US Reinsurer Net Income& ROE, 1985-2007*
$1.9
4
$2.0
3
$1.9
5 $3.7
1
$4.5
3
$5.4
3
$1.4
7
$1.9
9
$1.3
1 $3.1
7
$3.4
1
$2.5
1
$9.6
8
$7.9
6
($2.98)
$0.1
2
$1.9
5
$1.3
8
$1.2
2
$1.8
7
$1.1
7 $2.5
2$1
.79
($4)
($2)
$0
$2
$4
$6
$8
$10
$12
85 86 87 88 89 90 91 92 93 94 95 96 97 98 99 00 01 02 03 04 05 06 07*
Net
Inco
me
($ B
ill)
-10%
-5%
0%
5%
10%
15%
20%
RO
E
Net Income ROE
Source: Reinsurance Association of America. *2007 ROE figure is III estimate based return on average 2007 surplus.
Reinsurer profitability rebounded post-Katrina
but is now falling
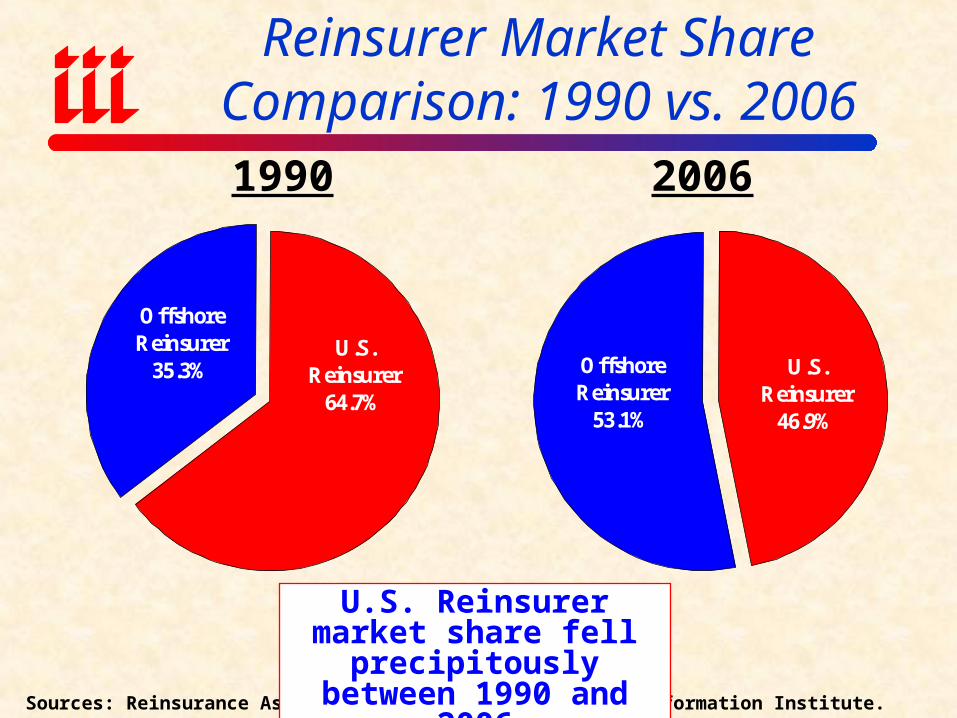
Reinsurer Market Share Comparison: 1990 vs. 2006
U.S. Reinsurer
64.7%
Offshore Reinsurer
35.3%
1990 2006
Sources: Reinsurance Association of America; Insurance Information Institute.
U.S. Reinsurer
46.9%
Offshore Reinsurer
53.1%
U.S. Reinsurer market share fell precipitously between 1990 and 2006
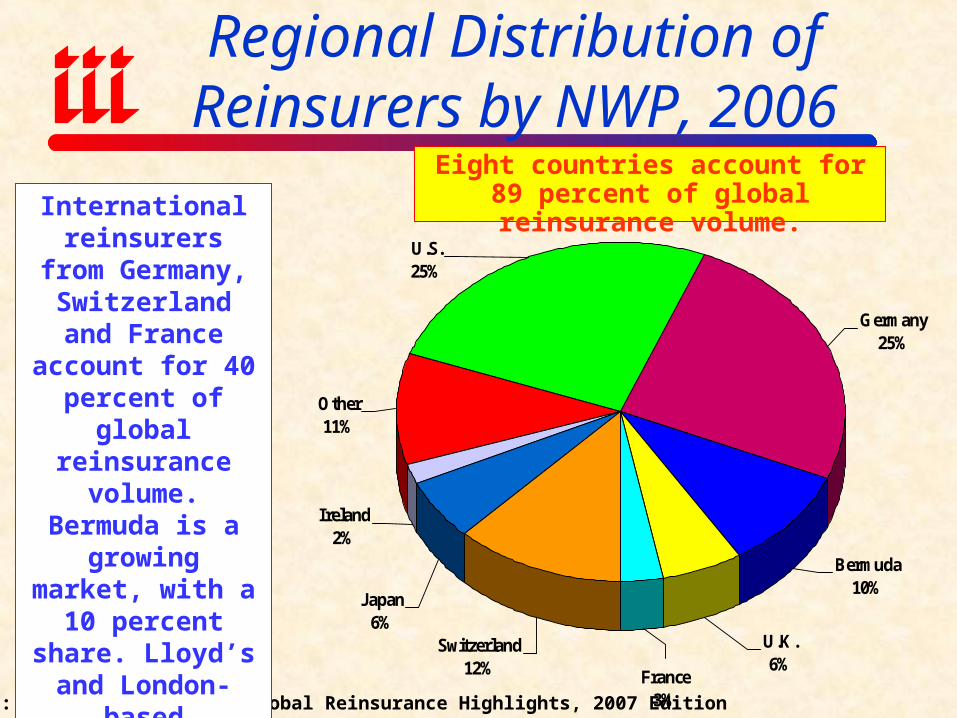
Regional Distribution of Reinsurers by NWP, 2006
Other11%
U.K.6%
Switzerland12%
Ireland2%
Japan6%
Germany25%
France3%
Bermuda10%
U.S.25%
Source: Standard & Poor’s, Global Reinsurance Highlights, 2007 Edition
International reinsurers from
Germany, Switzerland and
France account for 40 percent of global reinsurance volume.
Bermuda is a growing market, with a 10 percent
share. Lloyd’s and London-based
reinsurers account for 6 percent of the
world market.
Eight countries account for 89 percent of global reinsurance volume.

A STORMY ECONOMIC FORECAST
What a Weakening Economy & Credit Crunch Mean for
the Insurance Industry
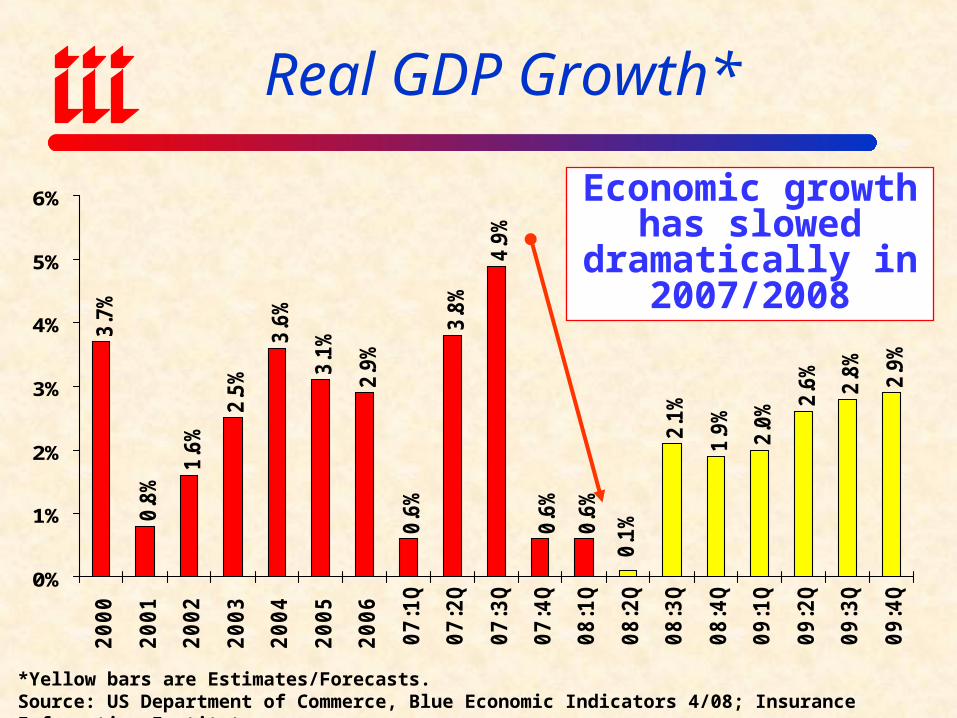
3.7
%
0.8
%
1.6
%
2.5
%
3.6
%
3.1
%
2.9
%
0.6
%
3.8
%
4.9
%
0.6
%
2.1
%
1.9
%
2.0
% 2.6
%
2.8
%
2.9
%
0.6
%
0.1
%
0%
1%
2%
3%
4%
5%
6%
2
00
0
2
00
1
2
00
2
2
00
3
2
00
4
2
00
5
2
00
6
07
:1Q
07
:2Q
07
:3Q
07
:4Q
08
:1Q
08
:2Q
08
:3Q
08
:4Q
09
:1Q
09
:2Q
09
:3Q
09
:4Q
Real GDP Growth*
*Yellow bars are Estimates/Forecasts.Source: US Department of Commerce, Blue Economic Indicators 4/08; Insurance Information Institute.
Economic growth has slowed dramatically
in 2007/2008
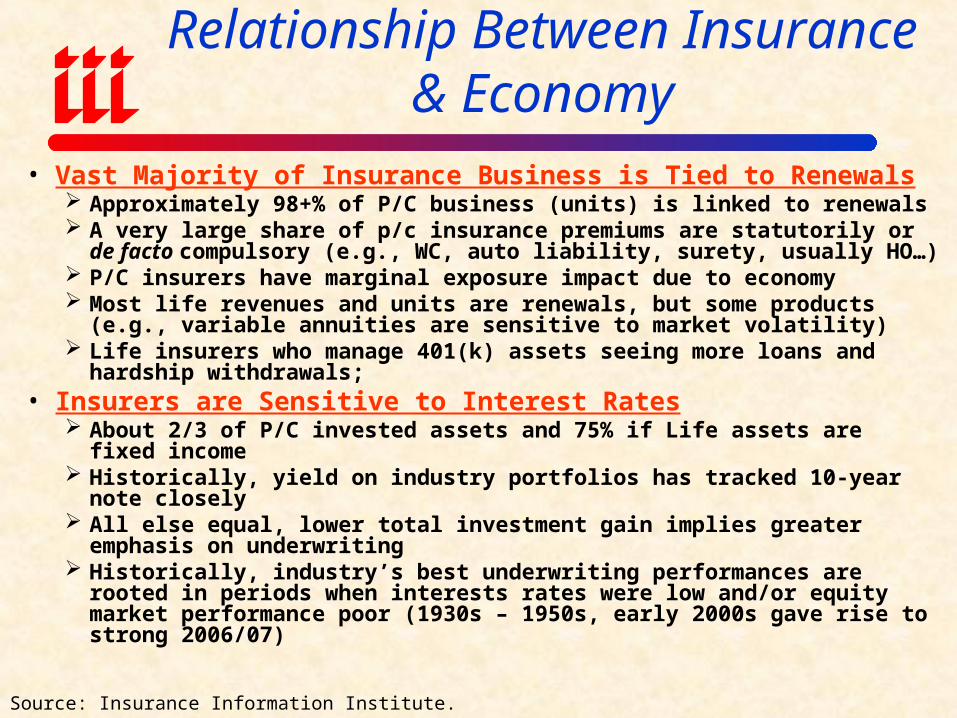
A Few Facts About the Relationship Between Insurance & Economy
• Vast Majority of Insurance Business is Tied to Renewals Approximately 98+% of P/C business (units) is linked to renewals A very large share of p/c insurance premiums are statutorily or de facto
compulsory (e.g., WC, auto liability, surety, usually HO…) P/C insurers have marginal exposure impact due to economy Most life revenues and units are renewals, but some products (e.g.,
variable annuities are sensitive to market volatility) Life insurers who manage 401(k) assets seeing more loans and hardship
withdrawals;• Insurers are Sensitive to Interest Rates
About 2/3 of P/C invested assets and 75% if Life assets are fixed income Historically, yield on industry portfolios has tracked 10-year note closely All else equal, lower total investment gain implies greater emphasis on
underwriting Historically, industry’s best underwriting performances are rooted in
periods when interests rates were low and/or equity market performance poor (1930s – 1950s, early 2000s gave rise to strong 2006/07)
Source: Insurance Information Institute.
5.2%
-0.9
%-7
.4%
-6.5
%-1
.5%
1.8%
4.3%
18.6
%20
.3%
5.8%
0.3%
-1.6
%-1
.0%
-1.8
%-1
.0%
3.1%
1.1%
0.8%
0.4%
0.6%
-0.4
%-0
.3%
1.6%
5.6%
13.7
%7.
7%1.
2%-2
.9% -0
.5%
-2.9
%-2
.7%
-10%
-5%
0%
5%
10%
15%
20%
25%78
79
80
81
82
83
84
85
86
87
88
89
90
91
92
93
94
95
96
97
98
99
00
01
02
03
04
05
06
07
08F
Rea
l N
WP
Gro
wth
-4%
-2%
0%
2%
4%
6%
8%
Rea
l G
DP
Gro
wth
Real NWP Growth Real GDP
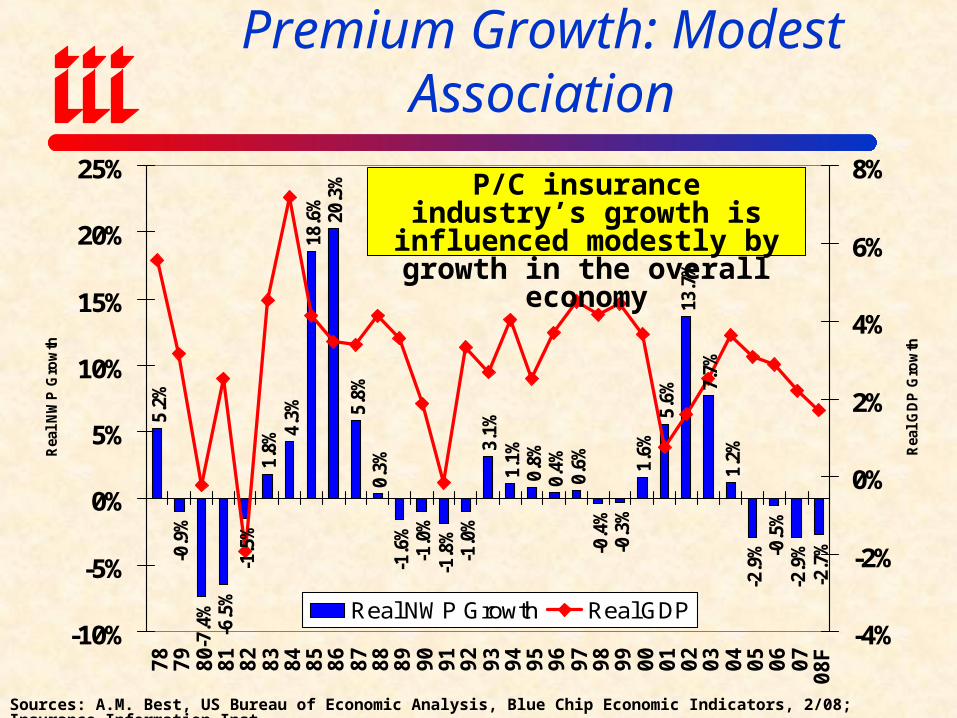
Real GDP Growth vs. Real P/C Premium Growth: Modest Association
P/C insurance industry’s growth is influenced modestly by growth
in the overall economy
Sources: A.M. Best, US Bureau of Economic Analysis, Blue Chip Economic Indicators, 2/08; Insurance Information Inst.
Summary of Treasury “Blueprint”for
Financial Services Modernization
Impacts on Insurers
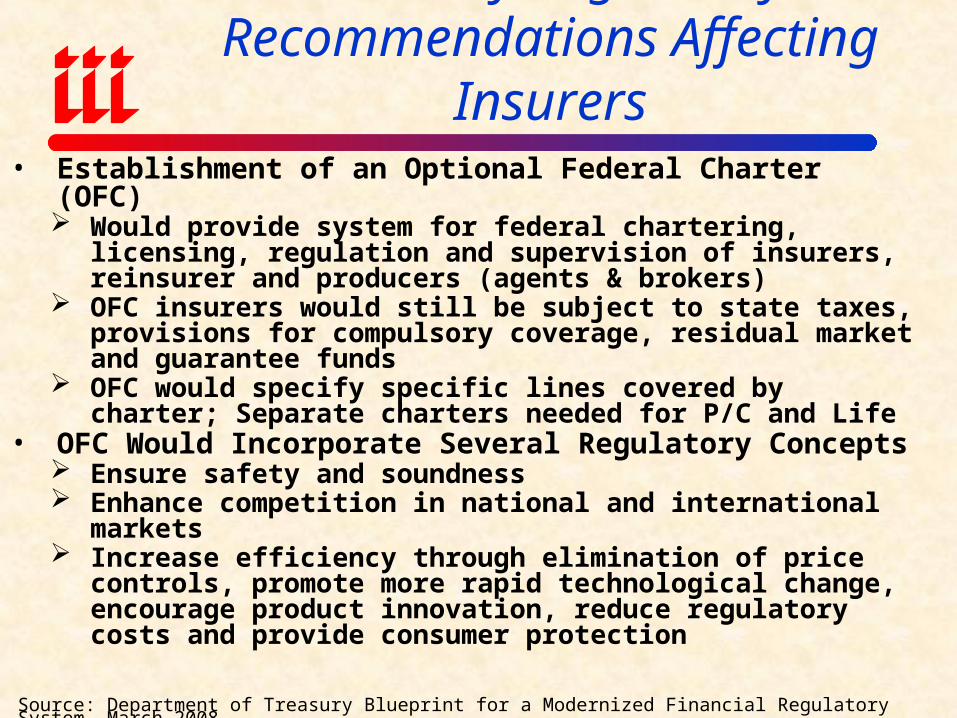
Treasury Regulatory Recommendations Affecting Insurers
Source: Department of Treasury Blueprint for a Modernized Financial Regulatory System, March 2008.
• Establishment of an Optional Federal Charter (OFC) Would provide system for federal chartering, licensing,
regulation and supervision of insurers, reinsurer and producers (agents & brokers)
OFC insurers would still be subject to state taxes, provisions for compulsory coverage, residual market and guarantee funds
OFC would specify specific lines covered by charter; Separate charters needed for P/C and Life
• OFC Would Incorporate Several Regulatory Concepts Ensure safety and soundness Enhance competition in national and international markets Increase efficiency through elimination of price controls,
promote more rapid technological change, encourage product innovation, reduce regulatory costs and provide consumer protection
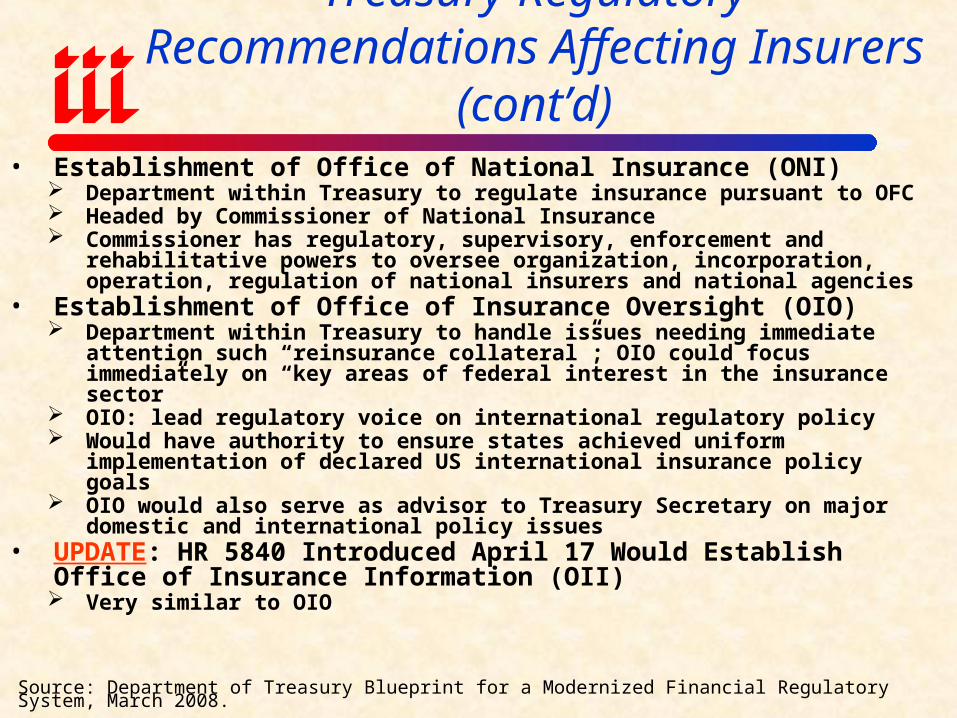
• Establishment of Office of National Insurance (ONI) Department within Treasury to regulate insurance pursuant to OFC Headed by Commissioner of National Insurance Commissioner has regulatory, supervisory, enforcement and
rehabilitative powers to oversee organization, incorporation, operation, regulation of national insurers and national agencies
• Establishment of Office of Insurance Oversight (OIO) Department within Treasury to handle issues needing immediate
attention such “reinsurance collateral”; OIO could focus immediately on “key areas of federal interest in the insurance sector”
OIO: lead regulatory voice on international regulatory policy Would have authority to ensure states achieved uniform implementation
of declared US international insurance policy goals OIO would also serve as advisor to Treasury Secretary on major
domestic and international policy issues• UPDATE: HR 5840 Introduced April 17 Would Establish
Office of Insurance Information (OII) Very similar to OIO
Source: Department of Treasury Blueprint for a Modernized Financial Regulatory System, March 2008.
Treasury Regulatory Recommendations Affecting Insurers (cont’d)

CATASTROPHICLOSS
No Appreciable Spillover Effects
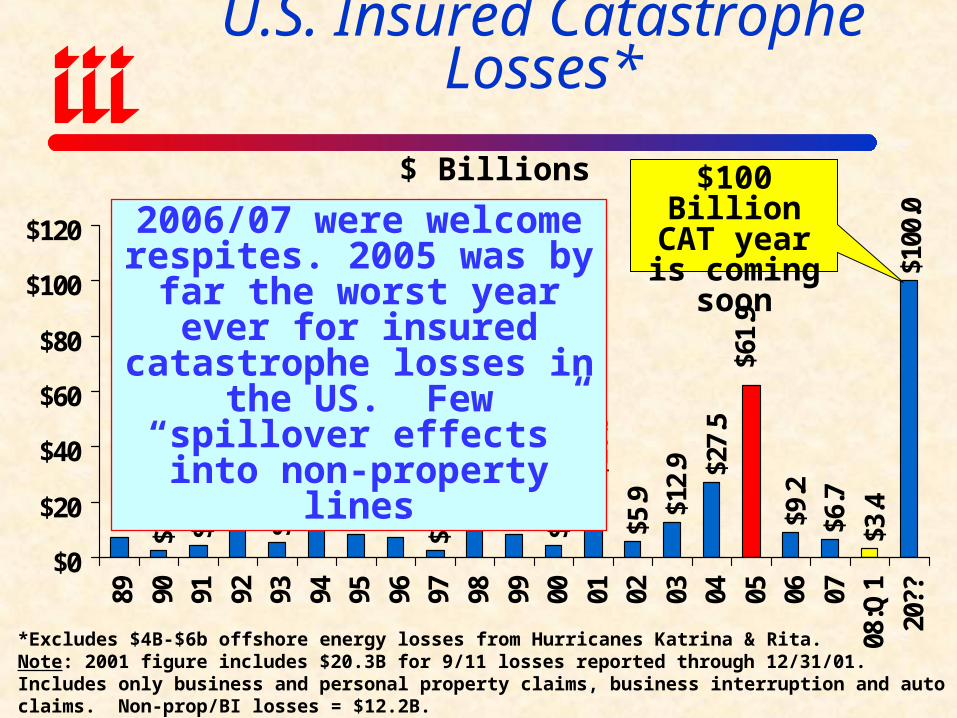
U.S. Insured Catastrophe Losses*$7
.5
$2.7
$4.7
$22.
9
$5.5 $1
6.9
$8.3
$7.4
$2.6 $1
0.1
$8.3
$4.6
$26.
5
$5.9 $1
2.9 $2
7.5
$6.7
$3.4
$100
.0
$61.
9
$9.2
$0
$20
$40
$60
$80
$100
$120
89 90 91 92 93 94 95 96 97 98 99 00 01 02 03 04 05 06 07
08:Q
1
20??
*Excludes $4B-$6b offshore energy losses from Hurricanes Katrina & Rita. Note: 2001 figure includes $20.3B for 9/11 losses reported through 12/31/01. Includes only business and personal property claims, business interruption and auto claims. Non-prop/BI losses = $12.2B.Source: Property Claims Service/ISO; Insurance Information Institute
$ Billions
2006/07 were welcome respites. 2005 was by far the worst year ever for insured
catastrophe losses in the US. Few “spillover effects” into
non-property lines
$100 Billion CAT year is coming soon

Shifting Legal Liability & Tort
Environment
Is the Tort PendulumSwinging Against Insurers?
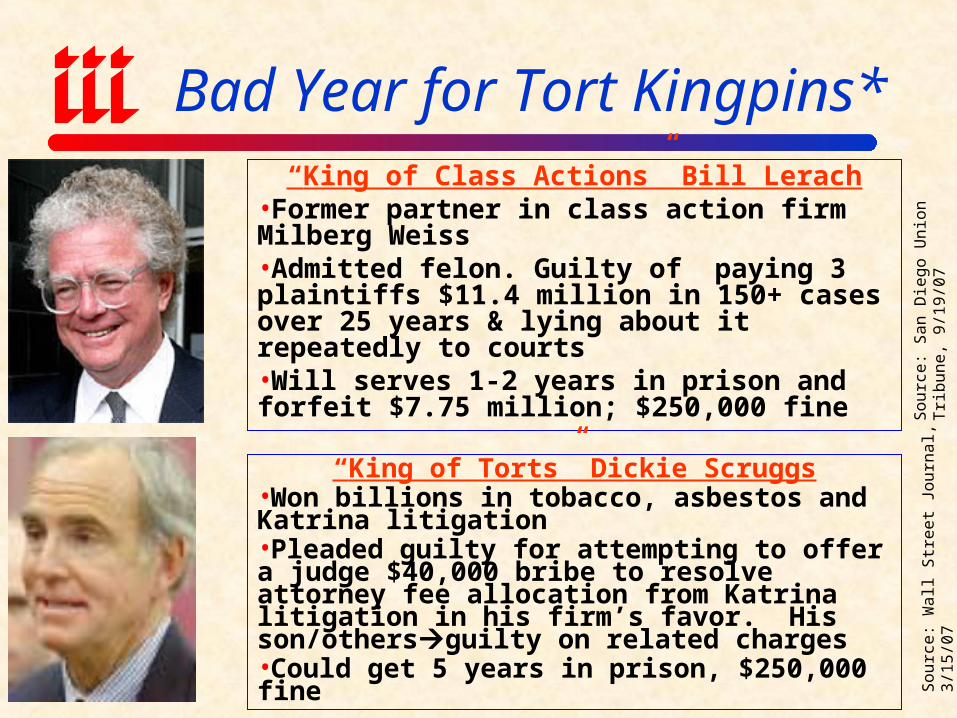
Bad Year for Tort Kingpins*“King of Class Actions” Bill Lerach
•Former partner in class action firm Milberg Weiss•Admitted felon. Guilty of paying 3 plaintiffs $11.4 million in 150+ cases over 25 years & lying about it repeatedly to courts•Will serves 1-2 years in prison and forfeit $7.75 million; $250,000 fine
“King of Torts” Dickie Scruggs•Won billions in tobacco, asbestos and Katrina litigation•Pleaded guilty for attempting to offer a judge $40,000 bribe to resolve attorney fee allocation from Katrina litigation in his firm’s favor. His son/othersguilty on related charges•Could get 5 years in prison, $250,000 fine
Sou
rce:
San
Die
go U
nion
Tri
bune
, 9/1
9/07
Sou
rce:
Wal
l Str
eet J
ourn
al, 3
/15/
07
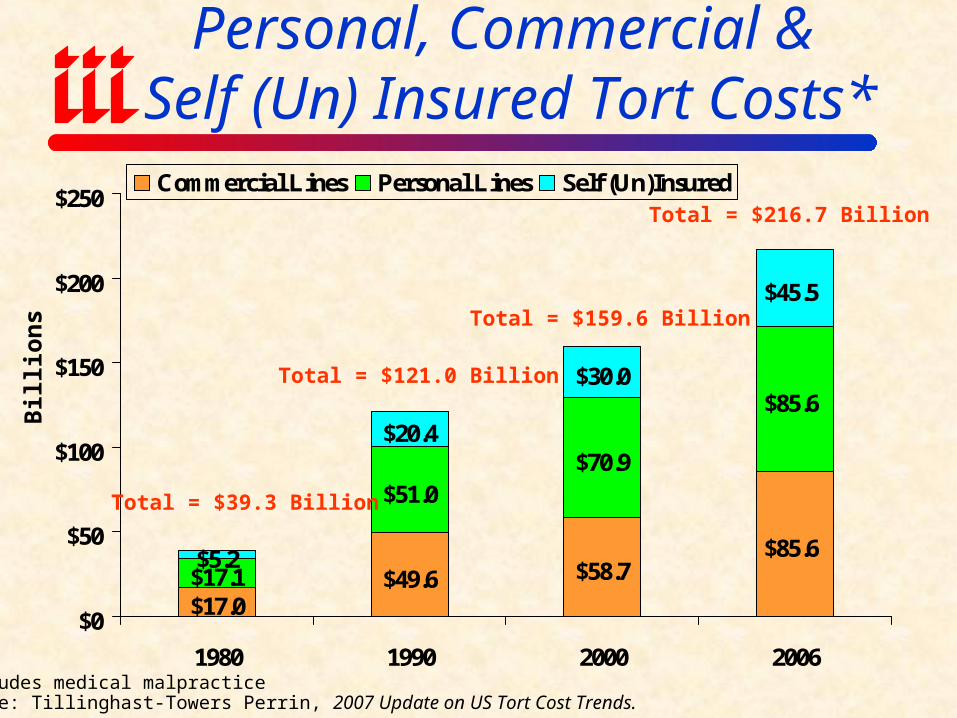
$17.0$49.6 $58.7
$85.6$17.1
$51.0$70.9
$85.6
$5.2
$20.4
$30.0
$45.5
$0
$50
$100
$150
$200
$250
1980 1990 2000 2006
Commercial Lines Personal Lines Self (Un)Insured
Bil
lion
s
Total = $39.3 Billion
*Excludes medical malpracticeSource: Tillinghast-Towers Perrin, 2007 Update on US Tort Cost Trends.
Total = $121.0 Billion
Total = $159.6 Billion
Total = $216.7 Billion
Personal, Commercial & Self (Un) Insured Tort Costs*
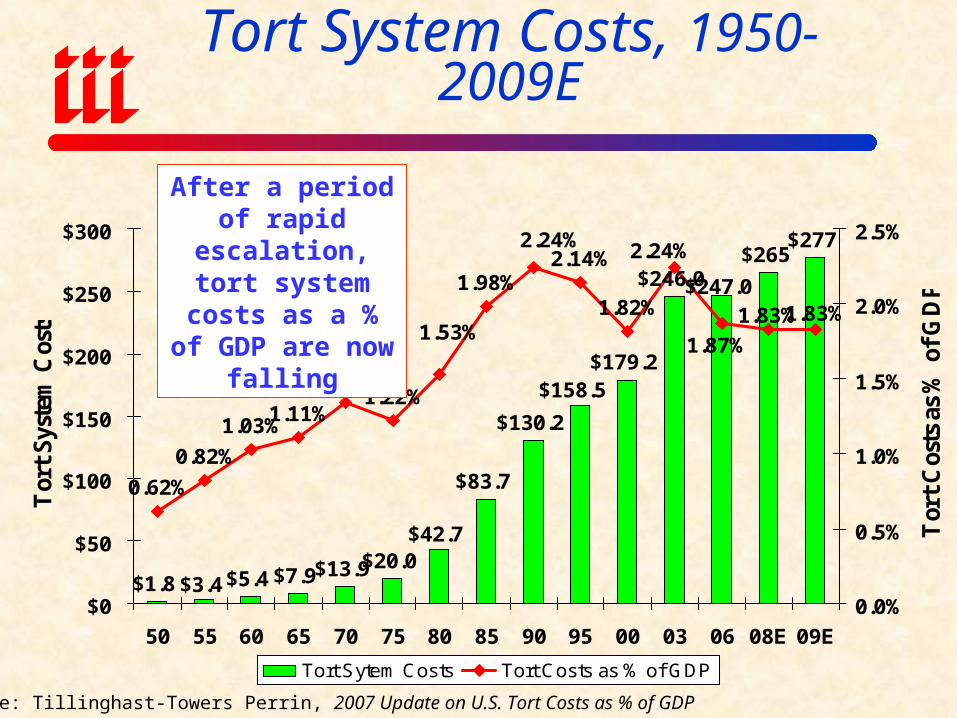
Tort System Costs, 1950-2009E
$1.8 $5.4 $7.9$13.9$20.0
$83.7
$130.2
$179.2
$246.0$265
$277
$158.5
$247.0
$42.7
$3.4
0.62%
0.82%
1.03%
1.34%1.22%
1.98%2.14%
1.82% 1.83%1.83%
1.87%
2.24%2.24%
1.53%
1.11%
$0
$50
$100
$150
$200
$250
$300
50 55 60 65 70 75 80 85 90 95 00 03 06 08E 09E
Tor
t S
yste
m C
osts
0.0%
0.5%
1.0%
1.5%
2.0%
2.5%
Tor
t C
osts
as
% o
f G
DP
Tort Sytem Costs Tort Costs as % of GDP
Source: Tillinghast-Towers Perrin, 2007 Update on U.S. Tort Costs as % of GDP
After a period of rapid escalation,
tort system costs as a % of GDP are
now falling
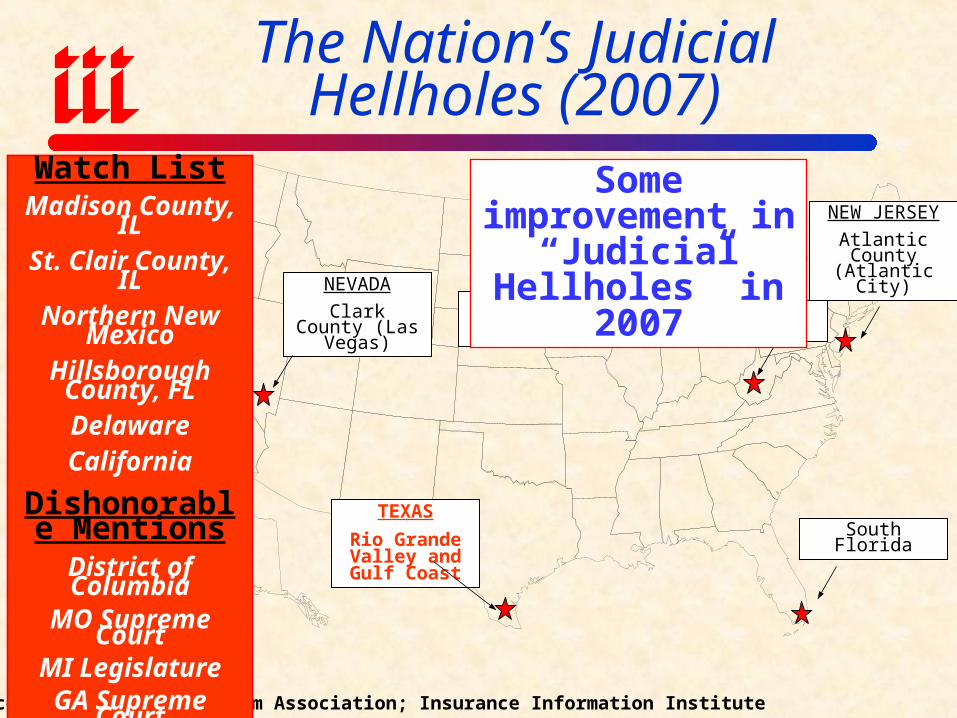
The Nation’s Judicial Hellholes (2007)
Source: American Tort Reform Association; Insurance Information Institute
TEXAS
Rio Grande Valley and Gulf Coast
South Florida
ILLINOIS
Cook County West Virginia
Some improvement in “Judicial
Hellholes” in 2007
Watch ListMadison County, ILSt. Clair County, IL
Northern New Mexico
Hillsborough County, FLDelawareCalifornia
Dishonorable Mentions
District of ColumbiaMO Supreme Court
MI LegislatureGA Supreme Court
Oklahoma
NEVADA
Clark County (Las Vegas)
NEW JERSEY
Atlantic County (Atlantic City)
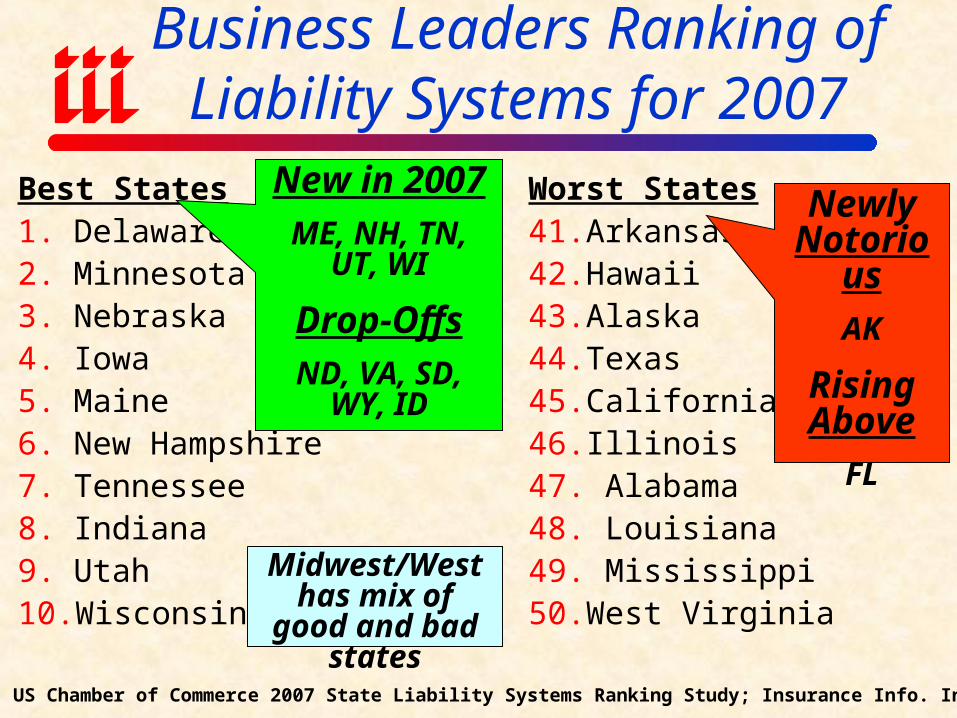
Business Leaders Ranking of Liability Systems for 2007
Best States1. Delaware2. Minnesota3. Nebraska4. Iowa5. Maine6. New Hampshire7. Tennessee8. Indiana9. Utah10. Wisconsin
Worst States41. Arkansas42. Hawaii43. Alaska44. Texas45. California46. Illinois47. Alabama48. Louisiana49. Mississippi50. West Virginia
Source: US Chamber of Commerce 2007 State Liability Systems Ranking Study; Insurance Info. Institute.
New in 2007
ME, NH, TN, UT, WI
Drop-Offs
ND, VA, SD, WY, ID
Newly Notorious
AK
Rising Above
FL
Midwest/West has mix of good and bad states

Insurance Information Institute On-Line
If you would like a copy of this presentation, please give me your business card with e-mail address