Insurance Industry Employment Trends: 1990-2015 Insurance Information Institute May 2015 Robert P....
14
Insurance Industry Employment Trends: 1990- 2015 Insurance Information Institute May 2015 Robert P. Hartwig, Ph.D., CPCU, President & Economist Insurance Information Institute 110 William Street New York, NY 10038 Tel: 212.346.5520 Cell: 917.453.1885 [email protected]
-
Upload
beverly-marsh -
Category
Documents
-
view
214 -
download
0
Transcript of Insurance Industry Employment Trends: 1990-2015 Insurance Information Institute May 2015 Robert P....

Insurance Industry Employment Trends: 1990-2015
Insurance Information Institute May 2015
Robert P. Hartwig, Ph.D., CPCU, President & EconomistInsurance Information Institute 110 William Street New York, NY 10038
Tel: 212.346.5520 Cell: 917.453.1885 [email protected] www.iii.org

2
Overview of Insurance Sector Employment Changes*
*Data are through March 2015 and are preliminary (i.e., subject to later revision); seasonally adjusted.
Insurance SubsectorFebruary 2015Employment
March 2015
EmploymentChange
CARRIERS
P-C Direct 526,500 526,900 +400
Life Direct 354,700 355,900 +1,200
Health/Medical Direct 508,600 509,800 +1,200
Title & Other Direct 76,300 76,900 +600
Reinsurers 25,100 25,300 +200
OTHERS
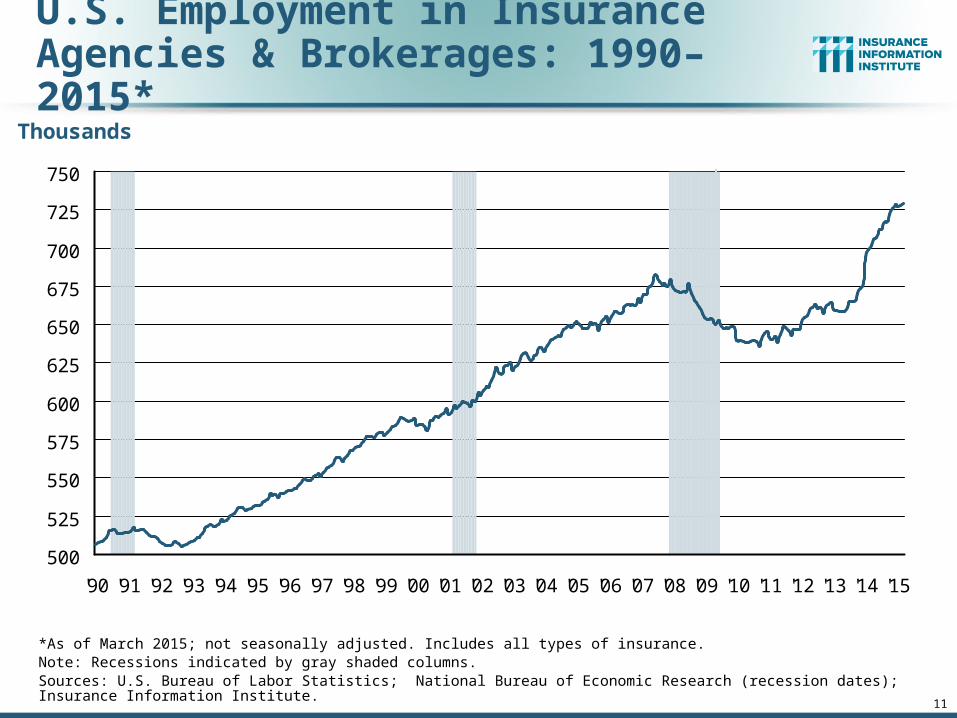
Agents/Brokers 729,400 731,000 +1,600
3rd-Party Administration 176,800 178,100 +1,300
Claims Adjusters 50,300 50,500 +200
3
Baselines:U.S. Employment Trends

4
U.S. Nonfarm Employment,Monthly, 1990–2015*
*As of April 2015; not seasonally adjusted.Note: Recessions indicated by gray shaded columns.Sources: U.S. Bureau of Labor Statistics; National Bureau of Economic Research (recession dates); Insurance Information Institute.
Millions
105
110
115
120
125
130
135
140
145
'90 '91 '92 '93 '94 '95 '96 '97 '98 '99 '00 '01 '02 '03 '04 '05 '06 '07 '08 '09 '10 '11 '12 '13 '14 '15

5
U.S. Employment in Service Industries,Monthly, 1990–2015*
*As of April 2015; not seasonally adjusted.Note: Recessions indicated by gray shaded columns.Sources: U.S. Bureau of Labor Statistics; National Bureau of Economic Research (recession dates); Insurance Information Institute.
Millions
85
90
95
100
105
110
115
120
125
'90 '91 '92 '93 '94 '95 '96 '97 '98 '99 '00 '01 '02 '03 '04 '05 '06 '07 '08 '09 '10 '11 '12 '13 '14 '15

6
Insurance Industry Employment Trends
From 1998 through 2013, total industry employment has stayed
in a narrow band of 2.3-2.4 million; in 2014 it rose above that
band

7
U.S. Employment in the DirectP/C Insurance Industry: 1990–2015*
*As of March 2015; not seasonally adjusted; Does not including agents & brokers.Note: Recessions indicated by gray shaded columns.Sources: U.S. Bureau of Labor Statistics; National Bureau of Economic Research (recession dates); Insurance Information Institute.
Thousands
460
480
500
520
540
560
'90 '91 '92 '93 '94 '95 '96 '97 '98 '99 '00 '01 '02 '03 '04 '05 '06 '07 '08 '09 '10 '11 '12 '13 '14 '15
Sometimes the BLS reclassifies employment within industries.
When this happens, the change is spread evenly over a 12-month period (in this case March 2010-
March 2011.

8
U.S. Employment in the DirectLife Insurance Industry: 1990–2015*
*As of March 2015; not seasonally adjusted; Does not including agents & brokers.Note: Recessions indicated by gray shaded columns.Sources: U.S. Bureau of Labor Statistics; National Bureau of Economic Research (recession dates); Insurance Information Institute.
Thousands
300
325
350
375
400
425
450
475
500
525
550
575
600
'90 '91 '92 '93 '94 '95 '96 '97 '98 '99 '00 '01 '02 '03 '04 '05 '06 '07 '08 '09 '10 '11 '12 '13 '14 '15
Every 4-5 years BLS reconciles its data with census data; sometimes this
reclassifies employment within industries. This drop, spread over
March 2004-March 2005, moved some people to the Health/Medical Expense
sector.

9
U.S. Employment in the Direct Health-Medical Insurance Industry: 1990–2015*
*As of March 2015; not seasonally adjusted; Does not including agents & brokers.Note: Recessions indicated by gray shaded columns.Sources: U.S. Bureau of Labor Statistics; National Bureau of Economic Research (recession dates); Insurance Information Institute.
Thousands
175
200
225
250
275
300
325
350
375
400
425
450
475
500
525
'90 '91 '92 '93 '94 '95 '96 '97 '98 '99 '00 '01 '02 '03 '04 '05 '06 '07 '08 '09 '10 '11 '12 '13 '14 '15

10
U.S. Employment in the Reinsurance Industry: 1990–2015*
Thousands
24
28
32
36
40
44
48
'90 '91 '92 '93 '94 '95 '96 '97 '98 '99 '00 '01 '02 '03 '04 '05 '06 '07 '08 '09 '10 '11 '12 '13 '14 '15
*As of March 2015; not seasonally adjusted; Does not including agents & brokers.Note: Recessions indicated by gray shaded columns.Sources: U.S. Bureau of Labor Statistics; National Bureau of Economic Research (recession dates); Insurance Information Institute.
11
U.S. Employment in Insurance Agencies & Brokerages: 1990–2015*
Thousands
500
525
550
575
600
625
650
675
700
725
750
'90 '91 '92 '93 '94 '95 '96 '97 '98 '99 '00 '01 '02 '03 '04 '05 '06 '07 '08 '09 '10 '11 '12 '13 '14 '15
*As of March 2015; not seasonally adjusted. Includes all types of insurance.Note: Recessions indicated by gray shaded columns.Sources: U.S. Bureau of Labor Statistics; National Bureau of Economic Research (recession dates); Insurance Information Institute.

12
U.S. Employment in Insurance Claims Adjusting: 1990–2015*
Thousands
40
45
50
55
60
'90 '91 '92 '93 '94 '95 '96 '97 '98 '99 '00 '01 '02 '03 '04 '05 '06 '07 '08 '09 '10 '11 '12 '13 '14 '15
*As of March, 2015; not seasonally adjusted.Note: Recessions indicated by gray shaded columns.Sources: U.S. Bureau of Labor Statistics; National Bureau of Economic Research (recession dates); Insurance Information Institute.

13
U.S. Employment in Third-Party Administration of Insurance Funds: 1990–2015*
Thousands
95
100105
110
115
120125
130
135140
145
150155
160
165
170175
180
'90 '91 '92 '93 '94 '95 '96 '97 '98 '99 '00 '01 '02 '03 '04 '05 '06 '07 '08 '09 '10 '11 '12 '13 '14 '15
*As of March 2015; not seasonally adjusted. Includes all types of insurance.Note: Recessions indicated by gray shaded columns.Sources: U.S. Bureau of Labor Statistics; National Bureau of Economic Research (recession dates); Insurance Information Institute.
www.iii.org
Twitter: twitter.com/bob_hartwigDownload at: www.iii.org/insurance-
topics/features/presentations
Insurance Information Institute Online: