Reversal of Hemispheric Asymmetry on Auditory Tasks in ... · Estos resultados sugieren que pueden...
13
J Am Acad Audiol 13 : 59-71 (2002) Reversal of Hemispheric Asymmetry on Auditory Tasks in Children Who Are Poor Listeners Rebecca I. Estes* James Jerger* Gary Jacobson' Abstract We examined hemispheric activation patterns during auditory and visual processing in two groups of children : 13 boys in the age range from 9 to 12 years rated by their parents and teachers as poor listeners and 11 boys in the same age range rated as normal listeners. Three tasks were employed : auditory gap detection, detection of auditory movement, and a control task involving visuospatial discrimination . Electrical activity was recorded from 30 scalp electrodes as partici- pants responded to target stimuli in an event-related potential paradigm . In the visual task, hemispheric activation was relatively symmetric around the midsagittal plane in both groups . In the two auditory tasks, however, hemispheric activation patterns differed significantly between groups . In the normal-listener group, activation was asymmetric to the right hemisphere . In the poor-listener group, however, activation tended toward asymmetry, favoring the left hemisphere . These results suggest that abnormalities in hemispheric lateralization of function may underlie the auditory processing problems of at least some children described as poor listeners . Key Words : Auditory processing, children, event-related potential, gap detection, hemispheric asymmetry, sound movement Abbreviations : ANOVA = analysis of variance ; APD = auditory processing disorder ; CHAPS = Children's Auditory Performance Scale ; CT = computed tomography ; CV = consonant vowel ; EEG = electroencephalographic ; ERP = event-related potential ; fMRI = functional magnetic resonance imaging ; LPC = late positive component ; SPECT = single-photon emission computed tomography Sumario Examinamos patrones de activaci6n hemisferica durante etapas de procesamiento auditivo y visual en dos grupos de ninos :13 muchachos en el rango de edad de 9 a 12 anos calificados por sus padres y maestros como portadores de una pobre habilidad para escuchar y 11 muchachos de el mismo rango de edad calificados con una normal habilidad para escuchar . Tres tareas fueron utilizadas : detecci6n de brechas auditivas, detecci6n de movimiento auditivo y una tarea de con- trol involucrando discriminaci6n visuoespacial . La actividad electrica fue registrada con 30 electrodos craneales conforme los participantes respondian a estimulos blanco en un paradigma de poten- ciales relacionados con el evento (event-related potentials) . En la tarea visual, la activaci6n hemisferica fue relativamente simetrica en el piano sagital medio en ambos grupos . En las dos tareas auditivas, sin embargo, los patrones de activaci6n difirieron sign if icativamente entre los grupos . En el grupo de escucha normal, la activaci6n fue asimetrica al hemisferio derecho. En el grupo de actitud auditiva pobre, sin embargo, la activaci6n tendi6 hacia la asimetria, favoreciendo el hemisferio izquierdo . Estos resultados sugieren que pueden haber anormalidades en la late- ralizaci6n hemisferica de la funci6n, clue se relacionen con los problemas de procesamiento auditivo de al menos algunos ninos descritos como portadores de una habilidad pobre para escuchar. Palabras Clave : Procesamiento auditivo ; potencial relacionado con el evento ; detecci6n de brecha ; asimetria hemisferica ; movimiento de sonido Abreviaturas : ANOVA = analisis de variancia ; APD = trastorno de procesamiento auditivo ; CHAPS = Escala de Rendimiento Auditivo en Ninos ; CT = tomografia computarizada ; CV = consonante- vocal ; EEG = electroencefalografia ; ERP = potencial relacionado con el evento ; IMRI = imagenes por resonancia magnetica funcional ; LPC = componente positivo tardio ; SPECT = tomografia com- putarizada por emisi6n de prot6n unico *Program in Cognition and Neuroscience and The Callier Center for Communication Sciences and Disorders, The University of Texas at Dallas ; tDivision of Audiology, Henry Ford Hospital, Detroit, Michigan Reprint requests : James Jerger, 2612 Prairie Creek Dr. East, Richardson, TX 75080-2679 59
Transcript of Reversal of Hemispheric Asymmetry on Auditory Tasks in ... · Estos resultados sugieren que pueden...
J Am Acad Audiol 13 : 59-71 (2002)
Reversal of Hemispheric Asymmetry on Auditory Tasks in Children Who Are Poor Listeners Rebecca I. Estes* James Jerger* Gary Jacobson'
Abstract
We examined hemispheric activation patterns during auditory and visual processing in two groups of children : 13 boys in the age range from 9 to 12 years rated by their parents and teachers as poor listeners and 11 boys in the same age range rated as normal listeners. Three tasks were employed : auditory gap detection, detection of auditory movement, and a control task involving visuospatial discrimination . Electrical activity was recorded from 30 scalp electrodes as partici-pants responded to target stimuli in an event-related potential paradigm . In the visual task, hemispheric activation was relatively symmetric around the midsagittal plane in both groups . In the two auditory tasks, however, hemispheric activation patterns differed significantly between groups . In the normal-listener group, activation was asymmetric to the right hemisphere . In the poor-listener group, however, activation tended toward asymmetry, favoring the left hemisphere . These results suggest that abnormalities in hemispheric lateralization of function may underlie the auditory processing problems of at least some children described as poor listeners .
Key Words : Auditory processing, children, event-related potential, gap detection, hemispheric asymmetry, sound movement
Abbreviations : ANOVA = analysis of variance ; APD = auditory processing disorder ; CHAPS = Children's Auditory Performance Scale ; CT = computed tomography ; CV = consonant vowel ; EEG = electroencephalographic ; ERP = event-related potential ; fMRI = functional magnetic resonance imaging ; LPC = late positive component ; SPECT = single-photon emission computed tomography
Sumario
Examinamos patrones de activaci6n hemisferica durante etapas de procesamiento auditivo y visual en dos grupos de ninos :13 muchachos en el rango de edad de 9 a 12 anos calificados por sus padres y maestros como portadores de una pobre habilidad para escuchar y 11 muchachos de el mismo rango de edad calificados con una normal habilidad para escuchar . Tres tareas fueron utilizadas : detecci6n de brechas auditivas, detecci6n de movimiento auditivo y una tarea de con-trol involucrando discriminaci6n visuoespacial . La actividad electrica fue registrada con 30 electrodos craneales conforme los participantes respondian a estimulos blanco en un paradigma de poten-ciales relacionados con el evento (event-related potentials) . En la tarea visual, la activaci6n hemisferica fue relativamente simetrica en el piano sagital medio en ambos grupos . En las dos tareas auditivas, sin embargo, los patrones de activaci6n difirieron sign if icativamente entre los grupos . En el grupo de escucha normal, la activaci6n fue asimetrica al hemisferio derecho. En el grupo de actitud auditiva pobre, sin embargo, la activaci6n tendi6 hacia la asimetria, favoreciendo el hemisferio izquierdo . Estos resultados sugieren que pueden haber anormalidades en la late-ralizaci6n hemisferica de la funci6n, clue se relacionen con los problemas de procesamiento auditivo de al menos algunos ninos descritos como portadores de una habilidad pobre para escuchar.
Palabras Clave : Procesamiento auditivo ; potencial relacionado con el evento ; detecci6n de brecha ; asimetria hemisferica ; movimiento de sonido
Abreviaturas : ANOVA = analisis de variancia ; APD = trastorno de procesamiento auditivo ; CHAPS = Escala de Rendimiento Auditivo en Ninos ; CT = tomografia computarizada ; CV = consonante-vocal ; EEG = electroencefalografia ; ERP = potencial relacionado con el evento ; IMRI = imagenes por resonancia magnetica funcional ; LPC = componente positivo tardio ; SPECT = tomografia com-putarizada por emisi6n de prot6n unico
*Program in Cognition and Neuroscience and The Callier Center for Communication Sciences and Disorders, The University of Texas at Dallas ; tDivision of Audiology, Henry Ford Hospital, Detroit, Michigan
Reprint requests : James Jerger, 2612 Prairie Creek Dr. East, Richardson, TX 75080-2679
59

Journal of the American Academy of Audiology/Volume 13, Number 2, February 2002
n spite of normal peripheral hearing sensi-tivity, some children are characterized by teachers and parents as poor listeners. They
are described as having difficulty hearing in back-ground noise and in following oral instructions (Bellis,1996). They are often initially identified by poor academic performance. In its pure form, the deficit is conceptualized as an auditory percep-tual disorder. In the literature, it is often referred to as a central auditory processing disorder or, more appropriately, simply as an auditory pro-cessing disorder (APD). Some have suggested that APD is a factor contributing to dyslexia (Bryden, 1982), specific language impairment (Sloan,1985), and learning disability (Keith, 1984).
The basis for such an auditory perceptual problem remains unclear. In the case of lan-guage impairment, it has been theorized that the ability to process rapid temporal changes in sound is impoverished in some children, result-ing in decreased comprehension of spoken com-munication in settings where multiple inputs and background competition may be present (Williams and Lecluyse, 1990 ; Merzenich et al, 1993 ; Tallal et al, 1998). Another factor under-lying listening difficulties in children may relate to deviant cerebral organization. In most normal children, processing is lateralized to the left hemisphere for linguistic stimuli and to the right hemisphere for nonlinguistic stimuli. Thus, a lack of appropriate lateralization may under-lie disordered function . Early studies of hemi-spheric lateralization relied heavily on behavioral dichotic tests, usually employing consonant-vowel (CV) syllables or CVC words. More recently, evoked electrical or magnetic potentials, usually event-related potentials (ERPs), and brain imaging, usually computed tomography (CT), functional magnetic resonance imaging (fMRI), and single-photon emission tomogra-phy (SPELT), have addressed the issue as well .
In children with learning disability, abnormal lateralization of function has been repeatedly observed on dichotic tests (Keith, 1984 ; Obrzut et al, 1985 ; Boliek et al, 1988). More recently, Boliek and Obrzut (1998) compared right-hemisphere (pure tones) and left-hemisphere (CV syllables) tasks in both normal and learning-disabled chil-dren . Control children had the expected hemi-spheric laterality shift (to the right for tones and to the left for CV syllables). In the learning dis-abled group, however, there was a processing bias to the same hemisphere (right for some, left for others) for both types of tasks.
Reversals and other abnormalities of hemi-spheric specialization have been most exten-
sively studied in children with dyslexia . Bryden (1982) reviewed a number of studies of lateral-ization of brain function in children who were poor readers. In his summary, he remarked that "Despite unreliable measuring instruments, a plethora of experimental effects that contaminate the results, various methodological absurdities, and frequent instances of contradictory evidence, one theme continues to recur. That is the notion that bilateral representation of function [i .e ., lack of appropriate lateralization] is associated with deficit" (p . 256-257). Obrzut and colleagues (1989) employed CV syllables in a dichotic lis-tening framework (free recall, directed right, directed left) to study cerebral lateralization in reading-disabled children . Right-handed normal children showed the expected right-ear advantage in all three conditions, but right-handed reading-disabled children showed a left-ear advantage in the free-recall and directed-left conditions In a dichotic listening study, Hugdahl and colleagues (1995) compared dyslexics with normal controls on dichotically presented CV syllables. Controls showed the expected right-ear advantage, but dyslexics did not. Similar findings were reported by Landwehrmeyer and colleagues (1990) . In the performance of language tasks, normal read-ers showed greater activation over the left hemi-sphere, but dyslexics showed greater activation over the right hemisphere . In a review of CT/MRI studies of dyslexics, Hynd and Semrud-Clike-man (1989) concluded that the asymmetry toward the left planum temporale in normal brains was less often observed in dyslexics. The prevalence of symmetry (i.e ., lack of appropriate asymme-try) in this key structure for language process-ing was greater in dyslexics. Similar conclusions were reached by Hynd and colleagues (1990) and by Morgan and Hynd (1998) . In a recent fMRI study of children with developmental dyslexia, Temple and colleagues (2001) found that, during letter rhyming, both normal and dyslexic children showed activity in the left frontal brain region, but only normals showed activity in the left temporoparietal cortex . Dyslexic children failed to show activity in this cortical region . On a letter-matching task, nor-mals showed activity throughout the extrastri-ate cortex, but dyslexic children showed little activity in this region . Using magnetoen-cephalography, Heim and colleagues (2000) reported similar differences in the organization of the left auditory cortex between normals and dyslexics.
In children with language disorder, a series of ERP studies have demonstrated reversed
60
Reversal of Hemispheric Asymmetry in Poor Listeners/Estes et al
hemispheric asymmetry. Dawson and col-leagues (1989) compared hemispheric activation patterns to a simple speech stimulus in both
autistic children and children with severe lan-guage impairment. In both groups, there was
a reversed direction of asymmetry relative to normal children . Similar ERP results for chil-dren with specific language impairment were reported by Shafer and colleagues (2001) . Chi-ron and colleagues (1999) used the SPECT technique to measure regional cerebral blood flow in children with developmental dysphasia . They concluded that functional specialization of both hemispheres was impaired in these children .
Interestingly, similar anomalies and rever-sals of hemispheric organization have been reported in stutterers (Salmelin et al, 1998), schizophrenics (Luchins et al, 1982 ; Holinger et al, 1992 ; Petty et al, 1995 ; Tiihonen et al, 1998), the families of schizophrenics (Honer et al, 1995), deaf persons (Szelag, 1996), and suicidal persons (Weinberg, 2000).
In a theoretical discussion of these con-
verging lines of evidence for reversal of hemi-spheric lateralization of function in children with dyslexia, Stein (1994) suggested that a
specific magnocellular cell type expresses a dis-tinctive surface antigen that plays an important
role in the sequencing of small visual symbols . Stein suggested that the development of this cell line may be congenitally impaired in dyslexic
children . He further speculated that normal magnocellular development promotes normal hemispheric specialization and that impaired magnocellular development may be responsi-
ble for a spectrum of problems associated with impaired hemispheric specialization, ranging from the mildest, dyslexia, to the most severe, schizophrenia .
Is it possible that the problems faced by poor listeners may be related to differences in the functional lateralization of auditory pro-cessing? Could the phenomenon of poor listen-ing in children derive from lack of appropriate lateralization of brain function? The purpose of the present study was to compare patterns of hemispheric activation during auditory pro-cessing in two groups of children, poor listeners
and normal controls . We employed two audi-tory processing tasks, gap detection and detec-tion of sound movement, as well as a visual discrimination control condition. Hemispheric patterns of activation were evaluated in the context of scalp electrical activity evoked within an ERP paradigm .
METHOD
Participants
Participants were recruited from the general
population in the Dallas-Fort Worth metroplex . Twenty-four children were tested in the Topo-graphic Brain Mapping Laboratory at the Uni-versity of Texas at Dallas . Informed consent was obtained from all participants in accor-dance with the university's guidelines . All chil-dren were right-handed males between the ages of 9 and 12 years . Right-handedness was deter-mined by standard questionnaire and classifi-cation (Annett, 1970) . The children had no known visual or neurologic deficit . All participants had age-appropriate academic performance as deter-mined by standardized tests of achievement (23) or teacher report (1) . All participants had
20/25 visual acuity, corrected, using both eyes, on the Snellen static visual acuity test . Hearing
sensitivity was screened at 20 dB HL at octave
intervals across the frequency range from 250 to 8000 Hz. The experimental participants (n =
13) were identified by both parent and teacher as "poor listeners" as determined by an at-risk
score on the Children's Auditory Performance
Scale (CHAPS; Smoski et al, 1998) . No control child was scored as at risk on the CHAPS by
either the parent or the teacher. Children were paid for their participation in the study.
EEG Recording System
Electroencephalographic (EEG) activity was
recorded from 30 scalp locations, using sil-
ver/silver-chloride (Ag/AgCl) electrodes attached to an elastic cap (Neurosoft) . The electrode mon-
tage placement is based on the International 10-20 system . Eye movements and eye blinks were
monitored via electrodes positioned above and
at the outer canthus of the left eye . All channels
of EEG were referenced to linked mastoid elec-
trodes with forehead as ground . Electrode con-
figuration is displayed in Figure 1 . Individual
sweeps of EEG activity, time-locked to the stim-
uli, were stored for offline analysis . The stored epoch encompassed -200 to +1400 msec relative
to the onset of each stimulus . The ongoing EEG
activity was sampled at 1000 Hz, amplified, analog filtered from 0.15 to 70 Hz (1 .0-100 Hz for the eye channel), and then digitized through
the Neuroscan acquisition interface system . Epochs were separately averaged for target and nontarget stimuli . Signal averaging was con-ducted after offline artifact rejection and base-
61

Journal of the American Academy of Audiology/Volume 13, Number 2, February 2002
Nose
Left Side FPI I FP2
AFZ
Right Side
F7 F8 F3 FZ F4
I FT7 FC3 FCZ FC4 FT8
--T7 -------- C3 --------- CZ -------- C4 -------- T8 --
TP7 CP3 CPZ CP4 TP8
P3 PZ P4 P7 P8
01 OZ 02
Figure 1 Electrode array used to record event-related potential responses to auditory and visual stimuli .
line corrections (Scan 4.1 software). Individual epochs were examined and rejected whenever electrical activity in the eye channel exceeded ±50 p,V Each individual ERP was based on a minimum of 20 acceptable sweeps. In all cases, this was sufficient to reveal the endogenous component of the evoked response . Successfully averaged evoked potential waveforms were then digitally low-pass filtered at 20 Hz . Filter slope was -48 dB per octave . Final individual and grand-averaged waveforms were baseline cor-rected relative to the 200-msec prestimulus activity. Topographic maps of the digitally filtered visual and auditory ERPs were constructed by interpolation of voltages between adjacent elec-trodes, using a four-point linear interpolation algorithm. A bivalent color scheme, represent-ing the range of observed voltages, was assigned to the resulting voltage matrix .
Rationale for Selection of Auditory and Visual Tasks
Traditional tests of auditory processing are plagued by a number of potential confounds. First, they usually employ linguistic stimuli, ranging from simple CVs to entire sentences as test items . But if APD and specific language impairment can coexist, then linguistic stimuli may not be the optimal choice for evaluating an auditory perceptual disorder (Jerger and Allen, 1998). Second, motivational and attentional fac-tors are not always well controlled . Variations in this dimension may affect absolute performance
on difficult tests of speech recognition (cf., Silman et al, 2000). Third, modality specificity is usually not demonstrated (McFarland and Cacace, 1995). Poor test performance may simply reflect, for whatever reason, poor overall performance on all modalities . If only the auditory modality is tested, such dysfunction may be inappropriately attrib-uted to an auditory disorder.
In an attempt to avoid these pitfalls, we purposely avoided the use of any linguistic test materials. We chose two auditory tasks, gap detection and sound movement detection, thought to be relevant to auditory processing yet exe-cutable without the use of linguistic stimuli. Gap detection is a measure of temporal resolution, an auditory dimension that has enjoyed considerable research attention as a result of its putative link to specific language impairment (Tallal et al, 1998). We constructed two gap detection tasks. In one, the gap duration was 30 msec, a value cho-sen for its location at the "rapid" end of the range of formant transitions in speech (approximately 20-100 msec ; Kuhl, 1994). In the second gap detection task, the gap duration was 100 msec, a value chosen as representative of a compara-tively slow formant transition speed.
The second auditory task, detection of sound movement, was chosen for its relevance to the question of whether impairment in auditory spatial perception underlies the problems that poor listeners have in attending to target speech in the presence of background competition. We reasoned that such a spatial disorder might become manifest as an asymmetry in responses to sound movement to the right and to the left of midline.
We addressed the issue of attentional and motivational factors by structuring the testing such that cooperation and successful comple-tion of the testing resulted in a modest financial reward for the child.
We addressed the issue of modality speci-ficity by including a visual control condition. We reasoned that group differences on both the auditory and visual tasks would argue against a modality-specific auditory perceptual disorder. On the other hand, if performance on the visual task did not differentiate the two groups, but per-formance on the auditory tasks did differentiate them, this would be a strong argument for modal-ity specificity.
Because of fundamental differences in the auditory and visual systems, it is difficult to construct true visual analogs of auditory tasks. For our purposes, we elected to employ a sim-ple visuospatial task, which would at least allow
62
Reversal of Hemispheric Asymmetry in Poor Listeners/Estes et al
us to compare the two groups on a visual task within the same genre as the auditory tasks .
Auditory Stimuli
Bursts of broadband random noise were cre-ated digitally at a sampling rate of 22,050 Hz with 16-bit amplitude resolution . Stimulus pre-
sentation level for noise bursts was 50 dB SPL, as read on the C scale of a sound level meter, posi-
tioned at the location of the center of the par-
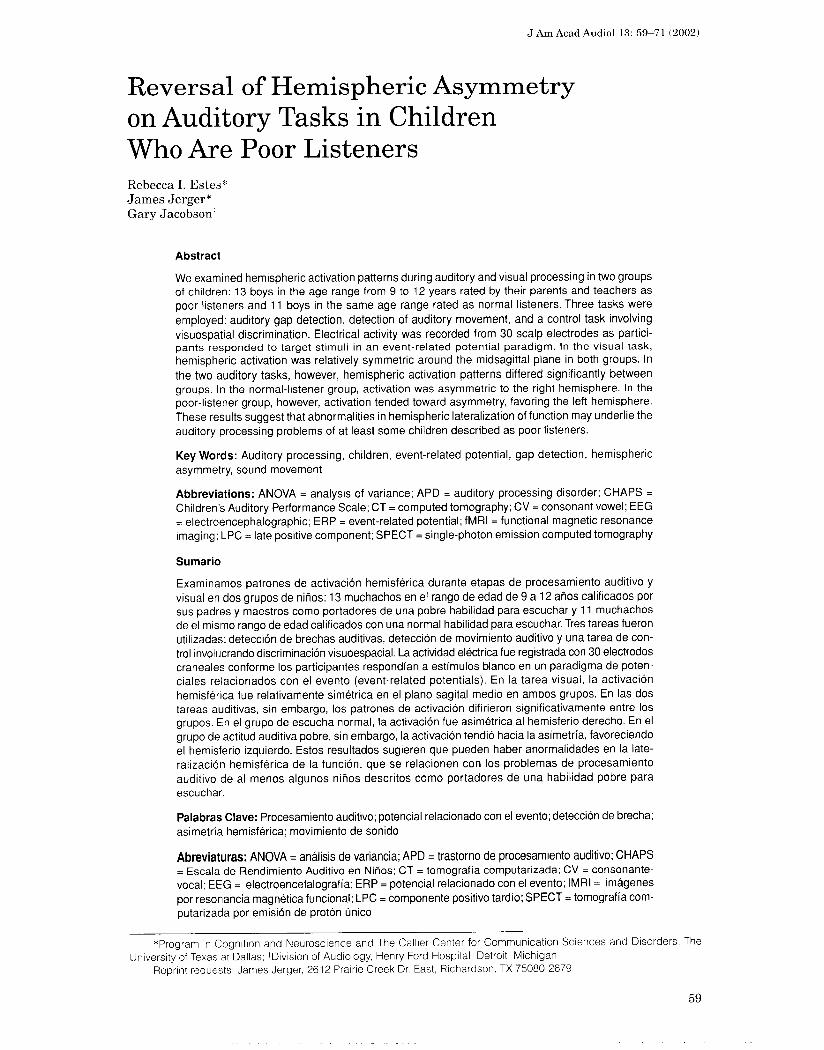
ticipant's head during testing . Auditory stimuli were presented through phase-matched loud-speakers positioned at ear height and 1.5 meters to either side of participant's ears (Fig . 2) .
Gap Detection Task
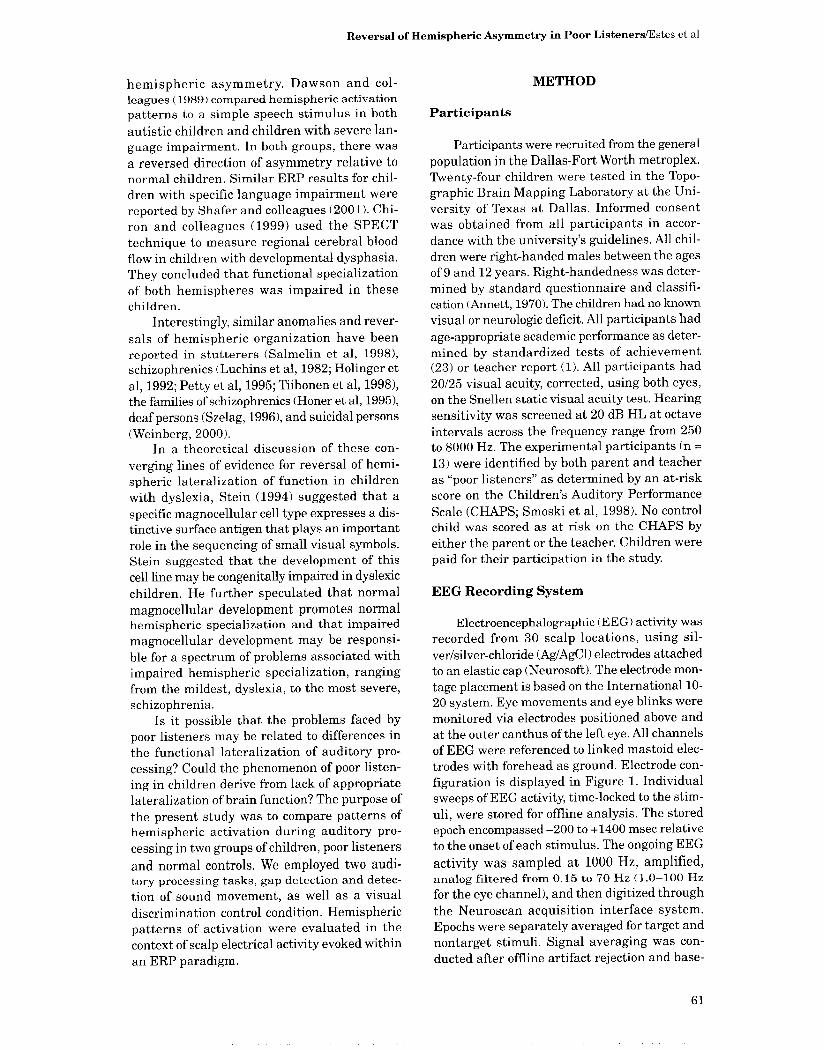
The first auditory procedure was a gap detec-tion task in an oddball paradigm . The stimulus was a noise burst, 500 msec in duration, with a 5-msec rise-decay time . It was presented simul-taneously from both the right and left loud-speakers . The listener heard a single noise burst centered above the head . There were two target conditions . In one, a silent gap of 30 msec was inserted in the center of the noise burst. In the other, a silent gap of 100 msec was inserted in the center of the burst, revealed by a gap in this duration region . In the nontarget condition, there was no gap in the noise burst. Overall duration was constant at 500 msec in all conditions . Each target condition (30 or 100 msec) was presented on 25 percent of trials and the nontarget condi-tion on 50 percent of trials . The total number of trials was 200. Figure 3 illustrates the waveforms of the stimuli for the nontarget, 30-msec gap target, and 100-msec gap target conditions .
Computer Monitor
Left Loudspeaker
1 meter 1 meter
Figure 2 Arrangement of loudspeakers and computer screen in the listening chamber. Participant's chair is
adjusted vertically until ear canals are vertically level with centers of loudspeakers .
No Gap
30-msec Gap
100-msec Gap
-o
E Q
100 200 300 400 Milliseconds
Right
Left
Right
Left
Right
Left
Figure 3 Waveforms of stimuli used in the gap detec-
tion tasks. Signal is broadband noise. Overall duration
is constant at 500 msec .
Sound Movement Task
The second auditory task assessed the detec-
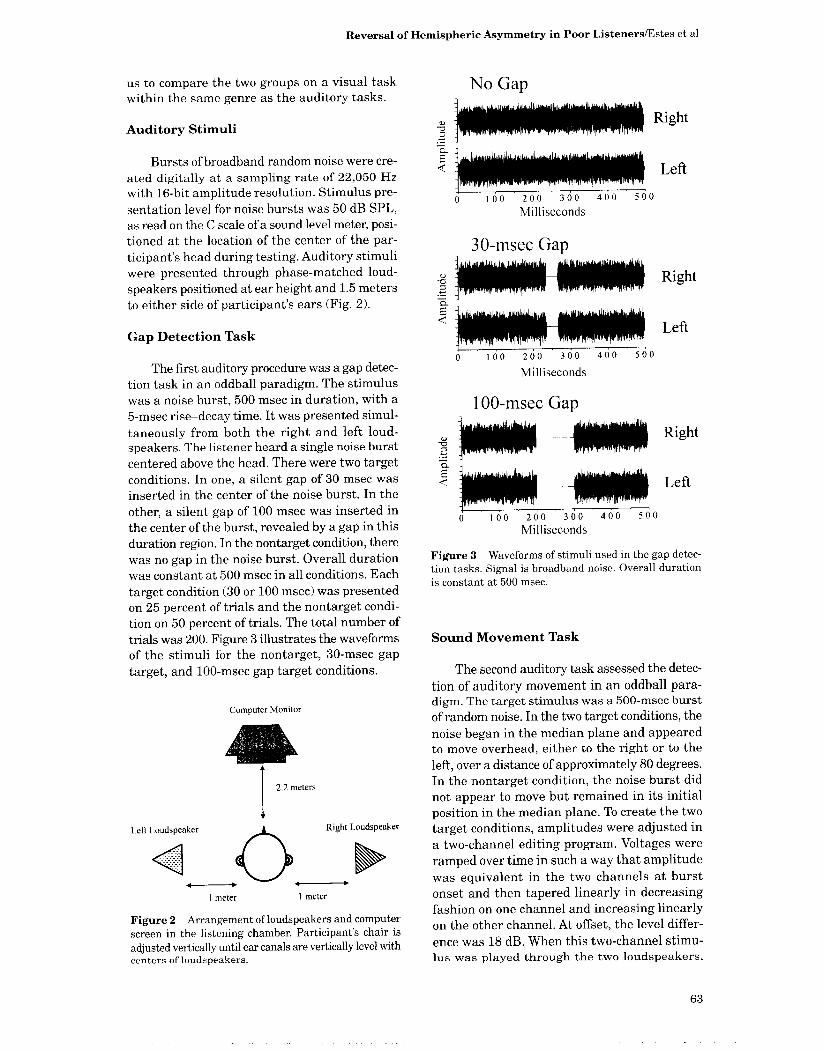
tion of auditory movement in an oddball para-digm. The target stimulus was a 500-msec burst
of random noise . In the two target conditions, the
noise began in the median plane and appeared to move overhead, either to the right or to the
left, over a distance of approximately 80 degrees . In the nontarget condition, the noise burst did
not appear to move but remained in its initial position in the median plane . To create the two target conditions, amplitudes were adjusted in
a two-channel editing program . Voltages were
ramped over time in such a way that amplitude
was equivalent in the two channels at burst onset and then tapered linearly in decreasing fashion on one channel and increasing linearly on the other channel . At offset, the level differ-
ence was 18 dB. When this two-channel stimu-lus was played through the two loudspeakers,
Right Loudspeaker
63
Journal of the American Academy of Audiology/Volume 13, Number 2, February 2002
No Movement
b
d
100 200 300 400 Milliseconds
Right
Left
Nontarget
Targets Right
Left
Right
Left
Figure 4 Waveforms of stimuli used in the sound move-ment task . For the two movement conditions, ampli-tudes are equivalent at onset but differ by 18 dB at offset .
the listener perceived a noise burst that appeared to move overhead from midline toward either the right or the left loudspeaker depending on how the two channels were ramped . Figure 4 shows waveforms of the three signals: the nontarget, the target appearing to move toward the right, and the target appearing to move toward the left .
Visual Discrimination Task
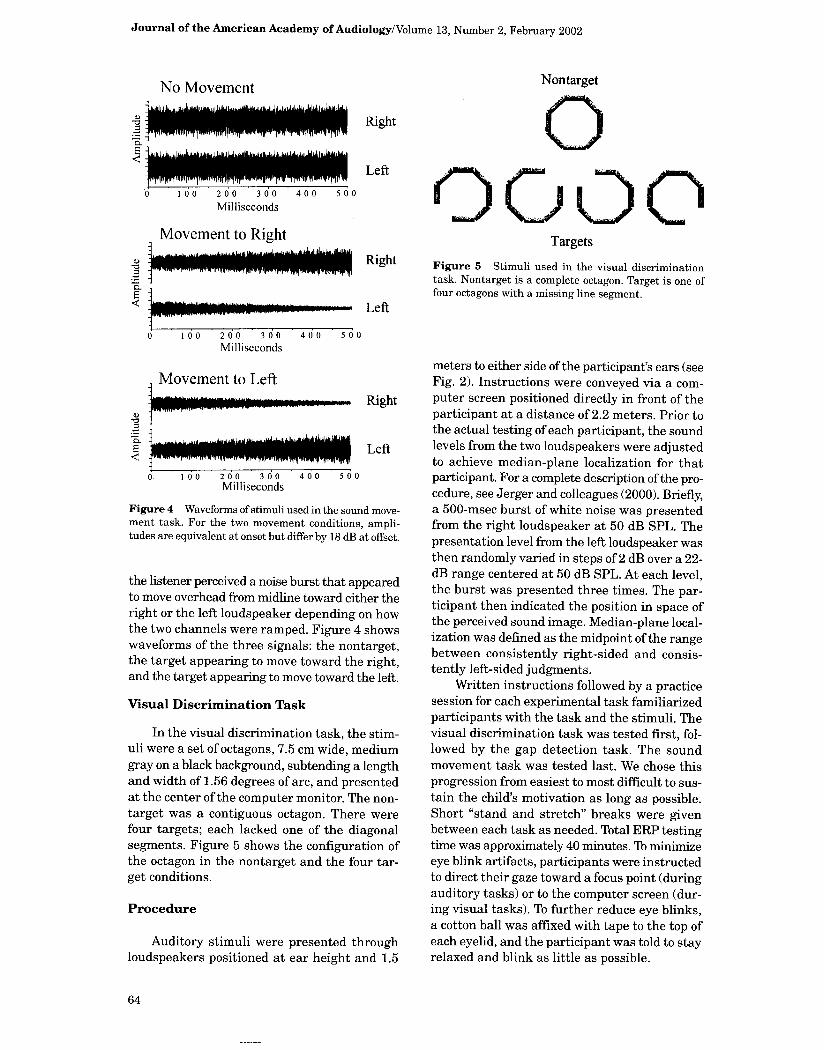
In the visual discrimination task, the stim-uli were a set of octagons, 7.5 cm wide, medium gray on a black background, subtending a length and width of 1.56 degrees of arc, and presented at the center of the computer monitor. The non-target was a contiguous octagon. There were four targets; each lacked one of the diagonal segments . Figure 5 shows the configuration of the octagon in the nontarget and the four tar-get conditions .
Procedure
Auditory stimuli were presented through loudspeakers positioned at ear height and 1.5
Figure 5 Stimuli used in the visual discrimination task . Nontarget is a complete octagon. Target is one of four octagons with a missing line segment.
meters to either side of the participant's ears (see Fig. 2) . Instructions were conveyed via a com-puter screen positioned directly in front of the participant at a distance of 2.2 meters . Prior to the actual testing of each participant, the sound levels from the two loudspeakers were adjusted to achieve median-plane localization for that participant . For a complete description of the pro-cedure, see Jerger and colleagues (2000) . Briefly, a 500-msec burst of white noise was presented from the right loudspeaker at 50 dB SPL. The presentation level from the left loudspeaker was then randomly varied in steps of 2 dB over a 22-dB range centered at 50 dB SPL. At each level, the burst was presented three times. The par-ticipant then indicated the position in space of the perceived sound image. Median-plane local-ization was defined as the midpoint of the range between consistently right-sided and consis-tently left-sided judgments.
Written instructions followed by a practice session for each experimental task familiarized participants with the task and the stimuli. The visual discrimination task was tested first, fol-lowed by the gap detection task . The sound movement task was tested last . We chose this progression from easiest to most difficult to sus-tain the child's motivation as long as possible . Short "stand and stretch" breaks were given between each task as needed. Total ERP testing time was approximately 40 minutes. To minimize eye blink artifacts, participants were instructed to direct their gaze toward a focus point (during auditory tasks) or to the computer screen (dur-ing visual tasks) . To further reduce eye blinks, a cotton ball was affixed with tape to the top of each eyelid, and the participant was told to stay relaxed and blink as little as possible .
64
Reversal of Hemispheric Asymmetry in Poor Listeners/Estes et al
A response pad containing two response buttons was used to record behavioral responses . The participant was instructed to press one but-
ton if a target (gap, movement, or missing seg-ment) was heard or seen and the other button if a nontarget was heard or seen .
Statistical Analysis
Amplitudes, latencies, and amplitude dif-ferences were evaluated by means of mixed-design analyses of variance (ANOVAs) . There was one between-subjects factor (normal lis-teners vs poor listeners) . Depending on the analysis, within-subjects factors included gap duration (30 or 100 msec) and direction of move-ment (to right or to left). Statistical significance was evaluated at an alpha error level of .05 .
RESULTS
F or all participants and in all conditions, per-cent correct performance exceeded 80 per-
cent . Comparison was made between averaged responses based on all epochs versus averaged responses based only on epochs corresponding to correct responses. Since there were no discernible differences between the two averages in any case, the data presented below are based on averages of all epochs .
Electrophysiologic results were analyzed in two ways : first in terms of ERP waveforms at the midline parietal (PZ) electrode site and second in terms of hemispheric asymmetry of activation patterns .
Waveforms at Electrode PZ
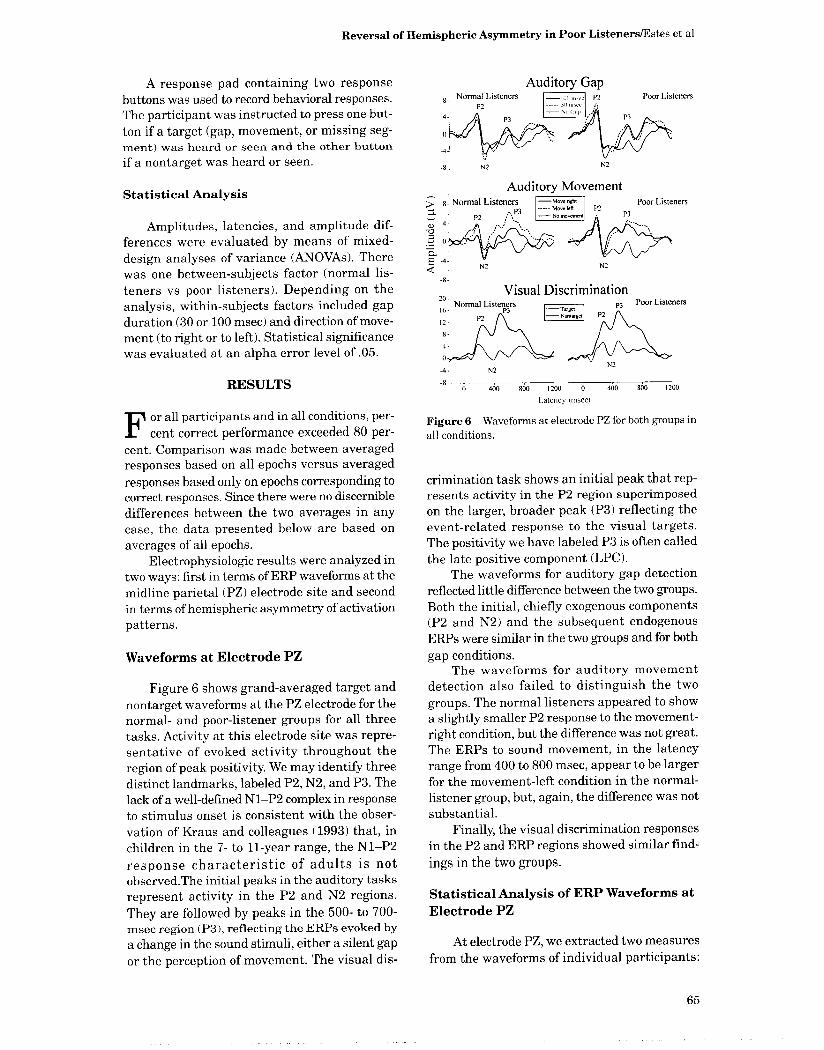
Figure 6 shows grand-averaged target and nontarget waveforms at the PZ electrode for the normal- and poor-listener groups for all three tasks. Activity at this electrode site was repre-sentative of evoked activity throughout the region of peak positivity. We may identify three distinct landmarks, labeled P2, N2, and P3 . The lack of a well-defined N1-P2 complex in response to stimulus onset is consistent with the obser-vation of Kraus and colleagues (1993) that, in children in the 7- to 11-year range, the N1-P2 response characteristic of adults is not observed.The initial peaks in the auditory tasks represent activity in the P2 and N2 regions.
They are followed by peaks in the 500- to 700-msec region (P3), reflecting the ERPs evoked by a change in the sound stimuli, either a silent gap or the perception of movement. The visual dis-
Normal Listeners mwe^gnt Poor Listeners r P3
~ -- m~etre iea ~ P2 P3 P2 L 1 n
Visual Discrimination P3 Poor Listeners Normal Listeners
P3 P2
Tv6et - Nontarget
8& 1200 400 800 12,00
Latency (msec)
Figure 6 Waveforms at electrode PZ for both groups in
all conditions .
crimination task shows an initial peak that rep-resents activity in the P2 region superimposed on the larger, broader peak (P3) reflecting the event-related response to the visual targets. The positivity we have labeled P3 is often called the late positive component (LPC).
The waveforms for auditory gap detection reflected little difference between the two groups. Both the initial, chiefly exogenous components (P2 and N2) and the subsequent endogenous ERPs were similar in the two groups and for both
gap conditions . The waveforms for auditory movement
detection also failed to distinguish the two
groups . The normal listeners appeared to show a slightly smaller P2 response to the movement-
right condition, but the difference was not great . The ERPs to sound movement, in the latency range from 400 to 800 msec, appear to be larger for the movement-left condition in the normal-listener group, but, again, the difference was not substantial .
Finally, the visual discrimination responses in the P2 and ERP regions showed similar find-
ings in the two groups .
Statistical Analysis of ERP Waveforms at Electrode PZ
At electrode PZ, we extracted two measures from the waveforms of individual participants :
65


Reversal of Hemispheric Asymmetry in Poor Listeners/Estes et al
Auditory Gap-100 inset
Auditory Gap-30 cosec
Auditory Movement-Leh
Audior Movement---Right
visual o-rimieaner,
091 ® Poor Listeners ® Normal Listeners
-20 -15 -10 -5 0 5 10 15 20 Left Hemisphere Greater Right Hemisphere Greater
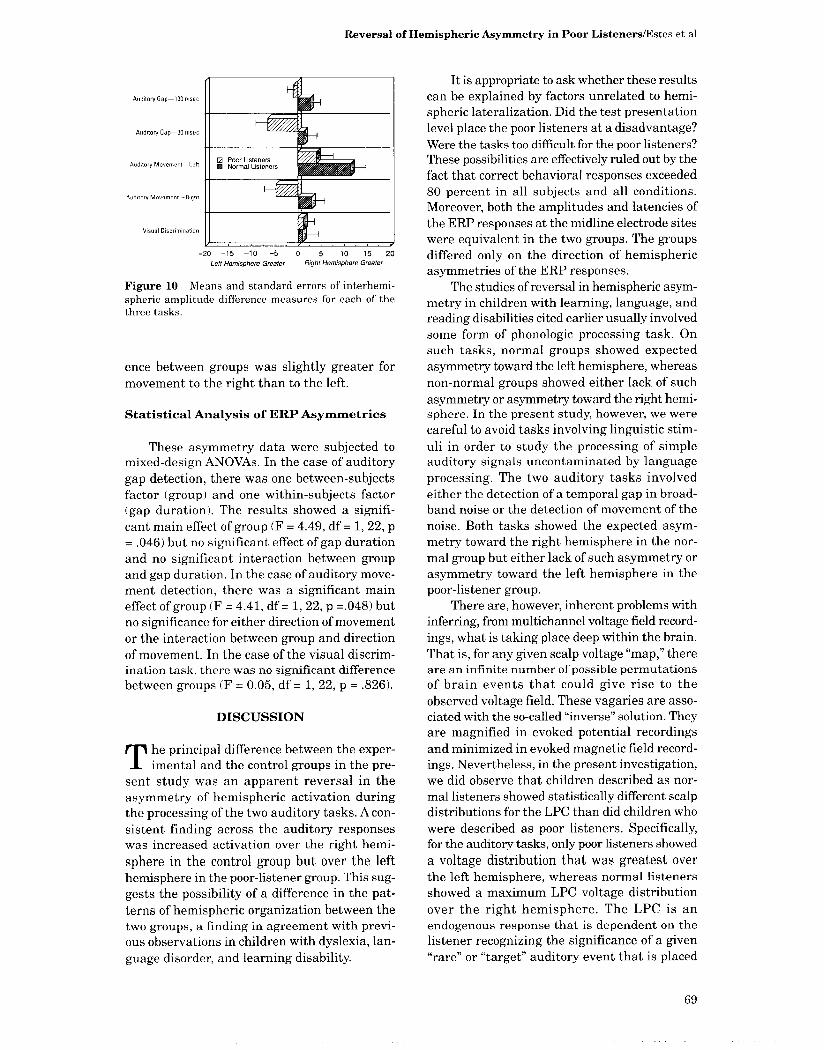
Figure 10 Means and standard errors of interhemi-spheric amplitude difference measures for each of the three tasks.
ence between groups was slightly greater for movement to the right than to the left .
Statistical Analysis of ERP Asymmetries
These asymmetry data were subjected to mixed-design ANOVAs . In the case of auditory gap detection, there was one between-subjects factor (group) and one within-subjects factor (gap duration) . The results showed a signifi-cant main effect of group (F = 4.49, df = 1, 22, p = .046) but no significant effect of gap duration and no significant interaction between group and gap duration. In the case of auditory move-ment detection, there was a significant main effect of group (F = 4.41, df = 1, 22, p =.048) but no significance for either direction of movement or the interaction between group and direction of movement. In the case of the visual discrim-ination task, there was no significant difference between groups (F = 0.05, df = 1, 22, p = .826).
DISCUSSION
T he principal difference between the exper-imental and the control groups in the pre-
sent study was an apparent reversal in the asymmetry of hemispheric activation during the processing of the two auditory tasks . A con-sistent finding across the auditory responses was increased activation over the right hemi-
sphere in the control group but over the left hemisphere in the poor-listener group . This sug-gests the possibility of a difference in the pat-terns of hemispheric organization between the two groups, a finding in agreement with previ-ous observations in children with dyslexia, lan-guage disorder, and learning disability.
It is appropriate to ask whether these results can be explained by factors unrelated to hemi-spheric lateralization . Did the test presentation level place the poor listeners at a disadvantage? Were the tasks too difficult for the poor listeners? These possibilities are effectively ruled out by the fact that correct behavioral responses exceeded 80 percent in all subjects and all conditions . Moreover, both the amplitudes and latencies of the ERP responses at the midline electrode sites were equivalent in the two groups . The groups differed only on the direction of hemispheric asymmetries of the ERP responses .
The studies of reversal in hemispheric asym-metry in children with learning, language, and reading disabilities cited earlier usually involved some form of phonologic processing task . On such tasks, normal groups showed expected asymmetry toward the left hemisphere, whereas non-normal groups showed either lack of such asymmetry or asymmetry toward the right hemi-sphere . In the present study, however, we were careful to avoid tasks involving linguistic stim-uli in order to study the processing of simple auditory signals uncontaminated by language processing . The two auditory tasks involved either the detection of a temporal gap in broad-band noise or the detection of movement of the noise . Both tasks showed the expected asym-metry toward the right hemisphere in the nor-mal group but either lack of such asymmetry or asymmetry toward the left hemisphere in the poor-listener group .
There are, however, inherent problems with inferring, from multichannel voltage field record-ings, what is taking place deep within the brain . That is, for any given scalp voltage "map," there are an infinite number of possible permutations of brain events that could give rise to the
observed voltage field . These vagaries are asso-ciated with the so-called "inverse" solution . They are magnified in evoked potential recordings and minimized in evoked magnetic field record-ings . Nevertheless, in the present investigation, we did observe that children described as nor-mal listeners showed statistically different scalp distributions for the LPC than did children who were described as poor listeners . Specifically, for the auditory tasks, only poor listeners showed
a voltage distribution that was greatest over the left hemisphere, whereas normal listeners showed a maximum LPC voltage distribution over the right hemisphere . The LPC is an endogenous response that is dependent on the listener recognizing the significance of a given "rare" or "target" auditory event that is placed
69
Journal of the American Academy of Audiology/Volume 13, Number 2, February 2002
within a stimulus train of "common" or "fre-quent" or "nontarget" auditory events . From invasive depth recordings in humans undergo-ing neurosurgical procedures (e.g., Halgren et al, 1980) and from noninvasive magnetoen-cephalographic recordings in humans (e.g ., Okada et al, 1983), it has been found that the LPC derives its neural origins from the hip-pocampus, amygdala, and possibly thalamic or suhthalamic generators (e .g ., Velasco et al, 1986). There is evidence that this response is modal-ity specific . That is, the scalp distribution of the LPC differs when the stimuli are presented to the auditory, as opposed to visual, modality. Also, the current belief is that the amplitude of the LPC is related to the allocation of atten-tional resources, and the latency of the LPC is related to the speed at which those resources are allocated (Polich, 1993). In the present paradigm, the stimuli were presented binaurally, and, accordingly, it is likely that activation of LPC generators occurred bilaterally. As such, one might have expected a bilateral, symmetric volt-age distribution (as was seen when visual stim-uli were presented), but this was not observed . There could be several explanations for the observed asymmetries. During bilateral activa-tion for normal subjects, the right hemisphere source(s) may predominate (greater amplitude of the LPC recorded from that hemisphere), and, hence, the distribution of activity may slightly favor the right hemisphere . Alterna-tively, sources may be activated at equal strength bilaterally, but the timing of the onsets and peaks of these voltage fields may differ slightly in such a way that the right hemisphere shows the greatest magnitude. Finally, the dipole strengths may be identical, but the orientation of the dipoles may differ slightly so that the scalp voltage field appears greater over the right hemisphere. We were not able to sort this out using the current techniques . In the future, it is possible that we might estimate what is occur-ring beneath the scalp surface using dipole local-ization techniques designed to deconvolve multiple coactivated sources. The findings of the current investigation suggest that the under-lying neurophysiologic mechanisms resulting in the scalp distribution observed for the normal listeners are not occurring for the poor listeners. The differences in the asymmetries in the volt-age fields for the two groups may have occurred because of differences in the strengths of the two groups of generators or differences in the tim-ing and/or orientation of the generator sources.
The reversal of asymmetry of brain activa-tion observed in our poor-listener group appears to be auditory specific . On the visual task, no dif-ference between groups was observed. We can-not, however, exclude the possibility that a different visual task might show such reversal . It remains to be determined whether this rever-sal of asymmetry between normal and poor lis-teners would be present but reversed in the case of linguistic processing. In any event, it seems possible that abnormalities in hemispheric lat-eralization of function may underlie the auditory processing problems of at least some children described as poor listeners. With further refine-ment in technique, reversal of hemispheric asym-metry might serve as a biologic marker of the poor-listener syndrome .
Acknowledgment . We are grateful to Robert Keith for helpful comments on an earlier version of this report . Supported in part by a grant from the Excellence in Education Fund of the University of Texas at Dallas Callier Center for Communication Disorders.
REFERENCES
Annett M. (1970). A classification of hand preference by association analysis . Br J Psychol 61:303-321 .
Bellis T. (1996) . Assessment and Management of Central Auditory Processing Disorders in the Educational Setting. San Diego, CA: Singular.
Boliek C, Obrzut J. (1998) . Perceptual laterality in devel-opmental learning disabilities . In: Davidson R, Hugdahl K, eds. Brain Asymmetry. Cambridge : MIT Press, 637-658.
Boliek C, Obrzut J, Shaw D. (1988) The effects of hemis-patial and asymmetrically focused attention on dichotic listening with normal and learning-disabled children . Neuropsychologia 26:417-433 .
Bryden M. (1982) . Laterality : Functional Asymmetry in the Intact Brain . Perspectives in Neurolinguistics, Neuropsychology, and Psycholinguistics. New York : Academic Press.
Chiron C, Pinton F, Masure M, et al . (1999) . Hemispheric specialization using SPECT and stimulation tasks in children with dysphasia and dystrophia . Dev Med Child Neural 41:512-520 .
Dawson G, Finley C, Phillips S, Lewy A . (1989). A com-parison of hemispheric asymmetries in speech-related brain potentials of autistic and dysphasic children. Brain Lang 37:26-41 .
Halgren E, Squires N, Wilson C, et al . (1980) . Endogenous potentials generated in the human hippocampal forma-tion and amygdala by infrequent events . Science 210:803-805 .
Heim S, Eulitz C, Kaufmann J, et al . (2000) . Atypical organisation of the auditory cortex in dyslexia as revealed by MEG. Neuropsychologia 38:1749-1759 .
70
Reversal of Hemispheric Asymmetry in Poor Listeners/Estes et al
Holinger D, Faux S, Shenton M, et al . (1992) . Reversed temporal region asymmetries of P300 topography in left-
and right-handed schizophrenic subjects . EEG Clin Neurophysiol 84:532-537 .
Okada YC, Kaufman L, Williamson SJ. (1983) . The hip-pocampal formation as a source of the slow endogenous potentials . Electroencephalogr Clin Neurophysiol 55:417-426 .
Honer G, BassettA, Squires-Wheeler E, et al . (1995) . The temporal lobes, reversed asymmetry and the genetics of schizophrenia. Neuroreport 7:221-224 .
Hugdahl K, Helland T, Faerevaag MK, et al . (1995) . Absence of ear advantage on the consonant-vowel dichotic listening test in adolescent and adult dyslexics: specific auditory-phonetic dysfunction. J Clin Exp Neuropsychol 17:833-840 .
Hynd G, Semrud-Clikeman M. (1989) . Dyslexia and brain morphology. Psychol Bull 106:447-482 .
Hynd G, Semrud-Clikeman M, Lorys A, et al . (1990) . Brain morphology in developmental dyslexia and atten-tion deficit disorder/hyperactivity. Arch Neural 47:919-926 .
Jerger J, Greenwald R, Wambacq 1, et al . (2000) . Toward a more ecologically valid measure of speech understanding in background noise. J Am Acad Audiol 11:273-282 .
Jerger S, Allen J. (1998) . How global behavioral tests of central auditory processing may complicate management. In : Bess F, ed . Children with Hearing Impairment. Contemporary Rends. Nashville : Bill Wilkerson Center Press, 163-177.
Keith R. (1984) . Dichotic listening in children . In : Beasley D, ed . Audition in Childhood: Methods of Study. San Diego: College-Hill Press, 1-24.
Kraus N, McGee T, Carrell T, et al . (1993) . Speech evoked cortical potentials in children . J Am Acad Audiol 4:238-248 .
Kuhl P. (1994) . Speech perception . In : Minifie F, ed . Introduction to Communication Sciences and Disorders. San Diego, CA : Singular, 77-148 .
Landwehrmeyer B, Gerling J, Wallesch C. (1990) . Patterns of task-related slow brain potentials in dyslexia . Arch Neurol 47:791-797 .
Luchins D, Weinberger D, Wyatt R. (1982) . Schizophrenia and cerebral asymmetry detected by computed tomog-raphy. Am J Psychiatry 139 :753-757 .
McFarland D, Cacace A. (1995) Modality specificity as a criterion for diagnosing central auditory processing dis-orders . Am JAudiol 4:36-48 .
Merzenich M, Schreiner C, Jenkins W Wang X. (1993) . Neural mechanisms underlying temporal integration, segmentation and input sequence representation . Ann NYAcad Sci 682:1-22.
Morgan A, Hynd G. (1998) . Dyslexia, neurolinguistic abil-ity, and anatomical variation of the planum temporale. Neuropsychol Rev 8:79-83 .
Obrzut J, ObrzutA, Bryden M, Bartels S. (1985). Information processing and speech lateralization in learning-disabled children. Brain Lang 25:87-101.
Obrzut J, Conrad P, Boliek C. (1989) . Verbal and non-verbal auditory processing among left-and right-handed good readers and reading-disabled children . Neuropsychologia 27 :1357-1371 .
Petty RG, Barta PE, Pearlson GD, et al . (1995) . Reversal of asymmetry of the planum temporale in schizophrenia. Am J Psychiatry 152:715-721 .
Polich J. (1993) . P300 in clinical applications : meaning, method and measurement. In : Niedermeyer E, Lopes da Silva F, eds. Electroencephalography: Basic Principles, Clinical Applications, and Related Fields . Baltimore: Williams and Wilkins, 1005-1018.
Salmelin R, Schnitzler A, Schmitz F, et al . (1998) . Functional organization of the auditory cortex is differ-ent in stutterers and fluent speakers . Neuroreport 9:2225-2229 .
Shafer V, Schwartz R, Mor M, et al . (2001) . Neuro-physiological indices of language impairment in children . Acta Otolaryngol (Stockh) 121:297-300 .
Silman S, Silverman C, Emmer M. (2000) . Central audi-tory processing disorders and reduced motivation : three case studies. J Am Acad Audiol 11 :57-63 .
Sloan C. (1985) . Language, language learning, and lan-guage disorder : implications for central auditory processing . In : Katz J, Stecker N, Henderson D, eds. Central Auditory Processing: A Transdisciplinary View . St . Louis: Mosby-Yearbook, 179-186.
Smoski W, Brunt M, Tannahill C. (1998) . C.H.A.P.S . Children's Auditory Performance Scale Instruction Manual . Tampa, FL : The Educational Audiology Association.
Stein J. (1994) . Developmental dyslexia, neural timing and hemispheric lateralisation . Int J Psychophysiol 18:241-249 .
Szelag E. (1996) . The effect of auditory experience on hemispheric asymmetry in a post-lingually deaf child: a case study. Cortex 32 :647-661 .
Tallal P, Merzenich M, Miller S, Jenkins W. (1998) . Language learning impairment : integrating research and remediation. Scand J Psychol 39:197-199 .
Temple E, Poldrack RA, Saladis J, et al. (2001) . Disrupted neural responses to phonological and orthographic pro-cessing in dyslexic children: an fMRl study. Neuroreport 12:299-307 .
Tiihonen J, Katila H, Pekkonen E, et al . (1998) . Reversal of cerebral asymmetry in schizophrenia measured with magnetoencephalography. Schizophr Res 30:209-219 .
Velasco M, Velasco F, Velasco AL, et al. (1986). Subcortical correlates of the P300 potential complex in man to audi-tory stimuli. EEG Clin Neurophysiol 64:199-210 .
Weinberg I . (2000) . The prisoners of despair: right hemi-sphere deficiency and suicide. Neurosci Biobehav Rev 24:799-815 .
Williams M, Lecluyse K. (1990) . Perceptual consequences of a temporal processing deficit in reading disabled chil-dren . J Am Optom Assoc 61:111-121 .
71