
Online monitoring of electrical conductivity of wine...
7
Full Terms & Conditions of access and use can be found at http://www.tandfonline.com/action/journalInformation?journalCode=tcyt20 Download by: [Red de Bibliotecas del CSIC] Date: 25 January 2016, At: 04:22 CyTA - Journal of Food ISSN: 1947-6337 (Print) 1947-6345 (Online) Journal homepage: http://www.tandfonline.com/loi/tcyt20 Online monitoring of electrical conductivity of wine induced by ultrasound Qing-An Zhang, Yuan Shen, Xue-Hui Fan, Yan-Ying Yan & Juan Francisco García Martín To cite this article: Qing-An Zhang, Yuan Shen, Xue-Hui Fan, Yan-Ying Yan & Juan Francisco García Martín (2015): Online monitoring of electrical conductivity of wine induced by ultrasound, CyTA - Journal of Food To link to this article: http://dx.doi.org/10.1080/19476337.2015.1111423 © 2015 The Author(s). Publishied by Taylor & Francis. Published online: 23 Nov 2015. Submit your article to this journal Article views: 99 View related articles View Crossmark data
Transcript of Online monitoring of electrical conductivity of wine...

Full Terms & Conditions of access and use can be found athttp://www.tandfonline.com/action/journalInformation?journalCode=tcyt20
Download by: [Red de Bibliotecas del CSIC] Date: 25 January 2016, At: 04:22
CyTA - Journal of Food
ISSN: 1947-6337 (Print) 1947-6345 (Online) Journal homepage: http://www.tandfonline.com/loi/tcyt20
Online monitoring of electrical conductivity ofwine induced by ultrasound
Qing-An Zhang, Yuan Shen, Xue-Hui Fan, Yan-Ying Yan & Juan FranciscoGarcía Martín
To cite this article: Qing-An Zhang, Yuan Shen, Xue-Hui Fan, Yan-Ying Yan & Juan FranciscoGarcía Martín (2015): Online monitoring of electrical conductivity of wine induced byultrasound, CyTA - Journal of Food
To link to this article: http://dx.doi.org/10.1080/19476337.2015.1111423
© 2015 The Author(s). Publishied by Taylor &Francis.
Published online: 23 Nov 2015.
Submit your article to this journal
Article views: 99
View related articles
View Crossmark data

SHORT COMMUNICATION
Online monitoring of electrical conductivity of wine induced by ultrasoundQing-An Zhanga, Yuan Shena, Xue-Hui Fana, Yan-Ying Yana and Juan Francisco García Martín b
aSchool of Food Engineering and Nutrition Sciences, Shaanxi Normal University, Xi’an, Shaanxi Province, PR China; bInstituto de la Grasa,Spanish National Research Council, Campus Universidad Pablo de Olavide, Seville, Spain
ABSTRACTWe assessed the effects of ultrasonic frequency, power, temperature and exposure time on theelectric conductivity (EC) of wine to evaluate the feasibility of the online EC monitoring as anindicator to reflect the changes of wine quality under the ultrasound irradiation. Results showedthat the continuously monitored curve of EC was significantly different from the values recorded atthe beginning and end of sonication. An abrupt rise and a rapid drop of wine EC were observed atthe start and end points of sonication, respectively, in all working conditions. With regards to theassayed wine temperatures, the effect exerted by this parameter on EC before sonication was totallydifferent from that observed when the samples were cooled down after ultrasound treatment. All inall, these results suggest that the online EC monitoring of wine may be used as an efficient indicatorto control and reflect the real changes of wine under ultrasound treatment.
Seguimiento online de la conductividad eléctrica del vino inducido porultrasonido
RESUMENHemos estudiado los efectos de la frecuencia de ultrasonido, la potencia, la temperatura y el tiempode exposición en la conductividad eléctrica (EC) del vino para evaluar la viabilidad del seguimientoEC online como indicador para reflejar los cambios en la calidad del vino bajo irradiación deultrasonido. Los resultados mostraron que la curva de EC supervisada en continuo fue significati-vamente diferente de los valores registrados al principio y al final de la sonicación. Se observaron unaumento brusco y una rápida caída de EC del vino al principio y al final de la sonicación,respectivamente, para todas las condiciones estudiadas. En referencia a las temperaturas testadasdel vino, el efecto ejercido por este parámetro en EC antes de la sonicación fue totalmente distintode aquel observado cuando se enfriaron las muestras después del tratamiento de ultrasonido. Enresumen, estos resultados sugieren que el seguimiento online de EC del vino podría ser utilizadocomo un indicador eficiente para controlar y reflejar los cambios reales en el vino con el uso detratamiento de ultrasonido.
ARTICLE HISTORYReceived 2 August 2015Accepted 13 October 2015
KEYWORDSElectrical conductivity;online monitoring;ultrasound; wine
PALABRAS CLAVEConductividad eléctrica;seguimiento online;ultrasonido; vino
1. Introduction
As a low-cost, non-hazardous and environmentally friendlynovel technology, ultrasound has recently attracted greatattention in food industry, especially due to its significanteffects on the chemical, physical, biochemical and microbialproperties of foodstuffs (Martín, Zhang, Castro, Barbosa-Cánovas, & Swanson, 1994), which is attributed to the acous-tic cavitation generated by ultrasound. Moreover, in someapplications, both the physical forces and chemical reactionsare useful. Regarding its utilization in food processing, sev-eral processes have been applied efficiently including freez-ing, cutting, drying, tempering, bleaching, sterilization,filtration, emulsification and extraction (Chandrapala, Oliver,Kentish, & Ashokkumar, 2012; Chemat, Zill-e-Huma, & Khan,2011; Zhang et al., 2015a). Besides the above-mentionedapplications, ultrasound has shown great potential for accel-erating the ageing process of wine in order to obtain ahomogeneous wine solution resembling a liquid that hasbeen subject to many years of natural ageing (Chang &Chen, 2002; Chang, 2004; García Martín & Sun, 2013; Tao,García Martín, & Sun, 2014). As expected, it has been provedto be effective in modifying the quality of wines and fruit
juices (Cheng, Soh, Liew, & Teh, 2007; Tiwari, Patras, Brunton,Cullen, & O’Donnell, 2010; Zhang, Shen, Fan, & García Martín,2015b; Zheng, Zhang, Fang, & Liu, 2014); that is, ultrasoundhas a promising industrial application in this field in the nearfuture.
Electrical conductivity (EC) is an electrical phenomenonwhich is defined as the measure of a material’s ability toaccommodate the transport of an electric charge. It repre-sents an important physicochemical property of the foodproducts and has been used to determine the changes ofnutrients like vitamins, minerals, fatty acids and proteins, orevaluate food quality during food processing (Colombié,Latrille, & Sablayrolles, 2007, 2008; Martín et al., 1994;Zhang, 2007). Furthermore, the EC of a solution is highlyproportional (but not totally) to its ion concentration. Insome situations, however, conductivity may not correlatedirectly to concentration. Regarding the EC in food exposedto ultrasound, significant changes have been observed byJambrak, Mason, Paniwnyk, and Lelas (2007) and Aadil, Zeng,Han, and Sun (2013), but all the changes were measureddiscontinuously during ultrasonic treatment; i.e. the valuesof EC were recorded at a fixed time in one experimental run.
CONTACT Qing-An Zhang [email protected]© 2015 The Author(s). Publishied by Taylor & Francis.This is an Open Access article distributed under the terms of the Creative Commons Attribution License (http://creativecommons.org/licenses/by/4.0/), which permits unrestricted use,distribution, and reproduction in any medium, provided the original work is properly cited.
CYTA – JOURNAL OF FOOD, 2015http://dx.doi.org/10.1080/19476337.2015.1111423
Dow
nloa
ded
by [
Red
de
Bib
liote
cas
del C
SIC
] at
04:
22 2
5 Ja
nuar
y 20
16

Interestingly, our study indicates that the value measureddiscontinuously at a given time is very different from thevalue monitored by the real time at the same given timeduring sonication. The online monitoring of EC during wine-making could be used as a reliable and cheap sensor. In thissense, Colombié (Colombié et al., 2007, 2008) illustrated thegood correlation of EC with assimilable nitrogen and pHduring fermentation. An estimation of the wine cold stabilityafter fermentation (to prevent tartaric salts from precipitat-ing out the wine when stored) based on the decrease inconductivity of the wine over a period of time has beenproposed as well (Zoecklein, Fugelsang, Gump, & Nury,1995). Considering the chemical effects of ultrasound, inour opinion, the online EC measuring may be used as anindicator to reflect the real changes of food undersonication.
The real-time evaluation of changes in a specific compoundof wine during sonication is difficult because of the complexcomposition of wine. Furthermore, most of the methods forwine characterization are destructive and thereby cannot bemonitored online. Therefore, the monitoring of wine qualityby means of EC online measures would be highly useful toassess the effects of ultrasound on wine. However, to the bestof our knowledge, there is currently no available report for theonline monitoring of EC in wine under sonication. The mainobjective of this study is to investigate the effect of ultrasoundon the kinetic changes of EC in wine and evaluate the feasi-bility of using EC as an indicator to monitor the status of wineunder sonication in the future.
2. Materials and methods
2.1. Materials
A wine of Cabernet Sauvignon from the vintage of 2012 wasused throughout this research, which was kindly donated byDanfeng Winery Co. Ltd., Shaanxi, China.
2.2. Methods
2.2.1. Ultrasound experimental design and datacollectionThe sonication was carried out in ultrasonic cleaning bathKQ-300VDE (Kunshan Ultrasonic Equipment Co. Ltd., Jiangsu
Province, China). The ultrasonic bath can work at the fre-quencies of 45, 80 and 100 kHz with a variable power output(maximum power 300 W). Ultrasonic energy was deliveredfrom the bottom to the water in the tank by six annealedtransducers. For each experimental run, 30 mL of red winewas loaded into a 50-mL glass Erlenmeyer flask sealed with aplastic film, and then placed in the water bath and fixed wellin the same position during ultrasonic treatment.
The changes of EC mediated by ultrasound were moni-tored using a Leici DDSJ-308 F digital conductometer(Shanghai YiDian Scientific Instrument Co. Ltd., China),which is connected to a REX 2.0 software of running DataCollector (Shanghai, YiDian Scientific Instrument Co. Ltd.China), a T-818-B-6 temperature sensor and a DJS-1D con-ductivity immersion electrode. The ultrasonic temperaturewas controlled by a Xiangya DLSB-5/20 circulation pump ofclosed-loop cryogenic refrigerator (Shanghai, China).Throughout the experiments, the EC data were recordedevery 6 seconds. The experimental set-up is shown inFigure 1.
Four experimental sets were performed in this study.First, the effect of ultrasound frequencies of 45, 80 and100 kHz on EC in wine was monitored at the conditions of300 W, 20 minutes and 20°C. Subsequently, the effects ofdifferent ultrasonic power levels, namely 120, 150, 180, 210,240, 270 and 300 W, were investigated on the EC changes inwine, and the sonication was performed at 20°C for 20 minwith the frequency of 100 kHz. Third, the effect of ultrasoundexposure (20, 40, 60 and 100 min) was conducted with theultrasonic conditions of 20°C, 100 kHz and 300 W. Finally,investigations were carried out with water bath tempera-tures of 20, 30, 40, 50 and 60°C, with a frequency of100 kHz and a power of 300 W for 20 min.
3. Results and discussion
3.1. Effect of ultrasound frequencies on the kineticchanges of EC in wine
As shown in Figure 2, the kinetic changes of EC were mon-itored online in wines treated at three ultrasonic frequenciesof 45, 80 and 100 kHz, respectively. As a whole, the curves ofEC in wine demonstrated a stable rising trend as a functionof time during ultrasonic treatment. A sudden rise and a
Figure 1. Experimental set-up of ultrasonication: (1) ultrasonic generator; (2) transducer; (3) water bath; (4) 50-mL glass Erlenmeyer flask; (5) circulation pump ofclosed-loop cryogenic refrigeration; (6) electric conductometer; (7) PC.
Figura 1. Ajuste experimental para la ultrasonicación: (1) Generador ultrasónico; (2) Transductor; (3) Banyo de agua; (4) 50-mL de Erlenmeyer en frasco de vidrio;(5) Bomba de circulación de refrigeración criogénica en circuito cerrado; (6) Conductímetro electric; (7) del monitor.
2 Q.-A. ZHANG ET AL.
Dow
nloa
ded
by [
Red
de
Bib
liote
cas
del C
SIC
] at
04:
22 2
5 Ja
nuar
y 20
16
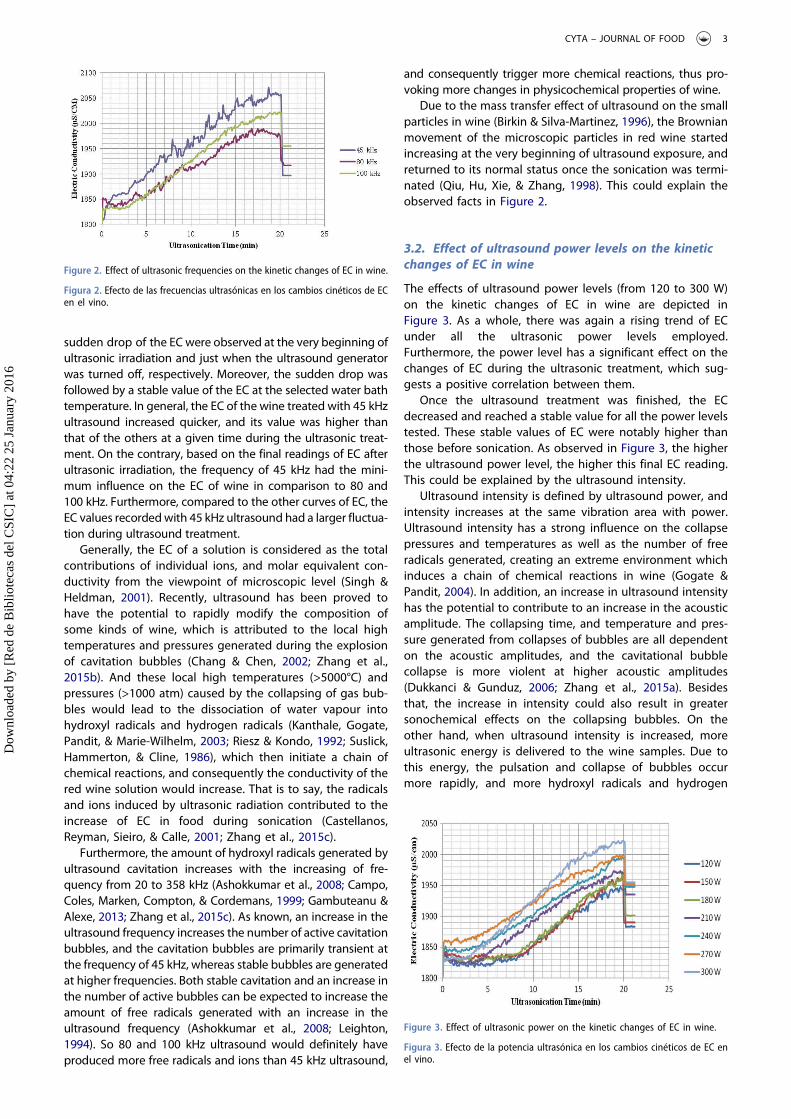
sudden drop of the ECwere observed at the very beginning ofultrasonic irradiation and just when the ultrasound generatorwas turned off, respectively. Moreover, the sudden drop wasfollowed by a stable value of the EC at the selected water bathtemperature. In general, the EC of the wine treated with 45 kHzultrasound increased quicker, and its value was higher thanthat of the others at a given time during the ultrasonic treat-ment. On the contrary, based on the final readings of EC afterultrasonic irradiation, the frequency of 45 kHz had the mini-mum influence on the EC of wine in comparison to 80 and100 kHz. Furthermore, compared to the other curves of EC, theEC values recordedwith 45 kHz ultrasound had a larger fluctua-tion during ultrasound treatment.
Generally, the EC of a solution is considered as the totalcontributions of individual ions, and molar equivalent con-ductivity from the viewpoint of microscopic level (Singh &Heldman, 2001). Recently, ultrasound has been proved tohave the potential to rapidly modify the composition ofsome kinds of wine, which is attributed to the local hightemperatures and pressures generated during the explosionof cavitation bubbles (Chang & Chen, 2002; Zhang et al.,2015b). And these local high temperatures (>5000°C) andpressures (>1000 atm) caused by the collapsing of gas bub-bles would lead to the dissociation of water vapour intohydroxyl radicals and hydrogen radicals (Kanthale, Gogate,Pandit, & Marie-Wilhelm, 2003; Riesz & Kondo, 1992; Suslick,Hammerton, & Cline, 1986), which then initiate a chain ofchemical reactions, and consequently the conductivity of thered wine solution would increase. That is to say, the radicalsand ions induced by ultrasonic radiation contributed to theincrease of EC in food during sonication (Castellanos,Reyman, Sieiro, & Calle, 2001; Zhang et al., 2015c).
Furthermore, the amount of hydroxyl radicals generated byultrasound cavitation increases with the increasing of fre-quency from 20 to 358 kHz (Ashokkumar et al., 2008; Campo,Coles, Marken, Compton, & Cordemans, 1999; Gambuteanu &Alexe, 2013; Zhang et al., 2015c). As known, an increase in theultrasound frequency increases the number of active cavitationbubbles, and the cavitation bubbles are primarily transient atthe frequency of 45 kHz, whereas stable bubbles are generatedat higher frequencies. Both stable cavitation and an increase inthe number of active bubbles can be expected to increase theamount of free radicals generated with an increase in theultrasound frequency (Ashokkumar et al., 2008; Leighton,1994). So 80 and 100 kHz ultrasound would definitely haveproduced more free radicals and ions than 45 kHz ultrasound,
and consequently trigger more chemical reactions, thus pro-voking more changes in physicochemical properties of wine.
Due to the mass transfer effect of ultrasound on the smallparticles in wine (Birkin & Silva-Martinez, 1996), the Brownianmovement of the microscopic particles in red wine startedincreasing at the very beginning of ultrasound exposure, andreturned to its normal status once the sonication was termi-nated (Qiu, Hu, Xie, & Zhang, 1998). This could explain theobserved facts in Figure 2.
3.2. Effect of ultrasound power levels on the kineticchanges of EC in wine
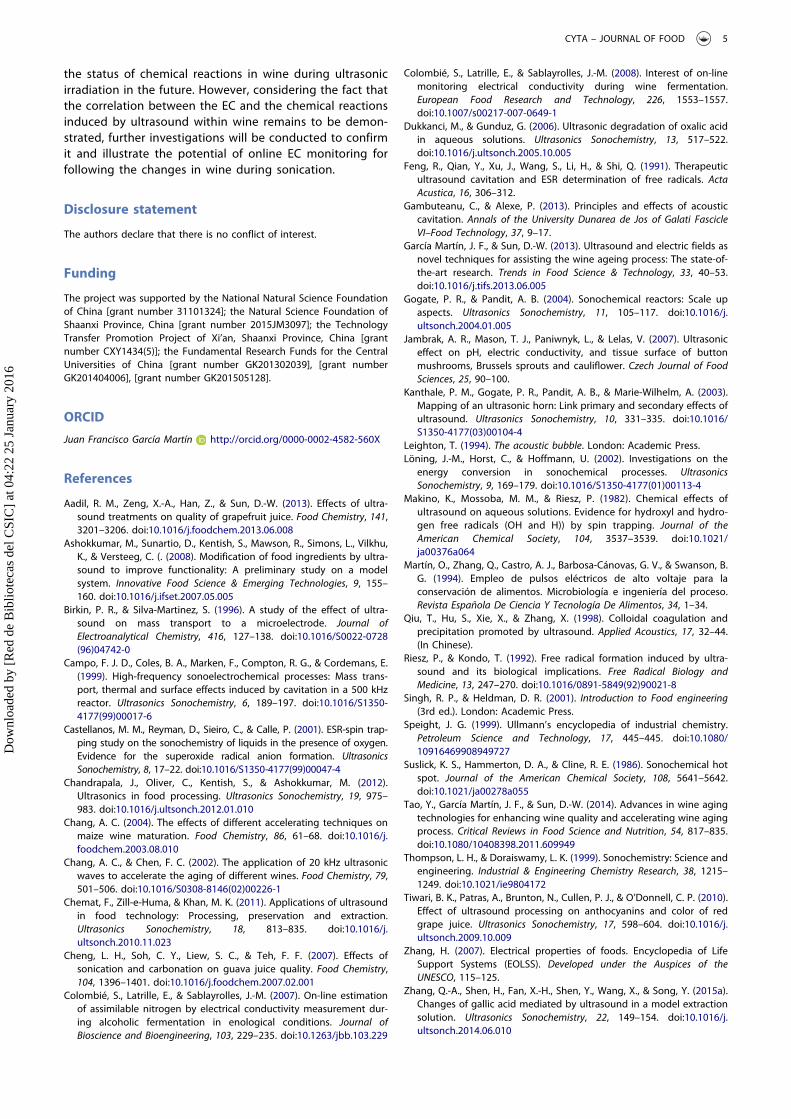
The effects of ultrasound power levels (from 120 to 300 W)on the kinetic changes of EC in wine are depicted inFigure 3. As a whole, there was again a rising trend of ECunder all the ultrasonic power levels employed.Furthermore, the power level has a significant effect on thechanges of EC during the ultrasonic treatment, which sug-gests a positive correlation between them.
Once the ultrasound treatment was finished, the ECdecreased and reached a stable value for all the power levelstested. These stable values of EC were notably higher thanthose before sonication. As observed in Figure 3, the higherthe ultrasound power level, the higher this final EC reading.This could be explained by the ultrasound intensity.
Ultrasound intensity is defined by ultrasound power, andintensity increases at the same vibration area with power.Ultrasound intensity has a strong influence on the collapsepressures and temperatures as well as the number of freeradicals generated, creating an extreme environment whichinduces a chain of chemical reactions in wine (Gogate &Pandit, 2004). In addition, an increase in ultrasound intensityhas the potential to contribute to an increase in the acousticamplitude. The collapsing time, and temperature and pres-sure generated from collapses of bubbles are all dependenton the acoustic amplitudes, and the cavitational bubblecollapse is more violent at higher acoustic amplitudes(Dukkanci & Gunduz, 2006; Zhang et al., 2015a). Besidesthat, the increase in intensity could also result in greatersonochemical effects on the collapsing bubbles. On theother hand, when ultrasound intensity is increased, moreultrasonic energy is delivered to the wine samples. Due tothis energy, the pulsation and collapse of bubbles occurmore rapidly, and more hydroxyl radicals and hydrogen
Figure 2. Effect of ultrasonic frequencies on the kinetic changes of EC in wine.
Figura 2. Efecto de las frecuencias ultrasónicas en los cambios cinéticos de ECen el vino.
Figure 3. Effect of ultrasonic power on the kinetic changes of EC in wine.
Figura 3. Efecto de la potencia ultrasónica en los cambios cinéticos de EC enel vino.
CYTA – JOURNAL OF FOOD 3
Dow
nloa
ded
by [
Red
de
Bib
liote
cas
del C
SIC
] at
04:
22 2
5 Ja
nuar
y 20
16

radicals are released from the bubbles (Makino, Mossoba, &Riesz, 1982; Zhang et al., 2015c), which then initiate a chainof chemical reactions, increasing consequently the conduc-tivity of the red wine.
3.3. Effect of ultrasonic time on the changes of EC inwine
The EC rapidly increased with the increase of ultrasoundexposure time roughly during the first 20 min, following bya stabilization in the EC reading over time (Figure 4). This isin accordance with the results reported by Feng et al. (1991).These authors pointed out that the yield of hydroxyl radicalsin aqueous solution induced by ultrasound increased at theinitial stage, and then tended to stabilize with the furtherincrease of sonication time (Feng et al., 1991). Although thetrends of EC changes in wine were very similar, and nosignificant differences were observed at a given time, thefinal readings recorded when ultrasound treatment stoppedwere significantly different. To be specific, the longer thetreatment is, the larger the EC changes in wine will be.
3.4. Effect of ultrasonic temperature on kineticchanges of EC in wine
The temperature of the water bath, and consequently thetemperature of wine, had a great effect on the EC. Priorsonication, the increase of the wine temperature led to anotable increase of the EC (Figure 5). The effect exerted bytemperature on wine EC was greater than those of thedifferent ultrasound powers and frequencies assayed in thiswork (Figures 2 and 3).
The highest and the lowest values of EC registered beforeultrasound treatment were 2520 and 1800 μs/cm, whichwere achieved at the wine temperatures of 60°C and 20°C,respectively. And the final readings of EC ranked in the sameorder as at the beginning of ultrasound treatment, i.e. thehigher the temperature, the higher the wine EC. However,
when the ultrasonically treated wines were let cool down to20°C (The time which required to cool down the samplesfrom 60°C to 20°C was 35 min by using a circulation pump ofclosed-loop cryogenic refrigerator), the opposite trend wasfound (Table 1), so that wines treated with ultrasound at thehighest temperatures showed the lowest EC. Probably dueto that the increased temperature will reduce the cavitationintensity and the higher the temperature, the lower theconductivity.
Generally, temperature can influence the ions mobility offood and consequently their EC. Zhang (2007) reported thatthe EC of some liquid foods (such as beer, coffee, fruit juice,milk and vegetable juice) increased with the increasing oftemperature, which was in accordance with what we havefound in this research. It has been reported a decrease ofcavitation intensity with the increase of temperature duringultrasound treatment (Löning, Horst, & Hoffmann, 2002;Speight, 1999; Thompson & Doraiswamy, 1999). If cavitationintensity decreases, less hydroxyl and hydrogen radicals willbe induced and thereby the effect on EC will be lower(Zhang et al., 2015c). This could account for the value ofEC of the sample treated at 60°C after cooling down to 20°C.
4. Conclusions
In summary, the EC of wine was definitely influenced bythe ultrasonic irradiation and operational temperatureunder all the conditions employed. Furthermore, thekinetic changes of EC monitored in real time were signifi-cantly different than the values measured at intervals dur-ing sonication. When operating at different winetemperatures, opposite effects were found. The highestconductivities were reached during sonication at the high-est temperature assayed (60°C) while the minimum ECvalue was found at this temperature after cooling downthe wine to 20°C once ultrasound treatment was over.These results suggest that the EC of wine might be con-sidered as an important and simple indicator to monitor
Figure 5. Effect of ultrasonic temperature on the kinetic changes of EC inwine.
Figura 5. Efecto de la temperatura de ultrasonido en los cambios cinéticos deEC en el vino.
Table 1. Final EC readings of ultrasonically treated wines after cooling down to 20°C.
Tabla 1. Lecturas finales de EC del vino después del tratamiento ultrasónico y enfriadas a 20°C.
Ultrasonic temperature (°C) 20 30 40 50 60Electric conductivity (μs/cm) 1955 ± 2.6a 1947 ± 3.6a 1938 ± 2.0b 1928 ± 4.0cd 1921 ± 1.5d
Note: Means ± SD (n = 3); values with different letters are significantly different at p ≤ 0.05.Nota: Promedios ± SD (n = 3); los valores con diferentes letras son significativamente distintos a p ≤ 0,05.
Figure 4. Effect of ultrasonic time on the kinetic changes of EC in wine.
Figura 4. Efecto del tiempo de ultrasonido en los cambios cinéticos de ECen el vino.
4 Q.-A. ZHANG ET AL.
Dow
nloa
ded
by [
Red
de
Bib
liote
cas
del C
SIC
] at
04:
22 2
5 Ja
nuar
y 20
16
the status of chemical reactions in wine during ultrasonicirradiation in the future. However, considering the fact thatthe correlation between the EC and the chemical reactionsinduced by ultrasound within wine remains to be demon-strated, further investigations will be conducted to confirmit and illustrate the potential of online EC monitoring forfollowing the changes in wine during sonication.
Disclosure statement
The authors declare that there is no conflict of interest.
Funding
The project was supported by the National Natural Science Foundationof China [grant number 31101324]; the Natural Science Foundation ofShaanxi Province, China [grant number 2015JM3097]; the TechnologyTransfer Promotion Project of Xi’an, Shaanxi Province, China [grantnumber CXY1434(5)]; the Fundamental Research Funds for the CentralUniversities of China [grant number GK201302039], [grant numberGK201404006], [grant number GK201505128].
ORCID
Juan Francisco García Martín http://orcid.org/0000-0002-4582-560X
References
Aadil, R. M., Zeng, X.-A., Han, Z., & Sun, D.-W. (2013). Effects of ultra-sound treatments on quality of grapefruit juice. Food Chemistry, 141,3201–3206. doi:10.1016/j.foodchem.2013.06.008
Ashokkumar, M., Sunartio, D., Kentish, S., Mawson, R., Simons, L., Vilkhu,K., & Versteeg, C. (. (2008). Modification of food ingredients by ultra-sound to improve functionality: A preliminary study on a modelsystem. Innovative Food Science & Emerging Technologies, 9, 155–160. doi:10.1016/j.ifset.2007.05.005
Birkin, P. R., & Silva-Martinez, S. (1996). A study of the effect of ultra-sound on mass transport to a microelectrode. Journal ofElectroanalytical Chemistry, 416, 127–138. doi:10.1016/S0022-0728(96)04742-0
Campo, F. J. D., Coles, B. A., Marken, F., Compton, R. G., & Cordemans, E.(1999). High-frequency sonoelectrochemical processes: Mass trans-port, thermal and surface effects induced by cavitation in a 500 kHzreactor. Ultrasonics Sonochemistry, 6, 189–197. doi:10.1016/S1350-4177(99)00017-6
Castellanos, M. M., Reyman, D., Sieiro, C., & Calle, P. (2001). ESR-spin trap-ping study on the sonochemistry of liquids in the presence of oxygen.Evidence for the superoxide radical anion formation. UltrasonicsSonochemistry, 8, 17–22. doi:10.1016/S1350-4177(99)00047-4
Chandrapala, J., Oliver, C., Kentish, S., & Ashokkumar, M. (2012).Ultrasonics in food processing. Ultrasonics Sonochemistry, 19, 975–983. doi:10.1016/j.ultsonch.2012.01.010
Chang, A. C. (2004). The effects of different accelerating techniques onmaize wine maturation. Food Chemistry, 86, 61–68. doi:10.1016/j.foodchem.2003.08.010
Chang, A. C., & Chen, F. C. (2002). The application of 20 kHz ultrasonicwaves to accelerate the aging of different wines. Food Chemistry, 79,501–506. doi:10.1016/S0308-8146(02)00226-1
Chemat, F., Zill-e-Huma, & Khan, M. K. (2011). Applications of ultrasoundin food technology: Processing, preservation and extraction.Ultrasonics Sonochemistry, 18, 813–835. doi:10.1016/j.ultsonch.2010.11.023
Cheng, L. H., Soh, C. Y., Liew, S. C., & Teh, F. F. (2007). Effects ofsonication and carbonation on guava juice quality. Food Chemistry,104, 1396–1401. doi:10.1016/j.foodchem.2007.02.001
Colombié, S., Latrille, E., & Sablayrolles, J.-M. (2007). On-line estimationof assimilable nitrogen by electrical conductivity measurement dur-ing alcoholic fermentation in enological conditions. Journal ofBioscience and Bioengineering, 103, 229–235. doi:10.1263/jbb.103.229
Colombié, S., Latrille, E., & Sablayrolles, J.-M. (2008). Interest of on-linemonitoring electrical conductivity during wine fermentation.European Food Research and Technology, 226, 1553–1557.doi:10.1007/s00217-007-0649-1
Dukkanci, M., & Gunduz, G. (2006). Ultrasonic degradation of oxalic acidin aqueous solutions. Ultrasonics Sonochemistry, 13, 517–522.doi:10.1016/j.ultsonch.2005.10.005
Feng, R., Qian, Y., Xu, J., Wang, S., Li, H., & Shi, Q. (1991). Therapeuticultrasound cavitation and ESR determination of free radicals. ActaAcustica, 16, 306–312.
Gambuteanu, C., & Alexe, P. (2013). Principles and effects of acousticcavitation. Annals of the University Dunarea de Jos of Galati FascicleVI–Food Technology, 37, 9–17.
García Martín, J. F., & Sun, D.-W. (2013). Ultrasound and electric fields asnovel techniques for assisting the wine ageing process: The state-of-the-art research. Trends in Food Science & Technology, 33, 40–53.doi:10.1016/j.tifs.2013.06.005
Gogate, P. R., & Pandit, A. B. (2004). Sonochemical reactors: Scale upaspects. Ultrasonics Sonochemistry, 11, 105–117. doi:10.1016/j.ultsonch.2004.01.005
Jambrak, A. R., Mason, T. J., Paniwnyk, L., & Lelas, V. (2007). Ultrasoniceffect on pH, electric conductivity, and tissue surface of buttonmushrooms, Brussels sprouts and cauliflower. Czech Journal of FoodSciences, 25, 90–100.
Kanthale, P. M., Gogate, P. R., Pandit, A. B., & Marie-Wilhelm, A. (2003).Mapping of an ultrasonic horn: Link primary and secondary effects ofultrasound. Ultrasonics Sonochemistry, 10, 331–335. doi:10.1016/S1350-4177(03)00104-4
Leighton, T. (1994). The acoustic bubble. London: Academic Press.Löning, J.-M., Horst, C., & Hoffmann, U. (2002). Investigations on the
energy conversion in sonochemical processes. UltrasonicsSonochemistry, 9, 169–179. doi:10.1016/S1350-4177(01)00113-4
Makino, K., Mossoba, M. M., & Riesz, P. (1982). Chemical effects ofultrasound on aqueous solutions. Evidence for hydroxyl and hydro-gen free radicals (OH and H)) by spin trapping. Journal of theAmerican Chemical Society, 104, 3537–3539. doi:10.1021/ja00376a064
Martín, O., Zhang, Q., Castro, A. J., Barbosa-Cánovas, G. V., & Swanson, B.G. (1994). Empleo de pulsos eléctricos de alto voltaje para laconservación de alimentos. Microbiología e ingeniería del proceso.Revista Española De Ciencia Y Tecnología De Alimentos, 34, 1–34.
Qiu, T., Hu, S., Xie, X., & Zhang, X. (1998). Colloidal coagulation andprecipitation promoted by ultrasound. Applied Acoustics, 17, 32–44.(In Chinese).
Riesz, P., & Kondo, T. (1992). Free radical formation induced by ultra-sound and its biological implications. Free Radical Biology andMedicine, 13, 247–270. doi:10.1016/0891-5849(92)90021-8
Singh, R. P., & Heldman, D. R. (2001). Introduction to Food engineering(3rd ed.). London: Academic Press.
Speight, J. G. (1999). Ullmann’s encyclopedia of industrial chemistry.Petroleum Science and Technology, 17, 445–445. doi:10.1080/10916469908949727
Suslick, K. S., Hammerton, D. A., & Cline, R. E. (1986). Sonochemical hotspot. Journal of the American Chemical Society, 108, 5641–5642.doi:10.1021/ja00278a055
Tao, Y., García Martín, J. F., & Sun, D.-W. (2014). Advances in wine agingtechnologies for enhancing wine quality and accelerating wine agingprocess. Critical Reviews in Food Science and Nutrition, 54, 817–835.doi:10.1080/10408398.2011.609949
Thompson, L. H., & Doraiswamy, L. K. (1999). Sonochemistry: Science andengineering. Industrial & Engineering Chemistry Research, 38, 1215–1249. doi:10.1021/ie9804172
Tiwari, B. K., Patras, A., Brunton, N., Cullen, P. J., & O’Donnell, C. P. (2010).Effect of ultrasound processing on anthocyanins and color of redgrape juice. Ultrasonics Sonochemistry, 17, 598–604. doi:10.1016/j.ultsonch.2009.10.009
Zhang, H. (2007). Electrical properties of foods. Encyclopedia of LifeSupport Systems (EOLSS). Developed under the Auspices of theUNESCO, 115–125.
Zhang, Q.-A., Shen, H., Fan, X.-H., Shen, Y., Wang, X., & Song, Y. (2015a).Changes of gallic acid mediated by ultrasound in a model extractionsolution. Ultrasonics Sonochemistry, 22, 149–154. doi:10.1016/j.ultsonch.2014.06.010
CYTA – JOURNAL OF FOOD 5
Dow
nloa
ded
by [
Red
de
Bib
liote
cas
del C
SIC
] at
04:
22 2
5 Ja
nuar
y 20
16

Zhang, Q.-A., Shen, Y., Fan, X.-H., & García Martín, J. F. (2015b).Preliminary study of the effect of ultrasound on physicochemicalproperties of red wine. CyTA – Journal of Food, 1–10. doi:10.1080/19476337.2015.1045036
Zhang, Q.-A., Shen, Y., Fan, X.-H., García Martín, J. F., Wang, X., &Song, Y. (2015c). Free radical generation induced by ultrasoundin red wine and model wine: An EPR spin-trapping
study. Ultrasonics Sonochemistry, 27, 96–101. doi:10.1016/j.ultsonch.2015.05.003
Zheng, X., Zhang, M., Fang, Z., & Liu, Y. (2014). Effects of low frequencyultrasonic treatment on the maturation of steeped greengage wine.Food Chemistry, 162, 264–269. doi:10.1016/j.foodchem.2014.04.071
Zoecklein, B. K., Fugelsang, B., Gump, B., & Nury, F. (1995). Wine analysisand production. New York, NY: Chapman & Hall.
6 Q.-A. ZHANG ET AL.
Dow
nloa
ded
by [
Red
de
Bib
liote
cas
del C
SIC
] at
04:
22 2
5 Ja
nuar
y 20
16