Radiofrequency Measurements Network Analyzer
42
Radiofrequency Measurements Network Analyzer
Transcript of Radiofrequency Measurements Network Analyzer
Radiofrequency
Measurements
Network Analyzer
The next slides material is taken from AGILENT “Network Analyzer Basics”:
• BTB_Network_2005.pdf
• SLDPRE_BTB_2000Network.ppt
• 12-17-02-RF-network-analysis-Yates_791-1mb.pdf
2
3
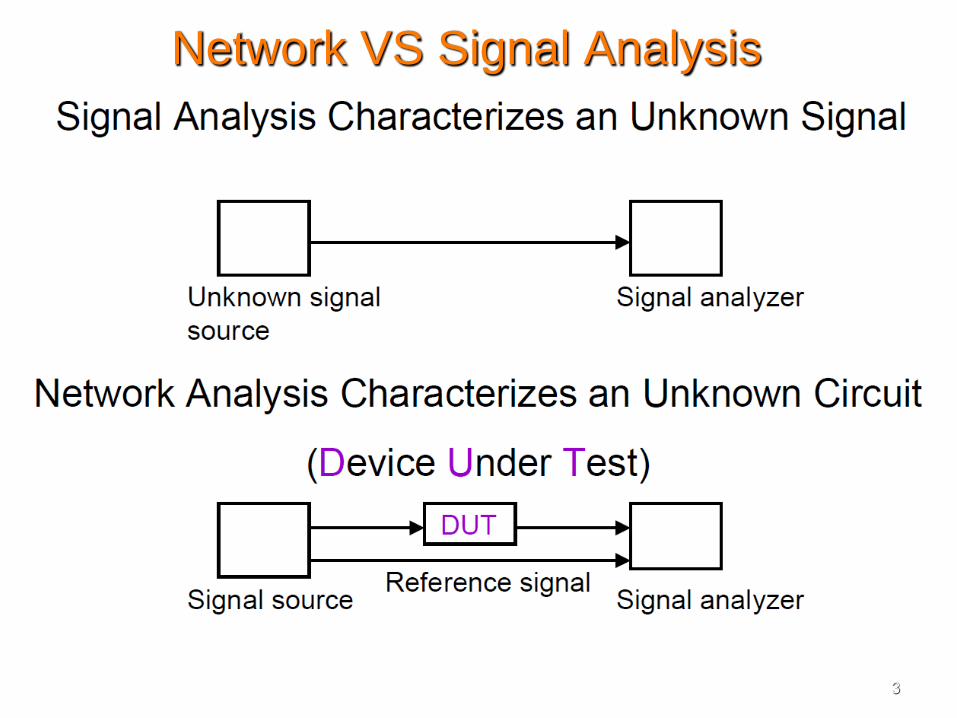
Network VS Signal Analysis
4
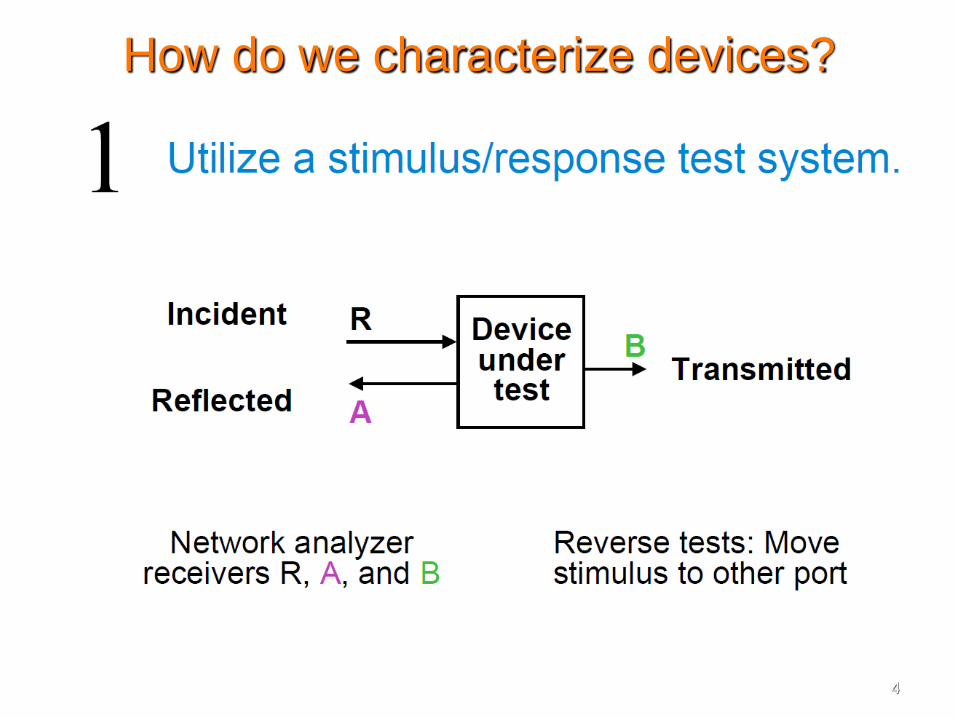
How do we characterize devices?
5
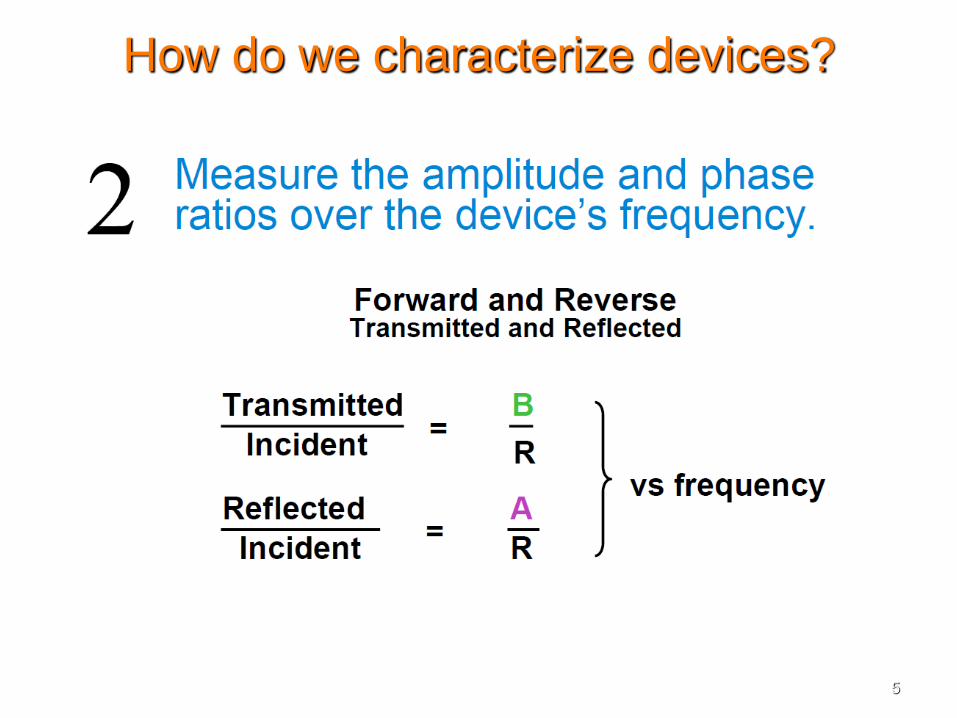
How do we characterize devices?
6
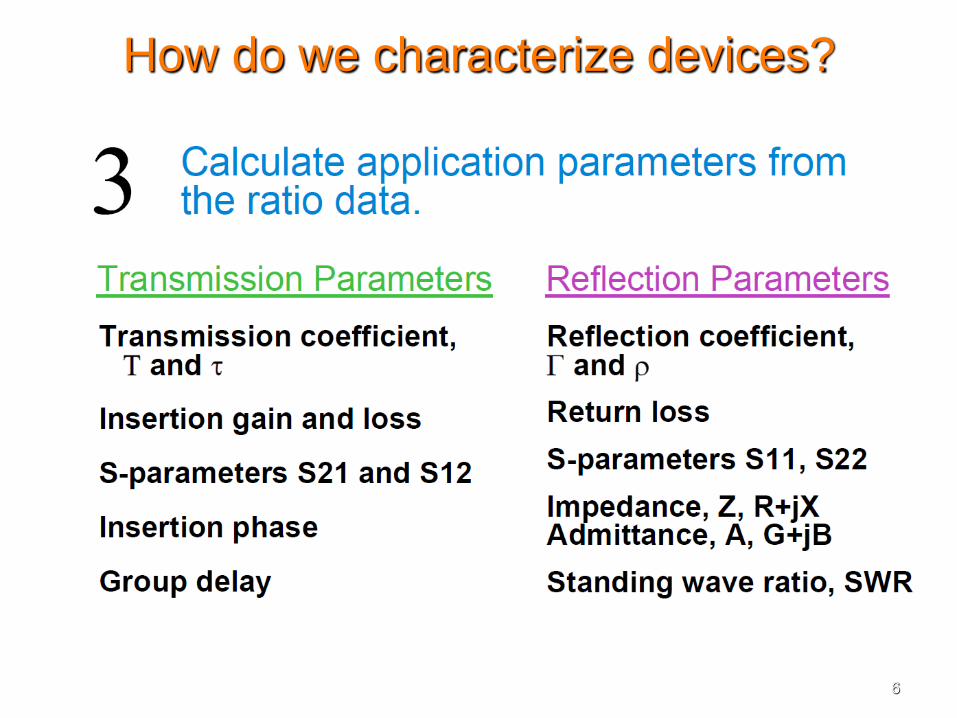
How do we characterize devices?
7
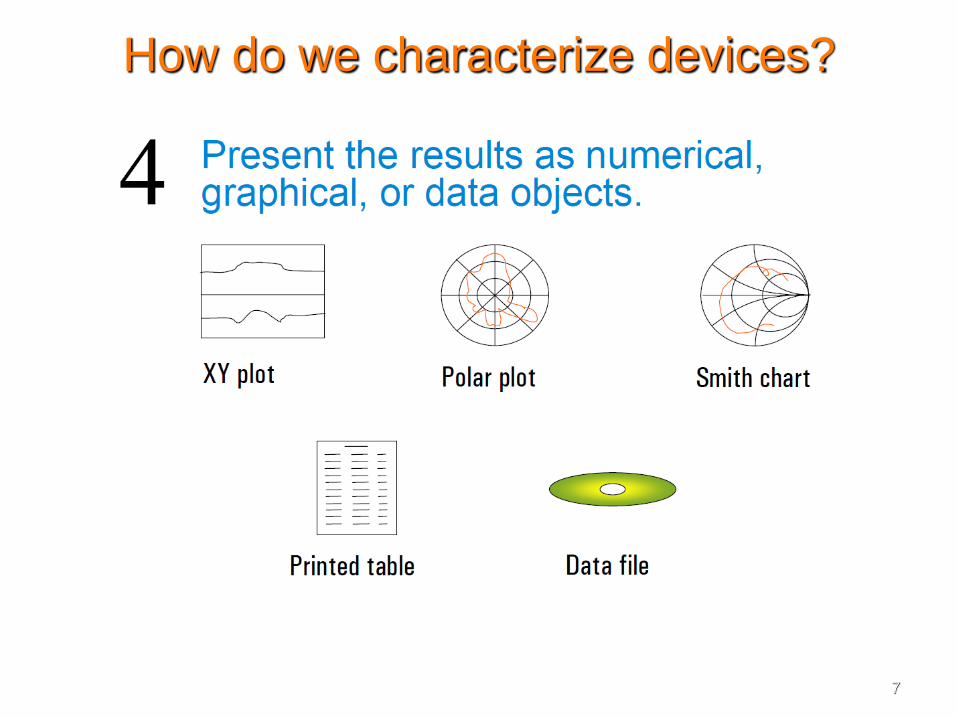
How do we characterize devices?
8
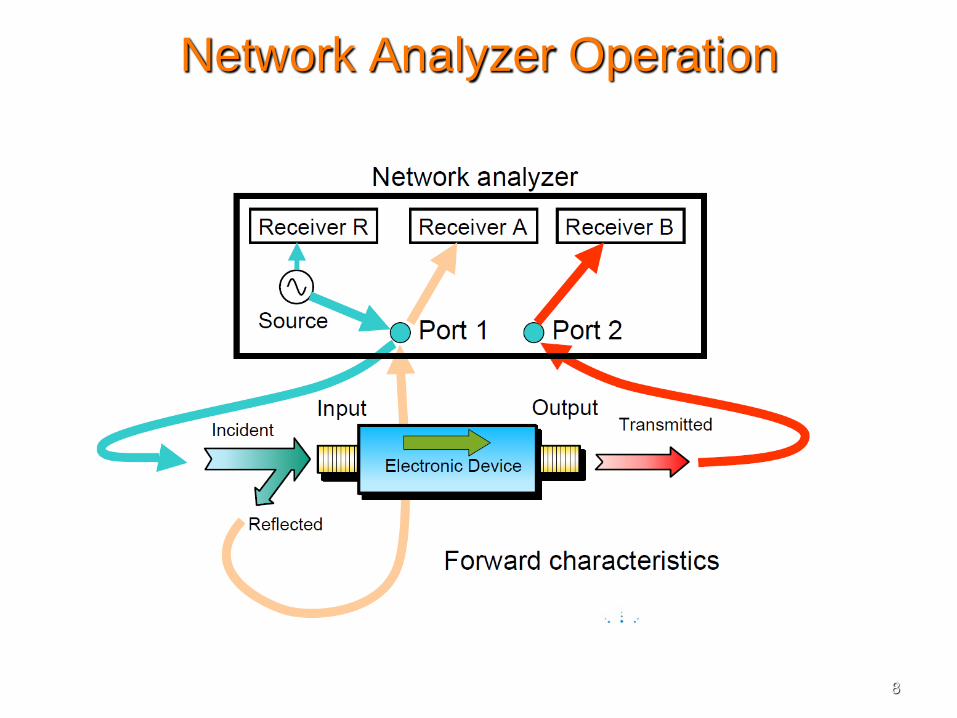
Network Analyzer Operation
9
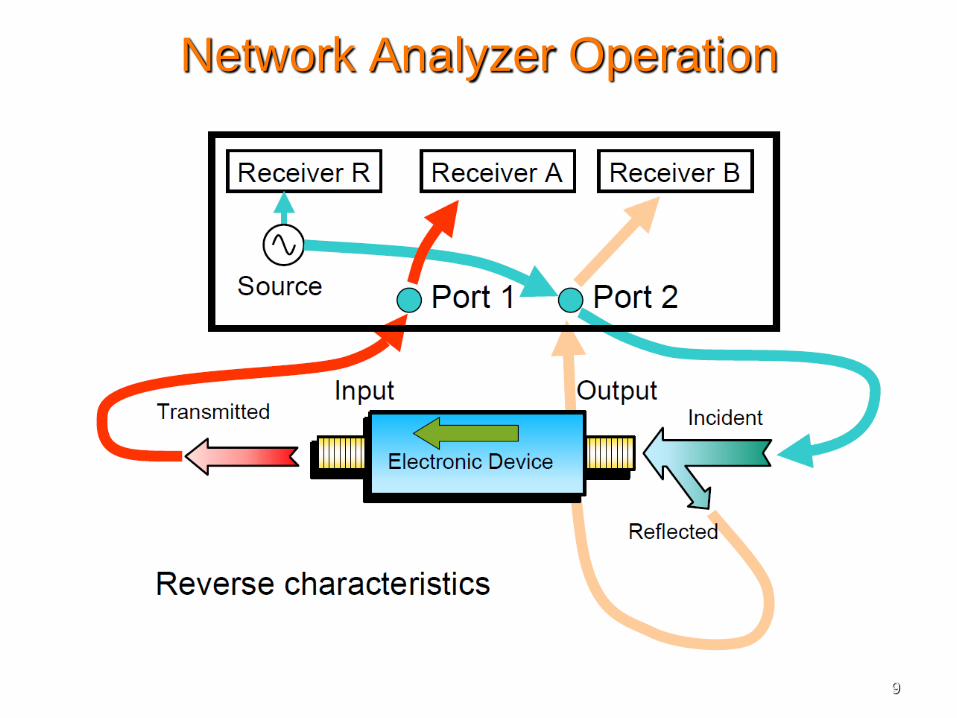
Network Analyzer Operation
10
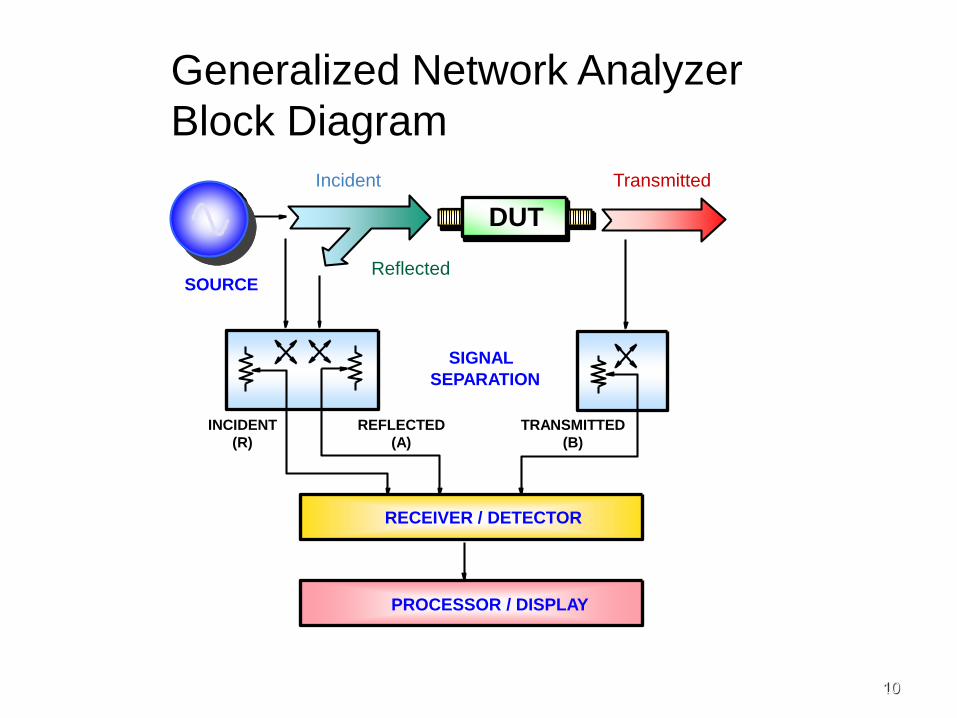
Generalized Network Analyzer
Block Diagram
RECEIVER / DETECTOR
PROCESSOR / DISPLAY
REFLECTED
(A)
TRANSMITTED
(B)
INCIDENT
(R)
SIGNAL
SEPARATION
SOURCE
Incident
Reflected
Transmitted
DUT
Copyright 2000Network Analyzer
Basics
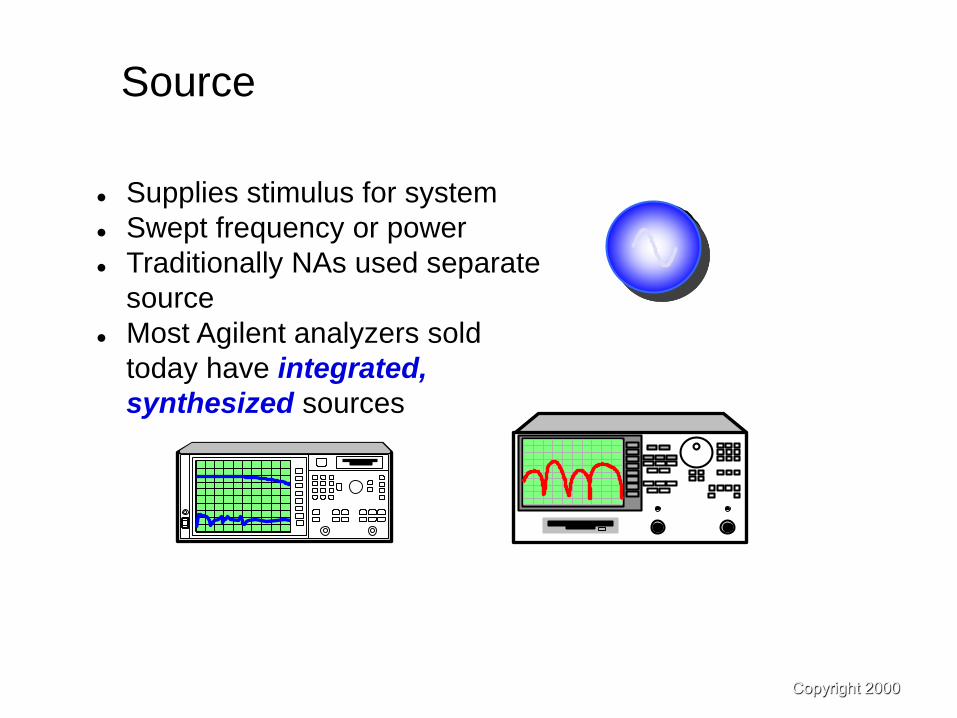
Source
Supplies stimulus for system
Swept frequency or power
Traditionally NAs used separate
source
Most Agilent analyzers sold
today have integrated,
synthesized sources
Copyright 2000Network Analyzer
Basics
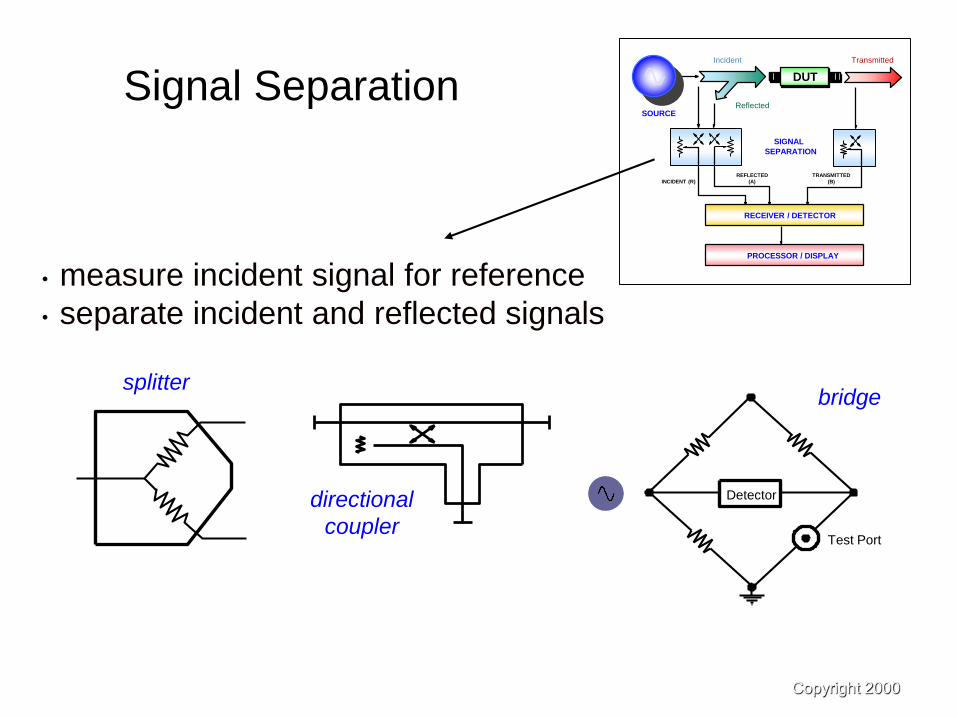
Signal Separation
Test Port
Detectordirectional
coupler
splitterbridge
• measure incident signal for reference
• separate incident and reflected signals
RECEIVER / DETECTOR
PROCESSOR / DISPLAY
REFLECTED
(A)
TRANSMITTED
(B)INCIDENT (R)
SIGNAL
SEPARATION
SOURCE
Incident
Reflected
Transmitted
DUT
Copyright 2000Network Analyzer
Basics
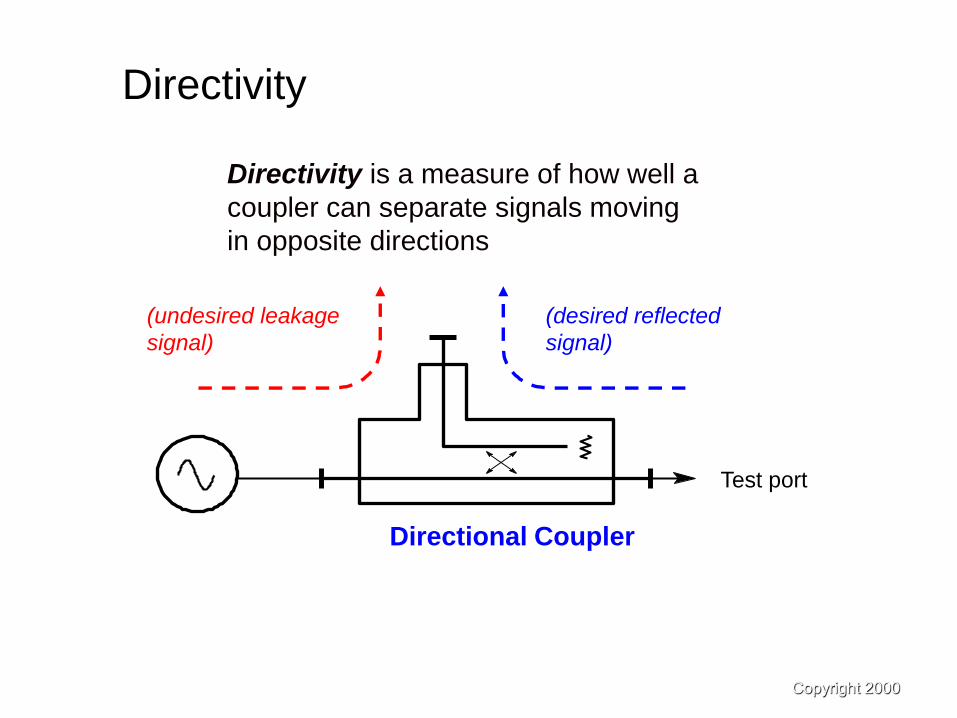
Directivity
Directivity is a measure of how well a
coupler can separate signals moving
in opposite directions
Test port
(undesired leakage
signal)
(desired reflected
signal)
Directional Coupler
Copyright 2000Network Analyzer
Basics
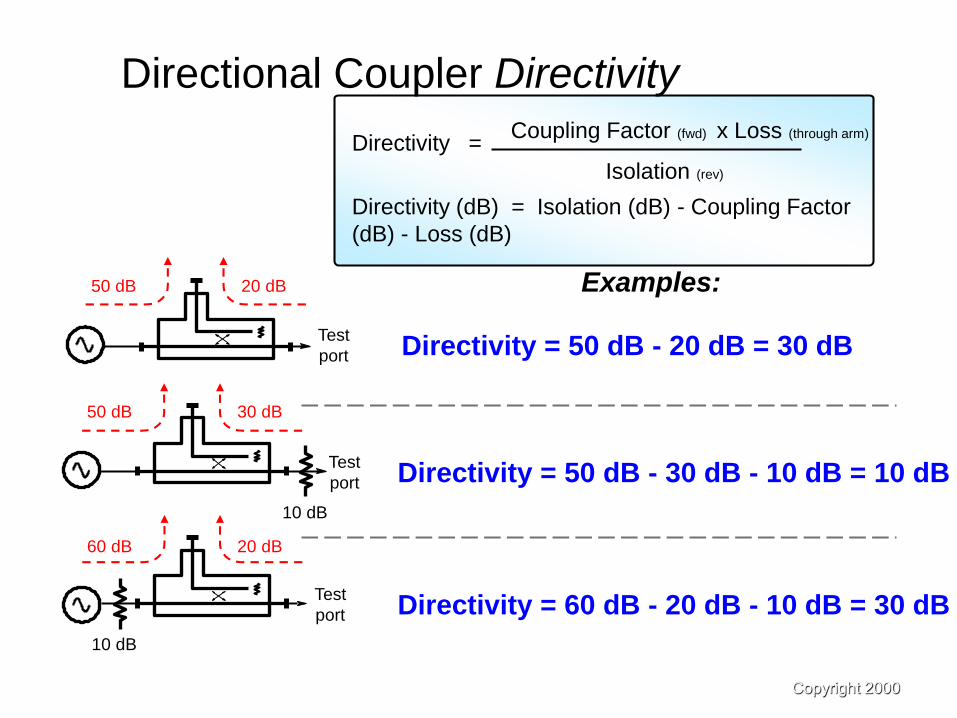
Directivity =Coupling Factor (fwd) x Loss (through arm)
Isolation (rev)
Directivity (dB) = Isolation (dB) - Coupling Factor
(dB) - Loss (dB)
Directional Coupler Directivity
Directivity = 50 dB - 30 dB - 10 dB = 10 dB
Directivity = 60 dB - 20 dB - 10 dB = 30 dB
10 dB
30 dB50 dB
10 dB
20 dB60 dB
Directivity = 50 dB - 20 dB = 30 dB
20 dB50 dB
Test
port
Examples:
Test
port
Test
port
Copyright 2000Network Analyzer
Basics
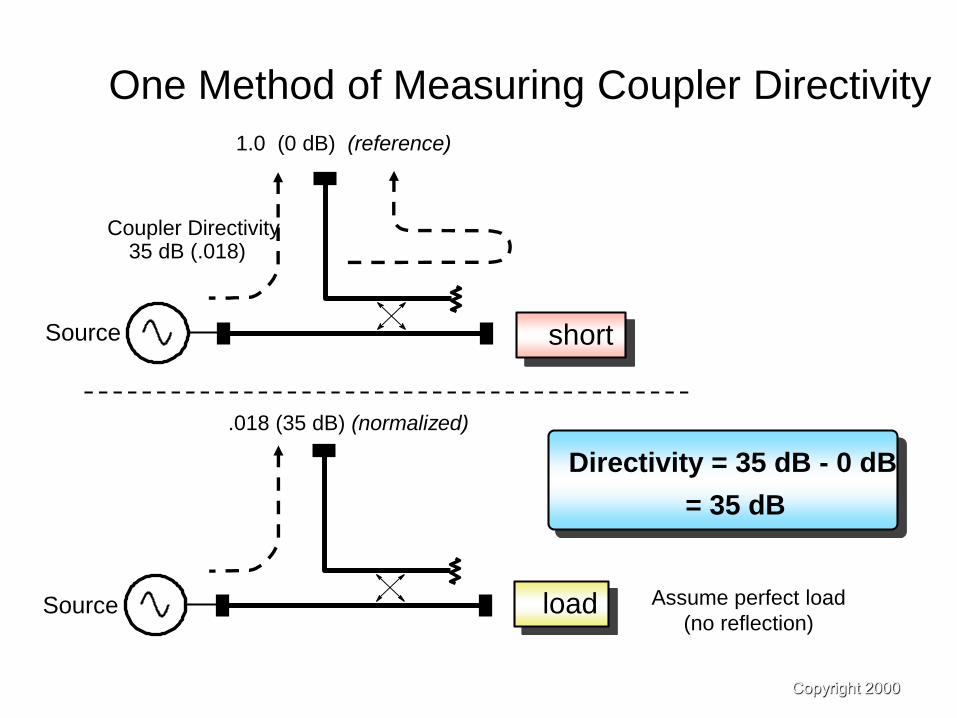
One Method of Measuring Coupler Directivity
Assume perfect load
(no reflection)
short
1.0 (0 dB) (reference)
Coupler Directivity35 dB (.018)
Source
load
.018 (35 dB) (normalized)
Source
Directivity = 35 dB - 0 dB
= 35 dB
Copyright 2000Network Analyzer
Basics
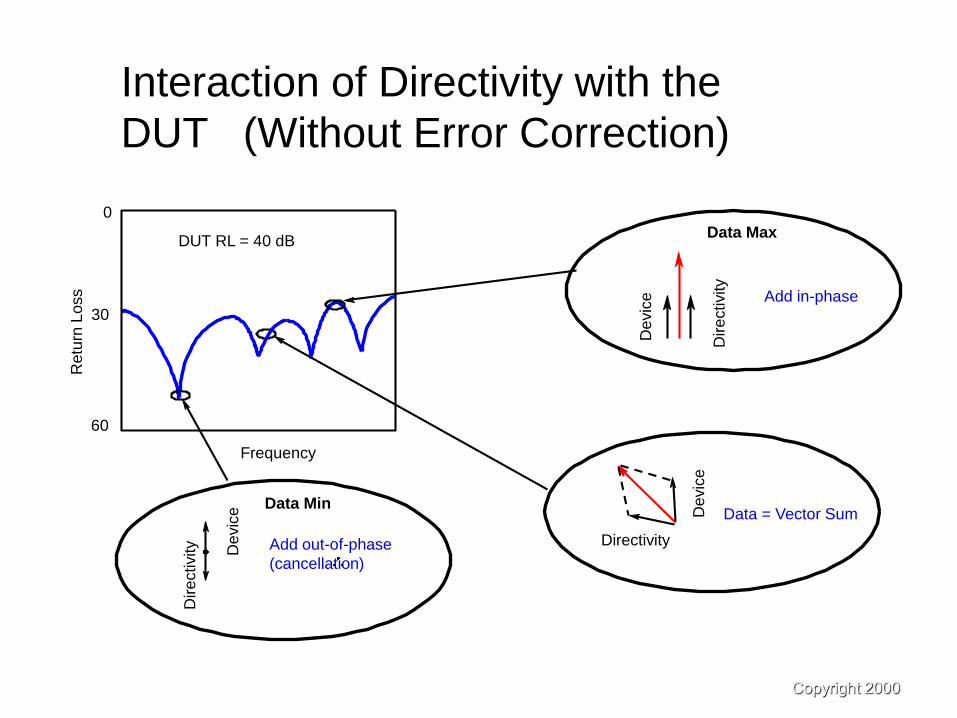
Interaction of Directivity with the
DUT (Without Error Correction)
Data Max
Add in-phase
De
vic
e
Dire
ctivity
Retu
rn L
oss
Frequency
0
30
60
DUT RL = 40 dB
Add out-of-phase
(cancellation)
Devic
e
Directivity
Data = Vector Sum
Dire
ctivity Devic
e Data Min
Copyright 2000Network Analyzer
Basics
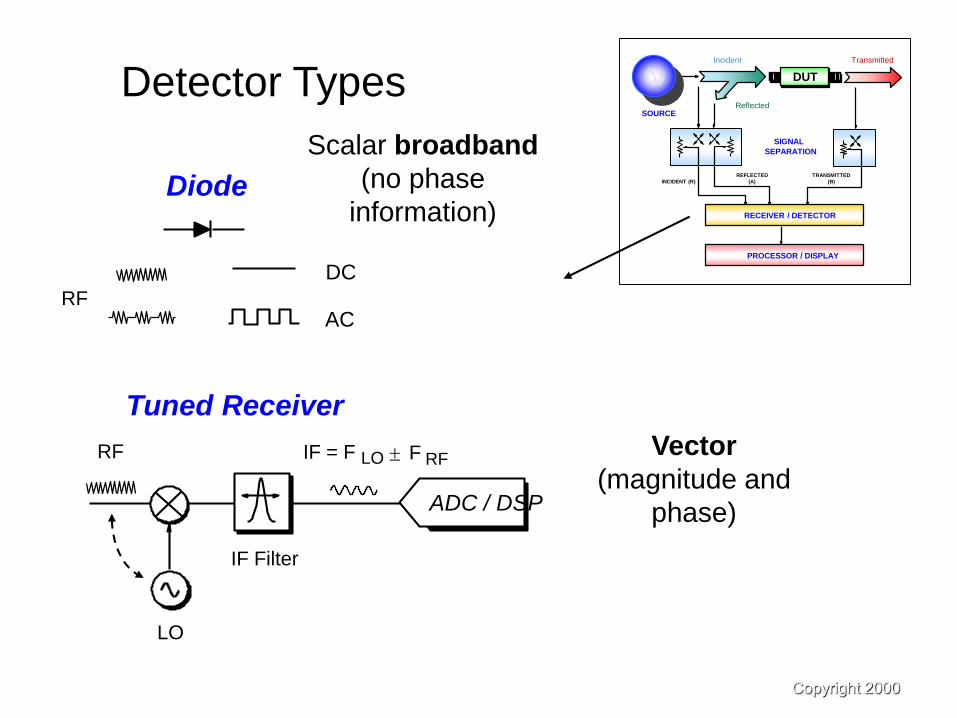
Detector Types
Tuned Receiver
Scalar broadband
(no phase
information)
Vector
(magnitude and
phase)
Diode
DC
ACRF
IF Filter
IF = F LO F RFRF
LO
ADC / DSP
RECEIVER / DETECTOR
PROCESSOR / DISPLAY
REFLECTED
(A)
TRANSMITTED
(B)INCIDENT (R)
SIGNAL
SEPARATION
SOURCE
Incident
Reflected
Transmitted
DUT
Copyright 2000Network Analyzer
Basics
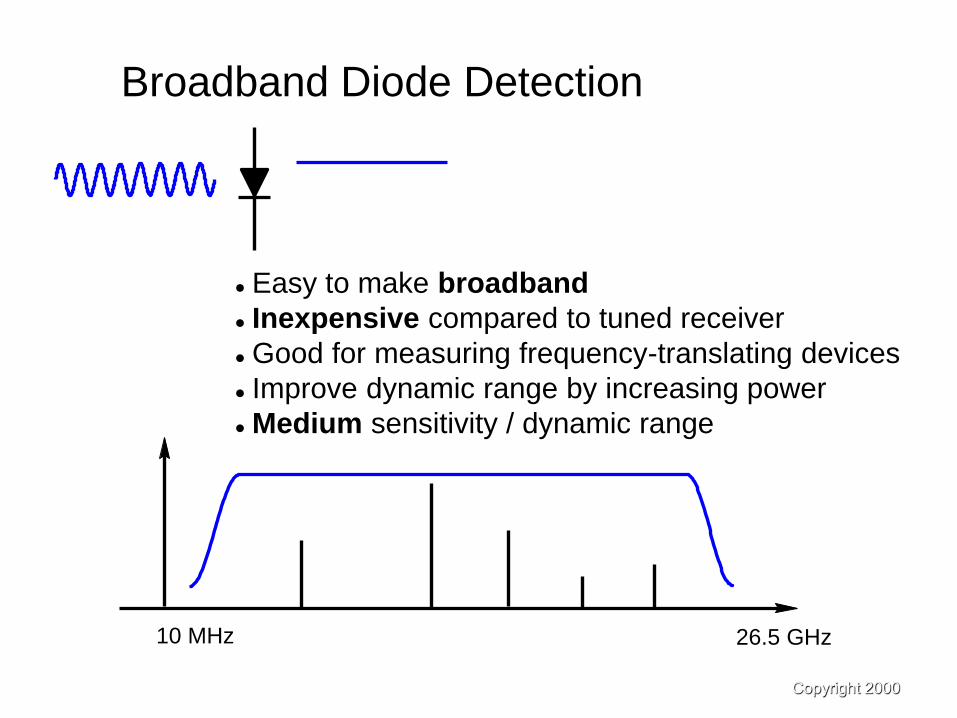
Broadband Diode Detection
Easy to make broadband
Inexpensive compared to tuned receiver
Good for measuring frequency-translating devices
Improve dynamic range by increasing power
Medium sensitivity / dynamic range
10 MHz 26.5 GHz
Copyright 2000Network Analyzer
Basics
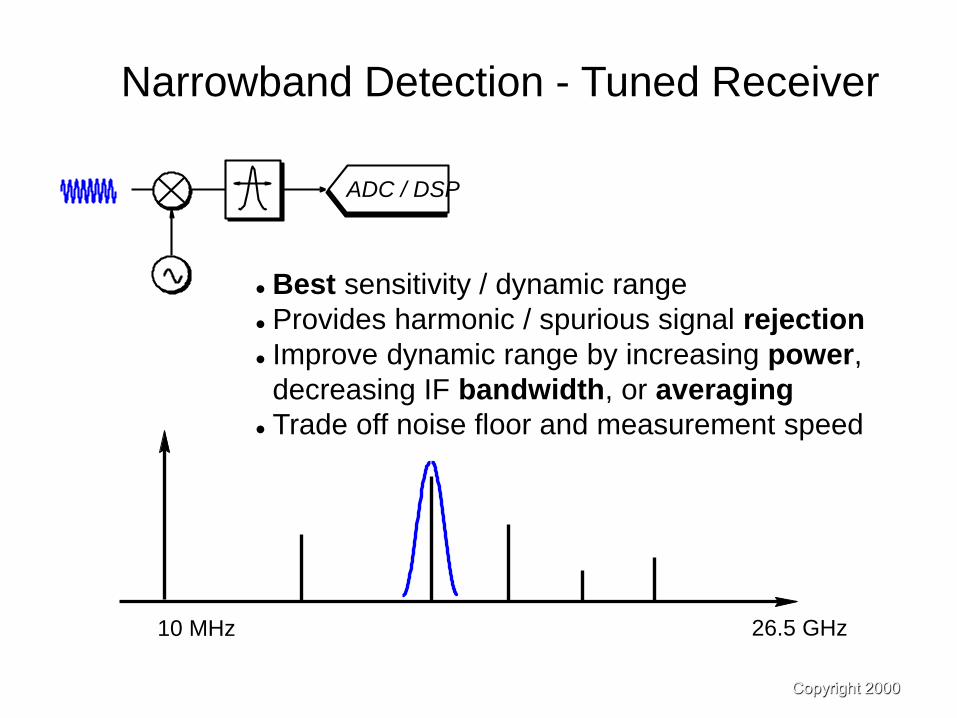
Narrowband Detection - Tuned Receiver
Best sensitivity / dynamic range
Provides harmonic / spurious signal rejection
Improve dynamic range by increasing power,
decreasing IF bandwidth, or averaging
Trade off noise floor and measurement speed
10 MHz 26.5 GHz
ADC / DSP
Network Analyzer BasicsCopyright 2000
RECEIVER / DETECTOR
PROCESSOR / DISPLAY
REFLECTED
(A)
TRANSMITTED
(B)INCIDENT (R)
SIGNAL
SEPARATION
SOURCE
Incident
Reflected
Transmitted
DUT
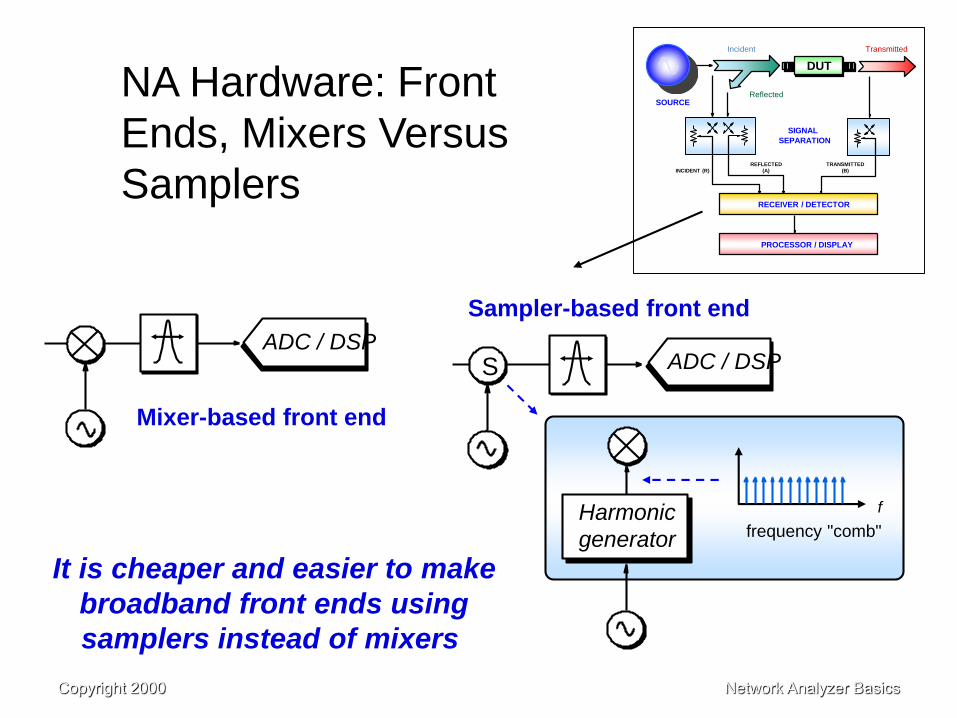
NA Hardware: Front
Ends, Mixers Versus
Samplers
It is cheaper and easier to make
broadband front ends using
samplers instead of mixers
Mixer-based front end
ADC / DSP
Sampler-based front end
S
Harmonic
generator
f
frequency "comb"
ADC / DSP
Copyright 2000Network Analyzer
Basics
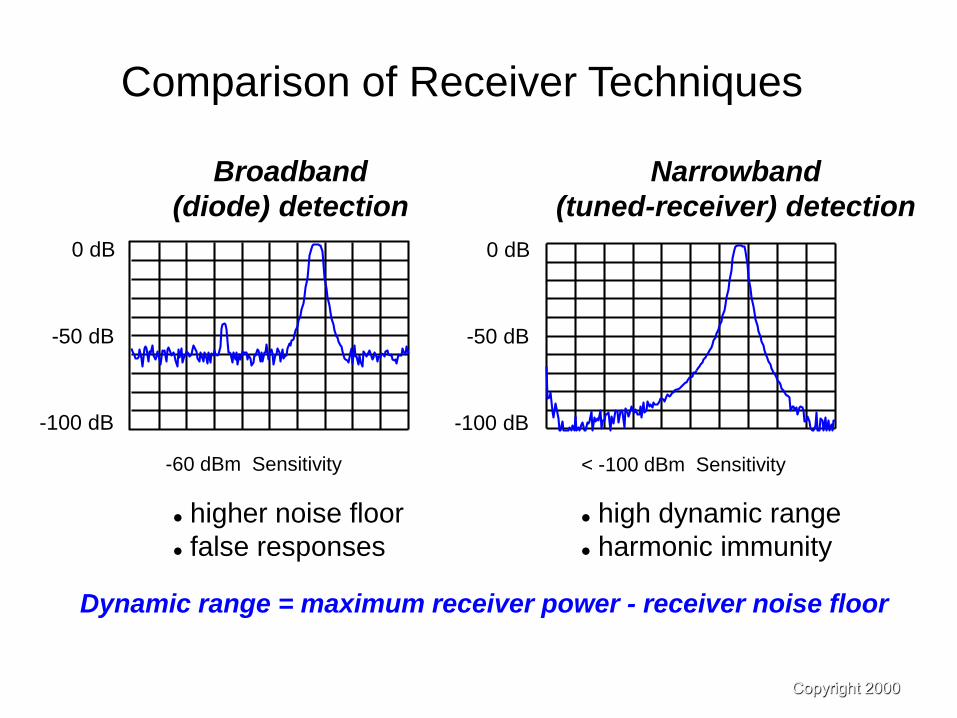
Comparison of Receiver Techniques
< -100 dBm Sensitivity
0 dB
-50 dB
-100 dB
0 dB
-50 dB
-100 dB
-60 dBm Sensitivity
Broadband
(diode) detection
Narrowband
(tuned-receiver) detection
higher noise floor
false responses
high dynamic range
harmonic immunity
Dynamic range = maximum receiver power - receiver noise floor
Copyright 2000Network Analyzer
Basics
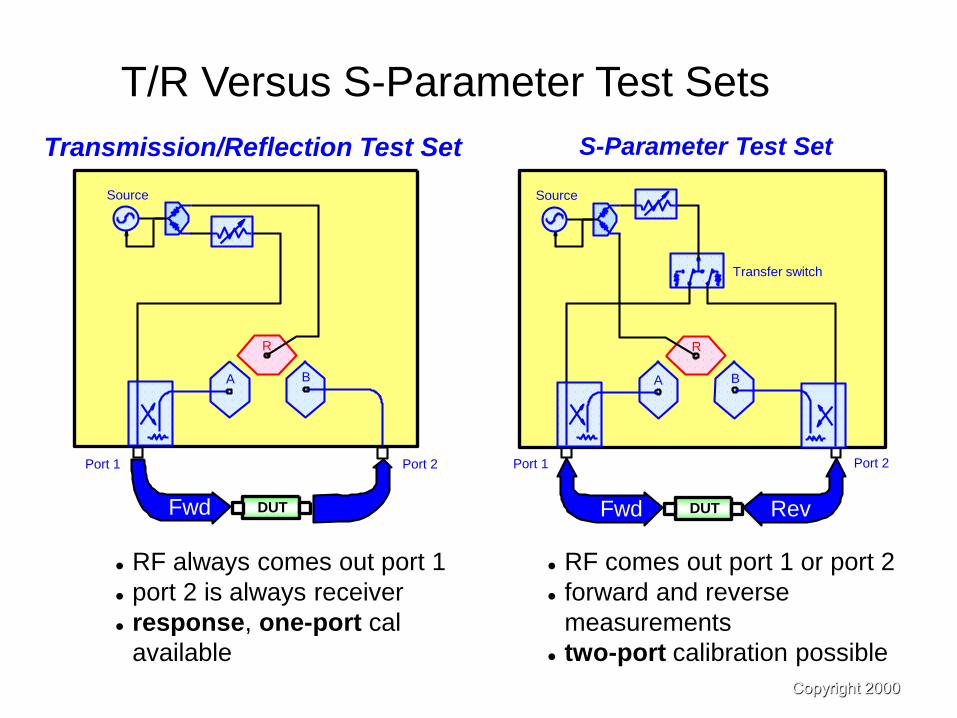
T/R Versus S-Parameter Test Sets
RF always comes out port 1
port 2 is always receiver
response, one-port cal
available
RF comes out port 1 or port 2
forward and reverse
measurements
two-port calibration possible
Transmission/Reflection Test Set
Port 1 Port 2
Source
B
R
A
DUTFwd
Port 1 Port 2
Transfer switch
Source
B
R
A
S-Parameter Test Set
DUTFwd Rev
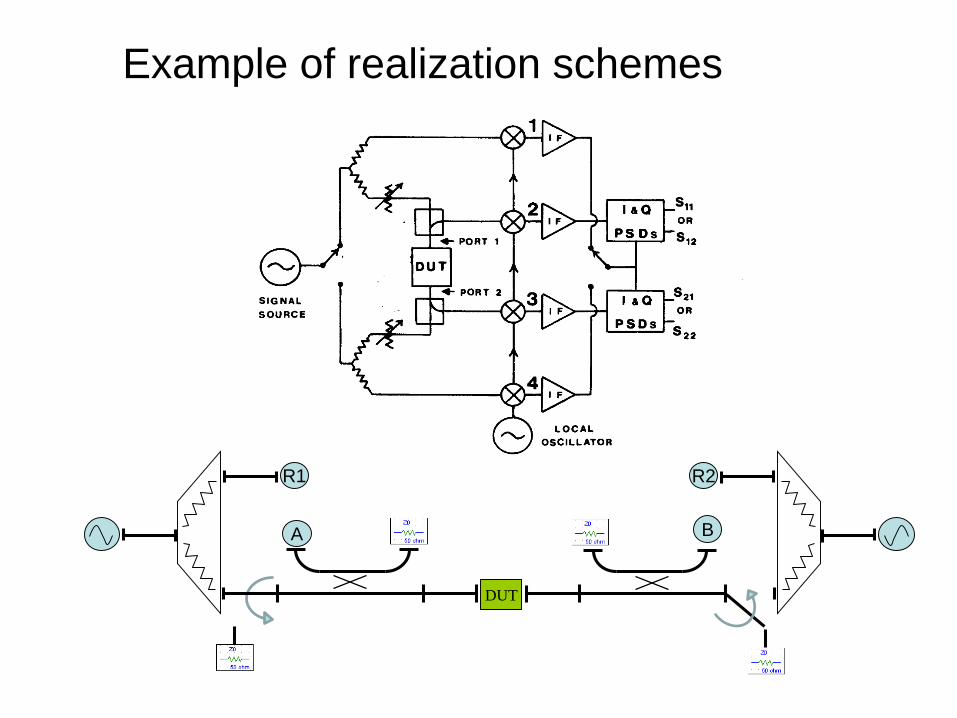
Example of realization schemes
B
DUT
A
R1 R2
Copyright 2000Network Analyzer
Basics
RECEIVER / DETECTOR
PROCESSOR / DISPLAY
REFLECTED
(A)
TRANSMITTED
(B)
INCIDENT
(R)
SIGNALSEPARATION
SOURCE
Incident
Reflected
Transmitted
DUT
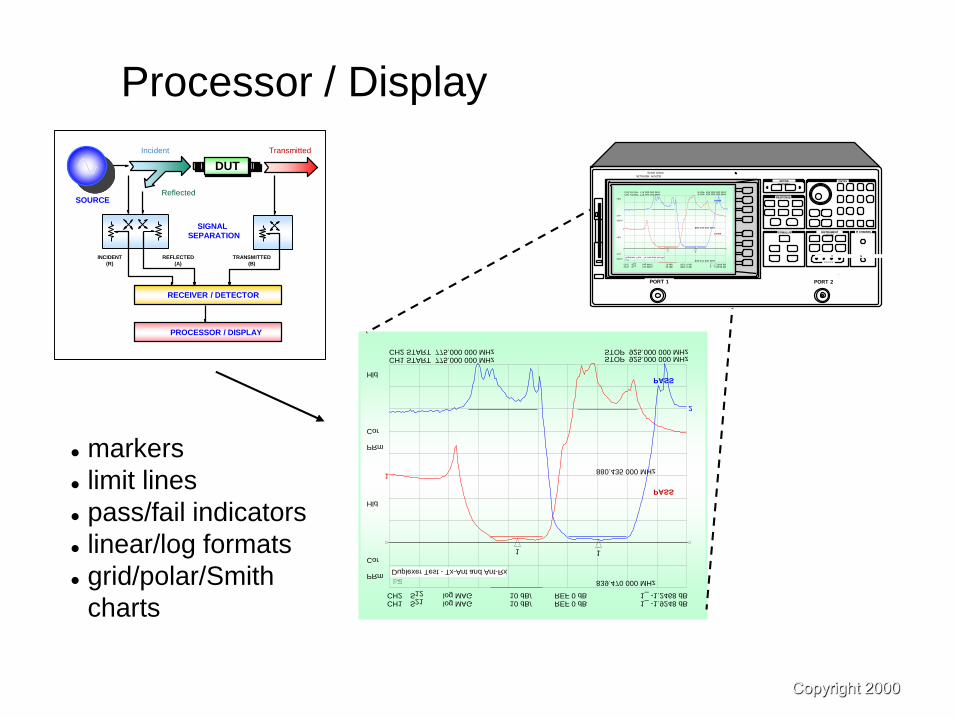
Processor / Display
CH1 S21 log MAG 10 dB/ REF 0 dB
CH1 START 775.000 000 MHz STOP 925.000 000 MHz
Cor
Hld
PRm
CH2 S12 log MAG REF 0 dB10 dB/
CH2 START 775.000 000 MHz STOP 925.000 000 MHz
Duplexer Test - Tx-Ant and Ant-Rx
Cor
Hld
PRm
1
1
1_ -1.9248 dB
839.470 000 MHz
PASS
2
1
1_ -1.2468 dB
880.435 000 MHz
PASS
markers
limit lines
pass/fail indicators
linear/log formats
grid/polar/Smith
charts
ACTIVE
CHANNEL
RESPONSE
STIMULUS
ENTRY
INSTRUMENT
STATE
R CHANNEL
R LT S
HP-IB STATUS
NETWORK ANYZER
50 MH-20GHz
PORT 2PORT 1
CH1 S21 log MAG 10 dB/ REF 0 dB
CH1 START 775.000 000 MHz STOP 925.000 000 MHz
Cor
Hld
PRm
CH2 S12 log MAG REF 0 dB10 dB/
CH2 START 775.000 000 MHz STOP 925.000 000 MHz
Duplexer Test - Tx-Ant and Ant-Rx
Cor
Hld
PRm
1
1
1_ -1.9248 dB
839.470 000 MHz
PASS
2
1
1_ -1.2468 dB
880.435 000 MHz
PASS
Network Analyzer BasicsCopyright 2000
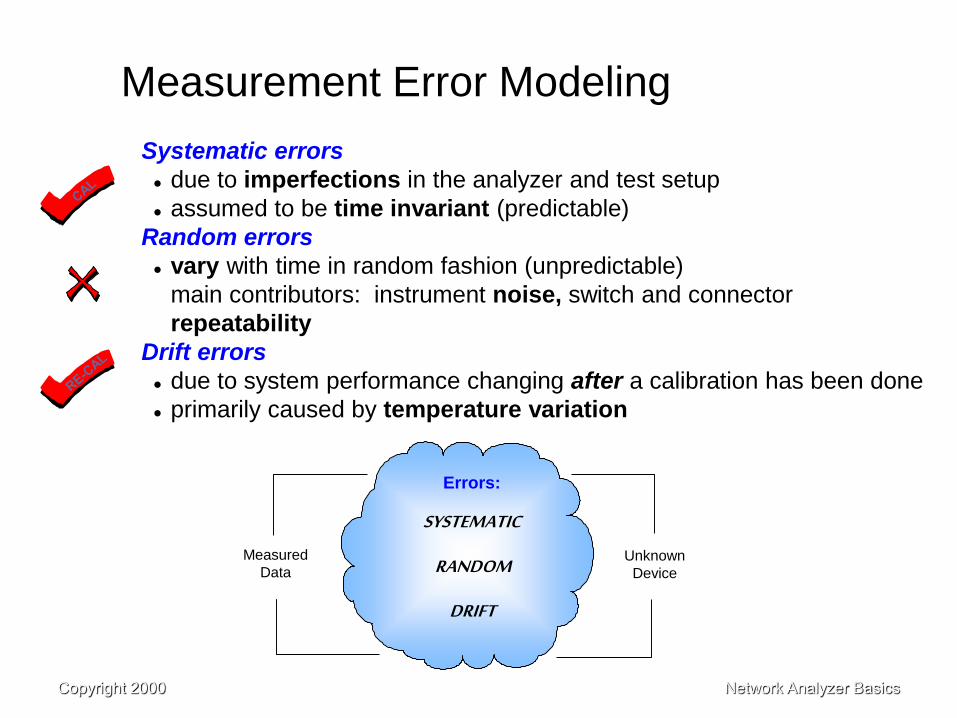
Systematic errors
due to imperfections in the analyzer and test setup
assumed to be time invariant (predictable)
Random errors
vary with time in random fashion (unpredictable)
main contributors: instrument noise, switch and connector
repeatability
Drift errors
due to system performance changing after a calibration has been done
primarily caused by temperature variation
Measurement Error Modeling
Measured
DataUnknown
Device
SYSTEMATIC
RANDOM
DRIFT
Errors:
Network Analyzer BasicsCopyright 2000
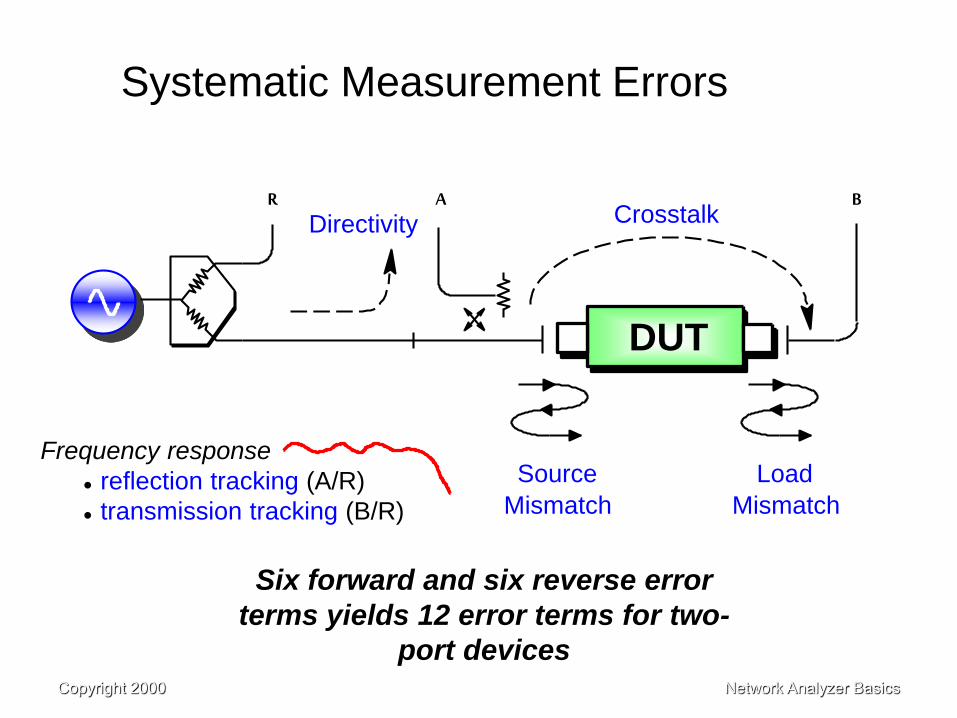
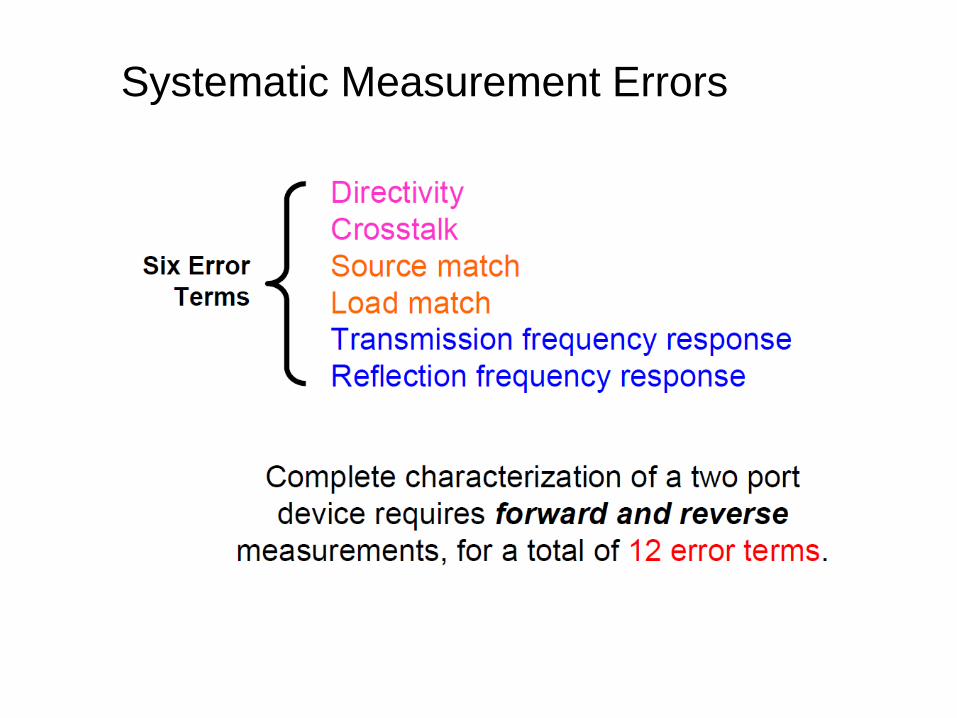
Systematic Measurement Errors
A B
Source
Mismatch
Load
Mismatch
CrosstalkDirectivity
DUT
Frequency response
reflection tracking (A/R)
transmission tracking (B/R)
R
Six forward and six reverse error
terms yields 12 error terms for two-
port devices
Network Analyzer BasicsCopyright 2000
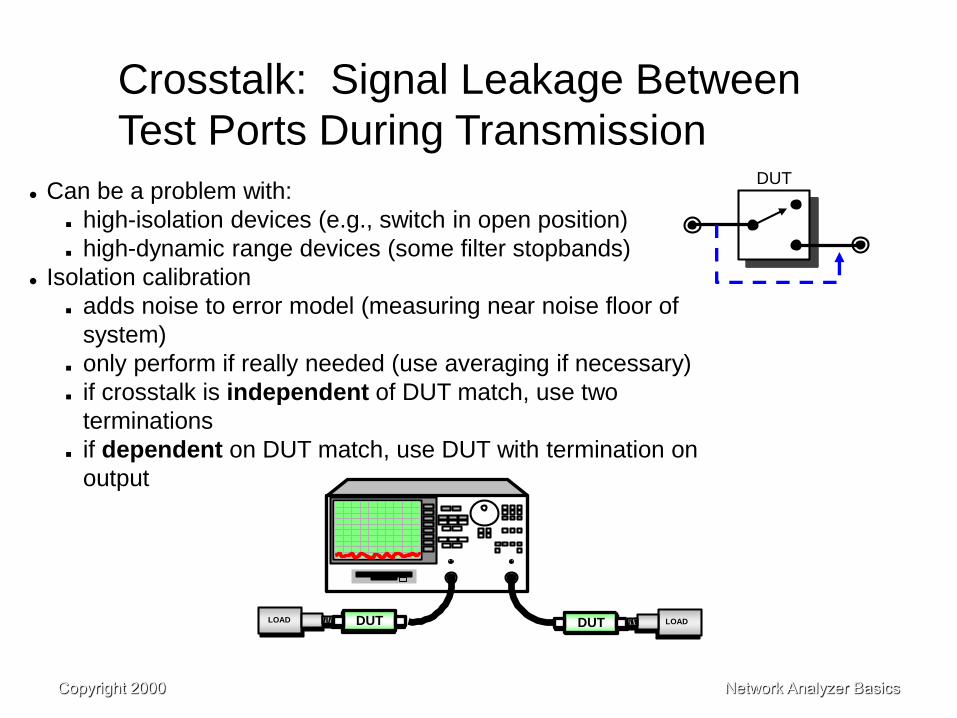
Crosstalk: Signal Leakage Between
Test Ports During Transmission
Can be a problem with:
high-isolation devices (e.g., switch in open position)
high-dynamic range devices (some filter stopbands)
Isolation calibration
adds noise to error model (measuring near noise floor of
system)
only perform if really needed (use averaging if necessary)
if crosstalk is independent of DUT match, use two
terminations
if dependent on DUT match, use DUT with termination on
output
DUT
DUT LOADDUTLOAD
Systematic Measurement Errors
Error Correction
Network Analyzer BasicsCopyright 2000
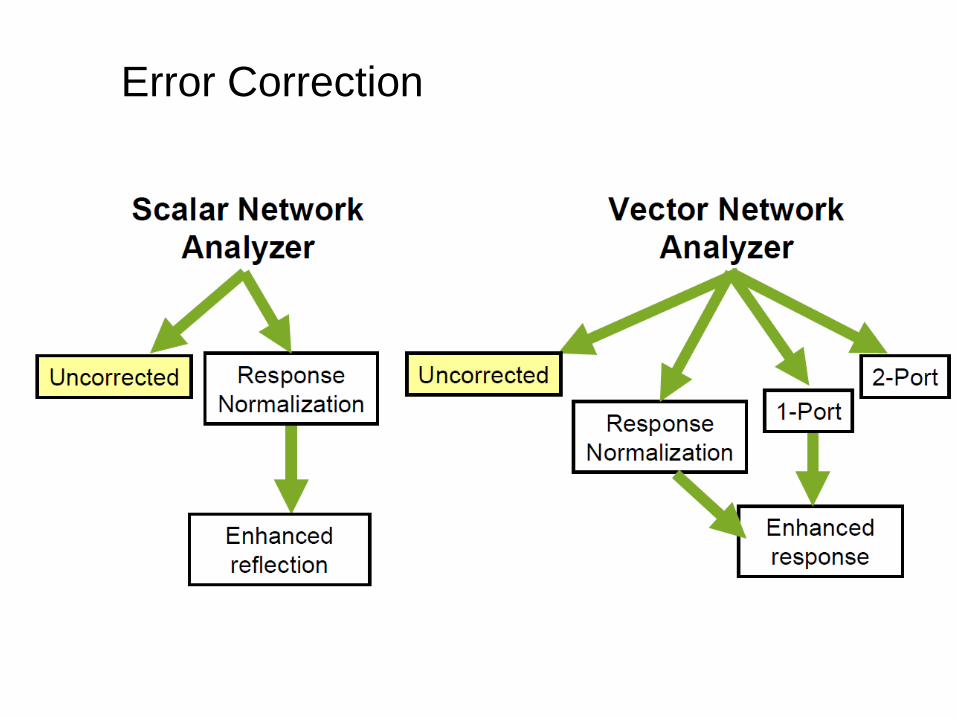
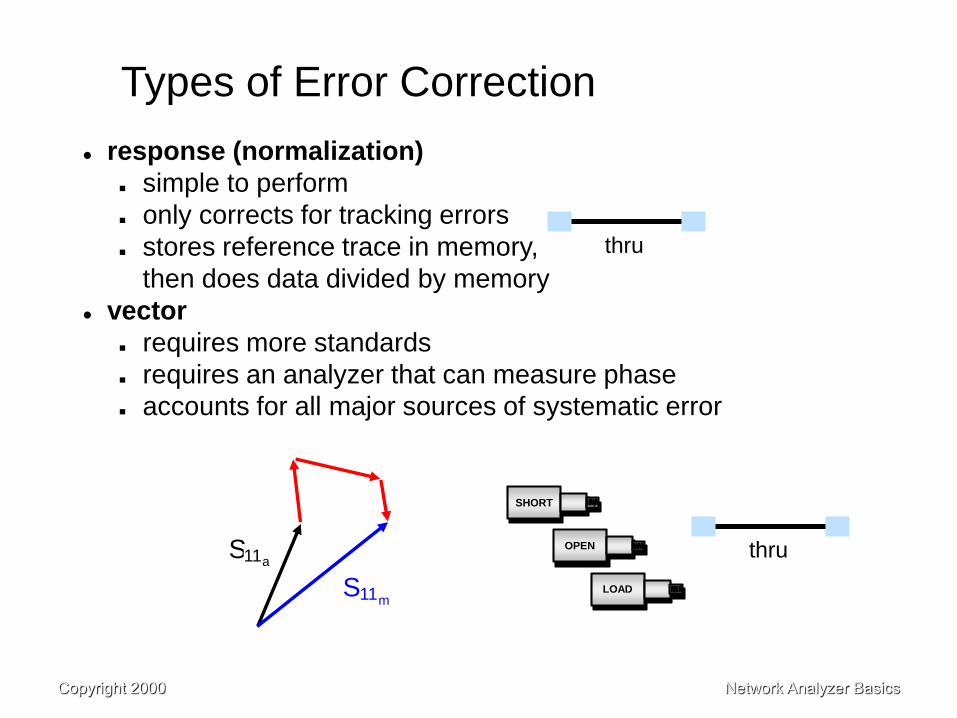
Types of Error Correction
response (normalization)
simple to perform
only corrects for tracking errors
stores reference trace in memory,
then does data divided by memory
vector
requires more standards
requires an analyzer that can measure phase
accounts for all major sources of systematic error
S11m
S11a
SHORT
OPEN
LOAD
thru
thru
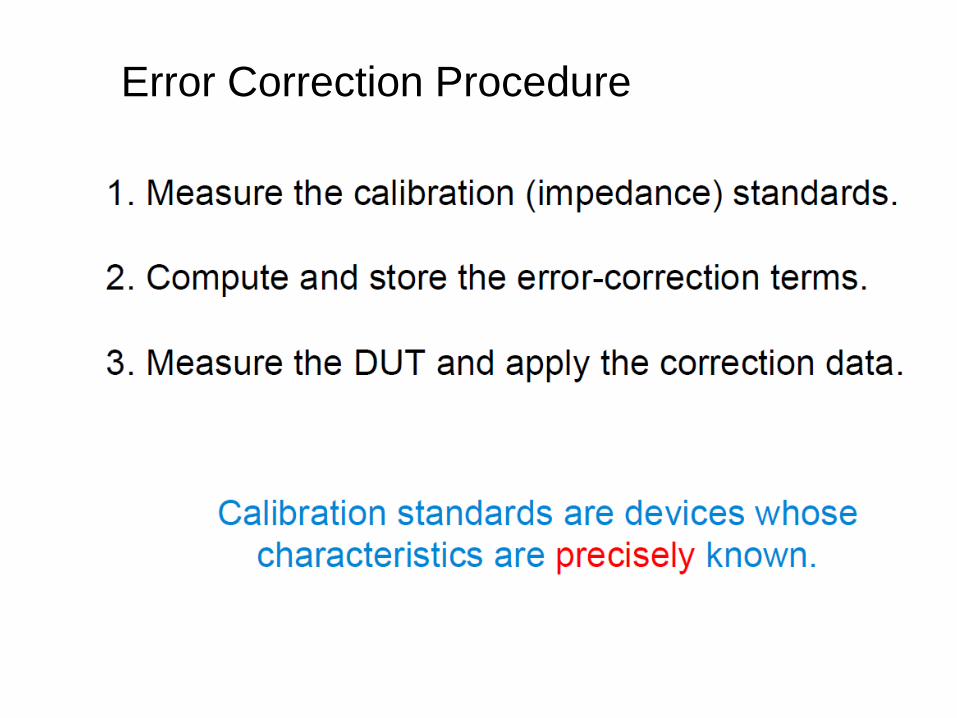
Error Correction Procedure
Network Analyzer BasicsCopyright 2000
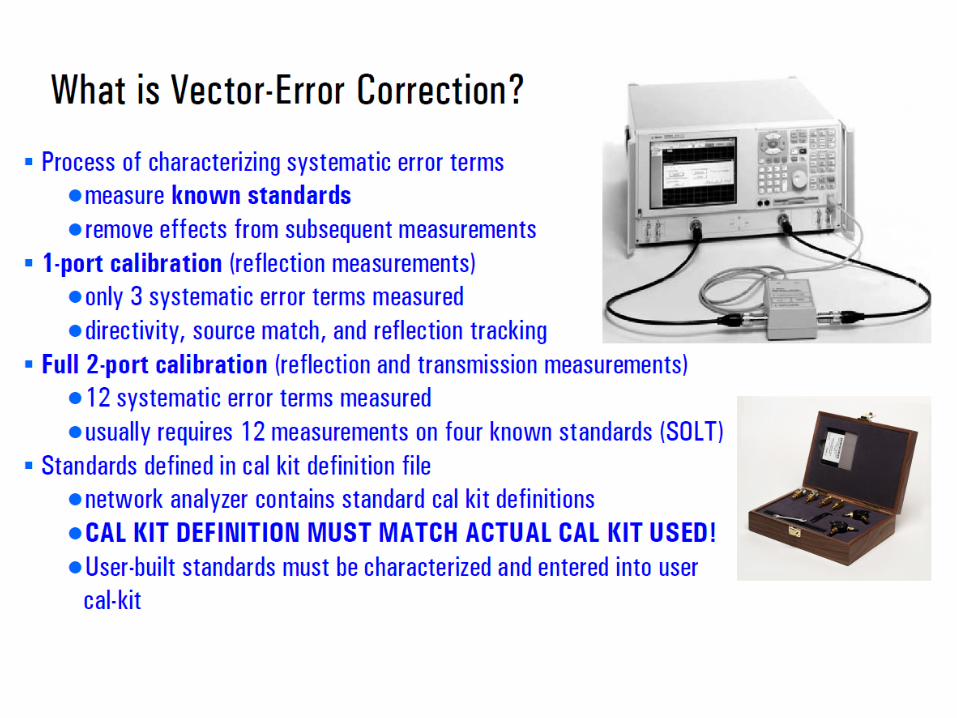
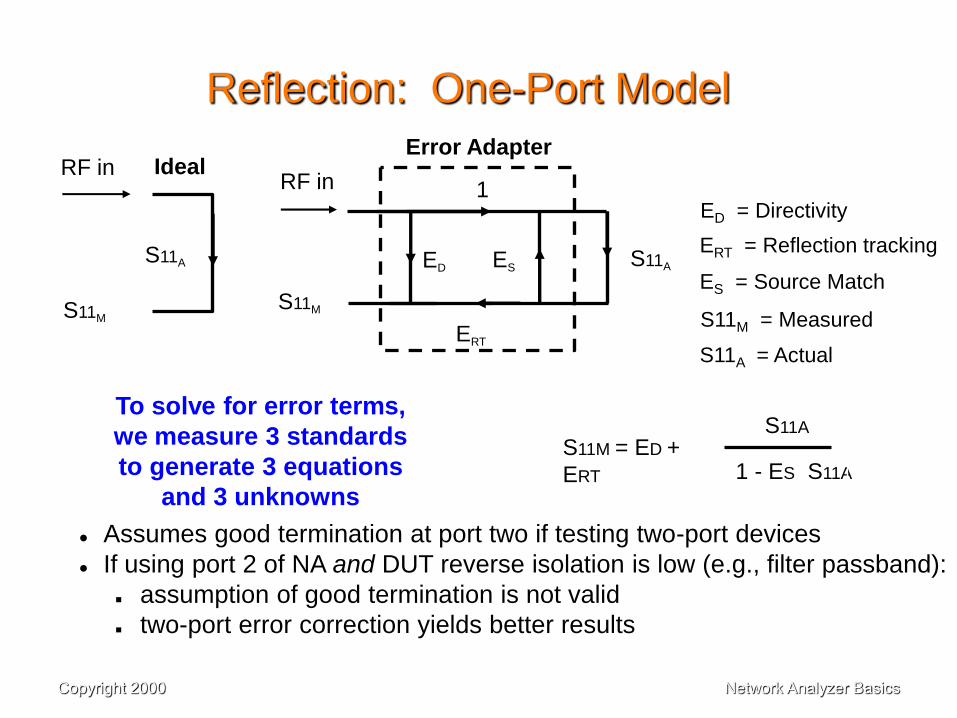
Reflection: One-Port Model
ED = Directivity
ERT = Reflection tracking
ES = Source Match
S11M = Measured
S11A = Actual
To solve for error terms,
we measure 3 standards
to generate 3 equations
and 3 unknowns
S11M
S11AES
ERT
ED
1RF in
Error Adapter
S11M
S11A
RF in Ideal
Assumes good termination at port two if testing two-port devices
If using port 2 of NA and DUT reverse isolation is low (e.g., filter passband):
assumption of good termination is not valid
two-port error correction yields better results
S11M = ED +
ERT 1 - ES S11A
S11A
Network Analyzer BasicsCopyright 2000
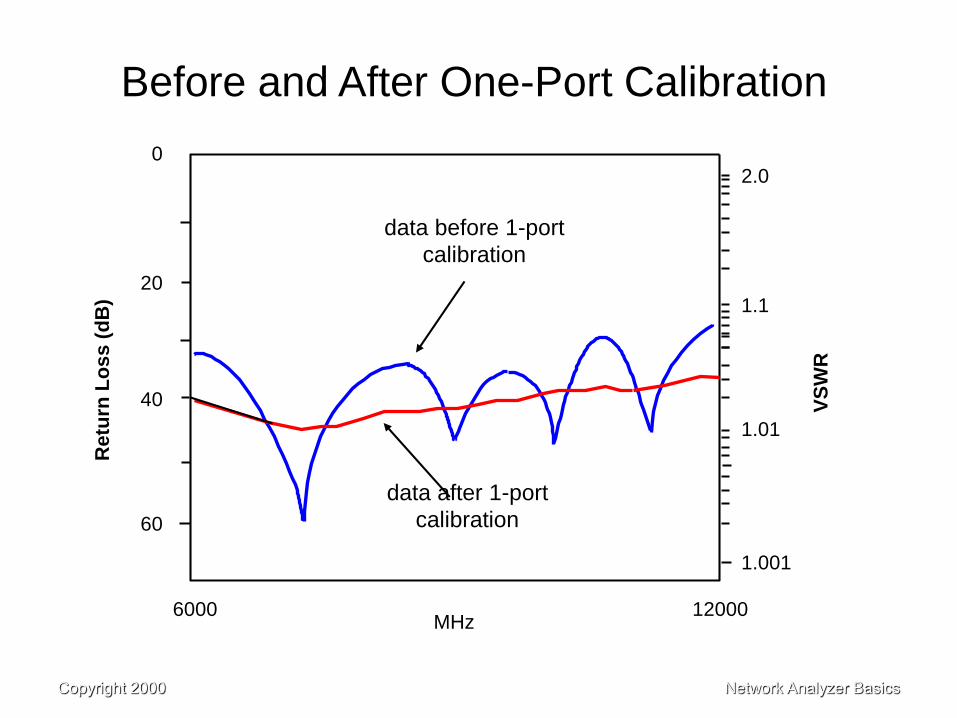
Before and After One-Port Calibration
data before 1-port
calibration
data after 1-port
calibration
0
20
40
60
6000 12000
2.0
Retu
rn L
os
s (
dB
)
VS
WR
1.1
1.01
1.001
MHz
Network Analyzer BasicsCopyright 2000
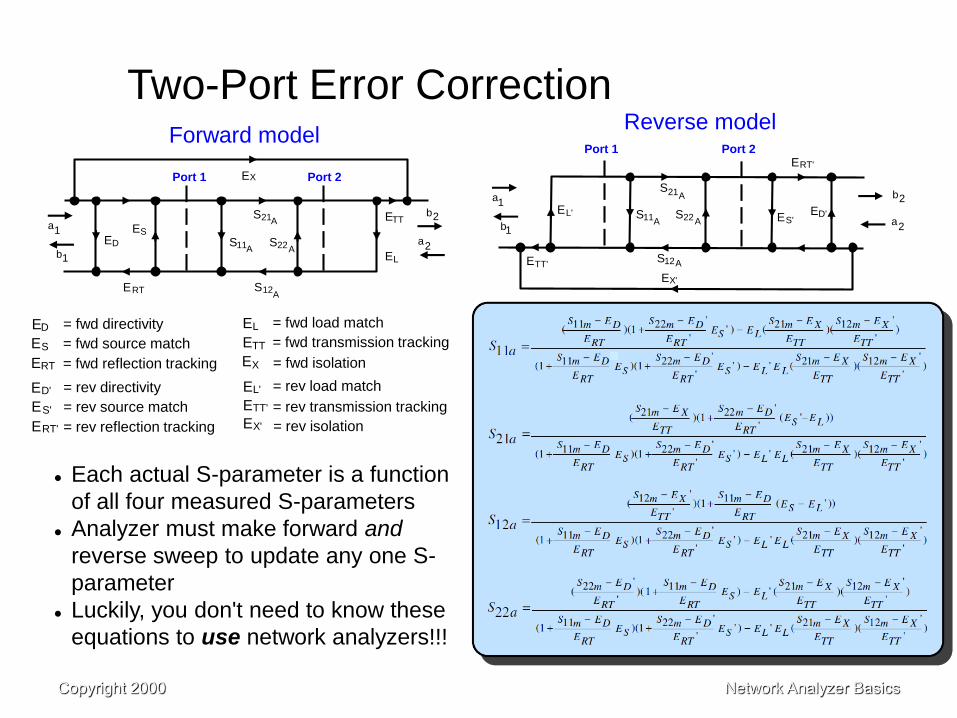
Two-Port Error Correction
Each actual S-parameter is a function
of all four measured S-parameters
Analyzer must make forward and
reverse sweep to update any one S-
parameter
Luckily, you don't need to know these
equations to use network analyzers!!!
Port 1 Port 2E
S11
S21
S12
S22
ESED
ERT
ETT
EL
a1
b1
A
A
A
A
X
a2
b2
Forward model
= fwd directivity
= fwd source match
= fwd reflection tracking
= fwd load match
= fwd transmission tracking
= fwd isolation
ES
ED
ERT
ETT
EL
EX
= rev reflection tracking
= rev transmission tracking
= rev directivity
= rev source match
= rev load match
= rev isolation
ES'
ED'
ERT'
ETT'
EL'
EX'
Port 1 Port 2
S11
S
S12
S22 ES'ED'
ERT'
ETT'
EL'
a1
b1A
A
A
EX'
21A
a2
b2
Reverse model
Network Analyzer BasicsCopyright 2000
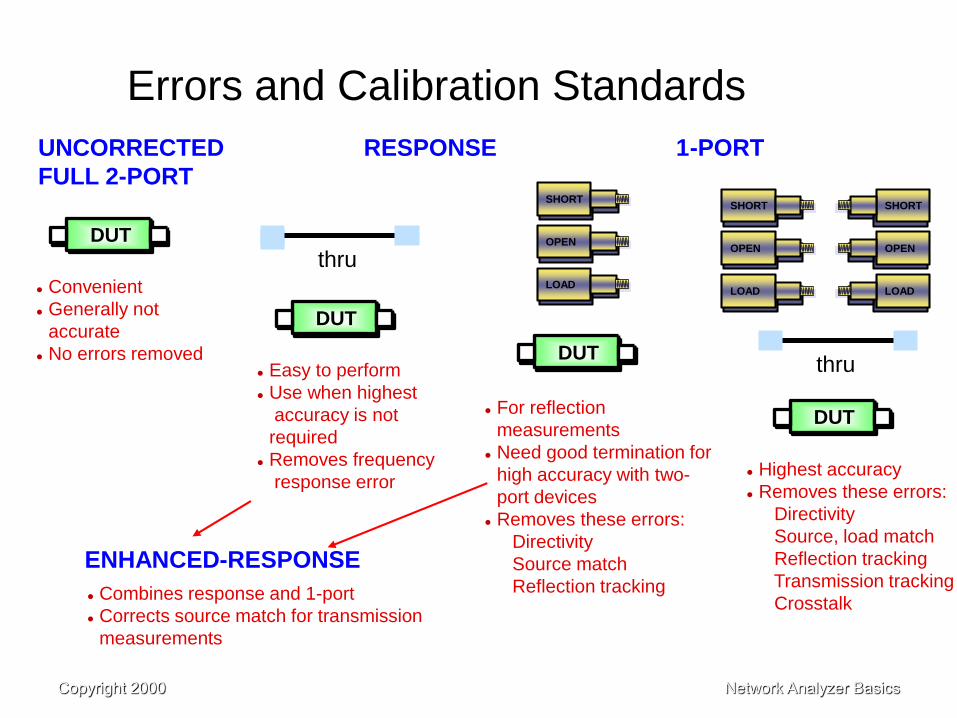
Errors and Calibration Standards
Convenient
Generally not
accurate
No errors removed Easy to perform
Use when highest
accuracy is not
required
Removes frequency
response error
For reflection
measurements
Need good termination for
high accuracy with two-
port devices
Removes these errors:
Directivity
Source match
Reflection tracking
Highest accuracy
Removes these errors:
Directivity
Source, load match
Reflection tracking
Transmission tracking
Crosstalk
UNCORRECTED RESPONSE 1-PORT
FULL 2-PORT
DUT
DUT
DUT
DUT
thru
thru
ENHANCED-RESPONSE
Combines response and 1-port
Corrects source match for transmission
measurements
SHORT
OPEN
LOAD
SHORT
OPEN
LOAD
SHORT
OPEN
LOAD
Network Analyzer BasicsCopyright 2000
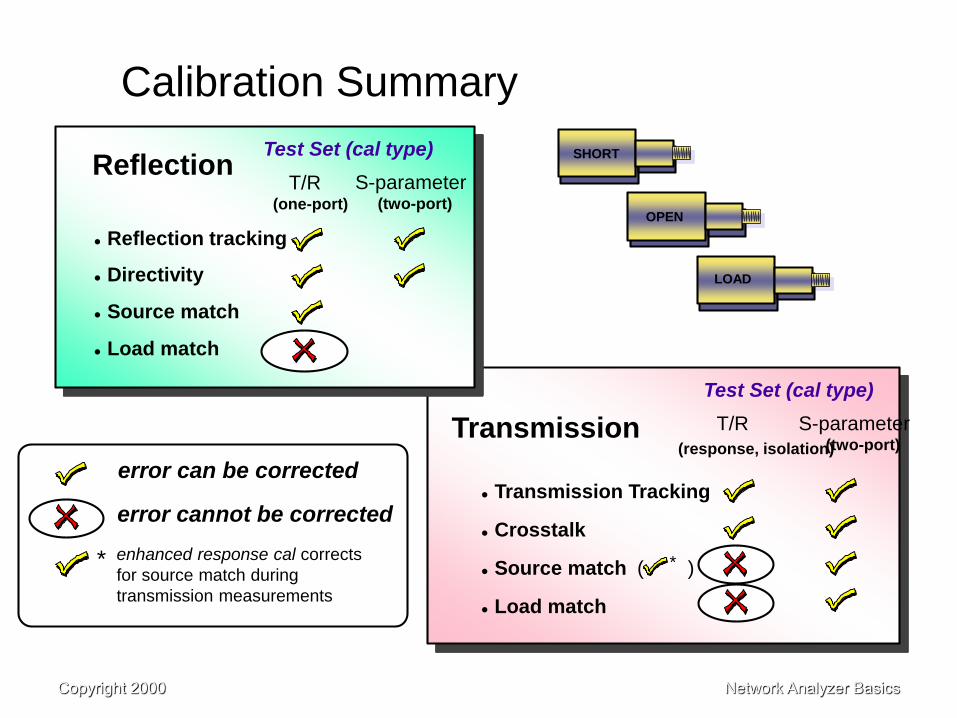
Transmission Tracking
Crosstalk
Source match
Load match
S-parameter(two-port)
T/R
(response, isolation)Transmission
Test Set (cal type)
*( )
Calibration Summary
Reflection tracking
Directivity
Source match
Load match
S-parameter(two-port)
T/R(one-port)
ReflectionTest Set (cal type)
error cannot be corrected
* enhanced response cal corrects
for source match during
transmission measurements
error can be corrected
SHORT
OPEN
LOAD
Network Analyzer BasicsCopyright 2000
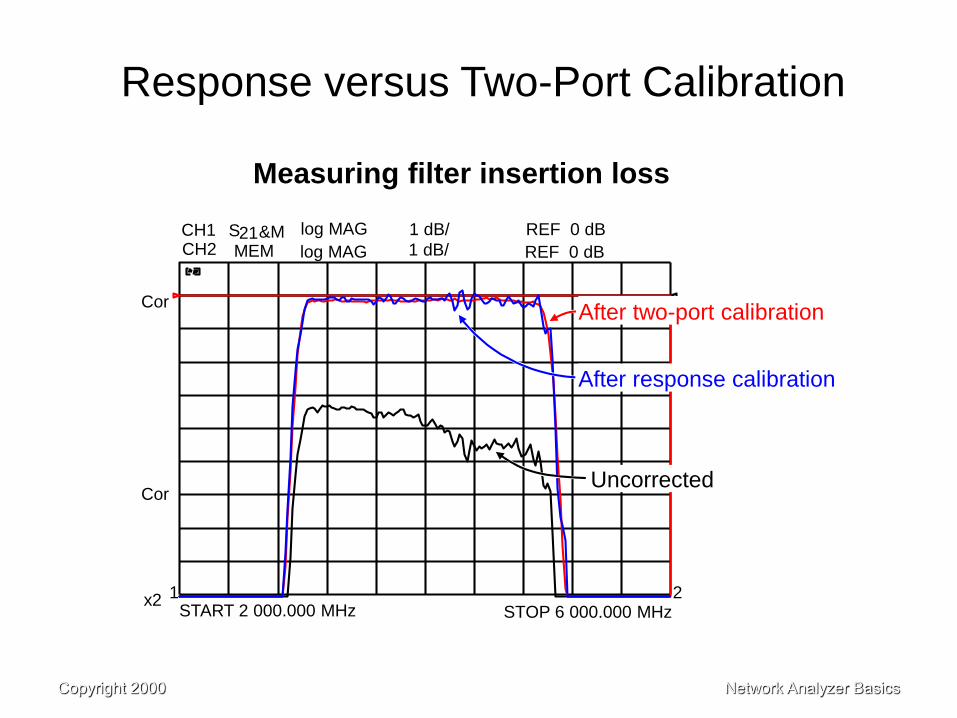
Response versus Two-Port Calibration
CH1 S21&M log MAG 1 dB/ REF 0 dB
Cor
CH2 MEM log MAG REF 0 dB1 dB/
CorUncorrected
After two-port calibration
START 2 000.000 MHz STOP 6 000.000 MHzx2 1 2
After response calibration
Measuring filter insertion loss
39
Network Analyzer BasicsCopyright 2000
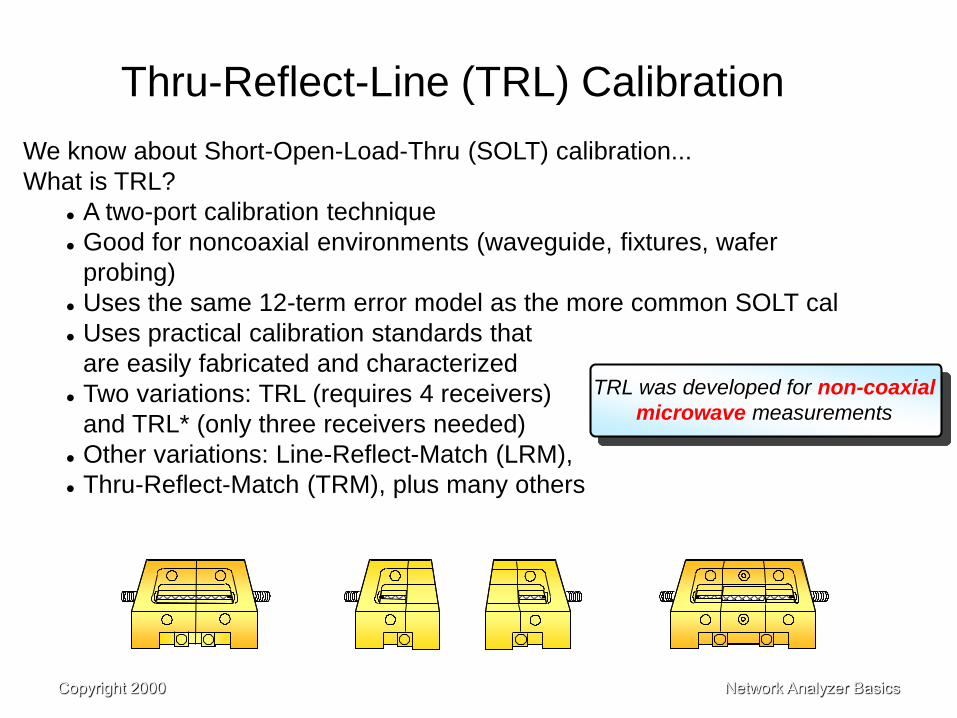
Thru-Reflect-Line (TRL) Calibration
We know about Short-Open-Load-Thru (SOLT) calibration...
What is TRL?
A two-port calibration technique
Good for noncoaxial environments (waveguide, fixtures, wafer
probing)
Uses the same 12-term error model as the more common SOLT cal
Uses practical calibration standards that
are easily fabricated and characterized
Two variations: TRL (requires 4 receivers)
and TRL* (only three receivers needed)
Other variations: Line-Reflect-Match (LRM),
Thru-Reflect-Match (TRM), plus many others
TRL was developed for non-coaxial
microwave measurements
Network Analyzer BasicsCopyright 2000
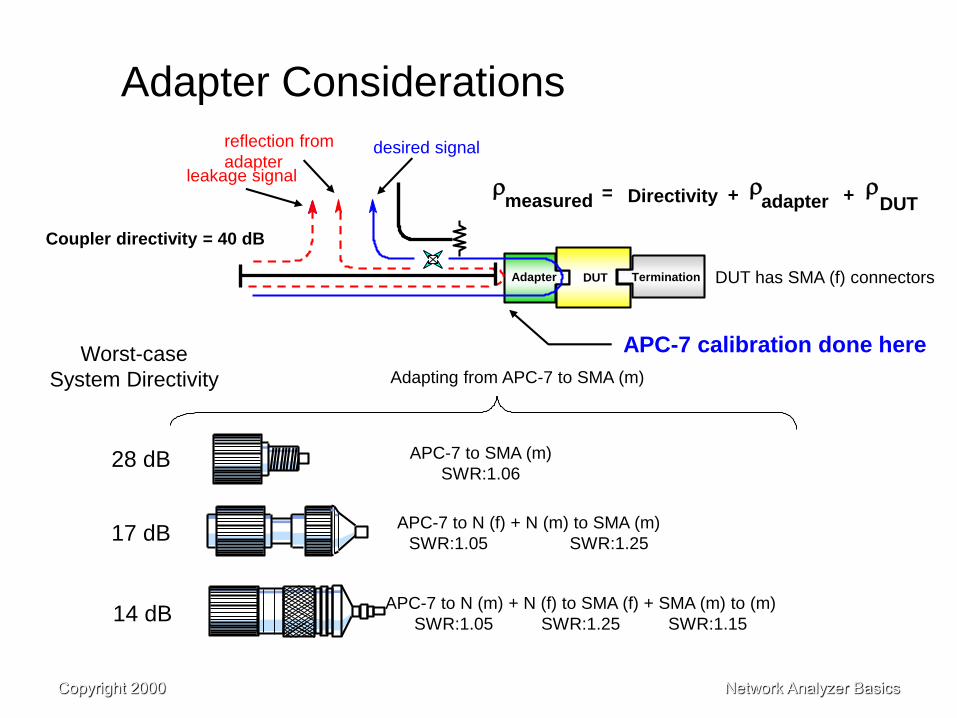
Adapter Considerations
TerminationAdapter DUT
Coupler directivity = 40 dB
leakage signal
desired signalreflection from
adapter
APC-7 calibration done here
DUT has SMA (f) connectors
= measured r +adapter
rDUTrDirectivity +
Worst-case
System Directivity
28 dB
17 dB
14 dB
APC-7 to SMA (m)
SWR:1.06
APC-7 to N (f) + N (m) to SMA (m)
SWR:1.05 SWR:1.25
APC-7 to N (m) + N (f) to SMA (f) + SMA (m) to (m)
SWR:1.05 SWR:1.25 SWR:1.15
Adapting from APC-7 to SMA (m)
42