Project Management with PERT & CPM Lecture 1
21
CE 4101 Project Planning and Construction Management Credit 3.0 Md Khalekuzzaman BSc(Civil Eng.), MASc(Env.Eng.), P.Eng. (Canada), FIEB Assistant Professor Department of Civil Engineering
Transcript of Project Management with PERT & CPM Lecture 1

CE 4101
Project Planning and Construction Management
Credit 3.0
Md KhalekuzzamanBSc(Civil Eng.), MASc(Env.Eng.), P.Eng. (Canada), FIEB
Assistant Professor
Department of Civil Engineering

PERT –Program Evaluation And Review Technique
CPM –Critical Path Method
2CE4101
3CE 4101
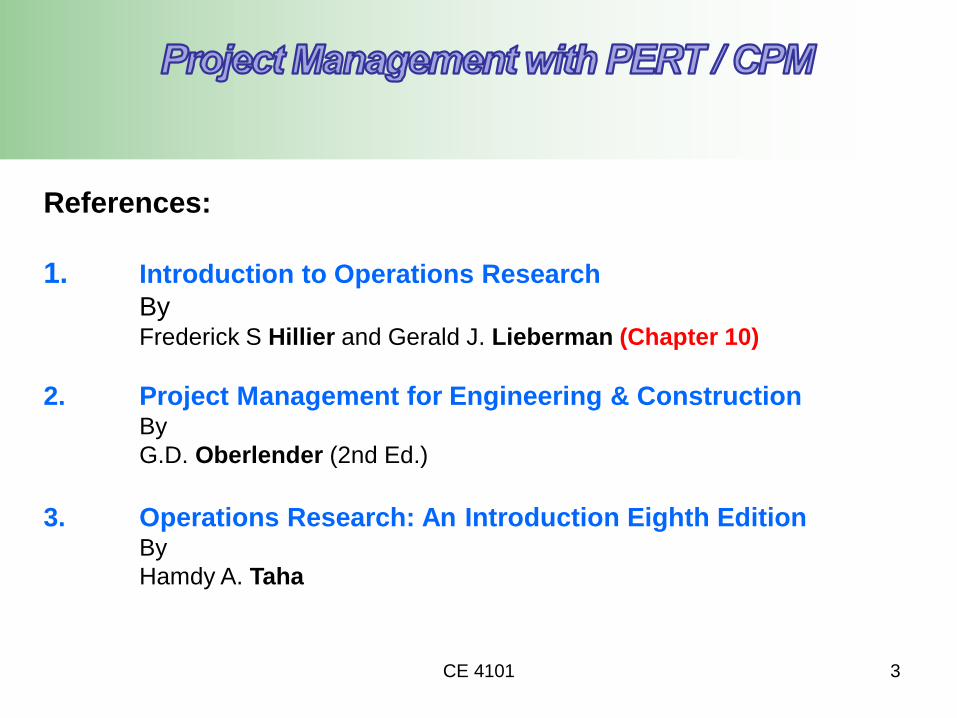
References:
1. Introduction to Operations Research
By Frederick S Hillier and Gerald J. Lieberman (Chapter 10)
2. Project Management for Engineering & Construction By
G.D. Oberlender (2nd Ed.)
3. Operations Research: An Introduction Eighth EditionBy
Hamdy A. Taha

4CE 4101
Definition:
• Activity
• Network
• Duration
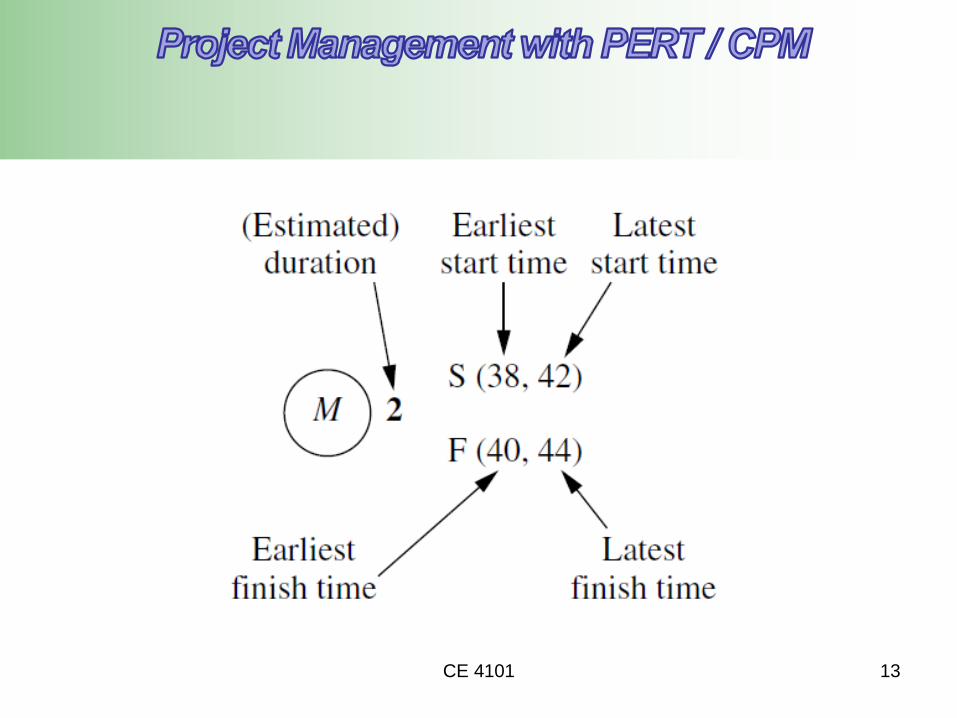
• Early Start (ES)
• Early Finish (EF): ES+D
• Late Finish (LF):
• Late Start (LS): LF- D
• Total Float (TF): LE- EF = LS – ES
• Free Float (FF) : FFi = ESj – EFi
• Critical Path: TF & FF = 0
• Dummy Activity
Page 145 of G.D. Oberlender (2nd Ed)
“PM for Engineering & Construction”

5CE 4101
Definition:
• Activity on Node (AON): is a project network, where each activity is
represented by a node.
• Activity on Arc (AOA): is a project network, where each activity is
represented by an arc.

6CE 4101
Example – The Reliable Construction CO. Project
(10.1 from Hillier & Lieberman):
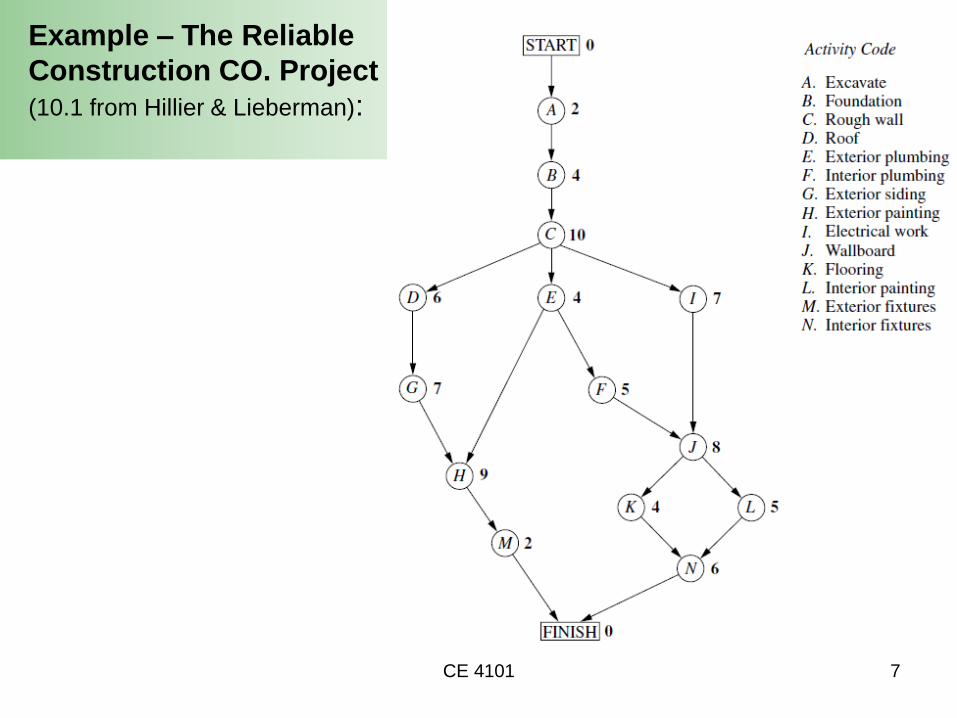
7CE 4101
Example – The Reliable
Construction CO. Project
(10.1 from Hillier & Lieberman):

8CE 4101
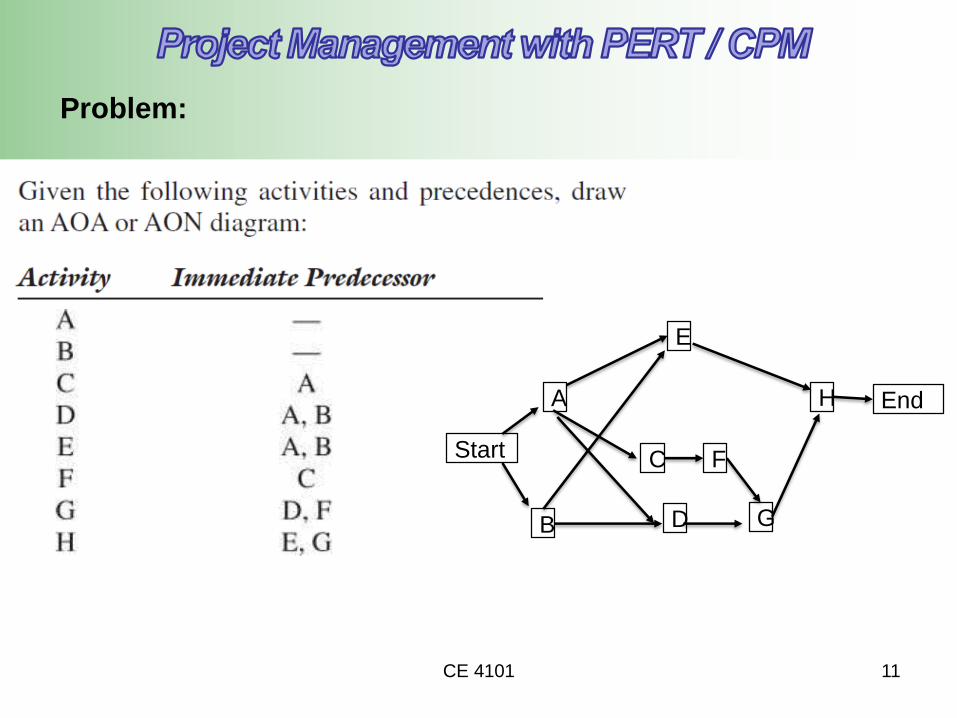
Problem:

9CE 4101
Problem:
Start End
1
4
5
6
3
2

10CE 4101
Problem:
11CE 4101
Problem:
Start
EndA
C
D G
E
B
F
H
12CE 4101
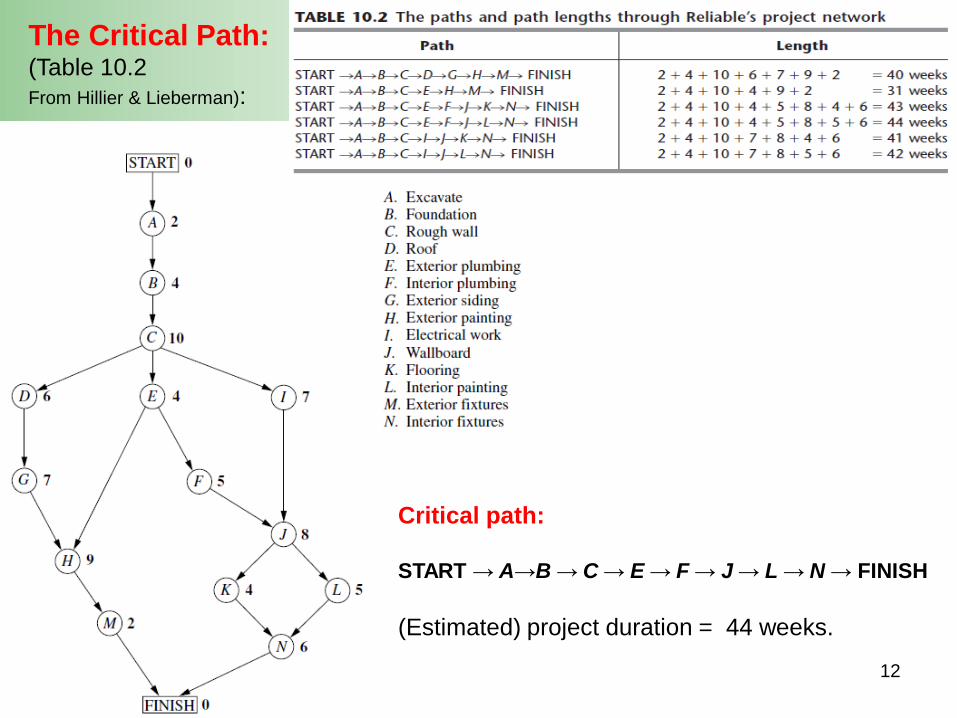
The Critical Path:(Table 10.2
From Hillier & Lieberman):
Critical path:
START → A→B → C → E → F → J → L → N → FINISH
(Estimated) project duration = 44 weeks.
13CE 4101

14CE 4101
G E
H
ES=2
EF=29
ES=16
EF=22
ES=29
64
D
E
C
LS=20
LF=26
LS=16
LF=20
LF=16
ILS=18
LF=25
7
7
4
9

15CE 4101
Example – The Reliable
Construction CO. Project
(10.7 from Hillier & Lieberman):

16CE 4101
Example 6.5-2
Pg-270/Taha
Determine the critical path for the project network. All the
durations are in days.
activity (4,6) satisfies the first two conditions for a
critical activity (∆4=□4=13 & ∆6=□6=25) but not the
third(□6-□4≠D46). Hence, the activity is noncritical.

PERT Network:
• PERT differs from CPM in that it bases the duration of an activity on three
estimates:
1. Most likely estimate (tm or m)
= estimate of the most likely value of the duration
2. Optimistic estimate (t0 or a or 0)
= estimate of the duration under the most favorable conditions.
3. Pessimistic estimate (tp or p or b)
= estimate of the duration under the most unfavorable
conditions.
CE4101 17o Optimistic Most likely Pessimistic
Figure: Time Distribution Curve

PERT Calculation Procedure:
• PERT Procedure:
1. Draw the project network.
2. Expected duration of each activity, µ or 𝑡𝑒 =𝑡𝑜+4𝑡𝑚+𝑡𝑝
6
3. Standard normal deviation, 𝑧 =𝑇𝑠−𝑇𝑒
𝜎𝑐where, 𝜎𝑐
2 =𝑡𝑝−𝑡𝑜
6
2
σc = Variance
Ts = Specified or scheduled time to complete the project
Te = Duration of the project.
CE4101 18

CE4101
19
Calculation of µp(te)
and σ2 for Critical
Path
µp(te) = 2+4+10+4+5+8+5+6=44
σ2 =1/9+1+4+4/9+1+1+1+4/9 =9
Activity on
Critical Path
CE4101 20
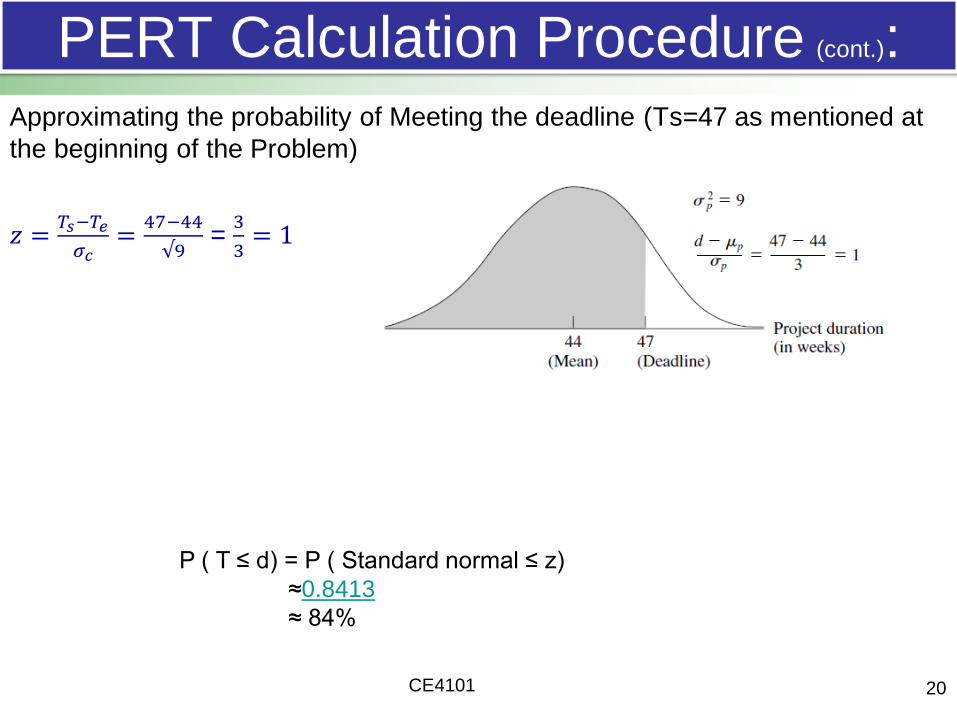
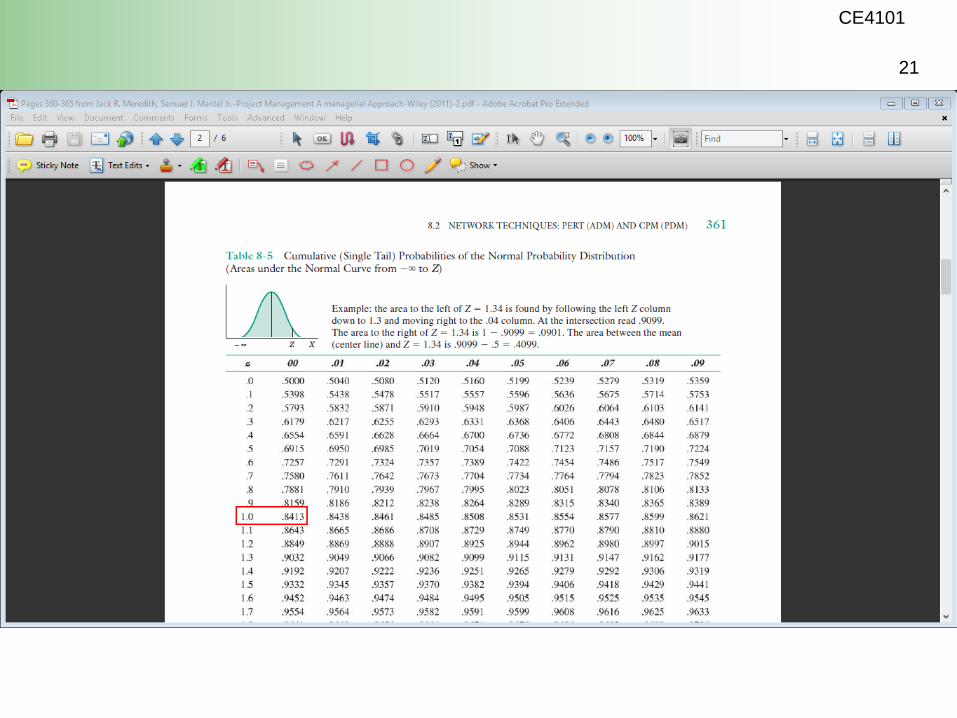
PERT Calculation Procedure (cont.):
Approximating the probability of Meeting the deadline (Ts=47 as mentioned at
the beginning of the Problem)
𝑧 =𝑇𝑠−𝑇𝑒
𝜎𝑐=
47−44
√9= 3
3= 1
P ( T ≤ d) = P ( Standard normal ≤ z)
≈0.8413
≈ 84%
CE4101
21