PRINCIPALS’ ADVERSITY QUOTIENT: STYLES, …peaklearning.com/documents/PEAK_GRI_canivel.pdf ·...
168
PRINCIPALS’ ADVERSITY QUOTIENT: STYLES, PERFORMANCE AND PRACTICES LEA DARADAL CANIVEL Submitted in Partial Fulfillment of the Requirements for the Degree of Master of Arts in Education (Educational Administration) in the Division of Educational Leadership and Professional Services College of Education University of the Philippines Diliman, Quezon City April 2010
Transcript of PRINCIPALS’ ADVERSITY QUOTIENT: STYLES, …peaklearning.com/documents/PEAK_GRI_canivel.pdf ·...

PRINCIPALS’ ADVERSITY QUOTIENT:
STYLES, PERFORMANCE AND PRACTICES
LEA DARADAL CANIVEL
Submitted in Partial Fulfillment of the Requirements for the Degree of Master of Arts in Education
(Educational Administration) in the
Division of Educational Leadership and Professional Services College of Education
University of the Philippines Diliman, Quezon City
April 2010

ii
APPROVAL SHEET
The thesis attached hereto, entitled “PRINCIPALS’ADVERSITY QUOTIENT: STYLES, PERFORMANCES AND PRACTICES” prepared and submitted by LEA DARADAL CANIVEL, in partial fulfillment of the requirements for the degree of Master of Arts in Education (Educational Administration), is hereby accepted.
MARIO C. LUCERO, MA Adviser
LORELEI R. VINLUAN, M.Ed. Critic Reader
LIGAYA S. DE GUZMAN, Ed.D. Member Accepted in partial fulfillment of the requirements for the degree of Master of Arts in Education (Educational Administration)
DINA S. OCAMPO, Ph.D. Dean

iii
ACKNOWLEDGEMENT
In sincere appreciation and gratitude to the valuable assistance, the researcher
wishes to acknowledge the following people who have been instrumental to the
completion of her study:
Prof. Mario C. Lucero, her adviser, for his expertise, scholarly insights,
untiring guidance, assistance and most of all his patience through every step of the
way;
The Principal respondents of the different private schools, for their honest
and significant responses and accomodation to observe in their school;
Dr. Ligaya S. de Guzman, Prof. Lorelie R. Vinluan, the panel members,
who gave their essential comments and suggestions that were very helpful in refining
the research work;
All her Colleagues at Cainta Catholic College, for giving insights, support
and encouragement for the completion of the program;
Dr. Jose Pedrajita, for his directions when statistics are concerned;
Dr. Paul G Stoltz and Madam Tina Stoltz for allowing her to use the AQ®P
instrument on line and sending materials in support to her thesis;
Her loving children; Ann Lisette, John Neil and John Nico, for the bonding
moments and inspirations being her working team inspired by the spirit of her husband
Nelson who already joined the Lord;

iv
Her sisters Teresita and Lydia, brother-in-law Fortunato, nephews and
nieces, for their prayers, spiritual support and encouragement;
And above all, to Almighty God, who continuously blessed the researcher
with wisdom and strength that facilitated in the completion of this work.
L. D. C.
v
ABSTRACT
The study was conducted to investigate the association between the adversity
quotient, leadership style, performance and practices among the principals in private
schools in the province of Rizal.
Specifically, the study sought answers to the following: the adversity quotient®
profile of the principals; the leadership styles of the principals that emerged; the effect
of AQ®P to performance and practices; the relationship between the principals’
adversity quotient® with the principals’ leadership styles; and relationship between the
principals’ adversity quotient® and leadership styles with the principals’ demographic
profiles
The researcher designed three instruments and made use of an electronic AQ®
P questionnaire to gather quantitative and qualitative data. Descriptive and inferential
statistics were applied in the analysis of data and statistical software, SPSS version
10.0 was used.
The findings of the study were: The principals’ AQ®P in private schools in
Rizal has an average score which is within the AQ®P of the standard provided; among
the four dimensions of AQ which are control, ownership, reach and endurance
(CORE), it was ownership that pulls down to below average score and all the rest got
average scores; participating leadership style emerged as best and rank number 1,
followed by selling leadership style, delegating leadership style, and telling leadership
style; both performance and practices have positive response to adversity quotient; that

vi
there was no correlation between the principals’ adversity quotient® and the
principals’ leadership styles; and lastly the adversity quotient® and leadership styles of
the Principals’ responses has no significant correlation with demographic profiles.

vii
TABLE OF CONTENTS
Page
Title Page i Approval Sheet ii Acknowledgement iii Abstract iv Table of Contents v List of Tables / Figures vii List of Appendices viii CHAPTER
I INTRODUCTION 1 Background of the Study 1 Statement of the Problem 3 Significance of the Study 4 Scope and Delimitations of the Study 5 II REVIEW OF RELATED LITERATURE AND STUDIES 6 Adversity Quotient Defined 6 Concepts of Adversity Quotient 7 Dimensions of Adversity Quotient 11 Adversity Quotient Instrument 13 Studies of Adversity Quotient 14 Definitions of Leadership 19 Concepts of Leadership 20 Performance 34 Performance Indicators 36 School Practices 43 Summary of Adversity Quotient 46 Summary of Leadership Style 48 Summary of Performance 50 Summary of Practices 51 Conceptual Framework 52 Research Hypothesis 53 Definition of Terms 54 III RESEARCH METHODOLOGY 56 Research Design 56 Sample 56 Research Instrument 62 Data Gathering Procedure 65 Data Analysis 66

viii
IV PRESENTATION, ANALYSIS AND INTERPRETATION OF FINDINGS 68 Adversity Quotient ®Profile of the Principal Respondents 68 Leadership Styles of the Principal Respondents 77 The Adversity Quotient ®Profile and Performance 82 The Adversity Quotient ®Profile and Practices 90 Principal’s AQ® and Leadership Styles 98 Principal’s AQ® and Leadership Styles with Demographic Profile 103 V SUMMARY, CONCLUSIONS AND RECOMMENDATIONS 107 Summary 107 Findings 108 Conclusions 110 Recommendations 111 References 113 Appendices 122

ix
LIST OF TABLES
Table Page 1 Selected Private Schools in Rizal 57 2 Location of Respondents School 59 3 Distribution of Respondent-Principals as Demographic Profile 61 4 Principals’ Adversity Quotient with its Four Dimensions 69 5 The Principals’ Adversity Quotient Descriptive Interpretation 70 6 CORE Score Equivalents 71 7 Principals CORE Dimension of Adversity Quotient 76 8 The Principals’ Leadership Styles that Emerged 78 9 The Summary of Principals’ Leadership Styles Behavior 81 10 Personality of Principal – Respondents 85 11 Association with Colleagues of Principal – Respondents 86 12 Workplace Relationship of Principal – Respondents 87 13 Effectiveness of Principal – Respondents 89 14 Summary of Principal – Respondents 89 15 Principals’ Responses with Regards Student – Learning 92 16 Principals’ Responses with Regard Teachers 93 17 Principals’ Responses about Administration 94 18 Community Partners and Linkages 96 19 Seminars Provided 97 20 Summary of Principals’ Practices 98 21 Correlation of Principals’ Adversity Quotient and Leadership Styles 99
22 Relationship of Principals’ Adversity Quotient with its Four Dimensions with Leadership Styles 110 23 Relationship of Principals’ Leadership Styles and AQ 102 24 Principals Demographic Profiles, AQ & Leadership 104 25 Relationship of AQP, Leadership Style in terms of their Demographic Profiles 105

x
List of Figures
FIGURE
1 Diagram showing the connection of leader behaviors
In Hersey and Blanchard’s (2001) situational leadership 30
2 Conceptual framework 52

xi
LIST OF APPENDICES
Appendix Page
A Requests Letters 123
B Survey Questionnaire 129
C Part II- AQP instruction 130
D Part III- Leadership Style Questionnaire 131
E Interview Questionnaires 134
F Summary of Principals’ AQ 135
G AQ Latest Ranges and Reliability 136
H Summary of Leadership Styles 137
I Principals’ Interview Responses 138

xii
CHAPTER I
INTRODUCTION
Background of the Study
Basic education institutions are often forced to deal with recurrent internal and
external problems in their operation. How these problems are resolved is highly
dependent upon the individual principal’s personal qualities express in style of
leadership. As the recognized leader in a school, the principal has a lot of
responsibilities and accountability in the organization. The position is critical to the
organizational development and academic growth of the students, because the
principal is usually the main source and the driving force that sustains the welfare of
the organization (Williams, 2003; Rosenholtz, 1989; Stoltz, 1997).
As leadership issues continue to be on the forefront of education, it is
imperative that research examines the responses of school principals to adversity as
the new area of leadership training (Stoltz, 1997; Schmidt, 1999). The multi-faceted
roles of being principals could exert too much pressure on their psychological and
social well-being, which in turn, could jeopardize the gainful existence of a school.
Educational leadership roles according to Law and Glover (2000) take the form of
being leading professionals who act as mentor, educator, advisor, ambassador, and

xiii
advocate, and of being chief executive, who act as strategist, manager, arbitrator,
executive officer and diplomat.
Very often, the principal’s existing capacity (what they have) could not equal
the required capacity (what the school demands) to do the task, thus creating a gap in
their performance. Principals who experienced a persistent gap between their existing
capacity and the required capacity is an indication of their inability to fulfill their
potential, in consequence, lowering their performance in terms of resourcefulness,
adjustment to change with new ideas, problem solving, decision making, optimism
and healthiness. Most principals are stressed by the chronic burden imposed by the
demands to perform to their utmost human capacity, only to fall short of what is
demanded when it matters most.
Currently, schools are facing many issues and emergent adversities with which
educational leaders must contend. Emergent adversities such as academic problems,
drug addictions, early pregnancy, parental problems, bullying, and discipline are the
most common. In addition to this, according to Senge (1999), advances and changes
in technology, science, values, environment, and international relationship hold a
varied assortment of challenges and adversities in education. How a leader responds
to these adversities not only affects the leader’s performance but also the performance
of those being lead. Learning to deal with adversity in the organization in one’s
career life is an essential element of effective leadership (Wallington, 2004).
The researcher was challenged to relate the principles of adversity quotient of
Dr Stoltz (1997) to the school environment being the workplace of the principal.

xiv
According to Stoltz’ theory, leaders with high adversity quotient respond most
effectively to adversity and will prevail in work and in life thereby becoming the
leaders of today and tomorrow.
This study would provide research-based information on the profile of private
school principals in the province of Rizal. Essential information was gathered to help
in discovering the principals’ hidden resource that could spell success or failure in
their leadership, performance and practices. Through this study, the researcher was
able to determine the types of educational leadership that are currently in use by the
principals in private schools. The researcher found it very interesting to study the
relationship of AQ and educational leadership in terms of leadership styles, school
performance and practices applicable to private schools, because of the nature of her
job which requires her to work closely with principals in her school.
Statement of the Problem This investigation attempted to show an association between the school
principals’ adversity quotient, style of leadership, school performance and best
practices.
Specifically, the study sought answers to the following questions:
1. What is the adversity quotient® of the principals?
2. What are the leadership styles of the principals that
emerged in this study?

xv
3. How does the adversity quotient® of the principal affect
their performance and practices?
4. What is the relationship between the principals’ adversity
quotient® and their leadership styles?
5. What is the relationship between the principals’ adversity
quotient® and leadership styles with the principals’
demographic profiles?
Significance of the Study The result of the study would benefit the following:
Administrators can gain additional information in understanding individual’s
adversity quotient® (AQ®), which will help the organization to hire and retain
highly motivated and competent faculty and staff.
Curriculum Developer may include and consider the present studies of AQ®,
leadership styles, performance and practices in developing the curriculum.
Faculty and Staff will be encouraged to put their best efforts and maximize
their performance capabilities. The study will provide ideas in helping them
develop their potential and leadership.
Human Relation will take into consideration AQ® in the performance or
management of human organization in getting people together to accomplish
desired goals.

xvi
Policymakers can obtain data from the study that can be codified for use in the
formulation of policies relative to the organization and operation of the
schools.
Researcher may continuously study and consider AQ® as criteria not only in
leadership but also in every aspect of dealing with human endeavor.
Students can improve their learning style through a principal with higher
adversity quotient and appropriate leadership style.
The school principal who is in constant exposure to different pressures both
internal and external has to constantly review own AQ®P as guide in
performing his/ her task.
Scope and Limitations of the Study
The study focused on determining the principals’ adversity quotient, leadership
style, school performance and practices of selected private school principals in the
Province of Rizal during the school year 2008-2009.
The adversity quotient was measured through the AQ®P instrument provided
on- line by Dr Paul G. Stoltz with his version 8.1(2009). One limitation was the
principal respondents’ lack of access to technical aid that allowed them to answer the
questionnaires through paper and pencil and then the researcher sent their answers on
line.
The aspect of leadership styles of the principals was focused on the common
behaviors that were necessary in carrying their task.

xvii
CHAPTER 2
REVIEW OF RELATED LITERATURE AND STUDIES
This chapter describes the related literatures and studies on adversity quotient®,
the various leadership styles, performance and practices for acquiring new knowledge
relative to the researcher’s study.
Adversity Quotient® Defined
Adversity strikes without warning. It attacks with intense anger through trial,
heartache, or an emotional setback. Stories in the world are about adversity and
conflict that can create comedy, drama, romance, action, mystery and a world of other
emotions and themes for without adversity there is no story to tell ( Hewitt, 2002).
Relationship adversity is among the adversities categorized separately because it is a
tool for character development. A character must change the relationship, be changed
(or even destroyed) by the relationship, accept the relationship or be doomed to fight
the relationship.
There is always a purpose for adversity. The Apostle Paul (Bible) received
adversity in his life, which the Lord allowed to maintain his humility and increase the
trust level in God by keeping focused on his ability. God always provides abundant

xviii
strength for each adversity that one is called to face. Adversity reveals the truth about
oneself, own weakness, strengths, willingness to forgive, and shows where one stand
in faith.
Dealing with the difficulties of each day, and the difficult people with whom
one interacts, is an ongoing challenge. Stoltz ( 1997,2000) provided theories on
adversity quotient (AQ®) of an individual on how to resolve such challenge and strive
to overcome it so as not to affect deeply what he/she will accomplish in his/her work
and towards life. He defined AQ as the measure of one’s resilience and ability to
persevere in the face of constant change, stress and difficulty or AQ is simply a
measure of how you respond to adversity.
Adversity Quotient predicts how well one withstand adversity, overcome it,
and foresee who will be crushed; who will exceed and fall short of their expectations
in performance and potential; and who gives up and prevails. Stoltz (1997) found out
that AQ has three forms: first, AQ is a new conceptual framework for understanding
and enhancing all facets of success. It is build upon a substantial base of familiar
research, which offers a practical, new combination of knowledge which redefines
what it takes to succeed. Secondly, AQ is a measure of how one responds to
adversity which can be understood and changed and can be calculated and interpreted.
Thirdly, AQ is a scientifically-grounded set of tools for improving how to respond to
adversity resulting to an overall personal and professional effectiveness.
Concepts of Adversity Quotient

xix
The concept of Adversity Quotient discovered by Stoltz (1997) is a science
theory of human performance deeply rooted in several sciences like cognitive
psychology (control and mastery of one’s life), psychoneuro-immunology (immune
function), and neurophysiology (science of the brain). The cognitive psychology
research has found that people respond to problems in consistent patterns that do not
change unless the individual takes action to modify the behavior. This included
several essential concepts for understanding human motivation, effectiveness and
performance.
Learned helplessness theory of Seligman et al. (1993) explained why man
gives up or stops when faced with life’s challenges. It is about the loss of perceived
control over adverse events that destroy motivation to act. But people can be
immunized against helplessness and never give up (Frankl, 1959) even in desperate
situation thus developing skills to counteract helplessness (Stoltz & Weihenmayer,
2006). Mikulincer’s (1994) learned helplessness also predicted that repeated negative
feedback can lead to a reduction in performance below what was previously achieved.
Attribution, explanatory and optimism theory introduced the idea that a
person’s success maybe determined by the way one explains or responds to life’s
events. Peterson, Seligman et al., (1993) discovered that those who respond to
adversity as stable, internal, and general to other areas of their life tend to suffer in all
areas of life, whereas those who explain adverse events as external, temporary and
limited tend to enjoy benefits ranging from performance to healthiness. Furthermore,
those who explain adversity as permanent (it will never change), pervasive (it will ruin

xx
everything) and personal (it’s my fault) have pessimistic explanatory styles while
those who respond to adversity as temporary, external, and limited have optimistic
explanatory styles.
Hardiness is a human trait and a strong predictor of physical and mental health
in the face of adversity. Studies of Oullette et al (1982) revealed that hardy people
tend to suffer less for a shorter time from anxiety and depression. There was also a
study of Okun (1988) that women with greater hardiness had their immune system
stronger. Those who respond to adversity as an opportunity, with a sense of purpose
and a sense of control remain strong while those victimized by adversity respond to it
helplessly, become weak.
Resilience is the ability to recover from or adjust easily to misfortune or
change and the ability to return back to normal. Werner (1992) in her study showed
that young people with traumatic childhood had overcome sad experience and had
become resilient. Unlike genetics, resilience can be molded or reshaped on children
faced with adversity and can overcome future adversities better later in life.
Self-efficacy of Bandura, (1995) is the belief in the mastery of one’s life and
the ability to meet challenges as they arise. This emphasized that people who have a
sense of self-efficacy bounce back from failures, and they approach things in terms of
how to handle them rather than worrying about what can go wrong.
Locus of control is about the relationship between control over life’s events,
motivation and success. This control theory (Podsakoff & Farh, 1989) stressed on the
discrepancy between a person’s performance (external) and their internal standards.

xxi
Rotter (1966) proposed that people who believe that they control their rewards and
punishment as internal locus of control are less likely to be depressed and more likely
to take action to improve a bad situation than those who perceive that rewards and
punishments are due to external locus of control such as bad luck, weather or chance.
People knowledgeable to response to all these theories of cognitive psychology have
strong indicators of their ability to succeed in many endeavors.
The research in the field of psychoneuroimmunology has found a direct
relationship between what you think and feel and what goes inside your body. Dreher
(1996) showed that human thoughts and feelings are mediated by brain chemicals that
regulated body defenses. Basic control over the daily activities is essential to health in
order to live longer. Studies of Peterson, Seligman et al (1993) have found that
pessimistic responses to adversity can lower immune functions, thereby decreasing
chances of recovery from surgical procedures, and increase vulnerability to diseases.
A weak pattern of response to adversity can even cause depression.
The concept on neurophysiology has documented that the brains will take
behavior patterns and creates automatic, subconscious habits which are used to
respond to external events (Nuwer, 1986). These habits become hardwired in the
subconscious region of the brain. The subconscious habit like adversity quotient can
be immediately altered forming new habits that are strengthened over time.
AQ begins with individual, but goes beyond as one is exposed to an
organization. Stoltz(2000) advised that these skills can be applied to oneself, to
others, and to organization. The theory discovered can be measured and enhanced the

xxii
effectiveness of teams, relationships, families, organizations, communities, cultures,
and societies. AQ will strengthen one’s effectiveness as a leader while enhancing the
effectiveness of those being led.
Dimensions of Adversity Quotient
Adversity quotient encompasses four dimensions which exactly measures the
AQ of an individual. They are control, origin and ownership, reach, and endurance
embodied in the acronym CO2 RE. C stands for control over an adverse event.
People who respond to adversity as temporary, external and limited have optimistic
explanatory styles and tend to enjoy life’s benefits. With perceived control, hope and
action are turned to reality or learned helplessness shall pass. The more control one
has, the more likely one has to take positive action.
O2 denotes origin and ownership. The first O stands for origin and has
something to do with blame. Blame has two functions which help one to learn from
and adjust behavior causing improvement. This blame leads to guilt obliging one to
search own soul and weigh the way one might have hurt others. The feeling of guilt is
a powerful motivator when used properly for it can help heal real, perceived or
potential damaged to an important relationship. Too much blame can be
demoralizing and destructive which can destroy ones energy, hope, self worth and
immune system leading one to decide to quit. It is indicative of the level to which one
or an external entity is the origin of the event, and to what degree one owns the
outcomes. Those with lower AQ scores tend to blame themselves. Higher scores tend
to properly place responsibility, and therefore also have high self-worth. An individual

xxiii
having low AQ blame oneself for bad events, but with higher AQ an individual learn
one’s behavior to become smarter, better and more effective the next time similar
situation is encountered.
The other O means ownership that reflects accountability. This answers the
degree of owning the outcomes of adversity whether good or bad. High AQ people
enhance their accountability to control, empower and motivate action while low AQ
people disown the problem causing failure to act, give-up, point fingers, reduced
performance and angers at others and many more negative actions. Owning the
outcome reflects accountability for achieving a specific result in response to a
problem. High scores tend to accept responsibility for creating a specific outcome
regardless of the causes.
R stands for reach evaluating how far the adversity gets into the areas of ones
life. Low AQ response allow adversity to affect other aspect of one’s life leading to
financial panic, sleeplessness, bitterness, distancing self from others and poor
decision making. But with high R-score one may limit the reach of the problem to the
event at hand. A misunderstanding relationship is one misunderstanding although
painful and not a sign that life is falling apart.
E means endurance responding to the time adversities last. Attribution theory
of Peterson & Seligman et al (1993) indicated that there is a dramatic difference
between people who attribute adversity to something temporary versus something
more permanent or enduring. Applying this theory, people who see their ability as the

xxiv
cause of failure (stable cause) are less likely to continue than people who attribute
failure to their effort (a temporary cause).
AQ Instrument
The adversity quotient of an individual plays an ever-greater role in reacting to
adversities being dealt with greater uncertainty, demands, challenges, changes and
complication. Individual’s AQ can be both measured and improved from these
elements which can determines whether he/she can stand strong and true, continue to
grow when faced with adversity or if he/she will be crippled or destroyed. AQ® is the
foundational factor of success that can determine the ‘how’, ‘if’, and ‘to what’ degree
of attitudes, abilities and performance are manifested by a person. As posited by
advocates of adversity quotient (AQ) the above cited gap could be resolved by
upgrading one’s capacity through strengthening one’s adversity quotient. When used
properly, AQ is a vital piece of any effort to strengthen leaders and their ability to
thrive in this demanding work environment.
Stoltz (1997) has developed an assessment instrument that is similar in form
and format to the Myers Briggs Time Indicator (MBTI) and it assesses AQ. The AQ-
scores fall into three broad bands, with an expected normal distribution: Low AQ
characteristics (low levels of motivation, energy, performance and persistence and the
tendency to ‘catastrophize’events); Moderate AQ characteristics (under utilization of
potential, problems take a significant and unnecessary toll, making climbing difficult,

xxv
and a sense of helplessness and despair arises from time to time); High AQ
characteristics (able to withstand significant adversity, continue forward and upward
progress and maintains appropriate perspective on events and responses to them).
Studies on Adversity Quotient
Further studies of Stoltz (2000), described how one can cope with adversity in
their professional and private lives. He found out that there are three components of
human capacity: required capacity, existing capacity, and accessed capacity.
Required capacity is the amount of capacity that is demanded from a person as they
encounter greater adversity in their jobs and lives. Existing capacity is what people
have when they begin a job, when they are hired. It consists of their experience,
aptitudes, knowledge, talents–everything. Accessed capacity is what a person taps –
what they actually use. Most people according to him actually access (tap and use)
between 5% and 25% of their existing capacity.
Since adversity quotient is learned, studies of Dweck (1997) showed that
ones’ response to adversity is formed through the influence of parents, teachers, peers,
and other key people during childhood. Additional result of the studies reveal that
response to adversity can be interrupted and permanently changed so one can rewire
one’s brain for success. Thus discovering, measuring and applying AQ ® in one’s
area allow us to understand how and why some people consistently exceed the
predictions and expectations of those around them. Those who cannot overcome

xxvi
adversity will suffer on all fronts, while those with sufficiently high AQ ®s are likely
to continue until they succeed. They will acquire benefits in all areas of their lives.
Adversity has three levels of involvements: societal adversity, workplace
adversity and individual adversity (Stoltz, 2000). Today the world is facing global
economic crisis which affected society including the educational system. The schools
are no longer a safe haven for children. Cases of drug addiction, early pregnancy, and
broken family are the common societal adversity in schools. The workplace adversity
now demands reengineering, restructuring, rightsizing, downsizing, revitalizing and
decentralization. Workers are faced with constant change that calls to upgrade
knowledge and skills. Individual adversity is the accumulated burden one carries due
to societal and workplace adversities. The accumulated effects of large-scale
adversities are sometimes inspiring for many but to others the danger of losing hope.
Changes begin at the individual and control is instigated to make a difference.
A study of Schmidt (1999) compared the adversity response scores of leaders
in education to leaders in business and industry. Her study transferred the concepts
related to adversity responses of business leaders to the educational realm and
provides the leaders with information and support to make changes in the current
system. Areas of research investigated and discussed were hardiness, resiliency,
learned helplessness, self efficacy, attribution theory and the individual responses to
challenges and how these areas of study relate to leadership effectiveness. A total of
seventy-six education leaders and one hundred fifty eight business leaders were the
respondents. She utilized the ex post facto, descriptive study using a quantitative

xxvii
approach to data collection. The Adversity Response Profile (ARP), a self- rating
questionnaire developed by Stoltz in 1997 was used to measure the individual’s style
of responding to adverse situations. Findings revealed that business and industry
leaders scored high on ARP and can be interpreted that the business and industry
leaders respond more effectively to adverse conditions than their education leaders’
counterparts. Furthermore, it indicated that business and industry leaders are honed to
address adversity for they react positively and are more hardy and resilient leaders.
The research made by Williams (2003) showed that students attained higher
achievement score in schools with higher AQ principals. This study examines the
relationship between a principal’s responses to adversity and student achievement, the
relationship between principal and teacher’s response to adversity, and principal’s
perceptions of adversity in education. The research emphasized the importance of the
principal in influencing student achievement through the: management of meaning
within school culture, nurturing of a collaborative work environment with teachers,
and the fostering of a resilient school culture (Deal, 2000; Sergiovanni & Moore,
1989; Horne, 1997). A principal’s adversity response plays a crucial role in the
development of successful school climates and student achievement (Rosenholtz,
1989; Stoltz, 2000). Williams analyzed his works through the ex post facto non-
experimental research design and the respondents were asked to complete an
Adversity Quotient measure of Stoltz, 1997. His study involved seventeen (17)
principals and 79 teachers from the Flagstaff Unified School District of Arizona. The

xxviii
AQ scores were compared to standardized student achievement data. The principals
were also interviewed to gather additional qualitative data.
A hermeneutic phenomenological study investigating the possible relationship
or impact that adversity, obstacle and challenges had on shaping and development of
prominent leaders was conducted by Haller (2005). He discovered that prior to
becoming prominent leaders of the nine chosen primary respondents; they have
experienced various degrees of adversities in their youth and adult lives. The study
revealed that adversity in the early lives of the participants was not the most important
factor in shaping a leader but how they viewed obstacles or events in adult lives as
opportunities disguised as challenges. Several qualities of a leader emerged relative to
what most shaped the participants as leaders and becoming successful and these were:
the adversity in the participants early lives was not the most important influence, they
viewed the obstacles in their adult lives as disguised challenges, overcoming these
challenges strengthens leaders, mentors were very important in their lives and help
become a better leader, religious faith and families were key to success and share
concepts of leadership including honesty, integrity, caring deeply about people,
communicating clearly, knowing the business well and being humble servant-leader.
A study conducted by Johnson (2005) determined the relationship between
explanatory styles and AQ. This further examined the existence of correlations
between each of the construct and performance in a high- adversity occupation, sales.
A total of 112 western area sales region of a leading Fortune 500 company in the
computer hardware industry were the respondents. The study utilized the Attribution

xxix
Style Questionnaire of Peterson et al, the Adversity Response Profile of Stoltz and a
demographic data sheet to collect data. The results appear that the AQ model provide
a more complete and consistent framework for identifying who is empowered and who
is helpless. This provides evidence for the relationship among working professionals
like sales personnel who work in a very demanding environment.
An article in the Philippine Daily Inquirer about Adversity Quotient by
Velasco (2002) struck the attention of the researcher and started her interest to make a
study on AQ. There was no local study found in the Philippines during that time. Two
years after, Lazaro (2004) conducted and presented her study on adversity quotient
and performance level in the 5th Asian Regional Congress of Industrial Relations
Association (IIRA) held in Korea. She studied the missing factors of success and
excellent performance among selected middle managers. The interesting concept of
Adversity Quotient introduced by Stoltz in 1997 was used. The capacity of each
employee is the basis of organizational capacity where the manager handles the
smallest unit. These managers handled multifaceted tasks being exposed to different
people of various organizational levels creating demands greater speed, capacity and
capabilities. A multi-source assessment or 360-degree feedback process was used in
determining the performance of a middle manager.
This instrument viewed performance accurately by getting input of
supervisors, peers or colleagues, subordinates, and clients from all angles. The study
employed the descriptive, co relational method of research to determine the
relationship of adversity quotient and performance level of middle managers using the

xxx
360-degree feedback system. The selected middle managers of the different
departments of the City of Manila showed a high correlation between AQ and
performance level of the respondents as revealed by the 360-degree feedback system.
Villaver ( 2005) focused her study on the adversity quotient levels of female
grade school teachers of a public and a private school in Rizal Province. She applied
the Adversity Response Profile 7.0 of Dr. Paul Stoltz (1997). Her respondents were
female grade school teachers (105) of public school and female private school (31) in
the province of Rizal. The z-test statistical method was used to determine the
significant difference between adversity quotient levels of the teacher respondents.
The findings on AQ and demographic profiles indicated that early adulthood stage
category possessed moderate AQ while older counterparts moderately low AQ.
Single status had found to have moderate and moderate low AQ compared with their
married respondents. Teaching experience of ten years or lower had moderate AQ
while those with higher than eleven years has moderately low AQ. In terms of socio-
economic status, the lower class had moderate AQ, while the middle class had
moderately low AQ. She discovered that there were no significant differences
between the AQ of public and private school teachers since both had moderate AQ
levels.
Definitions of Leadership To begin knowing the leadership styles of a principal, a review of the different
definitions of leadership has to be considered. Description of leadership can sound

xxxi
very passionate, even evangelical because leading is a human activity – everyone is
treated human – everyone got advice about leading.
Leadership was defined by Terry (1987) as the activity of influencing people to
strive willingly for group objectives; Tannenbaum et al (1959) defined leadership as
“interpersonal influence exercised in a situation and directed, through the
communication process toward the attainment of specialized goal or goals”; Koontz
and O’Donnell (1959) state that “leadership is influencing people to follow in the
achievement of a common goal”. Crosby and Bryson(1999) characterized leadership
as the inspiration and mobilization of others to undertake collective action in pursuit of
the common good and therefore their framework was simply “leadership for the
common good”. Different authors of leadership books argued that there is no precise
definition for describing the complex phenomenon of leadership. The most cited
definition of leadership came from Bennis and Nanus(1985) that leaders are people
who do the right thing. Ciulla (2004) emphasized that leadership is a distinct kind of
moral relationship. According to him, leaders cannot empower people unless they
have the moral courage to be honest with themselves. On the other hand, people want
leaders who are honest, forward looking, competent and inspiring (Kouzes, Posner,
1995). All reviews of leadership definitions follow that leadership process is a
function of the leader, the follower, and other situational variable.
Concepts of Leadership Style

xxxii
The concept of leadership is clearly understood through its three theories based
on trait, behavior, and situation. It was Stogdill (1974) who identified several general
factors which differentiate leaders from non-leaders due to personality traits. They
have the capacity to solve problem, make judgments, and hard work; achievements
such as academic record, knowledge, and sports; responsibility referring to
dependability, reliability, self drive, perseverance, aggressiveness and self-confidence;
participation and involvement in highly developed social interaction, adaptation to
changing situation; socio-economic status. Leadership approaches based on traits per
se is too limited since not all leaders have inherent personal qualities.
Empirical studies focus on the leader behavior approach in as much as
leadership is seen as dynamic process, varying from situation to situation with changes
in leaders, followers and situation. Leadership involves accomplishing goals with and
through people or a leader is concerned about task and human relationships. Two
important theories in organization were involved in this leadership approach. One is
the scientific management theory of Taylor (1911) to improve the technique or
methods used in carrying the task and the human relation theory initiated by Mayo
(1967) taking consideration human feelings and attitudes in carrying the tasks.
Depending on participation and sharing in decision making, leaders have been
classified by Lewin, Lippit and White, (1939) as: autocratic leader, democratic or
participative leader and Laissez-faire leader.

xxxiii
Three widely known studies of classic behavioral theories of leadership were
conducted at the University of Iowa, Ohio State University and University of
Michigan.
In Iowa studies (Lewin, 1939), the researchers manipulated three leadership styles to
determine their effect on the attitudes and productivity of subordinates. Authoritarian
leadership has leaders who were very directive and allowed no participation in
decision. Leaders took full authority and assumed full responsibility from initiation to
task completion. Democratic leadership encourages group discussion and decision
making. Subordinates were informed about conditions affecting their jobs and
encouraged to express their ideas and make suggestions. Laissez-faire leadership
gives complete freedom to the group and left subordinate to make individual decisions
on their own.
Highlights of the results of the studies were as follows; subordinates chose the
democratic style of leadership as best, preferred laissez-faire over authoritarian,
authoritarian leaders elicited either aggressive or apathetic behavior; productivity was
slightly higher under the authoritarian leader. The Iowa studies were important
because they helped focus attention on the investigation of leadership behavior and
provided a useful basis for describing and classifying alternative leader behavior
styles.
The Ohio State University studies initiated in 1945, answered the types of
behavior leaders display and the effects of these leader behaviors on group
performance and satisfaction. They used the Leader Behavior Description

xxxiv
Questionnaire (LBDQ) to study leadership in different types of group and situations.
Studies were conducted to various groups and then subjected to factor analysis, a
mathematical technique to identify the common dimension present in the smaller sets.
Two behaviors of leaders came out as Initiating Structure and Consideration.
Initiating structure (task behavior) leader focuses directly on organizational
performance goals, organizes and defines tasks, assigns work, establishes channel of
communication, delineates relationships with subordinates and evaluates work group
performance. Consideration (relationship behavior) leader exhibits trust, respect,
warmth, support, and concern for the welfare of subordinates.
The two- dimensional theory of leader behavior that evolved from the Ohio
State leadership studies represents a widely accepted research- based approach to the
study and practice of leadership. These dimension initiating structure and
consideration were independent and had resulted in four leadership behaviors that can
be represented in a quadrant figure such as: Q-I, high initiating structure and low
consideration; Q-II, high initiating structure and high consideration; Q-III, low
initiating structure and high consideration; Q-IV, low initiating structure and low
consideration. Findings show that high initiating structure –high consideration leader
behavior result in higher satisfaction and performance among school administrators
than do any of the other three behaviors. It was at these studies that leader behavior
was first plotted on two separate axes rather than on a single continuum.
The University of Michigan studies that were conducted around the time of the
Ohio University leadership studies identified two distinct leadership behaviors. They

xxxv
were very similar to the Ohio State studies about initiating structure and consideration
dimensions. These were called production-centered leadership and employee-centered
leadership. The production-centered leadership emphasizes employee tasks and the
methods used to accomplish them. The leaders here set tight work standards,
organize tasks carefully, prescribe work methods to be followed and closely supervise
their subordinate’s work, whereas the employee-centered leaders emphasizes the
employee’s personal needs and the development of interpersonal relationship. He
takes interest in everyone. Later studies found a mix of employee and production-
centered leadership increased productivity and satisfaction.
Behavioral approach in leadership is seen in McGregor’s (1960) Theory X and
Theory Y. According to these theories, there are two basic classes of people: those
who want to lead and take responsibility and those who want to be directed and do not
want to take responsibilities. Theory X assumes that man is inherently lazy, dislikes
work and avoids it whenever possible as a result, leaders are authoritarian. On the
other hand Theory Y style of leadership is based on Maslow’s (1943) concept of self
actualization. It considers that work can be enjoyable, people will work hard and
assume responsibility if they have the opportunity to satisfy their personal needs while
at the same time achieving organizational goals, an individual’s performance is
actually based on innate rather than external controls.
The Managerial Grid Leadership Styles developed by Blake and Mouton
(1969) used the task accomplishment (production) and relationship (concern for
people) extensively. The approach concerned for people and production evolves five

xxxvi
types of leadership styles in the managerial grid. The five leadership styles are found
in the grid are as follows: Impoverished style is the exertion of minimum effort to
accomplish the work. It is an ineffective style of leadership; Country club style refers
to thoughtful attention to the needs of people for satisfying relationships leading to a
comfortable friendly organization atmosphere and work tempo; Task style has
efficiency in operations which results from arranging conditions of work in such a way
that human elements interfere to a minimum degree; Middle-of-the-road style has
adequate organization performance through balancing the necessity to get out work
while maintaining morale of people at a satisfactory level; Team style is the most
effective style of leadership because of work accomplishment from committed people;
interdependence through a “common stake” in organization purpose leads to
relationships of trust and respect;
Likert’s four systems utilize the behavioral approach of leadership styles.
According to Likert (1967), optimal performance can only be achieved if attention is
paid to human aspects of subordinates’ problems and behavioral aspects, such as
motivating forces, processes in communication, goal setting, and control and
performance characteristics. Based on these premise, leadership styles could be either
job-centered or employee centered and was further classified as: Exploitative-
authoritative style of leadership, which is similar to the high consideration type which
is manipulative and result in low production; Benevolent- authoritative style of
leadership, which has a slight difference on the exploitative-authoritative style and
produces average result. The employee centered style has an ideal consultative style

xxxvii
of leadership. Although control is basically a top management job, it is shared
managers at middle and lower levels. The overall productivity is generally good. The
participative style maximizes the quantity and quality of performance and eventually
an ideal approach.
The situational approach to leadership is based on the argument that
environmental factors affect leadership style and effectiveness. As a result, effective
and successful leadership depends on the relationship between organizational
situations and leadership styles. Fiedler’s situational theory identifies effective
leadership styles under changing situations ( Feidler, Chemers and Mahar,1977).
These can either be relationship motivated leadership style or task motivated
leadership style. Relationship-motivated leadership style relies on good personal
relations and group participation to accomplish tasks. Leaders with such style perform
most effectively in modest control situations which present mixed problems related to
task, group members and authority. The relationship-motivated leader gets
cooperation from the group by being sensitive, diplomatic and tactful. The task
motivated leadership style has specific instructions on what he and his followers
should do.
Tannenbaum et al (1959) depicted a wide variety of styles of leader trait and
behavioral studies of leadership, a combination of trait and behavior theories. This
conceives a leadership style continuum between concern for task tending to be
authoritarian leader behavior and concern for relationship represented by democratic
leader behavior. They identified five typical pattern of leadership behavior from their

xxxviii
model: telling, selling, testing, consulting, and joining. In telling, the leader identifies
a problem, considers alternative solutions, chooses one and tells subordinate what they
are to do. Selling, the leader makes the decision but tries to persuade the group
members to accept it. Testing, the leader identifies a problem and proposes a tentative
solution then asks for the reaction of those who will implement. Consulting, the
leaders present a problem and background information and members have the chance
to influence in the decision. Joining, the leader participates in the discussion as the
members agrees in advance to carry out the decision of the group,
Korman( 1975) in his extensive review of the Ohio State studies of the concept
of initiating structure and consideration concluded that a systematic concept of
situation variance might relate to leadership behavior. He suggested the possibility of
a curvilinear relationship between the initiating structure and consideration and other
variables in the study which is similar to the life cycle theory of leadership. This life
cycle theory will attempt to provide a leader with some understanding of the
relationships between an effective style of leadership and the level of maturity of his
followers.
Burns (1978) introduced the concept of transformational leadership which is
about the ability of a leader to motivate and empower their follower. Its goal is to
transform people and organizations in a literal sense to change them in mind and heart;
enlarge vision, insight, and understanding; clarify purposes; make behavior congruent
with beliefs, principles or values; and bring about changes that are permanent, self
perpetuating and momentum building. Leadership is meaningless without its

xxxix
connection to common purposes and collective needs. Burns concept is broad enough
to include everything from great leaders to mothers, teachers, peers, and work
supervisors.
Furthermore, Burns made a central distinction between transactional and
transformational leadership. Transactional leadership takes place when a leader gains
commitment from followers on the basis of straight forward exchange of pay and
security in return for reliable work. This kind of leadership brings up a managerial
image, while transformational leadership raises images of extraordinary individuals.
The theory of leadership by Portroy (1986) first attempted to explain how a
working relationship develops and either adapts to changing needs of its members or
disintegrate as relentless conflicts erode both interpersonal and organizational
commitments. On his second theory, he discussed how human temperament could be
used as knowledge-based to logically explain, predict and modify the impulsive
behaviors that can interfere with the achievement of organizational objectives. He
developed the three major components of leadership, which are knowledge, skills and
temperament. According to him, knowledge includes an understanding of factors that
determine the “Hows” and “Whys” of typical human behaviors in any number
situation; the skills involve knowing how to redirect human behavior from impulsive
and self-preserving actions into productive channels that can benefit both workers as
well as the organization; and lastly temperament, houses the capacity to base actions
on forefront, purpose and direction.

xl
Leadership is learnable according to (Crosby, 1990). The leader has to learn
how to keep everyone focusing on the task and goals that will make the organization
successful. The three major areas of leadership that is learnable are relationship,
quality and finance. Relationship is personal between people to get the job done
properly. The leader has to be assertive and deliberate about managing the ecology of
operations thus conforming to the quality of the requirement. Finance took care of all
expenses to be incurred in the operation of the organization.
Many modern leadership gurus like Bennis (1990), Covey(1989),
Kouzes(1995) and Posner(1993) argued that a fundamental competency for a leader is
continuous learning with an attitude of curiosity and openness to new information.
They used formal and informed education to gain the knowledge and skills vital to
their leadership work. It is also important to focus on emotional as well as logical
intelligence (Goleman, 1995) to recognize, understand and respond to the view and
feelings of diverse others.
Leadership needs skills to manage one’s fear to face risks, to be aggressive and
to be completely devoted in bringing the organization to victory (Donnithrone, 1993).
The functions of a leader described are integration, coordination, assimilation, seeing
the big picture, recognize a multiplicity of perspective and incorporate all of them,
diplomacy and well versed in the organization.
Hersey and Blanchard’s (1982, 1999, and 2001) situational leadership
incorporated the maturity of followers in their model. They made an assumption that
leaders should adapt their style to follower development style referring to their

xli
maturity based on how ready and willing the follower is to perform the required tasks
considering competence and motivation. The situational leader provides high task/
low behavior to low-task ready employees and high relationship/ low task behavior to
high task-ready employees. The diagram below showed the relationship behavior
supportive on the vertical axis and the task behavior directive on the horizontal axis
following a curvilinear path among its four classifications of telling, selling,
participating, and delegating.
The diagram in Figure 1 illustrates a balance between task behavior directive
and relationship behavior supportive in managing or leading people. Four leadership
styles came out of the matrix. Telling or directing that describes leader as high task
focus and low relationship focus while the follower has low competence, low
commitment and insecure. The leader takes a highly directive role when the follower
cannot do the job and tells followers what to do if unwilling or afraid to try, but
without a great deal of concern for the relationship.
Low High
High
Relationship Behavior Supportive
Participating Selling

xlii
Low
Delegating
Telling
Task Behavior Directive
Figure 1 - Diagram showing the connection of leader behaviors in Hersey and
Blanchard’s (2001) situational leadership
Selling / coaching illustrates leader as high task focus and high relationship
focus and the follower has some competence, variable commitment and somewhat
motivated. Here the follower can do the job but sometimes is over confident about
his/her ability to do the job, the leader needs to “sell” to followers another way of
working, explaining and clarifying decisions. The leader spends time listening and
advising and where appropriate help followers to gain necessary skills through
coaching without being harass.
Participating / supporting describe a leader as low task focus and high
relationship focus where follower has high competence, variable commitment and
insecure. The leader is concerned with finding out why the followers are refusing to
do the job and showing insufficient commitment. The leader thinks to motivate,
listen, praise and make followers feel good when they show cooperation and
commitment. Delegating /observing demonstrate the leader as low task focus, low
relationships focus while follower has high competence, commitment and well

xliii
motivated. The leader can basically leave his followers trusting them to get on with
their job. Followers at this level have less need for support or frequent praise although
occasional recognition is always welcome.
The study of Millwee (2001) observed that every organization needs leaders
who will take the first step to achieve its goals. Leaders can be easily identified due to
their capacity to affect other peoples’ lives. These leaders typically further their own
personal and professional goals as well, because leadership being a great responsibility
is also rewarding. Six critical characteristics of an outstanding leader were found by
Milwee in how one faces adversity. The first great leader to have a positive impact in
ones life is a father exhibiting tremendous character when faced with adversity.
The first characteristic is being a purpose driven that is self-evident in ones life
because a true leader has integrity. A second quality of a true leader that has in life is
persistence. He/She makes commitment and never allows doubt, conflict, difficulty,
or resistance to negatively influence determination to solve whatever the unsolved
task. An effective leader knows his/her strength and weaknesses and does not blame
others for their deficiencies. The third quality of an outstanding leader is perceptive
self knowledge. An outstanding leader is a perpetual learner and demonstrates that a
true leader understands that professional excellence requires a life journey of learning.
Focus is the fifth characteristic of an effective leader. A true leader knows whom
he/she is serving for he/she is ‘people focus’. The sixth quality of an effective leader
is his ability to be a positive role model who is the voice of motivation when everyone
has lost direction.

xliv
In addition to the characteristics of a leader in Milwee (2001) study, he
encountered four distinct types of leader. The “up-and-comer” whose desire to serve
others will guide one toward his/her goal; “know-it-all” who does not need help
because he/she has done that; “leader of one” an authoritarian; and “committed to the
team” whose style elevates others and not himself and serve the team faithfully.
A study on leadership style and effectiveness on basic education administrator
was conducted by Mendoza (2000). The respondents were the administrators
themselves and the teachers. The variables considered were task orientation, relation
orientation and effectiveness. The findings showed that administrators and teachers
ratings resulted in low in task orientation and relation orientation but average in
effectiveness dimension. Administrators perceived by themselves as utilizing
supporting style or bureaucratic leadership style.
Another interesting study was conducted by Lahoz (2005) on her ‘Portrait of
the Filipino as an Outstanding School Administrator’. She identified the qualities of
an outstanding Filipino school administrator and the contributory factors to their
leadership style. Her respondents were purposively selected from Delphi Response
Group, private schools members of Coordinating Council of Private Educational
Associations (COCOPEA), government agencies and legislative bodies, and
professional associations.
The findings revealed twenty- two (22) qualities of outstanding administrators
and twenty-three (23) factors contributory to outstanding leadership. She expressed
the resulting synthesis of her studies as the Educational Leadership Octagon consisting

xlv
finally of: Gift of Self wholeness, principles-commitment humility, empowerment-
trust in people, manager-attention to details, leader-movement towards vision, bigger
causes outside school-industry leader, differences made in lives and total development
of others, and excellent school realization of targets.
A key issue in developing strong leaders was conducted by Stanford
Educational Leadership Institute (2007). The study addressed the changing face of
principalship- preparing women for positions of school leadership. There were two
related concerns that came out; programs on design and delivery features on how to
prepare women leaders equipped with skills and knowledge for systemic change; and
the trend in more women entering the field of principalship. The changes in gender
classification of occupation of principal presented a significant shift in the role of
school leadership- not only in terms of the nature of the work, but also in terms of the
gendered transformation of roles.
The former models of principal which emphasized bureaucratic control were
traditionally masculine (Blount, 1999), with women holding the instructional roles
associated with femininity. The growing focus on instruction has resulted in
increasing numbers of women entering the arena of school site leadership. Men now
looked for more attractive opportunities in other fields with higher salaries. The art of
negotiation is important in leadership and is a powerful tool among different
institution when gender (man and woman) is considered (Gurian & Annis, 2008).
Neuroscience is responsible for this new asset in human brain that accomplishes
success or failures. Women’s brains pick up more sensorial cues than men’s brains, so

xlvi
women tends to create more emotion-perception. Men’s amygdalas send fewer
signals to less verbal complex centers and more to spatial or calculative centers (a
reason why men are often data driven and not as emotion and word-centered in
negotiation).
Performance
Knowledge is imparted, nurtured, developed and tested in the school.
Teaching-learning and evaluation are the main important activities of educational
institution. The school performance is an important measure of success or failures for
students, teacher and principals. Performance of each individual challenges their
mental and physical abilities. The studies done on adversity quotient reflect
relationship with performance and indicated a positive influence of AQ on
performance at work. This includes performance at work in society, workplace and
individual (self).
The ability to handle difficult conditions at work influence ones work and
performance. Effective principals are strong educators, anchoring their work on
central issues of learning and teaching and continuous school improvement.
According to Schmoker (2001), combination of three concepts constitutes the
foundation for positive improvement results: meaningful teamwork; clear, measurable
goals; and the regular collection and analysis of performance data. Principals must
lead their school through the goal-setting process in which student achievement data is
analyzed, improvement areas are identified and actions for change are initiated. This

xlvii
process involves working collaboratively with staff and school community to identify
discrepancies between current and desired outcomes, to set and prioritize goals to help
close the gap, to develop improvement and monitoring strategies aimed at
accomplishing the goals, and to communicate goals and change efforts to the entire
school community. Principals must also ensure that staff development needs are
identified in alignment with school improvement priorities and that these needs are
addressed with appropriate professional learning opportunities.
Performance Indicators
The performance indicators are intended to provide clarity and specificity
about the skills, beliefs, and knowledge a principal needs to demonstrate effective
leadership in improving student achievement as well as teachers performance. Five
performance areas have been identified as the critical leadership skills a principal must
demonstrate to effectively lead a school in improving students and staff achievements.
These were: promoting collaborative problem solving and open communication;
collecting, analyzing, and using data to identify school needs; using data to identify
and plan for needed changes in the instructional program; implementing and
monitoring the school improvement plan; using systems thinking to establish a clear
focus on attaining student achievement goals
These five performance areas identified by Schmoker ( 2001) are not a
chronology of what a principal must do first, second, and third, but rather are cyclical
in nature and must be demonstrated continuously throughout the school improvement

xlviii
process. The end product of this process is the school improvement plan, whereas the
end goal for the process is improved student achievement.
Hanushek and Raymond (2002) expressed concern that United States
performance benchmarks often emphasize process and input measure that are
relatively easy to change but have been found to bear little relationship to student
achievement. States used performance benchmark such as standardized test and
tended to report the result in ways that prevent an accurate assessment of how well or
poorly schools are performing. State most commonly issue according to Hanushek
and Raymond referred to as “status change measures”.
Improvement in average scores may simply reflect better draw of students
rather than any overall improvement in schooling. A superior approach of
improvement, they argued would involved tracking individual student’s overtime and
aggregating the year-by-year changes into overall summary for the school that
demanded data requirements. The introduction of accountability system marked
improvement in student performance and other outcomes. After using the National
Assessment of Educational Progress (NAEP) mathematics scores, Hanushek and
Raymond found that accountability is associated with an increased in NAEP scores.
The study further showed the states that merely issued report cards see less increase in
student test scores than states with a system that has some form of reward (sanction)
for good (poor) performance.
Another article of Hanushek (2004) cited schools performance matter most in
term of students performance that influence the pattern of the nation’s economic

xlix
success. Two international assessments provide a benchmark for national education
systems. They are the Programme for International Student Assessment (PISA)
sponsored by the Organization for Economic Cooperation and Development (OECD)
that provides international comparisons of student achievement on standardized
examinations of math, science and reading for 15-year-olds. The Trends in
International Mathematics and Science Study (TIMSS) tests provides similar
information for math and science for a different set of countries and age groups.
The United States has participated since the 1960 in international testing but
had ignored results and its student have never ranked well compared to other
countries. Most of the people in the U.S. are unaware of their performance believing
that their schools are superior while others assert that the scores do not reflect the true
performance and are irrelevant. The contrast between the U.S. reaction and those of
other participating countries is striking. The Germans now were producing students at
the top of international rankings because they used previous poor result to start a
national discussion of how to improve their schools.
The assessments of international testing signify early warning signals for
economic welfare of the country. Performance on the international math and science
assessments directly relates to labor force quality and has been closely related to
national growth rates. And significantly, the national growth rates determine
economic well-being over time. Schools matter and the performance of the students
now will influence the pattern of the nation’s economic success according to the
author.

l
Cooley and Shen (2003) described the school principal as responsible to
accountability standards that have been implemented in schools such as performance,
goals, school reports and sanctions for poor performance. The study of Billger (2007)
examined the relationship between a principal’s performances and pays and further
examined school outcomes that reflected principal’s performance. School outcomes
are school size, pupil-teacher ratios, poverty rates, controlling finances and these are
explained by the principal’s leadership styles. Performance is certainly harder to
measure in not-for-profit organizations than in for-profit forms (Hallock, 2002).
Schools with higher enrollments may offer higher salaries, reflecting the increased
demands associated with more students to the principals aside from the determined
expertise as measured by education and experiences. Ebert and Stone (1988) found
that principals affect students’ achievement by choosing curricula, evaluating teachers
and appropriately allocating teacher’s time.
The 360-degree feedback system is a powerful new assessment tool intended to
provide an accurate view of employees’ performance by gathering evaluations of
his/her individual's performance from varying perspectives ( sources of feedbacks
such as peer, self, supervisor, and subordinate) to create a composite assessment for
the purpose of performance improvement. It is sometimes known as multi-rater
feedback. It also includes a self-assessment and, in some cases, feedback from
external sources such as customers and suppliers or other interested stakeholders. The
results from 360-degree feedback are often used by the person receiving the feedback

li
to plan their personal development and facilitate performance improvement. Results
are also used by some organizations in making administrative decisions, such as pay
or promotion. When this is the case, the 360 assessment is for evaluation purposes,
and is sometimes called a "360-degree review." However, there is a great deal of
controversy as to whether 360-degree feedback should be used exclusively for
development purposes, or should be used for appraisal purposes as well (Waldman et
al., 1998). There is also controversy regarding whether 360-degree feedback improves
employee performance, and it has even been suggested that it may decrease
shareholder value (Pfau & Kay, 2002).
The school improvement is the main objective for the use of the school
performance feedback systems which was conceptualized by Visscher and Coe (2003).
The school performance feedback systems (SPFSs) was defined by the authors as
information system external to schools that provide them with confidential
information on their performance and functioning as a basis for school self-evaluation.
The pressure to evaluate and report on the performance of publicly funded educational
institutions helped create a climate in which school performance feedback was most
important. The increase in feeding back information to school has also been
influenced by the development of multi level and value-added data-analysis models,
which enable the computation of more reliable and valid information on school
functioning.
Feedback were influenced by several theories like the Thorndike’s ‘law of

lii
effect’ (1913), the control theory of Podsakoff & Farth (1989) that emphasized on the
discrepancy between a person’s performance and their internal standards, learned
helplessness of Mikulincer (1994) which predicts that repeated negative feedback can
lead to a reduction in performance below what was previously achieved, the social
cognitive theory of Bandura (1991), the theory of goal setting by Locke & Latham
(1990) and the meta-analysis and feedback intervention theory of Kluger and DeNisi
(1996). The theory of Kluger and DeNisi depended on three classes of variables; the
cues in the feedback message, the nature of the task performed and on the
situational/personality variables. The school performance feedback systems (SPFSs)
studied have a positive impact and better students achievement levels.
Studies of Gates, S. et al (2001) showed dramatic increase in the representation
of women in the principals are growing older. Most principals entering the position
were 40 year old in both public and private schools. The principalship is an aging
profession and many schools and districts are concerned about the replacement due to
retirement. Many first-time principals are closed to retirement age and therefore
schools should consider thinking on how to reach out younger people whose career
can be longer. At the same time, school system could look into their retirement
program to create incentives for individuals to retire or leave the educational system at
a relatively young age. Another finding of Gates, S. et al (2001) in their studies is that
principals in public schools have larger enrolments.
High school principals reported more severe problems than elementary
schools. School size appears to pose serious challenges for school principals. Private

liii
schools with a religious affiliation tended to have fewer problems than with non-
sectarian schools. Private school principals reported fewer students’ problems than
public schools principals did, suggesting that working conditions in the private sectors
are better.
A study of Aidlai and Vadi (2006) explored how the attitude of school
administrations towards school performance criteria were related to pupils national
examination results in Estonian schools. The national examinations have been
conducted for the past ten years but there were no study whether schools with higher
results obtained by pupils were identified as successful schools. One important use of
the national examination results is that it is a criterion for entrance into the universities
in Estonia.
The school administration (principals, head teachers) is responsible for the
school performance. The school leadership utilized both the business and education
leadership approaches supported by the Harvard schools. The attitudes held by
administration are important as they quoted DiPaola et al. (2004) that the “principals’
attitudes, values, beliefs and personal characteristics inspired people to accomplish
organizational goals and if pupil achievement improves over time it is in large
measure because key stakeholders share the leader’s vision about these goals.”
The study focused on school leadership centered in four criteria: creating the
school environment, maintaining stakeholder relationship and satisfaction, creating
opportunities for non-academic development of pupils, and recruitment and training of
teachers. School safety is the concerned of the administration because without safety

liv
teacher cannot teach and pupils cannot learn effectively. Similarly, schools with
many social problems (e.g. violence, disorder, lack of discipline etc) have lower levels
of academic achievement (Stewart, 2008). Empirical research confirmed that schools
that performed well have a strong and effective organizational culture, whereas poorly
performing schools have a negative organizational culture (Westhuizen et al. 2005).
The result of the study indicated that administrations (principals) need to admit the
substantial role they play in school performance and adopt an attitude that embraces
leadership and school environmental issues as the key to a more successful school.
School Practices
The principal based their practices on different theories of supervision that will
create a more effective way to carry out their position. They build a practical and
meaningful programs to face up, struggles and accept a more complex view of
supervision and evaluation. More often, principal based their practices on the
assumption that predetermined solution exist for most of the problems they face in the
form of research-based theories and techniques.
Sergiovanni (1989) cited that the problem with management theory and with
educational theory is that they are always applied to practice directly when they should
be more appropriately used to inform practices. Principalship is a logical way of
problem solving or as the application of standard techniques to predict problems or
maybe a process of ‘managing messes’. Principal typically works in an environment

lv
characterized by limited resources, time, available staff and space. The principal’s
job – to coordinate, direct and support the work of others- is accomplished by defining
objectives, evaluating performance, providing the necessary resources, building a
supportive psychological climate running interferences with parents, planning,
scheduling, bookkeeping, resolving teachers conflicts, handling students problems,
dealing with the district offices and otherwise helping to keep the school running
effectively day by day, and improving its ability to achieve its objectives. The
leadership density played by the principal established a successful school.
Leadership density means total leadership potential and the actualization of the
principal potential. Principals have indicated that current educational changes cause
pressure to them because of a perceived need to do more, know more and be more
accountable in an unstable environment (Townsend, 1996). A better utilization of
resources, especially human talent and initiative is required. Under these conditions,
leaders must possess the skills to manage change and to create collaborative action.
A study made by Ortiz (2007), focused on the innovation and innovative
practices along technological, behavioral, organization, and social areas of school
administrators in public school and how these practices correlated with students’
academic performance. The study also examined whether or not some school and
school –related attributes as well as student and teacher-related attribute predict and
relate with the so called innovativeness. The findings showed that technological
innovations are perceived to be innovative by her respondents. But for limited

lvi
science and computer laboratory hinder the effective performance of the program.
Other innovations are considered principal-initiated innovations, teacher-initiated,
both instructional and administrative and the rest are Department Education initiated.
The study revealed that there is a negatively weak correlation between the age and
teaching experience of teachers and their perception on innovation practices. As to the
relationship between educational attainment and innovative practices there is a
positive relationship between the educational attainment of teachers and their
perception on innovative practices. This means that educational attainment of teachers
have some bearing on the positive response to innovations. Interview and observations
from schools under study revealed that most teachers who resist change or innovations
are those who do not update professional competence.
Based on the findings of the study secondary school principals could conduct
an action research to determine the extent of instructional innovations by his or her
teachers and analyze the result so as to determine what measures to employ to improve
or enhance their performance. This could also serve as baseline data for further in-
depth study on innovative practices of teachers and school administrators. Further,
Department of Education officials and policy makers could used these data to
determine the trainings and seminars they would sponsor specially in the areas of
technological and instructional innovations to improve the competence of teachers,
provide more facilities that will improve or increase the existing facilities of the school
specially in science, computer and audio visual rooms. Schools must be provided with

lvii
the best facilities to support the changing demand of technology and for effective
implementation of the revised basic education curriculum.
The study of Dalisay (2007) determined administrative practices in the public
secondary schools in National Capital Region. Administrative practices in the school
were examined from two perspectives, that of the science teachers and that of the
administrators. Science teachers and administrators perceived the implementation of
mandated science as the primary concern in schools. Effective practices were also
noted to be frequently observed in students’ development. Teachers perceived
administrative practices in instruction and curriculum development. Administrators
worked at promoting teamwork and collaboration among teachers. They showed polite
and thoughtful behavior towards everyone in the community. Both science teachers
and administrators perceive that improvisation, innovations, creativity and the
extensive and optimum use of science equipment and facilities are encouraged in the
schools. Additional interesting findings from the study are many administrators were
formerly outstanding teachers. Criteria for promotion of teachers to administrative
position allowed public school teacher to become principal or administrator in the
public schools.
Summary of the Review of Related Literature and Studies
Summary on Adversity Quotient

lviii
Adversity is the challenge that anyone can face while adversity quotient (AQ)
is the measure of how one respond to these challenges (Stoltz 1997; 2000). AQ
encompasses four dimensions: control, origin and ownership, reach, and endurance.
Three major sciences covers AQ which are cognitive psychology (control and mastery
of one’s life), psychoneuro-immunology (immune function), and neurophysiology
(science of the brain). Theories involved were learned helplessness, attributional,
explanatory, optimism, hardiness, resilience, self-efficacy, and locus of control.
AQ has three forms: it is a new conceptual framework for understanding and
enhancing all facets of success; a measure of how one responds to adversity that can
be understood, changed, calculated and interpreted; and a scientifically-grounded set
of tools for improving how to respond to adversity resulting to an overall personal and
professional effectiveness.
The three levels of adversity involved societal adversity, workplace adversity
and individual adversity. Further studies of AQ have found out that there are three
components of human capacity: Required capacity is the amount of capacity that is
demanded from a person as they encounter greater adversity in their jobs and lives;
Existing capacity is what people have (experience, aptitudes, knowledge, talents–
everything) when they begin a job; Accessed capacity is what a person taps – actually
access (tap and use) between 5% and 25% of their existing capacity (Stoltz, 2000).
Studies on adversity quotient have shown that business and industry leaders
scored high on AQ compared to education leaders (Schmidt, 1999). This indicated

lix
that business and industry leaders are honed to address adversity for they react
positively and are more hardy and resilient leaders. A principal’s adversity response
played a crucial role over their work environment including teacher relationship as
well as student achievement (Williams, 2003). What most shaped the leader were not
the adversities in the early lives but how they view obstacles or events in adult lives as
opportunities disguised as challenges (Haller, 2005). The AQ model provide a more
complete and consistent framework for identifying who is empowered and who is
helpless among working professionals like sales personnel who work in a very
demanding environment (Johnson,2005). Two Philippines studies on AQ were
included: regarding the selected middle managers that showed high correlation
between their AQ and performance level using the 360-degree feedback system
(Lazaro, 2004), and the AQ levels of female teachers in both public and private
schools that resulted in either moderate and moderate low AQ and no significant
differences were found between public and private school female teachers’ AQ
(Villaver, 2005).
Summary on Leadership Style
Different leadership proponents argued that there is no exact definition to
describe leadership. All meanings follow that leadership process is a function of the
leader, the follower and the other situational variable.
The various readings on leadership styles focused on the three theories of
leadership: traits, behavior and situation. It was found that trait approach to leadership

lx
is too limited because not all leaders have inherent personal qualities. The behavior
approaches were mostly applied by leadership experts that started initially with the
widely known studies conducted at University of Iowa, Ohio State University and
University of Michigan (Lewin et al, 1939). The focuses were on production and
employee. McGregor (1960) theories of X and Y leadership is based on Maslow’s
self-actualization concept (1943). People worked hard to satisfy needs. The
managerial grid by Blake Mouton (1969) also used production and relationship where
five leadership styles evolved in the grid. Likert’s (1967) leadership style is either
job-centered or employee-centered. Situational approach of Feidler et al.(1977)
considered environmental factors that affect leadership styles and effectiveness.
Relationship and task motivated leadership styles under changing situation resulted in
this approach.
A combination of trait and behavior theories was developed by Tannenbaum et
al (1959). They presented a leadership continuum that identified five models: telling,
testing, selling, consulting and joining. From the concept of the Ohio studies, Korman
(1975) had a curvilinear relationship between initiating structure consideration and
other variables similar to life cycle theory. Hersey & Blanchard (1982; 1999; 2001)
incorporated maturity of followers in their situational leadership style. Portray (1986)
developed three major components of leadership; knowledge, skills and temperament.
Crosby (1990) developed three major areas of leadership that is learnable relationship,
quality and finance. Modern leadership gurus Bennis (1990), Covey (1989), Kouzes

lxi
(1995), Posner (1993), and Goleman (1995) used formal and informal education to
gain knowledge skills and focus on emotional as well as logical intelligence.
Milwee’s (2001) research described the six characteristics of a true leader such
as; purpose driven, persistence, self-knowledge, perpetual learner, focus and positive
role model, and that the critical characteristics of an outstanding leader are found in
how one faces adversity. He encountered four distinct types of leader from his work.
Mendoza’s (2000) study on leadership style and effectiveness resulted in low in task
and relation but average in effectiveness dimension.
The study of Lahoz (2005) identified the twenty two qualities of an
outstanding Filipino school administration contributory to their leadership styles.
Developing strong leaders became an issue in Stanford Educational Leadership
Institute (2007) due to the changing face of principal ship. More women were
entering this field while men looked for more opportunities in other fields with higher
salaries.
Summary on Performance
Adversity quotient according to Stoltz has a positive influence on performance
at work in ones society, workplace (Lazaro, 2004) and self. Effective principals
focused their work on learning, teaching and continuous school improvement
(Schmoker, 2001). The performance indicators of a principal were about skills,
beliefs, and knowledge to improve student’s achievement. Five critical leadership
skills to effectively lead a school were discussed. The current evaluation that may be

lxii
employed to a principal is the 360-degree feedback system which involves peer, self,
supervisor and subordinates (Waldman et al, 1998; Pfau & Kay, 2002).
A study showed that principalship is an aging profession (Gates et al,2001) that
many schools have. Another study also revealed that high school principals have
more severe problems than in elementary. Private schools with religious affiliation
have fewer problems than non sectarian schools. There was also a study that showed
how attitudes of administration had an effect to the school performance of pupils.
The introduction of accountability system improved student’s performances
and other school outcomes. School outcomes are reflected in the principal’s
performance. Accountability is associated with an increased result in standardized
test scores. Principals affect students’ achievement through the choice of curricula,
evaluation of teachers and allocating teachers’ time.
Summary on School Practices
The sources of principals’ school practices are theories of supervision.
Sergiovanni, 1989 enumerated the principal’s job that can establish a successful
school. The principals current educational changes caused pressure and to encounter
them leader must possess skills to manage change and create collaborative action. A
study on the innovation and innovative practices by Ortiz in 2007 showed that there

lxiii
was a positive response to innovation and those that resist change are those who do not
update professional competence.
Administrative practices were examined from the perspective of science
teachers and administrator (Dalisay, 2007). Effective practices were noted from the
study on students’ development, promoted teamwork and collaboration among
teachers, politeness and thoughtfulness on community, use of science laboratory and
facilities, and the criteria for promotion.
Conceptual Framework
Figure 2 - Conceptual Framework showing the relationship between Adversity Quotient, Leadership style, Performance, and Practices of Private School Principal
Principals’
• Leadership Style Participating Delegating Telling Selling
• Performance • Practices
Principals’ Adversity Quotient
• Control • Ownership • Reach • Endurance
Characteristics
of an Ideal
Principal

lxiv
The principals’ adversity quotient measures how one responds in the face of
difficult problems encountered in school which can be understood, and changed. This
AQ begins with individual’s behavior and it encompasses four dimensions of control,
ownership, reach and endurance. The control theory (Podsakoff & Farh,1989) affect
their performance. Ownership and origin has something to do with accountability
which influence leadership. Reach dimension assess how far adversity affect areas of
life usually leading to poor decision making and distancing oneself to others (Bandura,
1995) that can affect leadership. The endurance dimension of AQ (Peterson, Seligman
et al, 1993) responds to the time adversities last which can affect performance and
practices.
The individual’s AQ possess by the principal will indicate the kind of
leadership style that can be applied based on the behavioral approaches of leadership.
The leadership style adopted by the researcher was based on the behavioral approach
of Hersey and Blanchard, 2001 which are participating, delegating, selling and telling.
With high adversity quotient, the principal can apply suitable leadership style,
performance can be effective, and in due course discover new practices for private
school in the province of Rizal. Eventually the characteristic an ideal leader will be
apparent like what Milwee, 2001 experienced of a leader after encountering various
adversities. These characteristics are purpose driven, persistence, self knowledge,
perpetual learner, focus and positive role model.

lxv
Research Hypothesis
To answer problem statement number 4 and 5, the following hypothesis are
formulated:
1. There is a significant correlation between the adversity quotients of the
principal respondents and their leadership style.
2. The adversity quotient and leadership styles of the principal respondents
have a significant correlation with their demographic profiles.
Definition of Terms
To further understand the study, the following terms were defined
operationally:
Adversity – any difficulty or hardship that an individual encounters arising from the
workplace which is the school.
Adversity Quotient (AQ) ®– this refers to the total score obtained on the Adversity
Quotient Profile developed by Dr Paul Stoltz version 8.1 (2009) as a measure
on how one handles adversity.
Adversity Quotient® Profile– a self rating questionnaire on-line designed by Dr. Paul
Stoltz, 2009 to measure an individual’s style of responding to unfavorable
situations and consisted of four dimensions.
o Control – a measure of the degree of control one has over a difficult event.

lxvi
o Ownership – a measure of the extent of origin and ownership of the difficult
situations, ones responsibility and accountability for improving the situation.
o Reach – a measure of the degree on how good and bad events get in touch into
other areas of life.
o Endurance – a measure of length of time over which good and bad events and
their consequences will last.
Leadership - is the manner by which a principal exerts influence over his/her
subordinates and inspires, motivates and directs their activities to achieve
group or organizational goals.
Leadership style is the conduct and approach of providing direction, implementing
plans and motivating people. In this research it refers to the scores measured
by the leadership questionnaire developed by the researcher. This was
classified by Heresy and Blanchard (1982, 1988) into four styles:
o Telling Style – a leader who makes all the decisions and passes the directives
to subordinates who are expected to carry these out under very close
supervision.
o Selling Style– a leader who present ideas and allows subordinates to make
some decision- making
o Participating Style – a leader offers guidance to subordinates and encourages
them to participate but retain the final say over the decision – making process.

lxvii
o Delegating Style – a leader offers little or no guidance to group members and
leave decision-making up to group members.
Performance is the method on how one accomplish ones task
Practices refer to the way(s) how one carries out the task
Principal refers to the private school leader of the teachers and the students and also
named as academic coordinator in other private school
CHAPTER 3
RESEARCH METHODOLOGY
Research Design
The study utilized the quantitative and the qualitative methods of research.
In the quantitative aspect, the researcher employed the descriptive-correlational
method of research to determine the relationship of adversity quotient and leadership
style of the principal respondents.
The qualitative aspect looked into the performance and practices of the
principals. An open-ended ten item interview questionnaire (see Appendix I) was
used to gather all the individual experiences developed a pattern whereby themes
emerged. Insights have been drawn from the responses to the interview questionnaire

lxviii
of the forty seven (47) principal-respondents that were added which were related to the
problem statements.
Sample
The sample consisted of forty (40) private schools in the province of Rizal with
forty seven (47) principals during the school year 2008-2009. Large schools have two
principals, one in the grade school and the other in the high school. The schools were
randomly selected from the list of private schools provided by the Department of
Education, Region IV-A through the schools Division Superintendent, Division of
Rizal and the endorsement letter of the Catholic Schools Superintendent in the
Diocese of Antipolo.
Table 1 showes the forty (40) private schools that were randomly selected and
classified by the researcher into three (3) school categories such as large, medium and
small school based on students’ population.
Table 1
Selected Private Schools in Rizal
School Category
Students’ Population
Number of Private Schools
Number of
Principals Large 1001 above 12 18 Medium 501 - 1000 8 9 Small 100 - 500 20 20 40 47

lxix
The students’ population in basic education included the high school and grade
school levels. These were the students enrolled in school year 2008-2009 based on the
official record of the Department of Education, Region IV-A, Rizal and the school
itself.
These selected private schools were located in the different towns and two (2)
cities of the province of Rizal. They were already in existence for more than ten
years. The researcher observed that there were more small schools than medium and
large schools. She further observed that the location of most small schools were near
students’ houses or within the subdivision where the population is denser. The
medium schools and large schools were located closely to churches or municipal
offices.
In Table 2, the different towns of the province of Rizal were enumerated and
the corresponding schools with whom the researcher took randomly are located.
There are two cities in the province of Rizal, Antipolo City and Marikina City where
the sample schools were classified as large school. The sample private schools
consisted of sectarian and non-sectarian schools. Sectarian schools were either
Catholic schools or Christian school while non-sectarian school is privately owned.

lxx
Table 2
Location of Respondent Schools
TOWN/ CITY IN RIZAL PROVINCE
SCHOOL NUMBER OF SCHOOL
NUMBER OF PRINCIPAL
1. Angono Angono Private School Colegio de San Clemente Holy Deliverance
3
4
2. Antipolo City Faith Academy Our Lady of Peace
2
3
3. Baras Conception Montessori 2 2 4. Binangonan Binangonan Catholic College
PBTS Zion Hills
3
4
5. Cainta Cainta Catholic College Colegio Sto Domingo Day Spring Faith Christian Greenland Academy Lorenzo Ruiz Magis Academy Morning Dew Pilgrim Baptist Sacred Heart School Scholastica St Francis
15
17

lxxi
Valley View Academy Westleyan Zion Center
6. Marikina City Marikina Catholic School Our Lady of Nativity
2
3
7. Morong St Gerome’s Academy Thomas Claudio Memorial College
2
2
8. Rodriguez Sacred Heart 1 1 9. San Mateo Nuestra Señora de Aranzazu
Sta Cecilia Parochial School St Matthew College
3
4
10. Tanay St Therese School 1 1 11. Taytay Harris Memorial College
San Beda College Sienna College Sumulong Memorial School St John Parochial School
5
5
12. Teresa St Rose of Lima 1 1 TOTAL 40 47 The demographic profiles of the principal respondents presented in Table 3
includes the age, gender, civil status, post graduate study, and length of service as
faculty and principal.
These demographic profiles of the principal respondents have provided several
information. During the time the researcher gathered data, it came out that majority
of the principals were at age group 50 years old and above. This was attributed to the
existing capacity of the principal such as experiences, knowledge, talents and
everything one acquired as one grows in career that developed their leadership
qualities (Stoltz, 2004). Prior to becoming principals, they have experienced various
adversities which were viewed as opportunities disguised as challenges (Haller, 2005).
The level of maturity has something to do with age (Korman, 1975; Hersey &
Blanchard, 1982) in accepting the principalship and its task.

lxxii
The female principals outnumbered the male group. Educational roles
according to Law and Glover (2001) were mostly inclined toward people and
relationship that are valued by women to fit family life into their careers whereas men
preferred task orientation working for money and always looking up for career
advancement. Male and female are different emotionally (Goleman, 1995) and as
such tend to respond differently to adversity (Stolts, 1997). Developing strong
leaders and more women entering principalship became an issue not only in Stanford
Educational Leadership Institute (2007) studies but also in the province of Rizal.
Table 3
Distribution of the Respondent- Principals as to Demographic Profile
Demographic Variables
Frequency
Percentage
AGE GROUP: 29 years & below 30 -39 40-49 50 & above TOTAL
0 6
18 23 47
0
13 38 49
100 GENDER: Male Female TOTAL
14 33 47
30 70
100 CIVIL STATUS: Single Married Widow/ widower TOTAL
6
36 5
47
13 76 11
100 POST GRADUATE: Masteral Units MA Ph.D. Units Ph.D. TOTAL
29 13 3 2
47
62 28 6 4
100

lxxiii
LENGTH OF SERVICE: As Faculty: 5 years & below 6-10 11-15 16-20 21 yrs & above TOTAL
8 4 4 6
25 47
17 9 9
12 53
100 As Principal: 5 years & below 6-10 11-15 16-20 21 yrs & above TOTAL
19 14 3 3 8
47
41 30 6 6
17 100
Regarding civil status, married principals lead with thirty (36) respondents.
The researcher noticed that married principals developed more passion in performing
their job. These principals are more committed to their position that the effect of the
accumulated workplace adversities instigated to improve their performance.
It was noted that all of the principals have pursued their continuing studies as
shown in the post graduate profile. Updating knowledge leads one to be motivated and
accept change (Bennis, 1990; Covey, 1989). Principals were faced with constant
change that calls to upgrade knowledge and skills (Stoltz, 2000).
Teaching experiences for twenty (20) years and above seemed to be the norm
for ensuring that the principals have acquired the necessary people and technical skills
before they were positioned. The past experiences are good motivation to consider in
seeking meaning and accomplishment in one’s work (Schein,1965). Unfortunately the
researcher observed that the current principals have entered the principalship at their
later age and have very limited time to their position. Like the study of Gates et al

lxxiv
(2001), many first time principals are close to retirement age and therefore schools
should consider thinking on how to reach out to younger principal.
Research Instrument
The researcher designed three (3) instruments and used one (1) electronic AQ
questionnaire, a total of four instruments that were employed to gather quantitative
and qualitative data. The instruments were as follows and consist of four parts:
Part I is the personal profile of the principal such as her name, school, address,
position in the school, other administrative position, highest educational attainment,
age, gender, civil status, eligibility, years in service as faculty and as principal, total
number of faculty and student population shown in Appendix B.
Part II is an instruction on how to log-on the electronic form of adversity
quotient profile of Dr. Paul G. Stoltz,2009 in his latest AQ®P online version 8.1
(Appendix C). This is a self rating instrument that measures an individual’s style of
responding to adverse situation and measure ones adversity level. It takes most
respondents 7-10 minutes to answer the questions on line. The AQ®P presents 14
scenarios or events, each of which is followed by four questions to be responded to on
a 5-point Likert scale. The updated descriptive interpretations of AQ®P scores were
sent by Stoltz, 2009.
New Overall AQ Score Equivalent
High 177-200 Above Average 165-176 Average 145-164

lxxv
Below Average 134-144 Low AQ®P scores ranges from 40- 133
Each of the four questions was represented and was scored on a distinct dimension of
adversity quotient as Control, Ownership, Reach and Endurance. The CORE
equivalents was also sent by Stoltz, 2009 to interpret principals’ AQ dimensions.
CORE Score Equivalents
CONTROL C
OWNERSHIP O
REACH R
ENDURANCE E
High 49-50
High 50
High 40-50
High 43-50
Above Average 45-48
Above Average 48-49
Above Average 35-39
Above Average 39-42
Average 38-44
Average 43-47
Average 29-34
Average 34-38
Below Average 34-37
Below Average 39-42
Below Average 24-28
Below Average 29-33
Low 10-33
Low 10-38
Low 10-23
Low 10-28
C mean =41 O mean =45 R mean=32 E mean=36
The lowest possible score on AQ®P score is 40 and the highest is 200. For
the purpose of the study, a temporary link [private URL] was provided. The
principals have to submit their full name and e-mail address. The linkage provided
has limited time for use. Reliability of the AQ instrument provided were: AQ -
0.91, Control -0.82, Ownership-0.83, Reach-0.84 and Endurance-0.80.

lxxvi
Part III is the leadership indicators (Appendix D), a questionnaire on
leadership style developed by the researcher to suit in her study. It has fifty statements
about leadership behaviors. This was content validated by a research expert. A scale
was provided to allow the respondent to decide where they fit. This leadership style
questionnaire was validated by a statistician and has a reliability of 0.79.
Part IV is the interview questionnaire to the principal respondents which
consists of ten questions regarding their understanding of adversity, its effect on
their performance and practices, and the effect of adversity towards school
improvement disclosed in Appendix E.
Data Gathering Procedure
The researcher sought permission from the Department of Education in the
province of Rizal, Region IV and the Superintendents of Catholic Schools in the
Diocese of Antipolo through a formal letter presented on Appendix A. Upon approval
during the month of September, 2008, the researcher started visiting the 50 schools
and presented the request to each Director or the school principal. It took the
researcher a minimum of 1-2 days to retrieve the data from one principal alone.
Communications through the internet with the author of Adversity Quotient
Profile, Dr Paul G. Stoltz at Peak Learning, Inc. California were frequently made for
the approval of the use of his instrument (Appendix A4). The researcher resorted to
signing an agreement sent and faxed it back to the address provided (Appendix A3).
The adversity response profile (ARP) instrument was revised to adversity quotient

lxxvii
profile (AQP) when the approval of the use was granted. On October, 2008, the link
to use was granted but advised the researcher that it will be closed in December 30,
2008.
During the two month period, only 23 principals answered the on line
questionnaire upon retrieval of the results on February 2009. On this regard, the
researcher found out her initial worry that not all principal respondents have access to
internet and possess an e-mail address. Immediately the researcher sought advice on
how to obtain the questionnaire again. The portal was reopened until April 30, 2009
and for the principals who have no e-mail address, the researcher printed the on line
questionnaire and allowed the respondents to answer. The researcher encoded the
result for them until she finally have the results of the 47 principals on May 1, 2009.
The school visitation done by the researcher included an interview with the
principals to gather relevant information regarding adversities in education, their
performance and practices.
Data Analysis
The survey data were analyzed using the Statistical Package Software (SPSS
version 10.0) and Microsoft Office Excel 2003 to generate descriptive data (means,
standard deviation and percentage distributions) and comparative statistics. The
Adversity Quotient Profile of the principal was tabulated including their four
dimensions: Control, ownership, reach and endurance exhibited in Appendix F.

lxxviii
Appendix H revealed the leadership style applied by the private schools
principals in Rizal province which are telling, selling, participating, and directing.
Descriptive statistics was employed in describing the profile of the principal
respondents, the adversity quotient, and the leadership style Frequencies and mean
scores were used in analyzing most of the data.
The researcher used inferential statistics in determining the relationship
between AQ® and leadership styles; AQ® with performance and practice. Chi - square
test was used for determining the correlation of AQ®, leadership styles and
demographic profiles.
The responses of the forty seven principals in the interview were used in
analyzing qualitative data to strengthen support to the quantitative findings of the
adversity quotient, leadership style, performance and practices.

lxxix
CHAPTER 4
PRESENTATION, ANALYSIS, AND INTERPRETATION OF FINDINGS In this chapter, the findings were presented, analyzed and interpreted according
to the sequence of the specific problems posed in Chapter 1.
Adversity Quotient Profile of the Principals Respondents
Daily adversities affected all the principal respondents as they performed their
responsibilities. The principals’ adversity quotient determined whether he/she can
stand strong and true, continue to grow or be destroyed when face with adversity. The
online version 8.1 (Stoltz,2009) of Adversity Quotient Profile (AQ®P) which is the
only known standardized instrument, measured how the forty seven (47) school
principals responded to unfavorable conditions of their schools in the province of
Rizal.
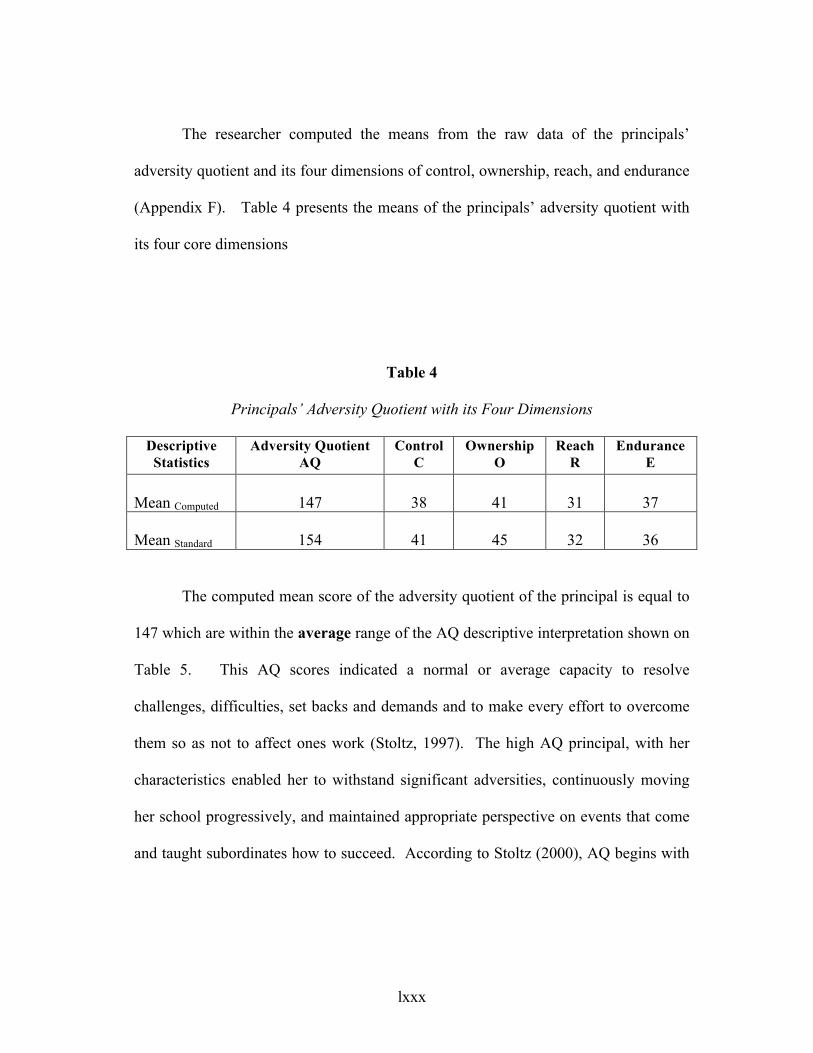
lxxx
The researcher computed the means from the raw data of the principals’
adversity quotient and its four dimensions of control, ownership, reach, and endurance
(Appendix F). Table 4 presents the means of the principals’ adversity quotient with
its four core dimensions
Table 4
Principals’ Adversity Quotient with its Four Dimensions
Descriptive Statistics
Adversity Quotient AQ
Control C
Ownership O
Reach R
Endurance E
Mean Computed
147
38
41
31
37
Mean Standard
154
41
45
32
36
The computed mean score of the adversity quotient of the principal is equal to
147 which are within the average range of the AQ descriptive interpretation shown on
Table 5. This AQ scores indicated a normal or average capacity to resolve
challenges, difficulties, set backs and demands and to make every effort to overcome
them so as not to affect ones work (Stoltz, 1997). The high AQ principal, with her
characteristics enabled her to withstand significant adversities, continuously moving
her school progressively, and maintained appropriate perspective on events that come
and taught subordinates how to succeed. According to Stoltz (2000), AQ begins with

lxxxi
individual but goes beyond as one is exposed to an organization gaining various
experiences.
The computed mean score of the principals’ adversity quotient equal to 147 is
lower than that of the standard mean score of 154, but was found out to be on the same
average descriptive interpretation as indicated in Table 5.
The standard mean score was calculated based on 1743 employees from 26
countries (Stoltz, 2009) while the computed mean score was based only on 47
principals and yet their scores were on the same average descriptive interpretation.
Table 5
The Principals’ Adversity Quotient Descriptive Interpretation
Descriptive Interpretation
Range of AQ
Number of Principal
Percentage
High 177-200 1 2
Above Average 165-176 6 13
Average 145-164 17 36
Below Average 134-144 9 19
Low 40-133 14 30
47 100 Legend: High 177-200 Above Average 165-176 Average 145-164 Below Average 134-144 Low AQ®P scores ranges from 40- 133
Forty nine percent (49%) of the respondents adversity mean scores falls
with in below average to low range. Low AQ characteristics have low levels of

lxxxii
motivation, energy, performance and persistence and the tendency to catastrophize
events (Stoltz, 1997).
Table 6 facilitates as the basis of discussion of the mean of the
CORE dimensions of adversity quotient from Table 4 page 62. The comparisons
of computed and standard scores of control, ownership, reach and endurance are
discussed.
Table 6
CORE Score Equivalents
CONTROL
C
OWNERSHIP
O
REACH
R
ENDURANCE
E
High 49-50
High 50
High 40-50
High 43-50
Above Average 45-48
Above Average 48-49
Above Average 35-39
Above Average 39-42
Average 38-44
Average 43-47
Average 29-34
Average 34-38
Below Average 34-37
Below Average 39-42
Below Average 24-28
Below Average 29-33
Low 10-33
Low 10-38
Low 10-23
Low 10-28
C computed =38 C mean =41
O computed =41 O mean =45
R computed= 31 R mean=32
E computed =37 E mean=36
The four dimensions represented by an acronym of CORE summed up to AQ
scores. C is a measure of the degree of control one has over a difficult event. The C

lxxxiii
mean scores of 38 demonstrated by the principal is a combination of an average score
in control over their performance (Mikulincer, 1994). The principals with this score
according to the study have the tendency to feel helpless in the face of adversity that
affected his/her subordinates (Rotter, 1966; Podsakoff & Farh, 1989). A response of
P-3, one of the principals interviewed stated that when a teacher does not follow her
instruction a more stringent policy on teacher commitment was imposed as a form of
control.
O is a measure of the extent of origin and ownership of the difficult situations.
The O mean score of 41 fell below average range which signified a normal but less-
than-ideal level of responsibility for improving difficult situations. The low scores
could be attributed to the principal who disown outcome of the problem regardless of
their cause (Stoltz, 1997). In an interview with P-3 with regards solution to a problem
she commented “communicate to address problems, avoid finger pointing or blaming
others and take note of the cause for future reference.”
R is a measure of the degree on how good and bad events get in touch into
other areas of life. The R mean scores of 31 were within the average range that when
the principal is faced with adversity can become intense, prolong, and complicated
(Seligman et al, 1993). Majority of the principals respond to challenges as specific
and manageable that do not affect much of their life since according to them they
applied open communication, dialogue and consultation with parents, students and
teachers. P-30 informed the researcher that she gave clear directions and by being

lxxxiv
objective on relationship with teachers to minimize gaps. High R score limits the
contact of the problem at hand and resolve problems immediately.
E is a measure of length of time over which good and bad events and their
consequences will last. E mean score of 37 obtained an average range. This means
that the principal’s perspective under stressful times can be dealt with as it arises
(Bandura, 1995; Werner, 1992). One of the adversity common to principal (P3) noted
from the interview were those teachers who left their post in the middle of the school
year and the solution of (P18) was to be strict in policy implementation, must be well
regulated from the start to the end and not “ningas cogon”. Additionally, one
respondent (P45) said that human resource to review and constantly review the policy
on the faculty manual particularly on the tenure of office.
The researcher observed further that the principal (P-27) with the highest AQ
score (200) and CORE dimensions score (50 each) supervised a medium sized school.
Further review of her qualifications revealed that the high AQ principal was an early
retired public school principal, an experienced teacher, single, MA holder who
devoted her life in school setting both in public and private.
The principal (P-25) with a lowest AQ score of (119) handled a large school
and has the same profile with that of the high AQ principal except that she is married
and was assigned as principal for less than six years in that same private school. The
low AQ principal also has the lowest endurance score among the respondents. With
low E score, the principal may feel that adversity will never end and its cause will last
long. The three principals having the lowest scores in control (29), ownership (24)

lxxxv
and reach (14) supervised large and medium schools also have low AQ. The
principal with the lowest control dimension always think that her problems will not
last, the principal who obtained low ownership practiced blaming oneself and others
for bad events, and low reach principal has always panicky feelings when confronted
with problems.
Detailed analysis and interpretation of the Principals CORE dimensions
descriptive equivalent is disclosed in Table 7. The lower portion of Table 7 is the
standard mean provided by Stoltz, 2009 so the researcher can compare her computed
local means.
The descriptive interpretations of data for control, reach and endurance
obtained average except for the ownership dimension whose score got below
average. Control score of (38-44) indicated a normal but less than-ideal tendency to
see oneself as having a limited level of influence toward others. The principals having
this score sometimes perceived that things were out of their control even when they
can positively influence the situation. The higher C- score the more the principal was
able to influence a situation and take a meaningful action (Stoltz & Weihenmayer,
2006).
Ownership score of (39-42) fell on the below average range which showed a
normal but less than ideal level of responsibility for improving difficult situations.
Higher O- score made things better while low score cause one to deflect accountability
and blame others (Seligman et al, 1993; Stoltz, 1997, 2004).

lxxxvi
Reach score of (29-34) demonstrated an average range to which the principals
allowed setbacks and distances adversity gets into ones life. When hard times became
intense, prolonged or complicated, they may have the tendency to panic.
Endurance score of (34-38) stands for an average range where principals on
this dimension accepted problem that can be resolved within their capacity. The
higher E dimensions score the quicker one see and respond to the demands while those
with lower E score adverse event drags longer.
Generally, comparing the four core dimensions, it is only the ownership dimension that was categorized under below average. Nobody attained low score in endurance dimension on Table 7. This indicated that principals’ exercised patience
while performing their task and considered problems as something temporary and will somehow end. All the principals have several solutions to address educational
adversities that they encountered as divulged in Appendix I Question-4. The control score for both computed and standard is with in the range of 38-44 Peterson, Seligman (1993) interpreted as average. People who respond to adversity
as temporary, external and limited have explanatory styles and tend to enjoy life’s benefit.
The reach score for both computed and standard is with in the range of 29-34 interpreted as average. People with high R-score limit the reach of the problem to the
event at hand. A tough performance appraisal is a tough performance appraisal if not a learning experience.
The endurance score for both computed and standard is with in the range of 34-38 interpreted as average. This would mean that when one is weakened then hope
dwindles. The ownership score for computed is 41 where as for standard is 45. The computed score is below average but is not too far the standard ownership score.
This may also mean that adversity quotient of the Filipino principals is not far
behind the standards as provided by Stoltz in 2009.

87
Table 7
Principals’ CORE Dimension of Adversity Quotient Descriptive Equivalent
Legend: Control Score Ownership Score Reach Score Endurance Score High 49-50 50 40-50 43-50 Above Average 45-48 48-49 35-39 39-42 Average 38-40 43-47 29-34 34-38 Below Average 34-37 39-42 24-28 29-33 Low 10-33 10-38 10-23 10-28
Control
Ownership
Reach
Endurance
Descriptive Equivalent
Range
No. of
Principals
Descriptive Equivalent
Range No. of
Principals
Descriptive Equivalent
Range No. of
Principals
Descriptive Equivalent
Range No. of
Principals
High
49-50 2 High 50 4
High
40-50 9
High
43-50 6
Above Average
45-48
3
Above Average
48-49
3
Above
Average 35-36
6
Above
Average 39-42
10
Average 38-44 16 Average 43-47 16
Average 29-34 10
Average
34-38 17 Below
Average
34-37
13
Below Average
39-42
12
Below
Average 24-28
15
Below
Average 29-33
14
Low 10-33 13 Low 10-38 12
Low 10-23 7
Low
10-28 0
47 47
47
47 C Standard mean = 41 O Standard mean = 45 R Standard mean = 32 E Standard mean = 36

88
Leadership Styles of the Principals’ Respondents
Leading is a human activity that requires human skills (Hersey & Blanchard,
1995). These human skills involve working with and through other people, to
understand why people behave as they do. The researcher believed in the situational
form of leadership by Hersey and Blanchard (1972) that can be adapted even during
this present time. From various occasions, she noticed that every time principals
decide they have to consider the current situation or condition. Likert (1967),
Korman (1975) and Fiedler (1977) have also proven that different leadership styles
require different situations.
Using the Leadership Style Questionnaire developed by the researcher, the
responses were grouped into four classifications as Telling, Selling, Participating, and
Delegating styles of leadership. This leadership style is the conduct and approach of
providing directions, implementing plans and motivating people. The researcher
noticed that each principal respondent answered all the leadership behaviors present in
the questionnaire but using different scale indicated in the raw data in Appendix H.
Table 8 describes the principal’s leadership styles that emerged in this study
from among the forty seven principals in Rizal province. Participating leadership
style has the highest rank, followed by selling, delegating, and telling respectively.
The mean of leadership styles and the total scores were computed in each style.
The principals chose the participating style of leadership as best. The
principal with this leadership style score of 46.30 (rank 1) is characterized of being

89
supportive, always motivate, listen, praise and make their teachers feel good when
they commit and cooperate. Principals (P13 & P39) practiced participative style for
tapping potential teachers to lead in their areas of concern. The principals maximized
the quantity and quality of performance and found out that participating style is an
ideal approach to lead people according to Likert (1967). They offered guidance to
subordinate and encouraged them to participate actively (Lewin, 1939; Tannenbaum,
1959). In giving assignment, the principal was more focused on high relationship with
subordinates than on task and was concerned with finding out why teachers do not
work properly (Heresy & Blanchard, 1982, 1999, 2001).
Table 8
The Principals Leadership Styles that Emerged in the Study
Rank
Style of Leadership
Mean
Total Score
Percentage
1
Participating
46.30
2178
29.33
2
Selling
43.72
2074
27.93
3
Delegating
42.85
2010
27.07
4
Telling
24.79
1163
15.66
Total
157.66
7425
100.00
The mean of 43.72 was obtained by the selling style of leadership and it ranked
second. The researcher noted that the principals presented ideas and allowed teachers

90
to make some decisions. These principals were focused on high task and high
relationship (Blake & Mouton, 1969). They spent time listening, advising, helping
teachers to gain skills and knowledge (Heresy & Blanchard, 1982, 1999, 2001).
Faculty was allowed to know the latest news in their school, and their work is closely
coordinated. The principals have time to interact with their faculty, inspire them with
enthusiasm, enjoy coaching and monitoring, and share leadership power.
Delegating style of leadership ranked third with a mean of 42.85. The
researcher observed that the principal offers little or no guidance to teachers and
empowers them to get on with their job. It is the style as if the principal took a back
seat and appear to do nothing. The principals were willing to make changes but
maintaining a definite standard, they enjoy teachers using creativity and treated
teachers equally. Since responsibility is well delegated the teachers have high
competence, commitment and well motivated. This could be compared to the
classical leadership style as Laissez-faire (Lewin, 1939)
The researcher noted that telling styles of leadership has a mean of 24.75 that
rank 4 which was far behind the three other styles. Telling style of leadership got the
lowest rank because subordinates do not like principal who is a “dictator”. The
principals here took a highly directive role and told teachers what to do (Lewin, 1939).
Sometimes the teachers do not listen, do not agree at once, and do not support the
principals who were always fond of giving directions. The teachers lack willingness
to work and become afraid to try new ideas for they do not want to be blamed
although the principals supervise them closely.

91
Table 9 summarizes the principals’ leadership style behaviors from the
questionnaire developed by the researcher. The behaviors displayed by the principals
were the major behaviors that characterize the kind of leadership styles they put into
practice. Review of leadership literatures originally named telling as directing and
even in the classic time as authoritative; selling as coaching; participating as
supporting or joining; and delegating as observing.
All the cited behaviors under each column (Table 9) of the leadership styles are
primarily practiced even at this time. It was noted that all styles of leadership of the
principals incorporated maturity based on how ready and willing their teachers
perform their task when competence and motivation are considered.
To supplement the researcher’s idea on the leadership style the principals
presently applied on their respective schools the following were documented from
their responses in interview Question 7, Appendix I. Principals (P1, P10 & P15)
responses were delegate task according to their area of concern; collaborative
(shared leadership) by (P2, P3, P4, P41, P42); democratic to empower the
coordinators in what they do (P6, P15, P17, P21, P34 & P44), authoritative,
transformational by P5 & P16; consultative that before implementation of a new
project meetings are held for orientation P22; P38 used an open door policy ;
situational and authoritarian P7; hands-on P23; Christian and democratic leadership
for God’s leading of the task by P27 & 46 .
All these kind of leadership styles applied by the principal respondents often
requires situation before it is being employed.

92
Table 9
The Summary of Principals’ Leadership Style Behaviors
Telling Selling Participating Delegating Rank ( Directing) Score (Coaching) Score (Supporting) Score (Observing) Score
1 Prepare curriculum 164 Let subordinate know 174 Evaluate situation 180 Enjoy to use creativity 184 2 Retain final decision making 146 Work is coordinated 173 Committed to develop 177 Willing to make changes 180 3 Have rules but do not enforce 120 Interact with faculty 172 Listen to both sides 177 Appreciate others can lead 178 4 Do not agree to other objective 101 Allow to vote 171 Encourage to participate 175 Maintain definite standards 178 5 Tell a procedure 97 Inspire enthusiasm 169 Ask about their vision 169 Treat subordinate equally 172 6 Don’t allow new faculty decide 95 Closely monitor 166 Have knowledge 169 Delegate responsibility 171 7 Direct / Threaten to achieve 90 Share my leadership power 166 Remain calm 168 Implement new procedure 171 8 Have not supported faculty 76 Ask for ideas and input 164 Assign duties 167 Take full charge 170 9 Use coercion to motivate 73 Enjoy coaching 164 Work with subordinate 166 Create Ownership 165
10 Do not consider suggestions 71 Act as spokesman 158 Allow to set priorities 160 Concur to self direction 154 11 Implement latest fads 70 Tell what is to be done 150 Call meeting 159 Hold accountability 150 12 Do not listen 60 Tell not to make a mistake 131 Enjoy reading books 156 Find it easy to solve 137 13 Do not agree to seek 116 Agree each define job 155 Total 1163 2074 2178 2010
Highest Telling Score =164 Highest Selling score =174 Highest Participating score= 180 Highest Delegating score = 184 Lowest Telling Score = 60 Lowest Selling score = 116 Lowest Participating score = 155 Lowest Delegating score = 137

93
The Adversity Quotient Profile and Performance of the Principal - Respondents
The Principals’ performance in the school is an important measure of success
or failures for students and teachers. The previous studies done on adversity quotient
reflect relationship with performance (Stoltz, 1997; Williams, 2003; Capones, 2004)
and indicated a positive influence of adversity quotient on performance at work. The
ability to handle difficult conditions at work influence ones work and performance.
The researcher during her school visitations became aware that barely few
principal respondents have formal evaluation for rating ones performance. The
interview questionnaire designed by the researcher was used to answer the problem
statement concerning performance and practices and was analyzed using the
qualitative approach in research. The qualitative data were obtained from the
interview carried out by the researcher among the forty seven principal respondents
who were willing enough to answer the question asked.
Performance
The principals have to answer the interview question on how they define
adversity in education (Question 2, Appendix I) first so that they could understand
well its meaning before proceeding to their performance. Principal 6 said that
adversity in education is “any situation that hinders the realization of goals and vision
of education”, P-3 referred to it as “circumstances that hampers school operations”,
according to P-25 “would mean opposing practices or opposing faces that causes

94
harmful interferences in the realization of education objectives”, P-33 considered
“insufficient funds to carry on the school task”, P-32 emphasized the effect of “the fast
technology in education learning behind the teachers” and even administrators. These
principals’ responses are representation of what most principals answered.
Interviews regarding the specific adversities that affected the operations of
their schools were described by the principals (Question 3, Appendix I). Patterns
appeared and themes were produced as the researcher grouped the principal’s
responses. The economic crises cited by P-34 brought about by higher inflation rate
affected the budget for the operation of the school and there was a decline in
enrollment (P-38). The lack of facilities for teaching-learning process and limited
space for school grounds are forms of adversity that principals usually encountered
(P-39). The teachers leaving their teaching post at the middle of the school year
without prior notice according to P-3 also hampered the operation. The frequent
declaration of so many special holidays by the government and also due to typhoon
which causes flood resulted to additional school days required by the Department of
Education as observed by P-9. The relationships of principals and teachers have
affected students when noticed by P-30 that their teachers are not valued well. There
were also growing number of undisciplined, hyperactive students and low achiever
students according to P-27 & P-28 even mentioned the increasing number of third sex
students.

95
There were four (4) themes that surfaced out of the interview with the
Principals made by the researcher on Question 5, Appendix I as regards to their
performance faced with the specific adversities mentioned. The forty seven responses
were grouped into similar pattern and were clustered according to the major topic that
arise called theme. These themes are the Personality of the principal, Association with
colleagues, Workplace relationship and Effectiveness in performing their task. The
acronym is PAWE. At the end of each theme the researcher gathered the
corresponding adversity quotient of the principals who responded and compared result
with the AQ mean obtained from Table 4 on page 62.
The distinguishing personality of the principals that came up was behaviors
learned through the self-efficacy theory of Bandura (1995). This is the belief in the
mastery of ones life and the ability to meet challenges as they arise. This was
explained by P-34 that as principal I tried to study and find solution to adversity. The
principals who possess self-efficacy bounce back from failures that they approach
things in terms of how to handle them rather than worrying about what can go wrong.
P-21 even said that it makes me stronger and better equipped in solving adversities.
Resilience is the ability to adjust easily to change Werner (1992) and P-20
stated that she became hardworking, (P-8) and being more diligent (P-1). Table 10
showed the personality of the principal’s responses with an AQ mean of 145. This
was compared with the principal’s AQ mean of 147 from Table 4 p.62. A negative
difference of (-2) indicate that personality of the principal is not considered when
performing their task.

96
Table 10
Personality of the Principal- Respondents
Responses of Principals AQ Comparison Difference Personality of the principals
P1 - enable me to be more diligent P20 - hardworking P8 - industrious in any work P3 - makes me more determined to control, makes me creative P34 - resolve and overcome challenges P21 - make me more stronger and better equipped P5 - becomes more vigilant P6 - gives me more wisdom in handling such situation P7 - not being bias or unfair P46 - improve my instruction P30 - learn to improve oneself P44 - take things positively, I face these as opportunities to function better
154 165 121 139
126
135
171 138
134 143 155 162
Principals’ AQ mean from Table 4 p. 62
Negative Result
Average AQ of Principal 145 147 -2
The principals relate works through teachers and staff. These are manifested in
their association with colleagues and subordinates. The social cognitive theory of
Bandura (1991) views people as self-organizing, proactive, self-reflecting and self-
regulating. Principal (P12) scheduled coaching and practices while, P26 carried out
meeting with faculty and staff. Principal (P27) encouraged faculty and guidance
counselors to assess and provide necessary program and activities for the students
third sex (either boy or girl) behavior and considered health concern (P33), developed
us to function well in our assigned task (P4), become more aware that planning your
works makes perfect (P47) and improved student learning (P41). Principal (P17)
stated that “concern with people, cannot be done alone”.

97
Table 11 presents the adversity quotient of the principals regarding association
with colleagues. The result was an AQ mean of 154.3 and was compared with the
principal’s AQ mean of 147 from Table 4 p.62. A positive difference of (7.3)
suggests that the association with colleagues has high impact in doing ones task as a
principal if AQ is considered.
Table 11
Association with Colleagues of Principal- Respondents
Responses of Principals AQ Comparison Difference Association with Colleagues
P34 - investigate and make solution to the problems P10 - continuous revision of curriculum based on DepED P12-schedule coaching & practices P26 - carry out meeting with faculty P27 - encourage faculty and guidance counselors to study reasons and ways to support the third sex students P33 - health concerned P4 - develop us to function well P47 - became more aware that planning your works makes perfect P41 - improve students learning P17 - concern with people
126
140
160 156
200
170 131 145
165 150
Principals’ AQ mean from Table 4 p. 62
Positive Result
Average AQ of Principal 154.30 147 7.30
The workplace relationship and the organization itself were involved here.
Empirical research confirmed that schools that performed well have a strong and
effective organizational culture (Westhuizen et. al. 2005). The principal (P43)
informed the researcher that they always review relationship with faculty and school

98
community, provide skills and programs in dealing with hyperactive students (P21),
work closely and coordinate with Human Resource Office (P29 & P31). A suggestion
by P42 was made to have an inclusion of value-based in the job description and (P36)
strict implementation on lesson plan. There’s a need to adjust and be flexible when
problem arises according to P38.
Table 12 illustrates the adversity quotient of the principals who were
concerned with the workplace relationship. The result was an AQ mean of 149.3.
This was compared with the principal’s AQ mean of 147 from Table 4 p.62 whereby a
positive difference of (2.30) was obtained. This indicate that workplace relationship
increase the performance of principals with high AQ.
Table 12
Workplace Relationship of Principal- Respondents
Responses of Principals AQ Comparison Difference Workplace Relationship
P43 - review relationship with faculty and school community P27 - provide skills and programs in dealing with hyperactive students P29 - work closely with Human Resource P31 - coordinate with Human Resource P42 - suggestion to include value- based in the job description P36 - strict implementation on lesson plan as requirement P38 - there’s a need to adjust and be flexible when problems arises
144
200
126
156
143
146
130
Principals’ AQ mean from Table 4 p. 62
Positive Result
Average AQ of Principal 149.30 147 2.30

99
Effectiveness is considered when principals’ performance is concerned. A
principal (P44) stated that she faced adversity as opportunities to function better and
take things positively. Other principal, P18 said that inconsistency in the
implementation of policy caused pressure and appropriate guidelines should be made
like “faculty manual as guide” P13 stated that there is a need to evaluate academic
performance, schedule activities according to (P9), justify to management the
importance of facilities (P32), constant review on budget (P11) / financial matter
(P16), time management (P14) / consumed to much time entertaining questions,
continuous research on policy (P35), a need to adjust and be flexible to solicit the
support and cooperation of parishioners and the church authority (P39) and develop
an effective approach to classroom management (P42).
Table 13 presents the adversity quotient of the principals on effectiveness. The
AQ mean of 147 was compared with the principal’s AQ mean of 147 (Table 4). The
AQ mean in effectiveness was equal the principal’s AQ mean of 147 which signified
that a principal with high AQ also perform well.

100
Table 13
Effectiveness of Principal- Respondents Responses of Principals AQ Comparison Difference Effectiveness
P44 - opportunities to function better P18 - inconsistency in the implementation of policy P37 - faculty manual P13 - evaluate academic performance/ low enrollment P9 - schedule activities P32 - justify to management the importance of facilities P11 - constant review of budget P16 - financial matter P14 - time management P35 - continuous research on policy P39 - need to adjust and be flexible to solicit support and cooperation P42 - effective approach to classroom management
162
164
145 165
150 159
155 121 134 132 132
143
Principals’ AQ mean from Table 4 p. 62
Equal Result
Average AQ of Principal 147 147 0.00
Table 14 summarize the principals’ performance with its overall interpretation
having a positive relationship with adversity quotient.
Table 14
Summary of Principals’ Performance
Principals
AQ Comparison Difference
Personality of the principals Association with Colleagues Workplace Relationship Effectiveness
145
154.3
149.3
147
Principals’ AQ mean from
Table 4 p. 62
Positive Result
Overall Average 148.9 147 1.90

101
The Adversity Quotient Profile and Practices of the Principal-Respondents
The principals’ practices are based on different theories of supervision that will
create a more effective way to carry out their position (Sergiovanni, 1989). They
build a practical and meaningful programs to face up, struggles and accept a more
complex view of supervision and evaluation. Oftentimes, the principals based their
practices on the assumption that predetermined solution exist for most of the problems
they face in the form of research-based theories and techniques.
Sergiovanni (1989) cited that the problem with management theory as well as
educational theory is that they are always applied to practice directly when they should
be more appropriately used to inform practices. Principalship is a logical way of
problem solving or as the application of standard techniques to predict problems or
maybe a process of ‘managing messes’. Principal typically works in an environment
characterized by limited resources, time, available staff and space. The principal’s
job – to coordinate, direct and support the work of other is accomplished by defining
objectives, evaluating performance, providing the necessary resources, building a
supportive psychological climate, running interferences with parents, planning,
scheduling, bookkeeping, resolving teachers conflicts, handling students’ problems,
dealing with the district offices and otherwise helping to keep the school running
effectively day by day, and improving its ability to achieve its objectives.

102
The different principal respondents among private schools shared their various
school practices when interviewed about the practices they use for their school
improvement on Question 9, Appendix I. The researcher organized the forty seven
responses according to major topics referred to as the theme that appeared. The
current practices today of school were present in all the schools she visited. The
principals’ primary concern was the development of a clear vision mission statement
for a defined direction of the school and all its stakeholders. Other major responses
were focused on students, teachers, administration, community partnership, seminars
and curriculum.
Presently, individual schools’ practice is centered on student - teacher and so
the following responses of principals’ practices were gathered. The students were
mostly empowered thru active involvement in school affairs described by P10.
Students-learning is promoted by qualified teachers who adapt instruction to students’
needs and correct misconceptions encountered in the learning process expressed by
P14. The students were provided by their teachers’ feedback of their progress
/regress stated by P1&P13.
Table 15 shows the responses of the principals concerned with student -
learning whose total AQ resulted to an average 151.4 and was compared the AQ mean
of 147 (Table 4 p.62) having a positive difference of 4.4. This result could represent
that the principal who is teacher- student centered is more focused on student- learning
outcome.

103
Table 15
Principals’ Responses with regards Student-Learning
Responses of Principals AQ Comparison Difference Student Learning
P10 - active involvement in school affairs P14 - student learning is promoted by qualified teachers who adapt instruction to students needs P18 - adapt instruction to students’ needs and correct misconceptions encountered in the learning process P1 - students’ were provide by their teacher feedback of their progress P13 - feedback progress/ regress
140
134
164
154
165
Principals’ AQ mean from Table 4 p. 62
Positive Result
Average AQ of Principal 151.40 147 4.40
The teachers were empowered (P32) mostly by their principals to work
together to carry out instructions and plan well the curriculums (P26), the formulation
of school wide plan (P41). Research is part of a teacher’s task to improve his/ her
teaching skills (P37). Being creative, open and willing to consult (P5) and show
respect for each other were practiced. There is an open line of communication but
exercising discipline (P22). Participative decision making (P27) is encouraged.
Table 16 displays the principals’ responses that empowered teachers whose
total AQ resulted to an average 165.9. This was compared to the principal’s mean of
147 (Table 4 p.62) and has a positive difference of 18.9. The principal with high AQ
give full trust to teachers for working commitment they demonstrated.

104
Table 16
Principals’ Responses with regards Teachers
Responses of Principals AQ Comparison Difference
Teachers
P32 - teachers empowered P26 - teacher work together to carry out instructions and plan well the curriculum P41 - formulation of school wide plan P37 - research is part of teachers task to improve their teaching skills P5 - being creative, open and willingness to consult P22 - open line communication but exercising discipline P27 - participative decision making
159 156
165 145
171
165
200
Principals’ AQ mean from Table 4 p. 62
Positive Result
Average AQ of Principal 165.9 147 18.9
The administration provides orientation /clarification on school's vision-
mission, goals, and objectives (P6 & P25). They have clear faculty manual, personnel
manual, and student manual (P24). They continuously plan for more improvement
through benchmarking for they believe that everything need plan before action
(P30&P31). Everybody is encouraged to share their creativity even using suggestion
box for any ideas for improvement (P15). There is also recognition of personnel for
their contributions to the organization (P28). Different leadership styles are applied
based on the needs of the organization (P29). Regular meetings are held with the
management (P44). The open line communication among the school’s constituents is
practiced for immediate action to problems that need to be acted upon (P22).
Evaluation and feedback system (personnel & activities) are practiced (P23). School
improvement is always identified (P46).

105
Table 17 shows the principals’ responses about their ways on administration.
The total principals AQ resulted to an average 142. This was compared to the
principal’s AQ mean of 147 (Table 4 p.62) and has a negative difference -5. These
implied that principals concentrated most of their activities within student learning,
teachers and personnel that in terms of management they no longer introduce new
ideas.
Table 17
Principal Responses about Administration
Responses of Principals AQ Comparison Difference Administration
P25 - provide orientation/ clarification on school’s VMG P6 - VMG goals and objectives P24 - have clear faculty, personnel and student manual P30 - continuously plans for more improvement through benchmarking P31 - believe that everything need plan before action P15 - encouraged to share creativity even suggest in the suggestion box P28 - recognition to personnel for contribution to the organization P29 - different styles of leadership are applied based on the needs of the organization P44 - regular meetings are held with management P22 - open line communication among the school’s constituents is practiced P23 - evaluation and feedback P46 - school improvement is always on the call
119
138 133
155
155
154
124
126
162
165
130 145
Principals’ AQ mean from Table 4 p. 62
Negative Result
Average AQ of Principal 142 147 - 5

106
This further strengthened what Sergiovanni’s (1989) cited that principal
typically works in an environment characterized by limited resources, time, available
staff and space. The principal’s job – to coordinate, direct and support the work of
others- is accomplished by defining objectives, evaluating performance, providing the
necessary resources, building a supportive psychological climate running interferences
with parents, planning, scheduling, bookkeeping, resolving teachers conflicts,
handling students problems, dealing with the district offices and otherwise helping to
keep the school running effectively day by day, and improving its ability to achieve its
objectives.
School cannot exist without community partners and linkages. Principals
established active community partnership and linkages with government and non
government organization cited (P11, P33 & P35). Implementations of programs that
will support partnerships (P16) are encouraged. Active involvement of parents and
partner community with the school are also prioritized (P36).
Table 18 reveals the principals’ responses about their community partners and
linkages. The total principals AQ have an average 144.8. This was compared to the
principal’s AQ mean of 147 (Table 4 p.62) and has a negative difference -2.2. These
would entail that Principals create more involvement with community partners and
linkages.

107
Table 18
Community Partners and Linkages
Responses of Principals AQ Comparison Difference Community Partners and Linkages
P11 - established active community partnership & linkages P33 - established active community partnership & linkages P35 - active linkages with government & non-government org P16 - implementation of program that will support partnership P36 - active involvement of parents and partner communities
155
170
132
121
146
Principals’ AQ mean from Table 4 p. 62
Negative Result
Average AQ of Principal 144.80 147 -2.20
To impart latest knowledge to students, teachers and personnel, it is the
practice of most schools to provide regular seminars, teach-ins, and workshops (P39).
In-service seminars, fellowship (P3), use of performance management system (P9),
regular distribution and discussion of teaching resources. Monthly faculty/staff
/student development program is conducted, faculty meeting and encourage
professional readings(P34), trivia discussion on Department of Education
memoranda, solving or giving tips on classroom management, sharing of experiences
and seminar on curriculum enhancement (P2). Non-sectarian school’s sensitiveness in
lesson planning, re-set training, job description organization, and student
organization program (P8). Subjects involve strategies and uses international
curriculum (P4), global in nature.

108
Table 19 merits the principals’ responses about their seminars provided to
students, teachers, personnel and other stakeholders. The total principals AQ have
resulted to an average 137.5. This was compared to the principal’s AQ mean of 147
(Table 4 p.62) and has a negative difference -9.5. The researcher noted that principals
would like to be imparted with various seminars included her subordinates but was not
able to survey on what training needs to apply.
Table 19
Seminars Provided
Responses of Principals AQ Comparison Difference Seminars Provided
P39 - provide regular seminars teach- in and workshops P3 - in-service seminar, fellowship… P9 - monthly faculty/ staff, student development P34 - conduct productive faculty meeting P2 - curriculum enhancements P8 - for non sectarian school sensitiveness in lesson plan P17 - involve higher order thinking skills P4 - uses international curriculum, global in nature
132
139
150
126
151 121
150
131
Principals’ AQ mean from Table 4 p. 62
Negative Result
Average AQ of Principal 137.50 147 -9.50
Table 20 shows the general interpretation of the researcher with different
practices applied by the principals in their schools and their corresponding adversity
quotient obtained a positive result. The average of the entire adversity quotient of
principals’ practices of 148.4 is above the AQ mean of 147 from Table 4 p.62.

109
Table 20
Summary of Principals’ Practices
Principals AQ Comparison Difference Teacher – student centered Empowered Teacher Administration Community Partner Seminars Provided
151.40 165.86 142.00 144.80 137.50
Principals’ AQ mean from Table 4 p. 62
Positive Result
Overall average 148.3 147 1.4
Adversity quotient according to Stoltz (1997) on his several studies has a
positive influence over performance at work in society, workplace and self. This
qualitative study on performance and practices had proven that not only performance
but also practices in school by the principals have attained positive results.
Principals’ Adversity Quotient and Leadership Styles
SPSS software version 10 was used to determine if any relationship existed
among principals’ adversity quotient as measured in the Adversity Quotient Profile
(Stoltz, version 2009) and their leadership styles as evaluated in the Leadership Style
questionnaire that was developed by the researcher.
The Pearson product moment correlation coefficient was used as statistic
descriptive of the magnitude between the principals’ adversity quotient and the
leadership style. From the raw scores of adversity quotient (Appendix F) and the
leadership style (Appendix H) and with the use of SPSS software, the correlation
coefficient r was computed.

110
The correlation coefficient obtained was r = .07 at an ∝ = 0.641 and this
value is within -1 to +1 but too close to zero or -0.1 to + 0.1 and was interpreted as no
significant relation.
Table 21 presents the result of the two test level of significance for two-tailed
and one tailed test to confirm the result that there was no significant relation between
the principals’ adversity quotient and the leadership style.
Table 21
Correlation of Principals’ Adversity Quotient and Leadership Style N=47
Pearson Correlation
Sig (2-tailed) Sig (1-tailed)
Adversity Quotient Profile
Leadership Style
0.070
(∝= 0.641)
0.070
(∝=0.321)
The researcher rejected the alternative hypothesis and accepted the null
hypothesis that there is no significant correlation between adversity quotient and
leadership style.
This reminded the researcher that adversity quotient is a scientifically
grounded set of tools for improving how to respond to adversity resulting to an overall
personal and professional effectiveness ( Stoltz, 1997). When used properly by the

111
individual, AQ is a vital piece of any effort to strengthen leaders and their ability to
prosper in this demanding work environment.
Style of leadership in traditional leadership theory is how you relate to
subordinates. It assumes that the fundamental purpose of leadership is to motivate
employees to work harder and so leadership focus externally and promote services.
Style questions referred to how one inspire subordinate to perform at their best. The
leaders developed styles over a period of time from experience, education and training
(Hersey & Blanchard, 1982). This style is not how the leaders think they behave in
this situation but how others (followers) perceive their behavior.
Principals being the leaders have tolerance for different leadership styles
(Ashby & Miles, 2002). Subordinates wanted to feel that a principal value them and
ask them for their opinions, ideas, and suggestions on how they think work related
problems might be solved. The value would not change, but the application of those
values will change because people are different. Leadership is influencing and not
controlling.
In an effort to clarify further the acceptance of the null hypothesis that there is
no significant correlation between adversity quotient and leadership style, the four
dimensions of the adversity quotient was correlated with the leadership style in Table
22.

112
Table 22
Relationship of the Principals’ Adversity Quotient and its Four Dimensions with Leadership Style
Among the four dimensions of adversity quotient only the reach dimension has
a significant relation with leadership style. It has a coefficient correlation of
r = -0.031 which has significant relationship with leadership style. An area of
principals’ leadership style referred to how leaders communicate their task (Question
7, Appendix I) showed reach dimension of what principal P-45 said, one that is people
oriented, encouraging everybody to do their best and working out on problems
together and assisting those who are having trouble. P-47 even stated that, I know
when the time I should make my own decision is and when to consult my council and
tell.
From the study of Haller (2005), adversity in the early lives of the prominent
leader respondents was not the most important factor in shaping a leader but how they
viewed obstacles or events in adult lives as opportunities disguised as challenges.
Likewise, Table 23 shows the detailed principals’ leadership style of telling,
selling, participating and delegating correlating them with adversity quotient and has
Component
Mean
Standard Deviation
Pearson Correlation of
AQ’s CORE with Leadership Style
Sig. (2-tailed) ∝ = 0.05
Interpretation
Control Ownership Reach Endurance Adversity Quotient
38 41 31 37
147
5.61 6.85 7.98 4.74
16.90
0.153 -0.066 -0.031 -0.068
1.0
NS NS S
NS NS

113
resulted in significant relation with telling and selling leadership style but with no
relationship on participating and delegating leadership style.
Table 23
Relationship of the Principals’ Leadership Style and Adversity Quotient
Component
Mean
Standard Deviation
Pearson Correlation
with Adversity Quotient Sig. (2-tailed)
Interpretation
Telling Selling Participating Delegating Leadership Style
25 44 46 43
158
5.37 4.92 3.31 3.53
10.80
0.002 -0.019 -0.080 0.080 0.070
S S
NS NS NS
Telling leadership style is usually equated with strong leadership. This is a
kind of leadership which gives more directions and in military language leading from
the front or by example. It put task before relation and communication is directive
(Hersey & Blanchard, 1999). With high AQ principal, telling leadership style is
accepted.
Selling leadership style is in contrast to telling. This style to most proponents
is known as coaching, problem-solving styles or win-win leadership style.
Communications is sideways, were “together working things out”. With high AQ
principal, selling leadership style is helpful.
Delegating leadership is low task and low relationship focus. Too much trust is
given to subordinates where as participating leadership style is low task but high
relationship focus.

114
The researcher perceived that principal’s leadership styles are external
manifestation of showing subordinates to follow direction or setting an example. The
patterns (styles) emerged as an individual begins to respond in the same fashion under
similar conditions that develops habits of action which become predictable to those
who work with them whereas the adversity quotient begins on individual (internal)
resolving own difficulties.
Relationship between the principals’ adversity quotient and leadership styles
with the principals’ demographic profiles
Table 24 presented the relationship of the principals’ demographic profiles
with the variables adversity quotient and leadership styles. The demographic profiles
included the age, gender, civil status, post graduate study and length of service as
faculty and principal. The researcher made use of the Chi- square statistic to test
significant relation using frequencies.
Using the data from Table 3 (page 56) on the distribution of the respondent-
principals as to demographic profile, the researcher assessed the data by calculating
first the degree of freedom and with the use of Chi-square distribution table she took
the critical value which was the basis for accepting the null or the alternative
hypothesis. Considering the age group the degree of freedom = 2, the calculated X2 =
0.24, and the CV = 5.99 at ∝ = 0.05, the calculated value of Chi-square is lower than
the value from the Table, and therefore the null hypothesis is accepted.

115
Table 24
Distribution of the Respondent- Principals as to Demographic Profile
Demographic Variables
Frequency
Mean Adversity Quotient
Mean Leadership
Style Behaviors
AGE GROUP: 29 years & below 30 -39 40-49 50 & above TOTAL
0 6
18 23 47
0
132 147 148
0
151 155 161
GENDER: Male Female TOTAL
14 33 47
143 147
155 159
CIVIL STATUS: Single Married Widow/ widower TOTAL
6
36 5
47
158 144 146
160 156 159
POST GRADUATE: Masteral Units MA Ph.D. Units Ph.D. TOTAL
29 13 3 2
47
144 151 140 149
160 155 145 168
LENGTH OF SERVICE: As Faculty: 5 years & below 6-10 11-15 16-20 21 yrs & above TOTAL
8 4 4 6
25 47
143 126 156 139 150
157 137 154 158 162
As Principal: 5 years & below 6-10 11-15 16-20 21 yrs & above TOTAL
19 14 3 3 8
47
145 148 131 159 144
153 160 159 161 164

116
Table 25 provides the summary of the calculated Chi-square values of the
demographic profiles of the forty seven (47) principal respondents. The Chi-square
computed for all the demographic profiles were way below the critical value with their
corresponding degrees of freedom.
The researcher rejected the alternative hypothesis and accepted the null
hypothesis that the adversity quotient® and leadership styles of the Principals’
respondents has no significant correlation with demographic profiles.
Table 25
Relationship of Adversity Quotient &Leadership Style in terms of Demographic Profiles ∝ = 0.05
Profiles of the
Principals DF CV Chi – X2 Interpretation
Age Group 2 5.99 0.241 NS
Gender Group 1 3.84 0.002 NS
Civil Status 2 5.99 0.27 NS
Graduate Studies 3 7.82 0.52 NS
Length of Service as Faculty
4
9.49
0.866
NS
Length of Service as Principal
4
9.49
0.984
NS
These supported the idea that principals with high or low AQ never allow age,
gender, civil status, graduate studies, and length of service as faculty and as principal

117
to get a hold along their way. Results presented further that demographic profiles are
not determinants of adversity quotients which also support study of Lazaro, 2004.
Noteworthy responses of principals as regards the interview (Question 10,
Appendix I) on how far has adversity in education affected its quality were gathered.
According to principals P-5, P16, P20, P34 & P38 AQ in education makes changes,
review practices and if adversity is not properly resolved or addressed will affect the
quality of an institution so controlling the situation early deter the adverse effort. P-
25 added that adversity should be conceived more as challenges rather than stumbling
block, an opportunity for growth.
Upon knowing the principal respondents adversity quotient, leadership style,
performances and practices from the different presentations, analyses and
interpretations, the next chapter present summary, conclusions and recommendations.
CHAPTER 5

118
SUMMARY, CONCLUSION AND RECOMMENDATIONS Summary
The study focused on the investigation to show an association between the
school principals’ adversity, style of leadership, school performance and best
practices. And to do this, the researcher visited and observed the forty seven schools
randomly selected from the different towns in the province of Rizal.
To determine the principals’ adversity quotient profile and their leadership
style, inferential statistics was applied. For correlation between adversity quotient and
leadership style, the Pearson product-moment correlation was employed while for
adversity quotient, leadership style and demographic profile, Chi square was used
since this test uses frequencies. The two hypotheses related to the research questions
were: there is a significant correlation between the Adversity Quotient of the principal
respondents and their leadership style and; the AQ and leadership style of the principal
respondents have a significant correlation with their demographic profiles.
Principal’s performance and practices were gathered through interview and
were analyzed qualitatively to strengthen support to the quantitative findings of the
adversity quotient profile. The qualitative data from the forty seven (47) principals
interviewed were analyzed for emerging and congruent themes about the role
adversity play in education, the common adversity they encountered while performing
their tasks.

119
The main findings of the study are: 1. The generated principals’ adversity quotient® profile (AQ®P) of the private
schools in Rizal has an average descriptive interpretation. The four
dimensions of adversity quotient have the same average scores in control,
reach and endurance but ownership scores was below average. The researcher
observed that the principal-respondents gave too much blame to the origin and
cause of the problem. With low AQ, the tendency is to blame oneself (Stoltz,
1997) but with high AQ the individual learns ones behavior to become smarter,
a character of a person with high self- worth.
2. Results showed the responses of the principals were grouped into the
leadership styles in which the participating leadership style rank 1, followed by
selling leadership style, delegating leadership style, and telling leadership
style. The principal respondents maximized the quantity and quality of
performance and found out that participating style is an ideal approach to lead
people according to Likert (1967) and is currently used by most principals
interviewed.
3. From the interviews conducted among the principal respondents, four themes
emerged with regard performance. These were concerned for: personality of
the principals, association with colleagues, workplace and effectiveness. The
principals’ performance resulted having a positive relationship with adversity
quotient.

120
4. The researcher likewise organized the principal’s responses of the various
sharing regarding the practices they applied in their school. The current
practice of defining clear directions through constant reviewing of their vision
mission statement was the primary concern of the principals. Major responses
and the themes were focused on student-teacher centered; teachers were
empowered; administration; community partnerships and linkages; and
seminars conducted which emphasizes curriculum. The principals’ practices
also resulted to a positive relationship with adversity quotient.
5. From the result, adversity quotient profile affects the principals’ performances
and practices in their schools. Adversity quotient has a positive relation with
school practices. Principals who respond to AQ as an opportunity and with a
sense of purpose will succeed in the entire endeavors he/she plan to put into
practice in the school.
6. No significant correlation was found between the principals’ adversity
quotient® and the principals’ leadership styles.
7. No significant correlation was found between the principals’ adversity
quotient® and the principals’ leadership styles with the demographic profile of
the principals.
Conclusion
Based from the findings of the study, the following conclusions were drawn:

121
1. The adversity quotient profile can measure the principals’ adversity quotient to
improve oneself in dealing with difficulties encountered in school.
2. The four dimensions of AQ measures exactly the AQ of an individual. The
more control one has, the more one has to take positive action. Origin and
ownership stand for blame and accountability. Reach evaluate how far
hardship affects ones life and endurance takes action on how adversity last
3. The AQ of principals in Rizal is not generally far behind the standards
provided by Stoltz in 2009.
4. The principal respondents preferred participating leadership styles followed by
selling and delegating as against telling leadership styles.
5. If one wanted to succeed as leader, one must not stick with only a single
leadership style but make use of other styles that may fit the situation.
6. The AQ is very important for a principal to succeed in their performance and
practices in school.
7. The principals were mostly at age 50 years old, female, married, with
continuing studies, served as faculty for 21 years and held the principalship
for less than 5 years.
8. Though principals’ AQ resulted in a very weak or no relationship with
leadership style still the researcher believes that AQ has something to do
with leading.
9. And as the researcher held her school visitations to gather and interview her
respondents she had noted the exemplary characteristics of a principals.

122
Recommendations
With the foregoing conclusions, the following recommendations are suggested:
1. Administrators can gain additional information in understanding individual’s
AQ®, which will help the organization to hire and retain highly motivated and
competent faculty and staff.
2. Curriculum developer may include and consider the present studies of AQ®,
leadership styles, performance and practices in developing the curriculum.
3. Human Relation Department will take into consideration AQ® in the
performance or in the management of human organization especially in hiring
applicants thereby making them conscious to deal with adversity inherent in
their jobs. They may include AQ in their design of performance appraisal.
4. Faculty and Staff will be encouraged to put their best efforts and maximize
their performance capabilities. The study will provide ideas in helping them
develop their potential and leadership as well as improve their values.
5. Policymakers can obtain data from the study that can be codified for use in the
formulation of policies relative to the organization and operation of the
schools.
6. Researcher may continuously study and consider AQ® as criteria not only in
leadership but also in every aspect of dealing with human endeavor
7. Students can improve their learning style through a principal with higher
adversity quotient and appropriate leadership style.

123
8. The school principal with his/her constant exposure to different pressures
both internal and external has to constantly review own AQ®P as guide. The
forty seven (47) principal respondents in the province of Rizal or the Diocese
of Antipolo may look into the possibility of integrating adversity quotient in
their job description to improve themselves in times of facing difficulties.
References Aidla, A. & Vadi, M (2006). Relationship between attitudes of school administrations towards school performance, criteria and the national examination results in Estonian schools. Trames: A journal of the Humanities & Social Sciences; Vol 12

124
Issue 1, pp73-94 Alfons, T. and Turner, C. (2002). Leader for the 21st Century: How Innovative
Leaders Manage in the Digital Age. M. Graw Hill. Ashby, M. & Miles, S.(2002). Leaders talk leadership: Top executive speak their
minds. Oxford University Press Inc. Bandura, A.(1991). Social cognitive theory of self regulation. Organizational and Behavior and Human Decision Processes, 50,248-287 Bandura, A. (1995). Self-efficacy in changing societies. New York Cambridge
University Press Barber,M. & Meyerson, D.(2007). The gendering of school leadership:” leadership: ”Reconstructing the principalship”. Annual meeting, American Educational Research Association. Chicago,Illinois. Bennis, W. G.(1990). Why leaders can’t lead the unconscious conspiracy. San Francisco: Jossey Bass Bennis, W. G & Nanus B. (1985). Leaders: The strategies for taking charge. 1st ed. (New York) Harper & Row. Billger, S.(2007). Principals as agents? Investigating accountability in the compensation and performance of school principals.Industrial & Labor Relation Review: Vol 61. Issue 1, p90-107. Blake, R.& Mouton, J.(1969). Building a dynamic corporation through grid
organization development. Reading Mass : Addison Wesley. Bloom, B.Ed(1956). Taxonomy of educational objectives:. The classification of
educational goals. Handbook 1; Cognitive Domain New York: McKay Bloom, G.,Castagna, C.,Moir,E.,& Warren, B. (2005). Blended coaching: Skills & Strategies to support principal development. California,USA: Corwin Press Blount,J. (1999). Manliness and the gendered construction of school administration in the USA. International Journal of Leadership in Education, 2(2), 55-68. Boe, J. (2005). Adversity give you strength. http://www. johnboe.com/media
picture.html

125
Boje, D.M. (2000). Transformational leadership, Internet Retrieved December 25,2000
Brennen, A.(2006). Leadership styles. Retrieved July 17, 2006. http://www.soencouragement. org./leadership-styls.htm Bryson, J. & Crosby, B. (1992). Leadership for the common good: Tackling problems in Shared-power world. San Francisco: Jossey-Bass Bumatay, E.F. (2004). Leadership in higher education institution: Perspectives of
Filipino Academic Deans. College of Education, University of the Philippines, Diliman, Quezon City.
Burns, J. (1978). Leadership. New York: Harper and Row Calmorin, L. (1994).Educational research measurement and evaluation. 2nd ed. National Bookstore.Inc Philippines Ciulla,J.B. (2004). Leadership and the problems of Bogus Empowerment in ethics,
The Heart of Leadership. edited by Praeger. pp 59-82.
Cooley, V. & Shen, J. (2003). School accountability and professional job responsibilities: A perspective from secondaryprincipals. NASSP Bulletin, 87 (634), 10-25. Covey, S. (1989). The seven habits of highly effective people. New York: Simon & Schuster. Creswell,J. (2003). Research design: Qualitative, quantitative, and mixed methods approaches. 2nd ed.California: Sage Publication, Inc. Crosby, P. (1990). Leading, the art of becoming executive. New York: Mc Graw Hill Crosby, B.(1999). Leadership for Global Citizenship Building Transactional
Community. California: Sage Publication Inc. Dalisay, C.(2007). Administrative Practices: Influence of Secondary School, Science
Teachers and Administrator Characteristic. PhD. Dissertation, University of the Philippines, Diliman, Quezon City.
Davies, M. (2007). Doing a successful research project using qualitative e or quantitative methods. New York: Pargane McMillan St. Martin Press.

126
Deal, T.E. & Peterson, K. (2000). The leadership paradox: Balancing logic and artistry in schools. San Francisco: Jossey-Basey
DiPaola,M.,Moran, M.,Thomas,C.(2004). School principals and special education: Creating the context for academic success. Focus on exceptional Children. 37,1,1- 10 Donnithorne, L.(1993). The West Point Way of Leadership. New York: Double Day Publishing Group Inc. Downie, N. & Heath, R. (1984). Basic statistical methods.5th ed. New York: Harper & Row Publisher, Inc. Dreher,H.(1996). The immune power personality: 7 traits you can develop to stay healthy. New York: Dutton Dweck, C. (1997). Mindset: The new psychology of success. New York: Barnes & Nobles Eagly, A.H. and Johannesen-Schmidt, M.C.(2001). The leadership styles of women
and men. Journal of Social Issues. 57(4), pp. 781-797. Eberts, R. & Stone J. (1988). Student achievement in public schools: Do principals make a difference? Economics of Education Review Vol. 7, No.3, pp 291-99. Eric Digest, Educational leadership and management “Parenting the next
generation” http://www.vtaide.com/png/ Fawcett, J.(1992).The relationship of theory and research. 3rd ed.Philadelphia: Davies Co Ferguson, G.A. & Takane, Y. (1989). Statistical analysis in psychology and education, 6th ed. New York: McGraw Hill Book Co. Inc. Fiedler, F.E.(1967). A theory of leadership effectiveness.New York: McGraw Hill Book Co. Fiedler, F.E., Chemers, M.M., & Mahar, L. (1977). Improving leadership effectiveness. New York, NY: John Wiley Fiorino, Al. (2007). Educational leadership in times of rapid change. Retrieved January 26, 2007. http://www3 sympatico/alfiorino/leadershiphtml.30kb

127
Frankl, V. (1959). Man’s search for meaning. Boston: Beacon Press. Fullan, M. (2000). Educational leadership introduction. San Francisco. The Jossey- Bass Gates, S. et al (2001) An Overview of School administration and their Careers. Monograph research, California: Goldman, E. (1998). The significance of leadership style. Educational Leadership.Vol
55, No.7 pp20-22 Goleman, D. (1995). Emotional intellegence: Why it can matter more than IQ? New
Yor: Boston Book Gurian,M. & Annis, B. (2008). Leadership and the sexes: Using gender science to create success in business. San Francisco: Jossey-Bass Haller, H.E. (2005). Adversity and obstacles in the shaping of prominent leaders:
A hermeneutic Phenomenological Inquiry. Doctor of Philosophy Requirements, Gonzaga University.
Hallock, K. (2002). Managerial pay and governance in American non-profits.
Industrial Relations, Vol.41, No.5,pp 377-406 Hannusek, E.(2004). Our school performance matters. Journal of Education; Vol 185, Issue 3, p1-6,6p Hannusek, E. & Raymomd, M. (2002). How to assess school performance?New
England Economic Review; 4th Quarter, p12,3p Hersey P. and K. H. Blanchard. (2001). Situational Leadership. Retrieved September,
2007 from http://changing minds. org/disciplines/leadership/styles. Hersey P. and Blanchard, K. (1999). Leadership and the one minute manager. William Morrow Hersey, P.and Blanchard, K. (1988). Management of organizational behavior, Utilizing human resource, 2nd ed. New Jersey: Prentice-Hall, Inc. Hewitt, J. (2002). Building characters through adversity. http://www.poewar.com. Hitt, W. (1993). The model leader, a fully functioning person. Ohio: Batille Press

128
Horne, T. & Wootten, S. (1997). Strategic Planning. United Kingdom: Kogan Page Ltd
Johnson, M. B. (2005). Optimism, adversity and performance comparing explanatory Style and AQ.Thesis, San Jose State University. Johnson, B. & Christensen. (2004). Educational research, quantitative, qualitative
and mixed approaches. Boston: Pearson Education,Inc. Kamp, D.(1999). The 21st Century Manger: Future focused skills for the next
Millennium. Kogan Page Ltd. Kluger, A & DeNisi, A. (1996). The effect of feedback interventions on performance:
A historical review, a meta-analysis, and a preliminary feedback intervention theory. Psychological Bulletin, 119(2), 254-284
Koontz, H. & O’Donnel, C. (1959). Principles of management: An analysis of
managerial functions, 2nd ed. New York: McGraw-Hill. Korman,A.(1975). Consideration, initiating structure and organization criteria-a
review.Personal Psychology. Journal of Applied Research XIX, No. 4, 349-61. Kouzes, J.M. (2003). Business leadership. USA: Jossey-Bass Kouzes. J. & Posner, B. (1995). The leadership challenge: How to keep getting extraordinary things done in organization.San Francisco, Jossey-Bass Lahoz, E.Q. (2005). Portfolio of a Filipino, as an outstanding private school Administrator. Ph.D. Dissertation, College of Education, University of the Philippines, Diliman, Quezon City. Law, S. & Glover, D. (2000). Educational leadership and learning: Practice, policy and research. Open University Press. Lazaro, A. R. C. (2004). Adversity quotient and the performance level of selected middle managers of the different departments of the city of Manila as
revealed by the 360-degree feedback system. Presentation paper in the Special Session: Workshop for Prospective Scholars, International Industrial Relations Association (IIRA), 5th Asian Regional Congress, Seoul, Korea.
Lewin,K.,Lippit,R.,& White, R. (1939). Patterns of aggressive behavior in experimentally created social climate. Journal of Psychology,10,271-299.

129
Likert, R. (1961). New patterns of management. New York: McGraw Hill Likert, R.(1967),The human organization: Its management and value, NY: McGraw- Hill Locke,E. & Latham, G. (1990). A theory of goal setting and task performance. Engelwood Cliffs, New Jersey: Prentice-Hall Lunenberg, F. (2006). The principalship: Vision to action. Thomson Wardsworth.
Thomas Corp. Lunenberg, F & Ornstein, (2004). Educational administration concepts & practices,
4th ed. Wadsworth, Thomson Learning, Inc. Maslow, A.H. (1943). A theory of human motivation. Psychological Review, 50:370-396. Mayo, E. (1967). The social problems on an industrial civilization. Boston: Harvard Business School, p. 23. Mendoza, (2000). Leadership style & effectiveness of Sienna College Taytay, basic education administrators as perceived by themselves and their teachers, Thesis, Ateneo de Manila University Mikulincer, M.(1994). Human learned helplessness: A coping perspective. New York: Plenum Press Millwee, S. (1998). Best Business Practices. American Society for Information
Science & Technology. Florida Millwee, S.(2001). Future Focused Leadership. www.asisonline.org. McGregor, D. (1960). The human side of enterprise. New York: McGraw Hill. Nuwer, M. (1986).Evoked potential monitoring in the operating room. New York: Raven Press Okun, M.(1988). Hardiness and health among women with rheumatoid arthritis.
Personality & Individual Differences Vol 9, No. 1 101-107 Ortiz.C. (2007). Leader’s educational innovation: Practices and school performance,
Dissertation. College of Education,. University of the Philippines,QC.

130
Oullette, S. et al (1982).Hardiness and health: A prospective study. Journal of Personality & Social Psychology, Jan. Vol.42,(1),.168-277
Parane, I. (2003). Are you always in a hurry? Woman’s Home Companion pp. 12-13 & 15. Patterson, K. (2003). General Colin Powell: Strong leadership in the face of adversity. http://www.academn.com./lib/paper/22683. Pfau & Kay. (2002).the human capital edge: 21 people management practices your company must implement(or avoid) to maximize shareholder value. NY. McGrawHill Peterson, C., Maier,S., & Seligman, M. (1993). Learned helplessness: Theory for the age of personal control, New York: Oxford University Press. Philippine Business Magazine: In the running: the 2004 election. Track Record and Leadership Style. Volume 10 No. 9. Podsakoff,P. & Farth, J.(1989). Effects of feedback sign and credibility on goal setting and task performance. Organizational Behavior and Human Decision Processes, 44(1) 45-67 Portroy, R.(1986). Leadership: What Every Leader should know about people. Prentice Hall Rosenholtz (1989). Teachers’ workplace: The social organization of schools. White Planes New York: Lagman Inc. Rotter, J (1966). Generalized expectancies for internal versus external control of reinforcement, Psychological Monographs, 80.whole issue Sanchez, C. (2001). Methods and techniques of research. Revised ed. Rex Book
Store, Philippines
Schein, E. H. (1992). Organizational culture and leadership (2nd ed.). San Francisco: Jossey-Bass.
Schmidt (1999). A comparison of adversity response: Education leaders and business industry leaders dissertation.
Schmoker, M. (2001).Result: the key to continuous school improvement. Alexandria, VA: Association and Curriculum Development

131
Seligman, M.(1991). Learned optimism. New York: Knopf
Senge, P.(1990). The Fifth Discipline: The art and practice of the learning organization. New York: Doubleday. Sergiovanni, T. J. & Moore, J. Eds.(1989).the leadership needed for quality schools. Schooling for Tomorrow. Boston: Allyn & Bacon Sergiovanni, T. J. (1992). Moral leadership: Getting to the heart of school improvement. San Francisco: Jossey-Bass Sergiovanni, T. J. (1994).Building community in schools. San Francisco: Jossey-Bass Sergiovanni, T. J. (1996) Leadership for schoolhouse. San Francisco: Jossey-Bass Shen, J., Wegenke, G. L., & Cooley, V. E. (2003). Has the public teaching force become more diversified: National and longitudinal perspectives on gender, race, and ethnicity. Educational Horizons, 81, 112-118.
Shen, J., & Poppink, S. (2003). The certification characteristics of the public school teaching force: National, longitudinal, and comparative perspectives. Educational Horizons, 81, 130-137.
Shen, J., & Crawford, C. S. (2003). The characteristic of the secondary principalship: An introduction to the special issue. NASSP Bulletin, 87 (634), 2-8. Stewart, E.(2008). School structural characteristics, student effort, peer associations, and parental involvement: The influence of school and individual level factors on academic achievement. Education and Urban Society 40,2,179-204.
Stogdill, R. (1974). Personal factors associated with leadership. Journal of Applied Psychology, January: pp35-71.
Stogdill’s Handbook of Leadership. A survey of theory and research. The Free Press
Stoltz, P. G & Weihenmayer, E. (2006) . The adversity advantage: turning everyday struggles into everyday greatness. New York: Simon & Schuster Stoltz, P.G. (2000). Adversity quotient at work; make everyday challenges the key to your success_ _ Putting the principles of AQ into action. New York: Morrow Stoltz,.P. G. ( 1997). Adversity quotient, turning obstacles into opportunities. New York: Wiley

132
Surekha, M. (2001). The Hindu opportunities. A guide to better positions and better performance. Surekha.hyd@career community.co.in/ www.hindu net com Tannenbaum ,R. & Schmidt, W.H.(1958). How to choose a leadership pattern. Harvard Business Review, 36,95-101 Tannenbaum ,R, Weschler,I. & Massarik,F.(1959). Leadership and organization: A
behavioral science approach. New York: McGraw Hill Taylor, F. (1911).Principles of scientific management. New York: Harper & Brothers Terry, G.R. & Franklin, S.G. (1987). Principles of management. New Delhi: All India Traveller Bookseller. Thomas, D.M. and Bainbridge, W.L. (2001). Understanding the principles of effective leadership leads to better schools. Show Me Education. Spring Thorndike, E. (1913). The original nature of man. Educational psychology. Vol.1: New York: Columbia University Townsend, D. (1996). Looking at the Work of Principals Challenging. 33(1), 4-9. Trames: A Journal of the Humanities and Social Science; 208, Vol. 12 Issue; p73-94/
22 p. 5 charts Triola, M.F.(1995). Elementary statistics. 6th ed. Reading Mass: Addison Wesley Varaki, B. S. (2003). Epistemological beliefs and leadership style among school principals. International Education Journal; 4 (3). Velasco, D.M. (2002). Lammed to lick adversity? Philippine Daily Inquirer Villaver, E. L. (2005). The adversity quotient levels of female grade school teachers of public and a private school in Rizal province. Master Thesis. Visscher, A., Wild, P.,& Fung,A(Eds.)(2001). Information technology in educational management; synthesis of experience, research and future perspectives on computer- assisted school information systems.Dordrecht/Boston/London: Kluwer Academic Publisher Visscher, A. & Coe, R. (2003). School performance feedback systems:

133
Conceptualisation, analysis, and reflection. School effectiveness and School Improvement. Vol 14, No.3, pp321-349 Waldman, et al (1998) Walker A., Tin, L.G., Choy, C.K., Stott, K. Management tools for educational
managers. Prentice Hall Simon & Schuster( Asia) Pte Ltd. Wallington, P. (2004). Total leadership:the ties that bind. Journal. C1D-Framingham Vol.17part15.p30-35 Werner, E. (1992). Overcoming the odds: High risk children from birth to adulthood. Cornell University Press Westhuizen, V., Philip, C.,Mosoge,L.,Swanepoel,L.,& Coetsee,L.(2005).
Organizational culture and academic achievements in secondary school. Education and Urban
Society 38,89,89-109. Weiner, B. (1974). Achievement motivation and attribution theory: Morristown. New Jersey: General Learning Press Williams, M. (2003). The relationship between principal response to adversity and student achievement.Dissertation,College Education, Cardinal Stritch University Yee, D. (2004). Developing Educational Leaders for the 21st Century. Journal of Information Technology for Teacher Education 9(3), 287-302 Yukl , Gary A. (1989). Leadership in organizations. 2nd ed. New Jersey: Prentice Hall.,Inc.

134
Appendix A: Communications
Appendix A1: Letter to OIC, Schools Division Superintendent Division of Rizal
August 29, 2008 DR. MARITES A. IBAÑEZ OIC, Schools Division Superintendent Division of Rizal Kaytikling, Brgy. Dolores, Taytay, Rizal Dear Dr. Ibañez: Praise be Jesus! One of the challenges faced by institutions is the leader’s responsibility and accountability in the organization and operation of schools. I intend to prove that his/ her adversity quotient is related to the educational leadership style he/she carries in school. In this regard, the undersigned would like to seek permission to gather information from the school principals in Rizal in line with the on-going thesis paper entitled “The Principal’s AQ: Styles, Performance and Practices”. I believe with your kind heart I will be able to examine the responses with fairness and confidentiality and make recommendations that will assist the respondents in the styles, performance and practices in schools. May God bless us in all our undertakings! Thank you. Respectfully yours, Engr. Lea D. Canivel Noted: Dr. Ludivina Pagkaliwagan Prof. Lorelei R. Vinluan Research Adviser OIC, Division Chairperson
DELPS-UP Approved: Dr. Marites A. Ibañez OIC-Schools Division Superintendent Division of Rizal

135
APPROVED: September 16,2008
Appendix A2: Endorsement Letter of the Catholic Schools Superintendent Diocese of Antipolo

136
Appendix A3: Agreement for the Use of AQP Instrument

137
Appendix A4: Request through e-mails of the Researcher and Responses by Peak Learning

138

139

140

141

142

143

144
Appendix B
Appendix B: Survey Questionnaire
This questionnaire intends to study the educational leadership of your organization. It has three parts: Part I is your personal profile, Part II is your adversity response profile,® Part III – is about your leadership behavior. Your responses to the informations will be treated with utmost confidentiality.
Appendix B1: Part I – Personal Profile Part I- Personal Profile Directions: Please check the number which correctly describes your answer. Write your answer on the line provided. 1. Name : ________________________________________________________ 2. School : ________________________________________________________ 3. School Address: ____________________________________________________ ____________________________________________________ 4. Position Title 10. Eligibility ____ 4.1. Principal ____ 10.1. Civil Service Equivalent ____ 4.2. Academic Coordinator ____ 10.2. LET/PRC ____ 10.3. Others, please specify 5. Other Administrative Position, ___________________ please specify ___________________ ______________________________
11. Years in Service 6. Highest Educational Attainment A. As Faculty: ____ 6.1. Bachelor’s Degree ____ A.1. 5 yrs. & above ____ 6.2 . Masteral Units ____ A.2. 6-10 ____ 6.3. MA or Equivalent ____ A.3. 11-15 ____ 6.4. Ph.D. Units ____ A.4. 16-20 ____ 6.5. Ph.D. or Equivalent ____ A.5. 21 yrs. & above B. As Principal 7. Age Group ____ B.1. 5 yrs. & above ____ 7.1. 29 yrs. & below ____ B.2. 6-10 ____ 7.2. 30-39 ____ B.3. 11-15 ____ 7.3. 40-49 ____ B.4. 16-20 ____ 7.4. 50 & above ____ B.5. 21 yrs. & above 8. Gender 12. Total number of faculty / teachers
____ 8.1. Male under your responsibility __________ ____ 8.2. Female Male ______ Female ______ 9. Civil Status 13. Total student population ____ 9.1. Single Elementary ______________ ____ 9.2. Married Secondary ______________ ____ 9.3. Widow/er

145
Appendix C: Part II- AQ®P Instruction
Part II - Adversity Response Profile® by Dr Paul G. Stoltz
Instruction:
Please log-on to http://xxxxxx
This is the link to the questionnaire you will have to answer. It is a fourteen (14) item questions that will provide you with your Adversity Response Profile®.
You will imagine the different events as if they were happening right now. Then click the number that represents your answer. Immediately after you finish answering you may see your result and this will guide you to improve your adversity response profile.
Thank you
_____________________________________________________
Part II - Adversity Response Profile® by Dr Paul G. Stoltz
Instruction:
Please log-on to http://xxxxxx
This is the link to the questionnaire you will have to answer. It is a fourteen (14) item questions that will provide you with your Adversity Response Profile®.
You will imagine the different events as if they were happening right now. Then click the number that represents your answer. Immediately after you finish answering you may see your result and this will guide you to improve your adversity response profile.
Thank you

146
Appendix D: Leadership Survey Questionnaire Part III - Leadership Survey Questionnaire Instruction: This questionnaire contains statements about principal’s leadership behaviors. Next to each statement, circle the number that represents how strongly you feel about the statement by using the following scoring system: 4 – Almost True – AT 3 – Occasionally True – OT 2 – Seldom True – ST 1 – Never True – NT Be honest about your choices as there is no right or wrong answers- it is only for your own assessment. Behaviors AT OT ST NT 1. I always retain the final decision making authority within the department
4 3 2 1
2. I do not consider suggestions made by my faculty and staff.
4 3 2 1
3. I allow my faculty to vote whenever a major decision has to be made.
4 3 2 1
4. I ask my faculty and staff ideas and inputs on upcoming plans and projects.
4 3 2 1
5 I tell my faculty and staff what is to be done and how it is to be done.
4 3 2 1
6 I call a meeting to get my faculty and staff’s advice, when things go wrong and need to create a strategy to keep a project or process running on schedule.
4
3
2
1
7. I tell my faculty and staff not to make a mistake and to take note of it.
4
3
2
1
8. I encourage my faculty and staff to participate in decision making.
4
3
2
1
9. I want to create an environment where the employees take ownership of the projects.
4
3
2
1
10. I do not allow new hires to make any decisions.
4
3
2
1
11 I ask my faculty and staff about their vision of where they see their task going and allow them to use this vision when appropriate
4
3
2
1
12 I tell my faculty and staff that a procedure is not working correctly and I establish a new one without them.
4
3
2
1
13 I allow my faculty and staff to set priorities under my guidance.
4
3
2
1
14 I delegate tasks in order to implement a new procedure or process.
4
3
2
1
15. I closely monitor my faculty and staff if they are performing correctly. 4
3
2
1
16 I work with my subordinate to resolve issues. 4 3 2 1

147
Behaviors
4
3
2
1
17 I agree that each individual is responsible for defining their job.
4
3
2
1
18 I act as spokesman of the department.
4
3
2
1
19 I treat all my subordinates as equals.
4
3
2
1
20 I like to share my leadership power with my subordinates.
4
3
2
1
21 I direct or threaten my faculty and staff in order to achieve the organizational goals/ objectives.
4
3
2
1
22 I concur with my faculty and staff that they will exercise self direction if they are committed to the objectives.
4
3
2
1
23 I do not agree with my faculty and staff that they have the right to determine their own organizational objectives.
4
3
2
1
24 I do not agree that faculty and staff seek mainly security.
4
3
2
1
25 I enjoy seeing my faculty and staff know how to use creativity and ingenuity to solve organizational problems.
4
3
2
1
26 I appreciate that my subordinate can lead themselves just as well as I can. 4
3
2
1
27 I find it easy to carry out several complicated tasks at the same time.
4
3
2
1
28 I enjoy coaching my faculty and staff on new task and procedure.
4
3
2
1
29 I have time enjoying reading articles, books and journal about training, leadership and psychology
4
3
2
1
30 I am committed to developing the strength of my department.
4
3
2
1
31 I interact with my faculty and staffs.
4
3
2
1
32 I have not supported my faculty and staff when parents were involved
4
3
2
1
33 I do not listen to my subordinates.
4
3
2
1
34 I use coercion to motivate my subordinates.
4
3
2
1
35 I implement the latest fads without knowledge.
4
3
2
1
36. I listen to both sides of the story before making a decision.
4
3
2
1
37. I evaluate situations carefully before taking action.
4
3
2
1
38 I can prepare a curriculum.
4
3
2
1
39 I am knowledgeable about instructional strategies
4 3 2 1
40 I have rules but do not always enforce them. 4 3 2 1

148
Behaviors 4 3 2 1 41 I hold my subordinates accountable.
4
3
2
1 42 I delegate responsibility
4
3
2
1 43 I assign duties during planning period.
4
3
2
1 44 I let my subordinates know what is expected of them.
4
3
2
1 45 I inspire enthusiasm for a project.
4
3
2
1 46 I see to it that the work of my subordinates is coordinated.
4
3
2
1 47 I remain calm when uncertain things come.
4
3
2
1 48 I take full charge when emergencies arise.
4
3
2
1 49 I am willing to make changes.
4
3
2
1 50 I maintain definite standards of performance.
4
3
2
1 Lea D Canivel UP-MAED July, 2008
Appendix E: : Interview Questionnaires

149
INTERVIEW PROTOCOL intended for thesis proposal entitled
“THE PRINCIPALSHIPs’ ADVERSITY QUOTIENT ®: STYLE, PERFORMANCE AND PRACTICES” Mrs. Lea D. Canivel – MA-EDAD
CONDUCT OF INTERVIEW
I. Greetings and introduction of oneself to the Principal II. Present a background of the study to be conducted. Ask permission to tape- record the
interview. Assure respondents of confidentiality. III. Questions:
1. What is your understanding of adversity? _________________________________________________________ _________________________________________________________ 2. How would you define adversity in education? _________________________________________________________ _________________________________________________________ 3. What specific adversities have affected the operations of the school? _________________________________________________________
_________________________________________________________ 4. How did you address such kind of adversities? _________________________________________________________
_________________________________________________________ 5. How did these challenges affect your performance as a principal? _________________________________________________________
_________________________________________________________ 6. What specific tasks consumed most of your time? _________________________________________________________
_________________________________________________________ 7. Describe your style of leadership and how it is applied in your task. _________________________________________________________ _________________________________________________________ 8. How do you communicate task completion with your subordinates? _________________________________________________________ _________________________________________________________ 9. What school practices do you use for your school improvement?
________________________________________________________ ________________________________________________________
10. How far has adversity in education affected its quality? ________________________________________________________
________________________________________________________ For Approved by: Dr Ludivina Pagkaliwagan Dr Ligaya S. de Guzman Prof. Lorelie R. Vinluan Prof. Mario Lucero

150
Appendix F: Summary of Principals’ Adversity Quotient 58
Principals' Adversity Quotient Profile with its Four Dimensions
Respondent Dimension Adversity Respondent Dimension Adversity Control Ownership Reach Endurance Quotient Control Ownership Endurance Quotient
P -1 ### 40 42 43 154 P-25 35 31 29 * 119 * P -2 32 50 33 36 151 P-26 34 43 34 156 P -3 34 40 33 32 139 P-27 50 50 50 200 P -4 31 41 24 35 131 P-28 40 34 30 124 P -5 43 50 33 45 171 P-29 30 29 34 126 P -6 31 42 26 39 138 P-30 49 46 33 155 P -7 42 25 32 35 134 P-31 37 48 40 156 P -8 30 34 26 31 121 P-32 37 47 43 159 P -9 34 34 40 42 150 P-33 42 44 39 170 P-10 39 50 21 30 140 P-34 31 31 36 126 P-11 41 45 27 42 155 P-35 31 30 37 132 P-12 42 42 40 36 160 P-36 38 49 35 146 P-13 40 45 35 45 165 P-37 36 41 32 145 P-14 36 39 26 33 134 P-38 29 * 46 33 130 P-15 39 46 32 37 154 P-39 37 46 30 132 P-16 40 24 * 22 35 121 P-40 34 41 35 131 P-17 36 39 39 36 150 P-41 40 44 42 165 P-18 42 44 43 35 164 P-42 38 39 40 143 P-19 33 27 28 33 121 P-43 39 39 33 144 P-20 37 44 41 43 165 P-44 47 49 38 162 P-21 33 44 25 33 135 P-45 35 44 41 156 P-22 45 39 41 40 165 P-46 38 35 42 143 P-23 48 37 14 * 31 130 P-47 31 43 35 145 P-24 30 43 25 35 133 n=47
Highest AQ = 200 & C O R E values of 50 each * Lowest AQ =119 & E=29 ; other lowest dimensions of C=29; O=24; R=14 were distributed to other principals

151
Appendix G: Latest AQP Range and Reliability

152
Appendix H: Summary of Leadership Styles
Principal Telling Selling Participating Delegating Leadership
Style Principal Telling Selling Participating Delegating Leadership
Style P-1 16 45 52 43 156 P-25 25 46 50 47 168 P-2 20 45 51 45 157 P-26 20 37 42 38 137 P-3 21 47 50 45 163 P-27 27 44 47 42 160 P-4 21 32 41 34 128 P-28 17 47 50 45 159 P-5 34 39 40 45 158 P-29 32 48 45 41 166 P-6 22 38 40 39 139 P-30 19 45 48 47 159 P-7 21 47 51 45 164 P-31 29 44 46 42 161 P-8 32 49 51 46 178 P-32 34 47 46 44 171 P-9 22 48 46 44 160 P-33 20 48 50 47 165
P-10 30 39 42 34 145 P-34 20 46 49 50 165 P-11 21 42 48 41 152 P-35 21 42 48 41 152 P-12 37 43 42 39 161 P-36 21 49 49 45 164 P-13 24 48 45 44 161 P-37 23 49 49 46 167 P-14 25 49 45 43 162 P-38 25 46 49 44 164 P-15 28 43 44 45 160 P-39 23 44 51 46 164 P-16 25 50 44 43 162 P-40 34 47 46 44 171 P-17 24 45 47 46 162 P-41 23 38 45 44 150 P-18 34 47 45 42 168 P-42 29 42 45 43 159 P-19 25 33 43 32 133 P-43 31 37 42 36 146 P-20 19 48 47 45 159 P-44 19 43 50 46 158 P-21 35 49 47 47 178 P-45 20 32 45 32 129 P-22 21 48 49 45 163 P-46 21 47 50 45 163 P-23 26 46 41 44 157 P-47 22 46 48 41 157 P-24 25 40 45 38 148
Total 1163 2074 2178 2010 7425

Appendix I: Interview Responses Question 1: What is you understanding of Adversity? P -1 Any obstacles or hardships that hinder effective delivery of performance. P -2 Adversity could be situations that create problems or conflicts if not manage well. P -3 Adversity is any circumstances or situation that is unformable P -4 Conflict of time with people and all staff of organization. P -5 Hindrances, problems, obstacle P -6 Any unfavorable situation that is not conducive to realization of one's goals P-7 Problems encounterered while doing a task P-8 Scarcity of things to be supplied;factros that hinder prodcution. P-9 Difficulties in doing a task P-10 Anything that hinders daily work P-11 Might be a sufferings P-12 A poor condition that hampers operations P-13 An unfavorable events P-14 Challenges encountered as I proceed to my activities P-15 Unfavorable, misfortune P-16 Adversity for me is problem/misfortunes, unfavorable events, experience, trouble. P-17 Refers to hard times, lack of money funds P-18 A struggle in complying hard task P-19 Obstacles encountered daily P-20 Hindrances, difficulties P-21 A challenge that needs to be addressed to for the beterment of te organization. P-22 Adversity refers to problems or conflicts that may occur on the performances of tasks. P-23 Adversity is defined as trouble. P-24 Trials and tribulations while accomplishing task P-25 It is anything that is counterproductive, detrimental and anything that implies opposition. P-26 The risk we been through P-27 The inconvenience we met everyday P-28 The effort we make to reach a goal P-29 Refers to hard times, lack of money funds P-30 Troubles we been through before we solve a problem P-31 Inconsiderate conditions in accomplishing task P-32 Can be the impediment as we work P-33 Insufficient funds to carry on the task P-34 Hardships, difficulties, or misiries P-35 Anything that hinders daily work P-36 Might be a sufferings P-37 A poor condition that hampers operations P-38 This refers to the problems encountered during the year. P-39 It refers to negative conditions and difficulties. P-40 It is anything that is counterproductive, detrimental and anything that implies opposition. P-41 A situation that creates difficulties, problems that can affect people negatively P-42 The inconvenience we met everyday P-43 The effort we make to reach a goal P-44 A form of hardship but at the same time a healthy competition/ exchange of ideas P-45 Troubles we been through before we solve a problem P-46 Adversities are problems encountered to a certain goal. P-47 Difficulties in doing a task
Question 2: How would you define adversity in education?

cliv
P -1 Lack of mastery in the field, unpreparedness due to fast phase of technologies. P -2 It could mean many things like unmeet expectations, goals,and the like. P -3 Would refer to circumstances or situation that hamper school smooth operations P -4 Priorities in school that hinder education. P -5 When things plans do not happen as expected because of uncontrolled & unforeseen factors or event P -6 Any situation that hinders the realization of goals and vision of education. P-7 Educational problems encountered
P-8 Status of education, capacity of students records procedures.(new prin.) P-9 Difficulties in doing a task in school setting P-10 anything that hinders student daily school work P-11 Something that hinders progress of teachers and P-12 A poor condition of the school that hampers operations P-13 An unfavorable events in school P-14 School challenges encountered as I proceed to my activities P-15 Sufferings, the pain or the misery or the distress because of pain, sorrow and poverty P-16 It is a problem/unfavorable event related in education which can be encountered by students or teachers and administrators. P-17 Refers to hard times, lack of money funds in school operations P-18 A struggle in complying hard task in the institution P-19 Obstacles encountered daily as we comply in doing the task P-20 Illiteracy, poverty can be encountered in school setting P-21 Problems, challenges, threats that nust be given a solution. P-22 A conflicting issues in education regarding communication, practices, etc. P-23 It maybe referred as obstacles that are encountered inschool operation. P-24 Trials and tribulations while accomplishing task in school P-25 It would mean opposing practices or opposing faces that cause harmful inteference in realization of educational objectives. P-26 The risk we been through in school P-27 The school inconvenience we met everyday P-28 The effort we make to reach a school'sgoal P-29 Refers to hard times, lack of money funds of the school P-30 Troubles we been through before we solve an educational problem P-31 Inconsiderate conditions in accomplishing educational task P-32 The fast technology in education leaving behind the teachers P-33 Insufficient funds to carry on the school task P-34 Difficulties and afflictions that confronts education. P-35 Anything that hinders daily school work P-36 Might be a sufferings while performing school activity P-37 A poor condition that hampers school operations P-38 The hindrances/obstacle met;however, these are being addressed to.

clv
P-39 Negative conditions and difficulties concerning lack of physical facilities and financial strain to support the needs for educational purposes. P-40 It is anything that is counterproductive, detrimental and anything that implies opposition in education P-41 Circumstances that attend in a way of all students learning. P-42 The inconvenience we met everyday in school P-43 The effort we make to reach a school goals P-44 These are the difficulties encountered in the field of education P-45 Troubles we been through before we solve a problem P-46 Adversity in education is the quality of curriculum implemented and facilitated. P-47 Difficulties in doing a school task Question 3: What specific adversities have affected the operation of the school? P -2 Lack of funds would be a major factor. P -3 Teachers leaving the school at the middle of the school year, school's expectation from teachers to use creative strategies but lacks equipment to support P-4 Limited responses, time and schedule P -5 Absences of teachers without prior notice, expected collection not collected on time P -6 Language barriers among locals and foreign studies. P-7 Rumor mongering P-8 Accreditation P-9 Movable holidays; declaring nonworking holidays P-10 Changes in curriculum as provided by Department of Education P-11 Budget Allocation P-12 Can not cope with competitions with other school P-13 Low enrollment P-14 Can not cope with schedule provided P-15 The economic crises P-16 We can't give salary to our teachers which iscompetetive, lack of enough funds, high rates of collectibles at the end of school year P-17 Undisciplined students P-18 Policy implementation P-19 Poor communication of meetings P-20 Decline of enrolment. Availabiltiy of qualified teachers P-21 Dropped in enrolment, parents' objection to solve rules and regulations, government intervention P-22 None that I know of. P-23 The reputation tht the school was able to portray to its community. P-24 Low student achievement as shown in the report card P-25 Not following the line of authority, a worker could go directly to somebody in line who is

clvi
not his/her direct superior. P-26 Parents expectations of teachers P-27 Growing numbers of hyperactive students P-28 Increasing numbers of third sex (either boy or girl) students P-29 Overworked teachers and underpaid teachers P-30 The relationship of principal and teacher affect students P-31 Overworked teachers and underpaid teachers P-32 Lack of facilities for teaching learning process P-33 Supply of water of unclean water and food in the canteen P-34 Inflation or economy crises highly affect the operations of the school. Teachers who can't adopt to changes are also some kind of adversities P-35 Constant policy change P-36 Overconfident of teachers that they come to their classes unprepared P-37 Teachers coming to class unprepared, do not have their lesson plan P-38 Decrease in enrolment due to economic situation. P-39 The physical needs such as facilities and limited space on school ground for additional year level P-40 Unequal loading of teachers causing overloading of teacher and eventually affected quality of teaching P-41 Lack of training, unwillingness to change and use current educational practice. P-42 Classroom management P-43 Uncooperative teachers seen by students P-44 Financial, managerial and curriculum adversities P-45 The overlapping of the job descriptions of position causing denying responsibilities P-46 Faculty and facilities P-47 Unsupported plans in terms of fund and human resource Question 4: How did you address such kind of adversities? P-2 Deliberate with the board of trustees and suggest ways to solve it. P-3 A more stringent policy on teacher commitment was imposed, report on the required equipment. P-4 Advance planning, constant communication P-5 Calling the attention of teachers and memo if done frequently, reminders to parents through letters P-6 Setting of programs and modules. P-7 Being objective through investigations P-8 The opportunities of exposure in diffferent schools. P-9 Direct communication with the Department of Education or the Office of the President P-10 Constant reporting to the office of DepEd P-11 Submit written justification for the project

clvii
P-12 Scout for a better qualified coach P-13 Applied marketing strategies suited to education P-14 Scrutinize carefully the schedule P-15 By providing good education to students and understanding their situation. P-16 We give other incentives, cost-cutting of expenses, the finance office tries to make better collections thru proper communication with the parents. P-17 Seek the support of the guidance counselors, teacher adviser, and even parents for conferences of undisciplined students P-18 Policy implementation must be well regulated. From the start of the implementation to the end and not "ningas kugon" P-19 Cascade results of meetings as early as possible take minutes of the meeting P-20 Our school conducts a year-round enrolment campaign program of activities that Show case the holistic formation the school can provide. P-21 Through dialogue with the concerns, look into existing policies, meeting with stakeholders. P-22 N.A. P-23 By being conscious enough in its role in molding the students. P-24 Faculty staff development program regarding teaching-learning P-25 I called the attention of the teacher after the second instance. During the faculty meetings, I remind them of line of authority. P-26 Hiring qualified teachers P-27 Assess hyperactive students, assign special educator teacher to constantly monitor with the guidance and parents P-28 Assess third sex (either boy or girl) students and provide guidance and counseling program with regards this P-29 Deload teachers and standardized teachers remunerations P-30 Clear directions of principal and by being objective on their relationship with teachers P-31 Deload teachers and standardized teachers renumeration P-32 Prioritize construction of facilities for teaching learning process P-33 Strict compliance by the Department of Health to the supply of clean water and food in the canteen. The whole water piping was changed. P-34 Control all expense that affect the operations of the school. Developed program of teachers who can't adopt to changes. P-35 Developed program of teachers who can't adopt to change P-36 Classroom visitation and lesson plan checking of teachers so they can come to their classes prepared P-37 Sometimes conferencing with teachers is done to unprepared teachers P-38 Dialogue and consultation will be of great help. P-39 Seek assistance from parish officials to use Parish Multi-Purpose building for classroom

clviii
purposes and occasionally use Parish ground for some school activities. P-40 Carefully checked teachers loading and allow subject area coordinator to decide for the overloading P-41 Re-training, focus groups, opportunities to express concerns, asking people to leave if they refuse to chage. P-42 Close monitoring of classroom adviser with her students P-43 Implement the faculty manual strictly. P-44 Devise measures / steps that would address these adversities P-45 Human resource to review and revised job descriptions P-46 Develop new curriculum that can adapt the growing needs of education, conduct seminars and training for faculty. P-47 Development plans to include funds and human resources Question 5 : How do these challenges affect your performance as a principal? P-1 Challenges enable me to be more deligent in any work. P-2 NA P-3 These challenges makes me more determined to overcome them; just be creative P-4 Time, problems as they go along is resolve P-5 Becoming more vigilant. P-6 It gives me more wisdom in handling such situation. P-7 Appears that being bias is not a part of job P-8 Very great, more of important improvement and teaches me alot P-9 Scheduled activities was greatly affected P-10 Curriculum has to be revised based on the provided by Department of Education P-11 Workback on budget allocation (repeated works) P-12 Scheduled coaching and practices P-13 Low enrollment will affect effectiveness and attractiveness of the school in the community P-14 Review time management P-15 Greatly affected P-16 Financial matter is not so much of concerns but more of academics however, I give suggestions to remedy the problems. P-17 Concern with people in the organization and I cannot do it alone P-18 Inconsistency in the implementation caused too much pressures P-19 Consumed to much time entertaining questions P-20 These challenges make me work harder to find better ways to address them. P-21 It makes me stronger and better equipped in solving adversities. P-22 N.A. P-23 Adversities cannot be eliminated but only minimized.

clix
P-24 Can manage relationship with faculty and staff P-25 They really are challenging and I try to work on things in my faculty. P-26 Carry out meeting with faculty and parents P-27 Would provide skills and programs in dealing with hyperactive students P-28 Encouraged faculty and guidance counselors to study reasons and ways to support the third sex (either boy or girl) students P-29 Work closely with Human Resource management P-30 Learn to improve oneself P-31 Work closely with Human Resource management P-32 Justify to management the importance of the facilities for teaching learning process P-33 Health concern is important therefore priority is to reconstruct the piping layout and the food concern P-34 As principal or academic coordinator, I try to study and find solution to these adversities. P-35 Continuosly research on policy instead of accepting at once P-36 Strict implementation on lesson plan as a requirement P-37 Remind everyone of the faculty manual P-38 There's a need to adjust and be flexible. Strengthen marketing team P-39 By enlisting the suppport and cooperation of parishioners and parish/Church authorities P-40 Coordinate with Human Resource P-41 Can cause time and energy to move away from improving students learning. P-42 Develop an effective approach to classroom management P-43 Review relationship with faculties P-44 Take things positively. I face these as opportunities to function better P-45 Inclusion of values-based in the job description after a thorough review P-46 Adversity can develop us to function well in our assigned tasks. P-47 Became more aware that planning your work makes perfect. Question 6 : What specific tasks consumed most of your time? P-1 Delegating task not done by person to whom it is entrusted P-2 Planning, coordinating and monitoring activities. P-3 Making reports, attending to concerns; students,parents,teachers P-4 Request coming, supervision 10-20%, attending conferences P-5 Monitoring, supervising, planning, informal meeting and empowering P-6 Curriculum planning and reviewing of policies. P-7 Talking with people within the office or while supervising P-8 Evaluation of teachers through observation, curriculum review implementing changes. P-9 Prepare activities of the department (faculty & students) P-10 Curriculum development and review P-11 Budget allocation (repeated works)

clx
P-12 Prepare activities of the students P-13 Attending weekly, monthly meetings,or emergency meeting P-14 Calendaring of daily, weekly and monthly activities P-15 Coordination and delegation of tasks P-16 Multi-tasking, checking of reports;Lp's, rades, etc. coordinators are quite loaded that I could hardly delegate other tasks P-17 Coordinating meeting P-18 Advising faculty, parents, and student P-19 Consumed to much time entertaining questions P-20 Work that involves supervision of the school concerns that are within the parameters of my responsibility P-21 Keeping the department moving, monthly seeing to it that quality and standard sets are maintained P-22 Observation of classes; routine tasks like checking of lesson plans test questions, etc. P-23 Monitoring of daily operations. P-24 Constantly communicating with faculty, students P-25 Conference with students and academic/department problems, coaching tecahers. P-26 Carry out meeting with faculty and parents P-27 Would provide skills and programs in dealing with hyperactive students P-28 Encouraged faculty and guidance counselors to study reasons and ways to support the third sex (either boy or girl) students P-29 Work closely with Human Resource management P-30 Attend profesional development updates P-31 Work closely with Human Resource management P-32 Prepare written justifications, memos, correspondence P-33 Promotes health related programs P-34 Supervision/observation, meetings, dialogue w/ parents. P-35 Make action researches P-36 Checked lesson plan P-37 Explains faculty manual P-38 Monitoring teachers, students alike, physical plant, COB, TAP, instruction, etc. Pl-39 Administrative and supervisory functions P-40 Coordinating jobs P-41 N.A. P-42 Develop programs on classroom management P-43 Team building with faculty P-44 Meetings P-45 Apply 'management by walking around '

clxi
P-46 Curriculum development and discipline program P-47 Read book, newspaper and relevant materila Question 7 : Describe your style of leadership and how it is applied in your task? P-1 Delegate task to people according to their area of concern. P-2 Collaborative P-3 Collaborative principal and instructional leader P-4 Collaborative style on group,open door policy P-5 Transformational leadership, consultative, participative P-6 Democratic styles, teachers and staff are free to express suggestion/comments P-7 Depends on the situation and sometimes authoritative P-8 Philosophy of open door policy to al, other LS follows that depend on situation. P-9 Gives directions P-10 Delegate responsibility P-11 Combination of authoritative and delegating P-12 Coaching faculty and delegating task P-13 Participative style, P-14 Combination of authoritative and delegating P-15 Democratic and transparency P-16 I employ consultative management/leadership in decision making, transparent and hands-on. P-17 my style is democratic, but I make the final decision after consultation P-18 no answer P-19 no answer P-20 N.A. P-21 Democratic and autocratic leadership and allow freedom but maintain obedience to a given task P-22 Consultative type of leadership that is before the implementation of a new project; meetings are held for orientation and consultation P-23 Hands-on leadership by being with on what is to be done. P-24 no answer P-25 I think it's a combination of autocartic and democratic leadership. P-26 no answer P-27 Christian with touch of democratic P-28 no answer P-29 no answer P-30 no answer P-31 no answer P-32 no answer P-33 no answer P-34 I am more of democratic kind of a leader, I empower the coordinators and I believe in what they do P-35 no answer P-36 no answer P-37 no answer P-38 There's always open line communication. P-39 Participative style, tapping potential teachers for leadership and their areas of concerns. P-40 no answer P-41 Collaborative P-42 shared leadership(collaborative) teachers are encourage to participate in decision making P-43 no answer P-44 Democratic but I make the final decision after consultation.

clxii
P-45 one that is people-orinted encouraging everybody to their best. Working out prolem together P-46 I always wait on God's leading on the tasks given to me. P-47 I know time when I should make my own decision and when to consult my council and tell Question 8 : How do you communicate task with your subordinate? P-1 Relate the ojectives and communicate according to their level. Open communication P-2 Inform them what needs to be done, how it should be done, and ask them other ways they think it could be done P-3 Planning with the group P-4 Weekly & monthly meeting, monthly evaluation, annual planning P-5 Informal conversation, planning in informal meeting team building P-6 Through memos, and constant meetings, and one-on-one coaching P-7 Formal through letters and memorandum P-8 Formal letters, memos, text P-9 Formal and informal P-10 Through e-mail or texting especially when not in office P-11 Telephone for a faster action P-12 Minutes of the meetings P-13 Visiting the rooms or place where I can give the instruction P-14 Regular dept. meetings and brainstorming for ideas and suggestions P-15 I encourage them to be open when they have ideas and appropriate solution P-16 Through regular memos and meetings. P-17 Formal through letters and memorandum P-18 no answer P-19 no answer P-20 Regular dept. meetings and brainstorming for ideas and suggestions for tasks that are open to such. P-21 Letters, memos, dialogues P-22 through memos and meetings P-23 Through proper channels in terms of position. P-24 no answer P-25 Through both oral and written communication. Oral communication establish rapport; written for documentation P-26 no answer P-27 through courteous oral and written P-28 no answer P-29 no answer P-30 no answer P-31 no answer

clxiii
P-32 no answer P-33 no answer P-34 through meetings and memos. P-35 no answer P-36 no answer P-37 no answer P-38 Through weekly meetings and dialogue. P-39 Through conferences and informal sessions and direct instructions with teaches and other personnel. P-40 no answer P-41 Email, staff meetings, discussion forums, one-on-one conversations. P-42 memo and meetings P-43 no answer P-44 Tasks were communicated directly through correspondence and/or meetings P-45 memo, letters and personal communication P-46 We usually have meetings before implementing certain curriculum. P-47 Leaders must do the tasks first to communicate it to subordinates. through my coordination or through general faculty meeting Question 9 : What school practices do you use for your school improvement ? P-1 Periodic evaluation of teachers and open communication,especially on discipline P-2 Seminar, fund raising activities, curriculum enhancement P-3 In-service seminar, fellowship,use performance management system,regular distribution discussion of teaching resources P-4 Uses international curriculum, global in nature. P-5 Creative and openness, being consultative and respect for each other P-6 Stick to the mission/vision of the school, everything we practice according to goals and objective P-7 Guided by development plans in all areas P-8 Non-sectarian school sensetiveness in lesson planning, re-set training, job discription organization, student organization program P-9 Monthly Faculty/staff development program P-10 An active involvement of students in school affairs P-11 Establish community partnership and linkages P-12 Subjects involve higher order thinking skills (HOTS) development P-13 Provides feedback of student progress as well as evaluation of teacher P-14 Students- learning is promoted by qualified teachers P-15 Suggestion box P-16 Implementation of suggestions of FAPE and MAPEH and DACSA

clxiv
P-17 Uses various teaching strategies
P-18 Adapt instruction to student needs and correct misconception Pl-19 The establishment of Vision, Mission and Goal statement that gives a clear direction to school stakeholders P-20 N.A. P-21 Whatever is best for the occasion, time and situation, it is the combination of persuation and imposition. P-22 The open line comunication among the school's constituents. P-23 Evaluation and feedback P-24 Have clear Faculty manual, and student manual P-25 A. Orientation /clarification on school's vision-mission, objectives, thrust. B.everybody is encouraged to share the creativity. C. evaluation of activities done. P-26 Teacher work together to carry out instruction, plan curriculum P-27 Participative decision making is encourage to teachers P-28 Receive recognition for contributions to organization P-29 Different leadership styles is applied based on the needs of the organization P-30 Continously plans for more improvement through benchmarking P-31 Plan everything before action P-32 Empower teachers and students P-33 Establish community partnership and linkages P-34 I conduct a prodcutive faculty meeting like having professional readings, trivia discussion on DepEd memos, solving or giving tips on classroom management, sharing of experiences. P-35 Active linkages with government and non government organization P-36 Active involvement of parents and partner community with the school P-37 Research is part of teacher task to improve their teaching skills P-38 Faculty/student develoment program is on going. P-39 Conducting seminars, teach-ins, workshops and personal supervision P-40 human practices P-41 Self-study, formulation of school wide plan to foster school wide range. P-42 no answer P-43 no answer P-44 Regular meetings are held with the management P-45 comprehensive teacher training, student organization and faculty,student & staff dev P-46 School improvement always on the call and the administrations. P-47 curriculum improvement,faculty dev,student dev, and physical dev. Question 10 : How far has adversity in education affected its quality? P-1 Any obstacle or problems,rules or laws that hinder effective delivery of educational program P-2 It has some important goals to be achieved P-3 Communicates to address problems, avoid finger pointing or blaming and take note the

clxv
cause for future reference P-4 Goals, lesson attained,improve quality of services P-5 Controlling the situation early deter the adverse effort P-6 NA P-7 NA P-8 AQ in education makes changes, review policies. P-9 NA P-10 NA P-11 NA P-12 NA
P-13 NA P-14 NA P-15 Poor working relationship P-16 Adversity in education if not properly resolved/addressed will affect the quality of education of an institution. P-17 NA P-18 NA P-19 NA P-20 Genuine concerns on the part of all the stake-holders will lessen if not totally eradicate adversities in education. P-21 Adversity is what makes an education existing. We move because there are challenges to be addressed to. It becomes our guide and teacher in doing our work. P-22 Not a bit. P-23 As I said, adversities can only be minimized and not eleminated. It has been part and parcel I handling a school. P-24 NA P-25 Adversity should be conceived more as a challenge rather than a stumbling block. It's an opportunity for growth. P-26 NA P-27 not at all if solved and overcome at once P-28 NA P-29 NA P-30 NA P-31 NA P-32 NA P-33 NA P-34 Adversities in education should be managed well by the school offcials. P-35 NA P-36 NA P-37 NA P-38 These are normal situation however proper attentions must be done to address such adversities. P-39 No serious effecton quality of education due to solutions and adjustments made and applied to prevent occurrence of adverse conditions/situations.

clxvi
P-40 NA P-41 Depends on the school organization. P-42 not too far because we deal with the problems immediately so as not to affect operationd P-43 NA P-44 So far very little. Our school follows strict quality measures. P-45 many had suffered on illiteracy P-46 Adversity in education degrade the quality in education in our country. P-47 it leads us to move forward & do some innovation and development
Curriculum Vitae

clxvii
Lea D. Canivel
Address: 61 Valley View Avenue, Valley View Executive Village Ph.1, Valley Golf Cainta, Rizal Tel: (02)6581927 / Cellular: (0921)5365582 Email Add: [email protected] EDUCATION Graduate Master of Arts in Education University of the Philippines Tertiary Bachelor of Science in Chemical Engineering Feati University, Sta Cruz, Manila March 1970 Secondary Mapa High School Mendiola St., Manila March 1965 Elementary NASSCO Elementary School Mariveles,Bataan March 1961 PERSONAL DATA Age: 62 years old Sex: Female Date of Birth: March 22, 1948 Civil Status: Widow Nationality: Filipino Height: 5’0” Religion: Roman Catholic Weight: 120 lbs. WORK EXPERIENCED (latest) 1996- Present Cainta Catholic College Cainta, Rizal Head, Research Planning Development

clxviii