PRESENTATION OF Q2 2021 RESULTS
31
PRESENTATION OF Q2 2021 RESULTS Vilhelm Már Thorsteinsson, CEO
Transcript of PRESENTATION OF Q2 2021 RESULTS

PRESENTATION OF Q2 2021 RESULTSVilhelm Már Thorsteinsson, CEO

2
THIS IS EIMSKIPEimskip is a leading transportation company in the North-Atlantic providing container and reefer liner services with connections to international markets and is specialized in worldwide freight forwarding services with focus on frozen and chilled commodities
1. Operations in Iceland, Faroe Ship and Shipping department in Norway QoQ. Excluding VSA sailings from Reykjavik to Nuuk2. Q2 Iceland
ABOUT
17 VESSELS
31 WAREHOUSES 14 COLD STORAGES
CONTAINERSReefer 8.092 teusDry & other 22.502 teus
160 TRUCKS
55 OFFICES
42 NATIONALITIES
20 COUNTRIES
1619 EMPLOYEES30%Female
70%Male
SUSTAINABILITY KPI’S
SHARE OF SORTED WASTE 2
82%
GREENHOUSE GAS EMISSION 1
1%
BOARD OF DIRECTORS60% Female 40% Male
EXECUTIVE MANAGEMENT29% Female 71% Male
EQUITY:EUR 226 m (39.7%)
KEY FIGURES 6M 2021
TOTAL ASSETS: EUR 568 m
REVENUES:EUR 391 m
EBITDA: EUR 46.0 m
GEOGRAPHICALSPLIT OF REVENUE
41%
8%13%
8%
26%
4%
Iceland Norway
Asia Faroe Islands
Europe N-America

Q2STRONG OPERATIONAL RESULTS• Container liner performing well in the quarter
• Leveraging on revenue management, more favorable volume mix and conditions in global transportation markets
• Overall good volume with substantial growth in Trans-Atlantic services benefitting e.g. from global capacity & equipment shortage
• Good performance in International forwarding operation
• 3rd party expenses increasing due to disruption in global shipping markets
which affects revenue accordingly
• Leveraging on lower cost base following streamlining measures and integration
• Domestic Iceland with good results and increased activity
• Settlement made with the Icelandic Competition Authority (ICA) in the old competition case. The settlement amount of EUR 10.2 million expensed in the quarter

4
• International freight rates continue to increase and are currently at a record high level
• This situation is expected to last at least into 2022 e.g. due to;
• Lack of vessel capacity
• Shortage of containers
• Covid still has a negative impact both on sailing schedules and terminal productivity
• Negative impact due to Brexit on productivity and trade
• Vessel charter markets continue to be steep with substantial charter rates increase and lack of available tonnage
• Prolonged situation might eventually affect cost of chartered vessels
• Significant increase in new orders, but will take some time to come into operation
• ElbFeeder Inc.
• Eimskip holds 47.9% shares in the vessel holding company ElbFeeder Inc.
• Majority shareholder is the international shipping company Ernst Russ AG in Germany which is listed on the Frankfurt stock exchange [Scale segment]
• ElbFeeder owns 7 container vessels in the size range of 700-3,000 teus which are all on charter to various operators
• The increased charter rates in global vessel markets are positively affecting the results of ElbFeeder
CURRENT TRENDS IN GLOBAL CONTAINER SHIPPING MARKETSElbFeeder Inc. realizing the benefit of improved charter rates
Source: Dynaliner, Alphaliner and The Maritime Overview issue 08/09 2021
SHANGHAI CONTAINERISED FREIGHT INDEXWORLD CONTAINER INDEX
LONG-TERM DEV. (GEARED) – CHARTER RATES USD CONTAINER VESSEL ORDER BOOK / NEW BUILDS

5
68%
82%
0% 20% 40% 60% 80% 100%
Q2 2020
Q2 2021
Continued progress towards less environmental impact
SUSTAINABILITY KPI‘S – QoQ DEVELOPMENT
SHARE OF SORTED WASTE
Operations in Iceland, Faroe Ship and Shipping depart. in Norway
0
1,000,000
2,000,000
3,000,000
4,000,000
5,000,000
Q2 2020 Q2 2021
kWh
Electricity in Iceland
Electricity consumption is 15% higher due to increased transport of temperature-controlled containers and the fact that all harbor cranes in Reykjavík now work on electricity instead of fossil fuel
Share of sorted waste increasing from 68% to 82% sorted waste as a result of great teamwork in waste management from many units of the Company
ENERGY FROM ELECTRICITY
15%
Radical changes in energy source needed toreach target before 2030
GHG EMISSIONS PER TRANSPORTED TON
Reduced GHG emissions per unit of transported cargo*
1%
CO2
CO2
* Excluding VSA sailings from Reykjavik to Nuuk

FINANCIAL RESULTS

7
EUR thousand Q2 2021* Q2 2020 Change %
Revenue 211,134 160,615 50,519 31.5%
Adjusted Expenses 181,420 144,614 36,806 25.5%
Salary and related expenses 30,613 29,802 811 2.7%
Adjusted EBITDA 29,714 16,001 13,713 85.7%
Depreciation and amortization (12,243) (10,966) (1,277) 11.6%
Adjusted EBIT 17,471 5,035 12,436 247.0%
Net finance expense (2,060) (2,402) 342 (14.2%)
Share of profit of equity accounted investees 957 473 484 102.3%
Adjusted Net earnings before income tax 16,368 3,106 13,262 427.0%
Income tax (3,031) (651) (2,380) 365.6%
Adjusted Net earnings for the period 13,337 2,455 10,882 443.3%
Key ratios
EBITDA ratio 14.1% 10.0%
EBIT ratio 8.3% 3.1%
Profit margin 6.3% 1.5%
Return on equity 23.4% 4.3%
INCOME STATEMENTStrong operating performance in Q2 adjusted for settlement with ICA
• Strong operational performance exceeding management expectations
• Revenue increase by 31%
• Significant price increases from 3rd party transportation suppliers, from which Eimskip purchases on behalf of its customers, are resulting in corresponding increase in sales revenue
• Revenue management, more favorable product mix and increased share of Trans-Atlantic services contributing to increased revenue in liner
• Positive volume effect in both liner and forwarding services
• Adjusted expenses up by 25%
• 3rd party transportation expenses increasing substantially due to COVID related global disruptions
• Salaries expense increase by EUR 0.8m or 2.7%
• Effect of FTE changes EUR -0.8m, currency effect of EUR +0.8m and other including general wage increases +0.8m
• Adjusted EBITDA increases by EUR 13.7m or 86%
• Improved results in Container Liner main driver for increased EBITDA
• Continued strong performance in international forwarding benefitting from e.g. higher general price levels
• Adjusted EBIT increases by EUR 12.4m up to EUR 17.5m
• New vessels and renewed charter agreements increase depreciation
• Share of profit from equity accounted investees increases through ownership in ElbFeeder due to higher vessel charter income
• Continued positive contribution expected, given current
market conditions
Q2
*Q2 2021 adjusted for settlement with the Icelandic Competition Authority (ICA) in the amount of EUR 10.2 m expensed in the quarter. Results as reported for the quarter can be seen on slide 27 in the appendix.
*
8
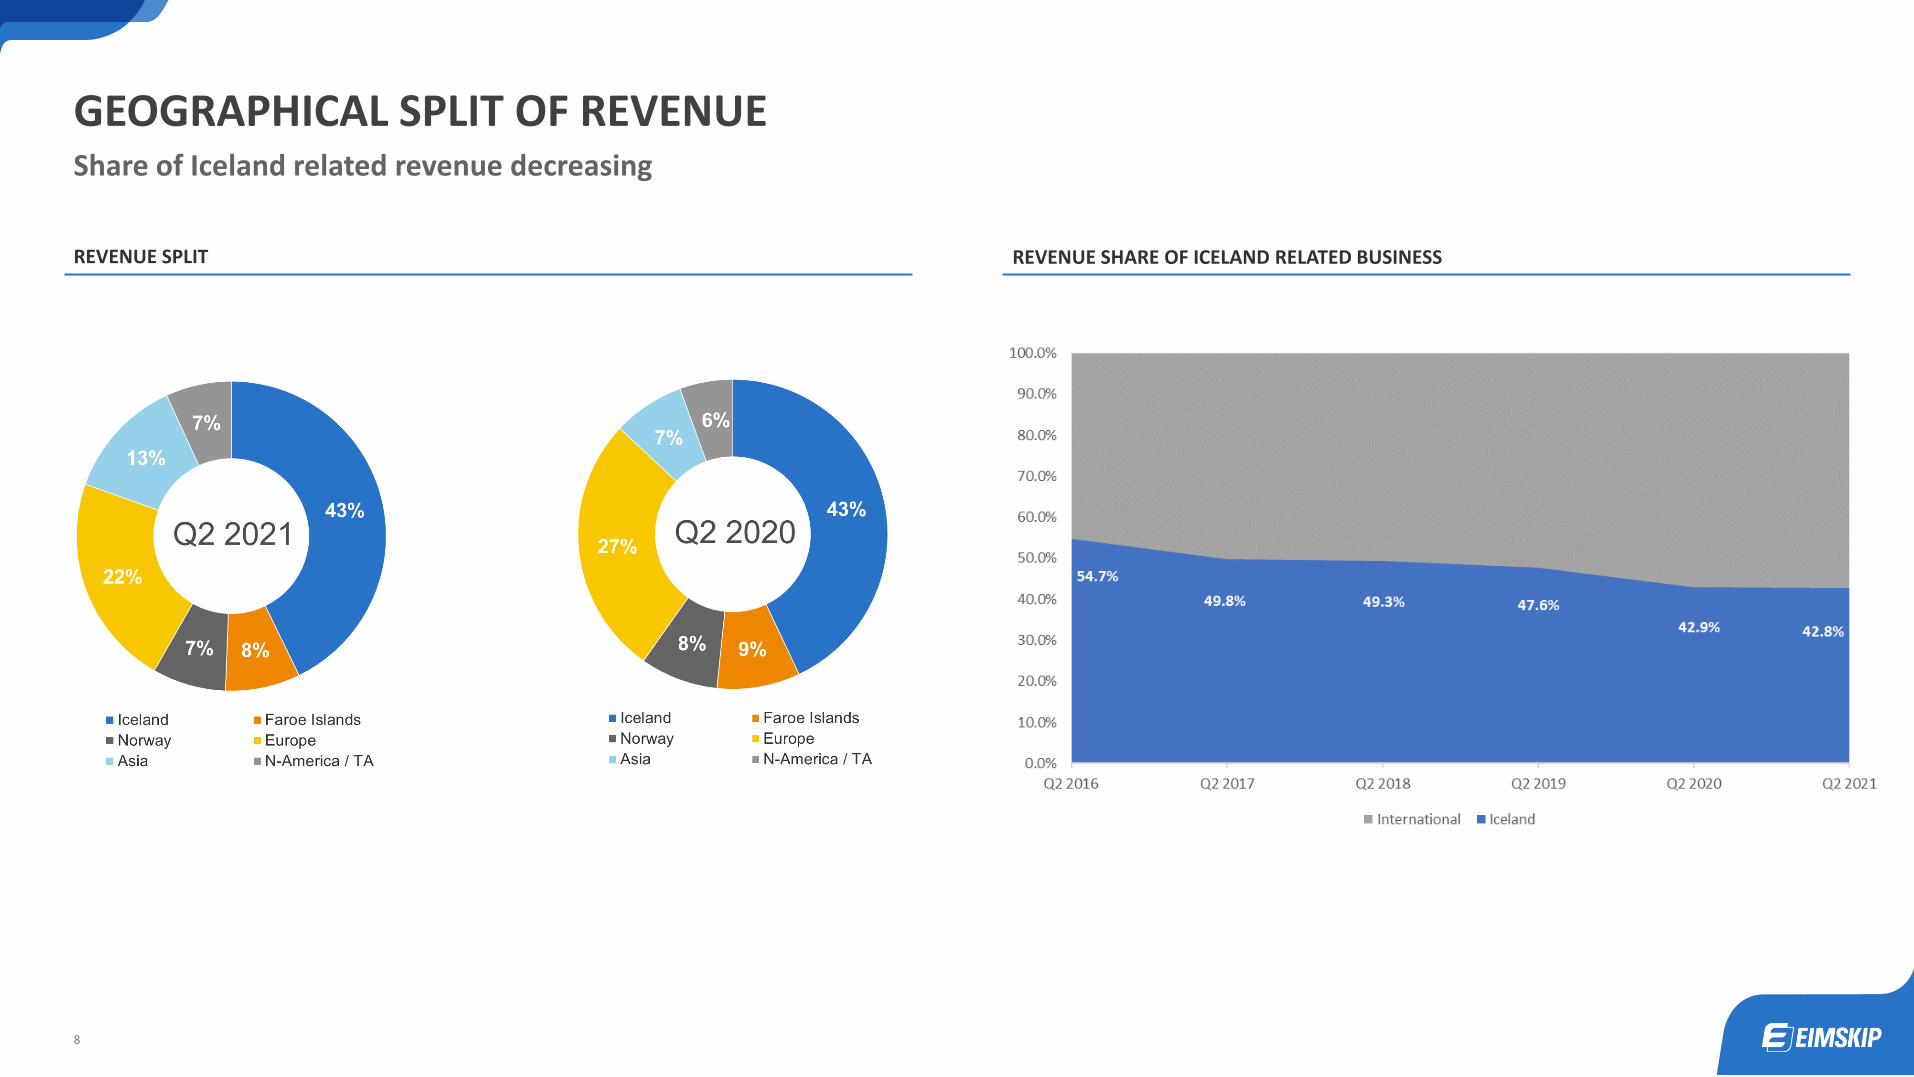
GEOGRAPHICAL SPLIT OF REVENUEShare of Iceland related revenue decreasing
REVENUE SPLIT REVENUE SHARE OF ICELAND RELATED BUSINESS

9
EXPENSE BRIDGEInternational freight rates increase resulting in significantly higher 3rd party expenses
EXPENSE BRIDGE
• Significant price increases from 3rd party transportation suppliers, from which Eimskip purchases on behalf of its customers, due to COVID related global disruptions
• Largest 3rd party expense items are purchase of pre- and on-carriage, sea-transportation and terminal handling
• 3rd party expenses mainly variable expenses charged with margin to customers with corresponding increase in revenue and sales
• Higher bunker expenses mainly due to increased consumption
• Increased capacity in container liner compared to same quarter last year when capacity was reduced due to COVID
• Sailing to Greenland under vessel sharing agreement with Royal Arctic Line
• Higher liner and equipment expenses increase due to increased activity
Q2

10
Strong performance of the container liner services compared to low results same quarter last year
BY BUSINESS ACTIVITY CONTAINER LINER SYSTEM
EBITDA BRIDGE
• Volume effect due to increased economic activities in main liner business areas, conditions in global transportation markets and focus on business origination
• Price effect due to revenue management, more favorable volume mix, increased share of Trans-Atlantic and conditions in global transportation markets

11
Strong performance of the container liner services compared to low results same quarter last year
EBIT BRIDGE
BY BUSINESS ACTIVITY CONTAINER LINER SYSTEM
• Network cost affected by increased depreciation due to new vessels Dettifoss and Bruarfoss and higher charter leases increasing IFRS16 depreciation

12
EUR thousand 6M 2021* 6M 2020 Change %
Revenue 391,362 322,285 69,077 21.4%
Expenses 345,339 296,946 48,393 16.3%
Salary and related expenses 59,844 59,555 289 0.5%
Adjusted EBITDA 46,023 25,339 20,684 81.6%
Depreciation and amortization (24,040) (21,898) (2,142) 9.8%
Adjusted EBIT 21,983 3,441 18,542 538.9%
Net finance expense (3,256) (5,042) 1,786 (35.4%)
Share of profit of equity accounted investees 1,178 156 1,022 655.1%
Adjusted Net earnings (loss) before income tax 19,905 (1,445) 21,350 -
Income tax (3,734) (1,051) (2,683) 255.3%
Adjusted Net earnings (loss) for the period 16,171 (2,496) 18,667 -
Key ratios
EBITDA ratio 11.8% 7.9%
EBIT ratio 5.6% 1.1%
Profit margin 4.1% (0.8%)
Return on equity 14.2% (2.2%)
INCOME STATEMENT AND BRIDGE ANALYSIS 6MOperating performance adjusted for settlement with ICA exceeding management expectations
*6M 2021 adjusted for settlement with the Icelandic Competition Authority (ICA) in the amount of EUR 10.2 m expensed in Q2. Results as reported quarter by quarter can be seen on slide 27 in the appendix.
EBIT BY BUSINESS ACTIVITY
EBITDA BY BUSINESS ACTIVITY
*

SEGMENTS ANALYSIS

14
EUR thousand Q2 2021 Q2 2020 Change % 6M 2021 6M 2020 Change %
Revenue 132,741 103,452 29,289 28.3% 237,773 203,813 33,960 16.7%
Expenses 111,333 93,993 17,340 18.4% 206,750 189,960 16,790 8.8%
Salary and related 22,626 22,506 120 0.5% 44,284 44,969 (685) (1.5%)
EBITDA 21,408 9,459 11,949 126.3% 31,023 13,853 17,170 123.9%
EBIT 10,884 208 10,676 - 10,386 (4,621) 15,007 -
Net earnings 8,957 (526) 9,483 - 8,480 (7,773) 16,253 -
Key ratios
EBITDA ratio 16.1% 9.1% 13.0% 6.8%
EBIT ratio 8.2% 0.2% 4.4% (2.3%)
Revenue per ton 252 220 33 14.8% 244 214 30 13.8%
EBITDA per ton 41 20 21 102.5% 32 15 17 118.5%
Return on allocated equity 19.3% (1.1%) 9.1% (8.2%)
Revenue and expenses include inter-segment revenue and expenses
DEVELOPMENT IN LINER SERVICESStrong performance on back of revenue management, volume development and supported by favorable market conditions
• Good activity in main markets resulting in increased volume, but coming from a low-level last year due to COVID
• Trans-Atlantic services main driver for volume increase in Q2
• Good export from Iceland following a slow first quarter mainly as a result of increased fresh fish transport and capelin season
• Import to Iceland continues to improve with increased economic activity and tourism
• Good growth in Faroe Islands but same quarter last year was significantly affected by COVID
VOLUME Q2
PERFORMANCE Q2
• Strong focus for the past quarters on improving performance in container liner services is now yielding positively
• The disruption in the global transportation market environment is leading to higher pricing and increased revenue but negatively affecting expenses e.g. chartering of vessels and liner equipment
• Leveraging on revenue management, volume growth and more favorable volume mix
• Improved performance ratios and strong return on allocated equity

15
LINER VOLUME BRIDGE Strong volume growth in Trans-Atlantic services
Q2 6M
Volume (Tons ‘000)Volume (Tons ‘000)

16
CONTAINER LINER ANALYSISStrong vessel utilization and number of empty containers in Sundahöfn terminal shows good balance
VESSEL UTILIZATION NUMBER OF EMPTY CONTAINERS IN SUNDAHÖFN TERMINAL

17
EUR thousand Q2 2021 Q2 2020 Change % 6M 2021 6M 2020 Change %
Revenue 94,069 69,970 24,099 34.4% 179,047 141,301 37,746 26.7%
Expenses 85,763 63,428 22,335 35.2% 164,047 129,815 34,232 26.4%
Salary and related 7,988 7,803 185 2.4% 15,561 14,586 975 6.7%
EBITDA 8,306 6,542 1,764 27.0% 15,000 11,486 3,514 30.6%
EBIT 6,587 4,827 1,760 36.5% 11,597 8,062 3,535 43.8%
Net earnings 4,380 2,981 1,399 46.9% 7,691 5,277 2,414 45.7%
Key ratios
EBITDA ratio 8.8% 9.3% 8.4% 8.1%
EBIT ratio 7.0% 6.9% 6.5% 5.7%
Revenue per teus 1,872 1,515 357 23.5% 1,813 1,518 295 19.4%
EBITDA per teus 165 142 24 16.7% 152 123 28 23.1%
Return on allocated equity 43.5% 35.4% 38.2% 31.3%
Revenue and expenses include inter-segment revenue and expenses
DEVELOPMENT IN FORWARDING SERVICESStrong performance in a market characterized by very high global prices and capacity constraints
PERFORMANCE Q2
• Challenging market conditions with capacity constraints and equipment shortage disrupting global volume flow and increasing prices
• Affecting both revenue and expenses
• Increased EBITDA per teus and strong return on allocated equity as a result of good volume and increased prices
• Leveraging on lower cost base following streamlining measures and integration
• Reefer forwarding volume up by 1.0% QoQ which is very good in the challenging market environment with capacity constraints and equipment shortage
• Strong growth in dry volume QoQ mainly driven by increase in China, The Netherlands and Poland
VOLUME Q2

18
FORWARDING VOLUME Share of reefer volume decreasing QoQ due to market conditions
VOLUME SPLIT Q2 VOLUME BRIDGE Q2

CASHFLOW AND BALANCE SHEET
20
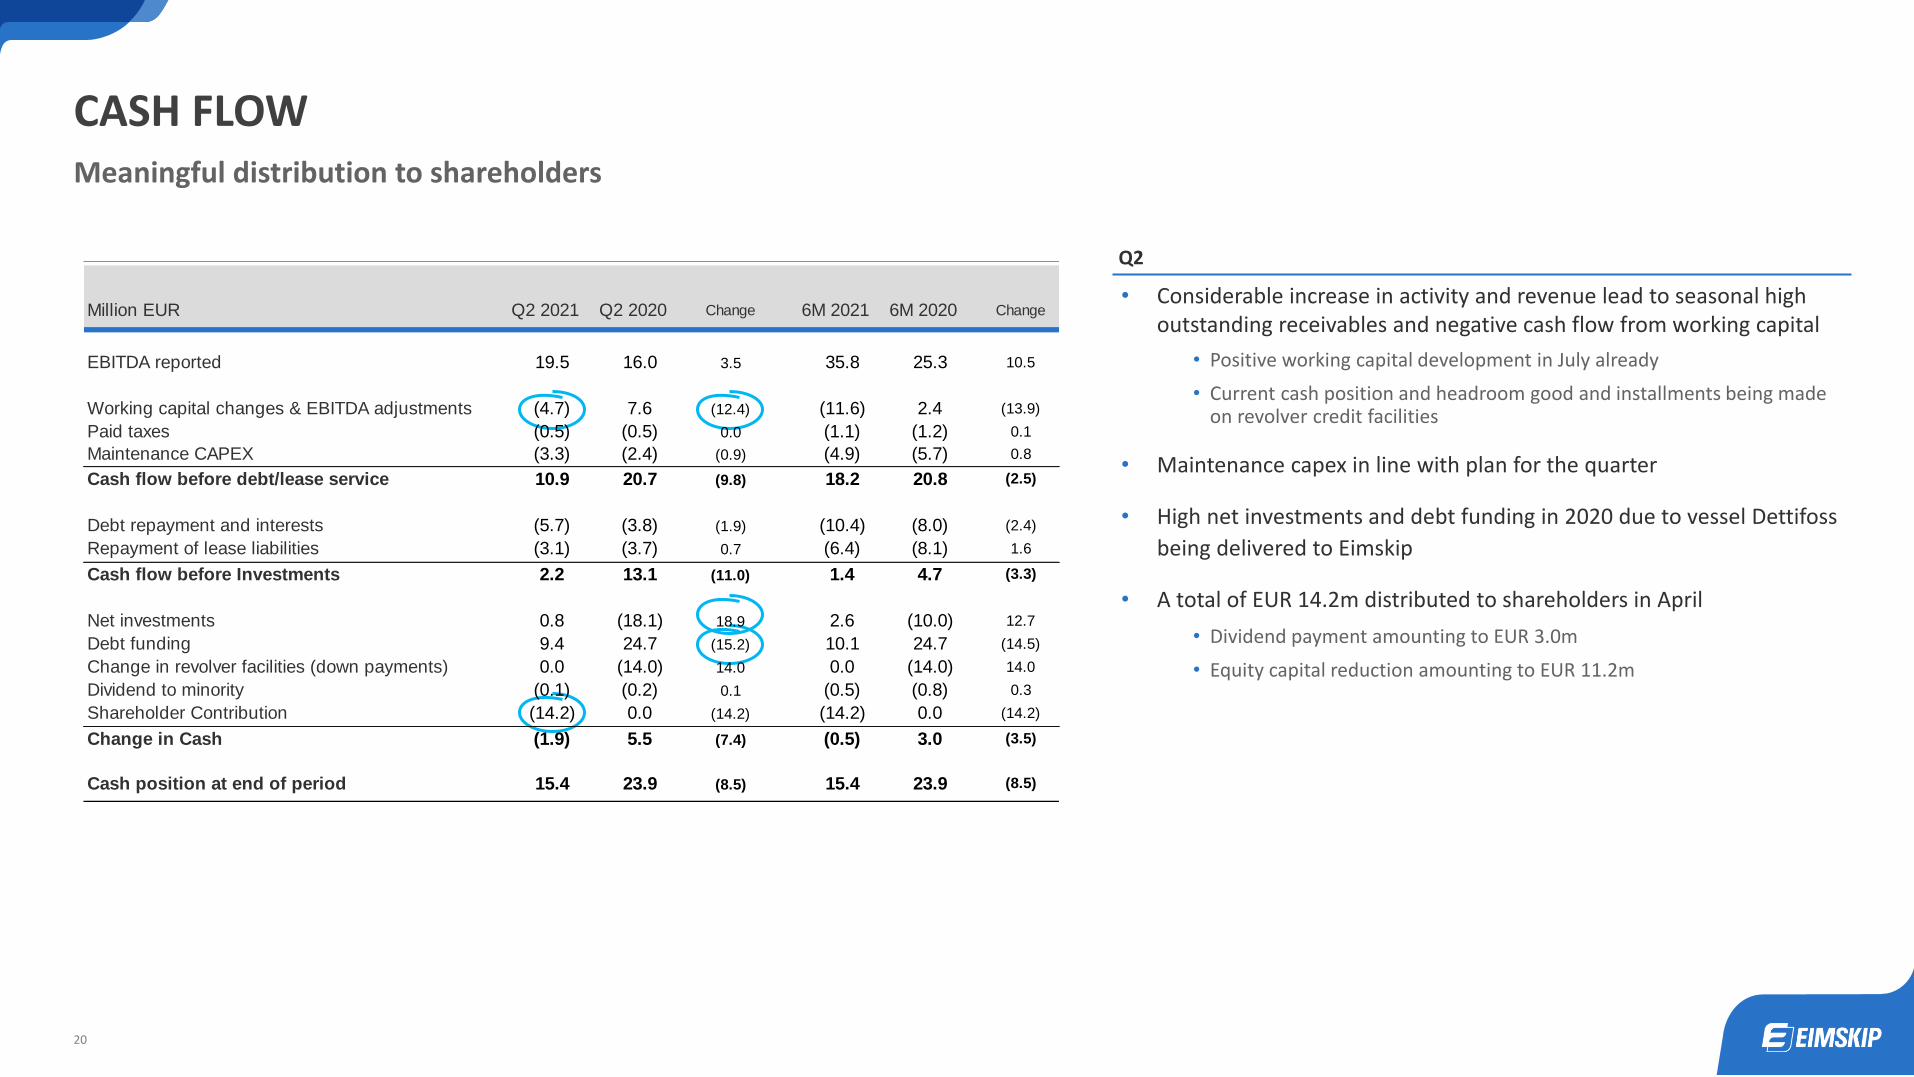
CASH FLOWMeaningful distribution to shareholders
• Considerable increase in activity and revenue lead to seasonal high outstanding receivables and negative cash flow from working capital
• Positive working capital development in July already
• Current cash position and headroom good and installments being made on revolver credit facilities
• Maintenance capex in line with plan for the quarter
• High net investments and debt funding in 2020 due to vessel Dettifoss
being delivered to Eimskip
• A total of EUR 14.2m distributed to shareholders in April
• Dividend payment amounting to EUR 3.0m
• Equity capital reduction amounting to EUR 11.2m
Q2
Million EUR Q2 2021 Q2 2020 Change 6M 2021 6M 2020 Change
EBITDA reported 19.5 16.0 3.5 35.8 25.3 10.5
Working capital changes & EBITDA adjustments (4.7) 7.6 (12.4) (11.6) 2.4 (13.9)
Paid taxes (0.5) (0.5) 0.0 (1.1) (1.2) 0.1
Maintenance CAPEX (3.3) (2.4) (0.9) (4.9) (5.7) 0.8
Cash flow before debt/lease service 10.9 20.7 (9.8) 18.2 20.8 (2.5)
Debt repayment and interests (5.7) (3.8) (1.9) (10.4) (8.0) (2.4)
Repayment of lease liabilities (3.1) (3.7) 0.7 (6.4) (8.1) 1.6
Cash flow before Investments 2.2 13.1 (11.0) 1.4 4.7 (3.3)
Net investments 0.8 (18.1) 18.9 2.6 (10.0) 12.7
Debt funding 9.4 24.7 (15.2) 10.1 24.7 (14.5)
Change in revolver facilities (down payments) 0.0 (14.0) 14.0 0.0 (14.0) 14.0
Dividend to minority (0.1) (0.2) 0.1 (0.5) (0.8) 0.3
Shareholder Contribution (14.2) 0.0 (14.2) (14.2) 0.0 (14.2)
Change in Cash (1.9) 5.5 (7.4) (0.5) 3.0 (3.5)
Cash position at end of period 15.4 23.9 (8.5) 15.4 23.9 (8.5)

21
Low maintenance CAPEX in the first six months but full year expected to be on budget
DEVELOPMENT IN CAPEX
• Maintenance CAPEX EUR 4.9m compared to EUR 5.7m in 6M 2020
• Longer delivery times of ordered equipment from suppliers
• Full year maintenance CAPEX estimated to be on budget or approx. EUR 15m
• Maintenance CAPEX plan for 2022 – 2023 already published at EUR 18m per year
• New investments EUR 0.6m compared to EUR 20.4m in 6M 2020
• Investment budget for the full year 2021 of approx. EUR 5m likely to be lower than budget and delayed into 2022
• EUR 18.5m investment in the vessels Dettifoss and Bruarfoss in 2020
• Investment plan for 2022 – 2023 already published in the range of EUR 5 - 10m per year
6M

22
EUR thousand 30.06.2021 31.12.2020 Change %
Equity 225,669 230,657 (4,988) (2.2%)
Non-current liabilities 217,595 208,486 9,109 4.4%
Loans and borrowings 151,099 145,781 5,318 3.6%
Lease liabilities 57,088 53,292 3,796 7.1%
Other non-current liabilities 9,408 9,413 (5) (0.1%)
Current liabilities 124,666 96,988 27,678 28.5%
Loans and borrowings 13,343 15,236 (1,893) (12.4%)
Lease liabilities 13,114 10,861 2,253 20.7%
Trade and other payables 87,990 70,891 17,099 24.1%
Unpaid settlement with the ICA 10,219 0 10,219 -
Liabilities 342,261 305,474 36,787 12.0%
Equity and liabilities 567,930 536,131 31,799 5.9%
Key ratios
Equity ratio 39.7% 43.0%
Net debt 215,253 205,168 10,085 4.9%
- excl. operational leases 149,722 145,712 4,010 2.8%
Net debt / LTM-EBITDA adjusted* 2.61 3.54
- excl. operational leases 2.27 3.15
BALANCE SHEETAffected by changes in working capital items due to higher activity and seasonality
ASSETS EQUITY AND LIABILITIES
• Fixed assets decreasing due to lower CAPEX level compared to last years
• Increase in trade receivables and payable due to higher activity and seasonality
• Unpaid settlement with ICA paid in July
• Equity ratio in line with long-term target of 40%
• Adjusted leverage ratio at 2.61 which is within target of 2-3x Net debt/EBITDA
*Adjusted for settlement with the Icelandic Competition Authority (ICA) in the amount of EUR 10.2 m
EUR thousand 30.06.2021 31.12.2020 Change %
Non-current assets 394,399 400,433 (6,034) (1.5%)
Fixed assets 300,311 311,310 (10,999) (3.5%)
Right-of-use assets 72,061 67,376 4,685 7.0%
Other non-current assets 22,027 21,747 280 1.3%
Current assets 173,531 135,698 37,833 27.9%
Trade receivables 151,273 115,452 35,821 31.0%
Other current assets 6,873 4,606 2,267 49.2%
Cash and cash equivalents 15,385 15,640 (255) (1.6%)
Assets 567,930 536,131 31,799 5.9%

OUTLOOK

24
OUTLOOK
HIGHLIGHTS OF CURRENT QUARTER OUTLOOK AND UPDATED GUIDANCE
• Strong results in July and outlook for August is promising although slower than previous months due to seasonality
• Export from Iceland and Faroe Islands lacking mackerel volume compared to same time last year
• Volume continues to be strong in Trans-Atlantic services with average higher freight rates than previous quarters
• Overall good performance in Forwarding services
• Effects of disruption in global transportation markets increasing, if anything, affecting both revenue and expenses
• Rates increasing in both Forwarding and Liner services
• Pressure on vessel charter markets driving up charter rates and market value of vessels
• The Executive Management is extremely pleased with employee resilience and resourcefulness during challenging times which results in good operational results
• Optimistic about the volume and margins for the remainder of the year
• Current situation in global transportation markets expected to last at least into 2022 affecting both revenue and expenses
• Prolonged situation will eventually negatively affect cost of the sailing system
• Updated Guidance for adjusted EBITDA* for the year 2021 is in the range of EUR 90 - 100m compared to EUR 77 - 86m as previously published
• Translates to adjusted EBIT of EUR 41 - 51m
• Based on actual operational results for 6M 2021, management accounts for July now available, current outlook for August and updated forecast for the remainder of the year
• The broad range in the guidance represents the uncertainty and volatility in the global transportation markets
• Eimskip’s guidance for the year depends on several factors and is subject to uncertainties related to COVID-19, development of freight rates, bunker prices, currency exchange rates, macroeconomic conditions in the countries Eimskip operates in and other external factors
*Guidance for adjusted EBITDA and EBIT does not include the financial impact of the settlement with the Icelandic Competition Authority (ICA) in the amount of EUR 10.2 million

THANK YOU
25

APPENDIX I
26

27
RESULTS BY QUARTER AS REPORTED
EUR thousand
OPERATING RESULTS Q3 2020
Revenue 211,134 180,228 175,653 170,378 160,615
Expenses 191,639 163,919 160,724 148,968 144,614
Settlement with ICA 10,219 0 0 0 0
EBITDA 19,495 16,309 14,929 21,410 16,001
EBIT 7,252 4,512 3,201 10,446 5,035
Net earnings (loss) earnings for the period 3,118 2,834 783 6,164 2,455
EBITDA ratio 9.2% 9.0% 8.5% 12.6% 10.0%
EBIT ratio 3.4% 2.5% 1.8% 6.1% 3.1%
BALANCE SHEET 30.9.2020
Assets 567,930 552,539 536,131 535,780 540,602
Equity 225,669 222,022 230,657 228,126 222,408
Liabilities 342,261 330,517 305,474 307,654 318,194
Interest-bearing debt 234,644 225,176 217,877 217,877 229,917
Net debt 215,253 203,649 191,907 191,907 201,457
Equity ratio 39.7% 40.2% 43.0% 41.1% 41.1%
Return on equity 5.6% 5.0% 1.4% 1.4% 4.3%
CASH FLOW
Net cash from operating activities 12,336 7,770 12,549 15,487 21,965
Net cash (used in) provided by investing activities (2,522) (162) (19,540) (3,452) (20,470)
Net cash (used in) provided by financing activities (11,709) (6,224) 432 (13,431) 4,033
Cash and cash equivalents at the end of the period 15,385 17,212 15,640 21,895 23,904
Q2 2020
Q2 2020
Q4 2020
31.12.2020
Q4 2020 Q3 2020
30.6.2020
Q2 2021
30.06.2021
Q2 2021
Q1 2021
31.3.2021
Q1 2021

28
LEASE LIABILITIES (IFRS 16)Higher charter rates and land lease agreements affecting lease liabilities during the year
• New and renewed long-term land lease agreements account for EUR 5.3m of lease liability increase
• Effects of land leases minimal in EBITDA but high in liability due to long terms
• Material increases in charter rates and longer agreements result in EUR 2.0m increase in lease liability
• Vessel leases have proportionally larger effect on the Income Statement than on the Balance Sheet
• IFRS 16 effect on EBITDA EUR 8.8m compared to EUR 7.9m in the same period last year
• Increase in vessel charter rates main reason for the increase
6M
Lease liabilities
IFRS 16 - Impact on EBITDA
IFRS 16 LEASE LIABILITIES BRIDGE ANALYSIS

29
SHAREHOLDERS INFORMATION
PAYMENTS TO SHAREHOLDERS
SHARE PRICE DEVELOPMENT FROM LISTING
EUR ‘000
SHAREHOLDERS 18.8.2021
Shareholder Country Shares %
Samherji Holding ehf. Iceland 59,953,585 34.22%
Gildi - lífeyrissjóður Iceland 26,530,490 15.14%
Lífeyrissjóður verslunarmanna Iceland 24,924,181 14.23%
Stapi lífeyrissjóður Iceland 9,485,253 5.41%
Birta lífeyrissjóður Iceland 9,116,259 5.20%
Lífeyrissj.starfsm.rík. A-deild Iceland 8,240,697 4.70%
Stefnir - Innlend hlutabréf hs. Iceland 6,031,159 3.44%
Almenni lífeyrissjóðurinn Iceland 3,218,098 1.84%
Söfnunarsjóður lífeyrisréttinda Iceland 3,198,754 1.83%
Stefnir - ÍS 5 Iceland 2,833,684 1.62%
Top 10 shareholders 153,532,160 87.63%
Other 692 shareholders 21,636,130 12.35%
Total outstanding shares 175,168,290 99.98%
Treasury shares 31,710 0.02%
Total shares 175,200,000 100.00%

DISCLAIMER