AUGUST 5, 2021 Q2 2021 Financial Results
14
Copyright © 2021 Quotient Technology Inc. All Rights Reserved. Quotient, the Quotient logo, and the Coupons.com logo are trademarks or registered trademarks of Quotient Technology Inc. and its subsidiaries in the United States and other countries. Other marks are the property of their respective owners. Confidential and Proprietary Information of Quotient Technology Inc. Please Do Not Copy or Circulate. We do not make any guarantees regarding outcomes that this product will meet your company’s unique needs. 1 Q2 2021 Financial Results AUGUST 5, 2021
Transcript of AUGUST 5, 2021 Q2 2021 Financial Results

Copyright © 2021 Quotient Technology Inc. All Rights Reserved. Quotient, the Quotient logo, and the Coupons.com logo are trademarks or registered trademarks of Quotient Technology Inc. and its subsidiaries in the United States and other countries. Other marks
are the property of their respective owners. Confidential and Proprietary Information of Quotient Technology Inc. Please Do Not Copy or Circulate. We do not make any guarantees regarding outcomes that this product will meet your company’s unique needs.
1
Q2 2021 Financial Results
AUGUST 5, 2021

Copyright © 2021 Quotient Technology Inc. All Rights Reserved. Quotient, the Quotient logo, and the Coupons.com logo are trademarks or registered trademarks of Quotient Technology Inc. and its subsidiaries in the United States and other countries. Other marks
are the property of their respective owners. Confidential and Proprietary Information of Quotient Technology Inc. Please Do Not Copy or Circulate. We do not make any guarantees regarding outcomes that this product will meet your company’s unique needs.
2
Forward Looking StatementThis presentation and the accompanying oral presentation contain “forward-looking” statements that are based on our management’s beliefs and assumptions and on information currently available to
management, including our current expectations with respect to revenues, Adjusted EBITDA and Adjusted EBITDA margin; trends in bookings patterns for the third quarter of 2021; non-GAAP operating
expenses; weighted average basic shares outstanding for 2021; mix between media and promotion offerings as continuing to have primary impact on our overall gross margin, trends in our gross margin for the
remainder of 2021 including an expected stabilization in gross margin in the second half of 2021; growth in our promotions business and a shifting more of our business to automation and self-service leading to
improved profitability over time; the degree of shift of offline promotions dollars from free standing inserts to digital; smaller CPGs being a growth driver for our promotion and media platforms, and continuation
of the growth trend in bookings with respect to smaller CPGs; our performance-based marketing platform being a desirable choice for CPG advertisers of all sizes; growth in demand for our national
promotions, retail performance media (RPM), digital out of home (DOOH), and sponsored search solutions; the continuing value to retailers of alternative revenue streams generated by their engagement with
our RPM platform, and especially given challenges facing retailers including pricing pressure and difficult year-over-year performance comparisons; our new, multi-touch, impression-based attribution
measurement with self-serve capabilities within our Quotient Analytics Platform being significantly useful to advertisers, a further differentiator of our offerings and an elevator of Quotient’s value proposition; our
efforts to expand the channels through which we can reach shoppers with our advertisers’ national promotions, including through building relationships with strategic partners; circumstances confronting our
business including the pandemic resurgence in some geographic areas, changes in consumer spending habits that may accompany government stimulus, and how the re-opening of the country may trigger
changes in promotion redemption behavior; benefits to us from growth in promotion/media budgets and demand our higher-margin offerings such as digital paperless and national rebates; and benefits from
automation of processes where possible. Forward-looking statements are based on our current plans, objectives, estimates, expectations and intentions and inherently involve significant risks and uncertainties.
Actual results and the timing of events could differ materially from those anticipated in such forward-looking statements as a result of these risks and uncertainties, which include, without limitation, our ability to
generate positive cash flow and become profitable; the amount and timing of digital marketing spend by CPGs and shifts in CPG spend to digital; our ability to scale our solutions and platforms; our ability to
adapt to changing market conditions and privacy and data regulations, including our ability to adapt to changes in consumer habits and consumer data privacy concerns; the impacts of the ongoing
COVID-19 pandemic, which may continue to impact our business, and results of operations even in light of mass vaccination efforts currently underway; our ability to negotiate fee arrangements with CPGs
and retailers, including renewals with significant CPGs and retailers; our ability to maintain and expand the use by consumers of promotions and offers on our platforms; our ability to execute our media and
promotions strategies; our ability to effectively manage our growth; the performance of our various solutions; our ability to successfully integrate acquired companies into our business; our ability to develop
and launch new services and features; our expectations regarding growth drivers; and other factors identified in our filings with the Securities and Exchange Commission ("SEC"), including our Annual Report on
Form 10-K and Quarterly Report on Form 10-Q filed with the SEC on February 23, 2021 and May 10, 2021, respectively, and future filings and reports by us. We disclaim any obligation to update information
contained in these forward-looking statements whether as a result of new information, future events, or otherwise and does not assume responsibility for the accuracy and completeness of the forward-looking
statements. In addition to the U.S. GAAP financials, this presentation includes certain non-GAAP financial measures. The non-GAAP measures have limitations as analytical tools and you should not consider
them in isolation or as a substitute for an analysis of our results under U.S. GAAP. There are a number of limitations related to the use of these non-GAAP financial measures versus their nearest GAAP
equivalents. For example, other companies may calculate non-GAAP financial measures differently or may use other measures to evaluate their performance, all of which could reduce the usefulness of our
non-GAAP financial measures as tools for comparison. We consider these non-GAAP financial measures to be important because they provide useful measures of the operating performance of the company,
exclusive of unusual events or factors that do not directly affect what we consider to be our core operating performance and are used by our management for that purpose. The use of non-GAAP measures is
further discussed in the accompanying press release and stockholder letter, which have been furnished to the SEC on Form 8-K and posted on our website. The press release defines our non-GAAP financial
measure of Adjusted EBITDA. The stockholder letter also defines our non-GAAP financial measure of Adjusted EBITDA, non-GAAP Gross Margins and non-GAAP Operating Expenses. A reconciliation between
GAAP and non-GAAP measures can also be found in the accompanying press release, stockholder letter and in the Appendix hereto. A reconciliation of Adjusted EB ITDA, non-GAAP Gross Margins and non-
GAAP Operating Expenses, all of which are non-GAAP guidance measures, to a corresponding GAAP measure is not available on a forward-looking basis without unreasonable efforts due to the high
variability and low visibility of certain (income) expense items that are excluded in calculating Adjusted EBITDA, non-GAAP Gross Margins and non-GAAP Operating Expenses.

Copyright © 2021 Quotient Technology Inc. All Rights Reserved. Quotient, the Quotient logo, and the Coupons.com logo are trademarks or registered trademarks of Quotient Technology Inc. and its subsidiaries in the United States and other countries. Other marks
are the property of their respective owners. Confidential and Proprietary Information of Quotient Technology Inc. Please Do Not Copy or Circulate. We do not make any guarantees regarding outcomes that this product will meet your company’s unique needs.
3
Q2 Business Highlights
Delivered another quarter of strong revenue of $123.9M.
Launched new multi-touch, impression-based attribution media measurement solution with self-serve capabilities with early adopters including Nestlé, Coca-Cola, Mondelēz andBimbo Bakeries.
Expanded our reach with our promotion amplification tool as Albertsons recently went live with this solution and Hy-Vee is expected to launch this offering in the near future.
Signed and went live with Microsoft andMSN.com to offer coupons from Quotient’s national network through their properties.
AdExchanger Names Quot ient a Programmatic Power P layer for 2021
Secured award through our core capabi l i t ies in performance market ing and
media planning & buying

Copyright © 2021 Quotient Technology Inc. All Rights Reserved. Quotient, the Quotient logo, and the Coupons.com logo are trademarks or registered trademarks of Quotient Technology Inc. and its subsidiaries in the United States and other countries. Other marks
are the property of their respective owners. Confidential and Proprietary Information of Quotient Technology Inc. Please Do Not Copy or Circulate. We do not make any guarantees regarding outcomes that this product will meet your company’s unique needs.
4
Delivered $123.9M in quarterly revenue, up 48% over Q2 2020.
Q2 2021
Financial Summary
GAAP Net Loss in Q2 2021 was $17.2M, compared to a net loss of $19.1M in Q2 2020.
Q2 2021 Adjusted EBITDA was $4.3M, compared to $4.4M in Q2 2020.
Non-GAAP operating expenses increased by $10.4M compared to last year and were 38.1% of revenue.
Operating cash flow was $7.0M.
Ended Q2 2021 with cash and cash equivalents of $238.3M.
GAAP operating expenses increased by $6.7M compared to Q2 2020 and were 44.5% of revenue.

Copyright © 2021 Quotient Technology Inc. All Rights Reserved. Quotient, the Quotient logo, and the Coupons.com logo are trademarks or registered trademarks of Quotient Technology Inc. and its subsidiaries in the United States and other countries. Other marks
are the property of their respective owners. Confidential and Proprietary Information of Quotient Technology Inc. Please Do Not Copy or Circulate. We do not make any guarantees regarding outcomes that this product will meet your company’s unique needs.
5
Total Revenue
QUARTER Q2 ’20 Q3 ‘20 Q4 ‘20 Q1 ‘21 Q2 ‘21
Revenue ($M) $83.5 $121.1 $142.5 $115.3 $123.9
YoY -20% 5% 20% 17% 48%
Promotions Mix 56% 52% 48% 60% 48%
Media Mix 44% 48% 52% 40% 52%
$83.5
$121.1
$142.5
$115.3$123.9
Q2 '20 Q3 '20 Q4 '20 Q1 '21 Q2 '21
QUARTERLY TREND ($M)

Copyright © 2021 Quotient Technology Inc. All Rights Reserved. Quotient, the Quotient logo, and the Coupons.com logo are trademarks or registered trademarks of Quotient Technology Inc. and its subsidiaries in the United States and other countries. Other marks
are the property of their respective owners. Confidential and Proprietary Information of Quotient Technology Inc. Please Do Not Copy or Circulate. We do not make any guarantees regarding outcomes that this product will meet your company’s unique needs.
6
Q2 2021 customer cohorts grew 39% Y/Y with growth among all cohorts.
Y/Y revenue increase
across Top 20 cohort, 21-
40 cohort, and 40+
cohort was 35%, 32%, and
53%, respectively.
2019 customer base used to establish customer cohorts for all periods calculated.
Revenue is defined as United States revenues, less Specialty and non-CPG revenues.
Revenue from Q2 2021 customer cohorts grew 11% over Q1 2021.
+
+
+$318
$344$375
$398$444
$0
$100
$200
$300
$400
$500
Q220 Q320 Q420 Q121 Q221
MIL
LIO
NS
Top 20 Customers 21-40 Customers 40+ Customers
Customer Cohort Trend TTM
Copyright © 2021 Quotient Technology Inc. All Rights Reserved. Quotient, the Quotient logo, and the Coupons.com logo are trademarks or registered trademarks of Quotient Technology Inc. and its subsidiaries in the United States and other countries. Other marks
are the property of their respective owners. Confidential and Proprietary Information of Quotient Technology Inc. Please Do Not Copy or Circulate. We do not make any guarantees regarding outcomes that this product will meet your company’s unique needs.
7
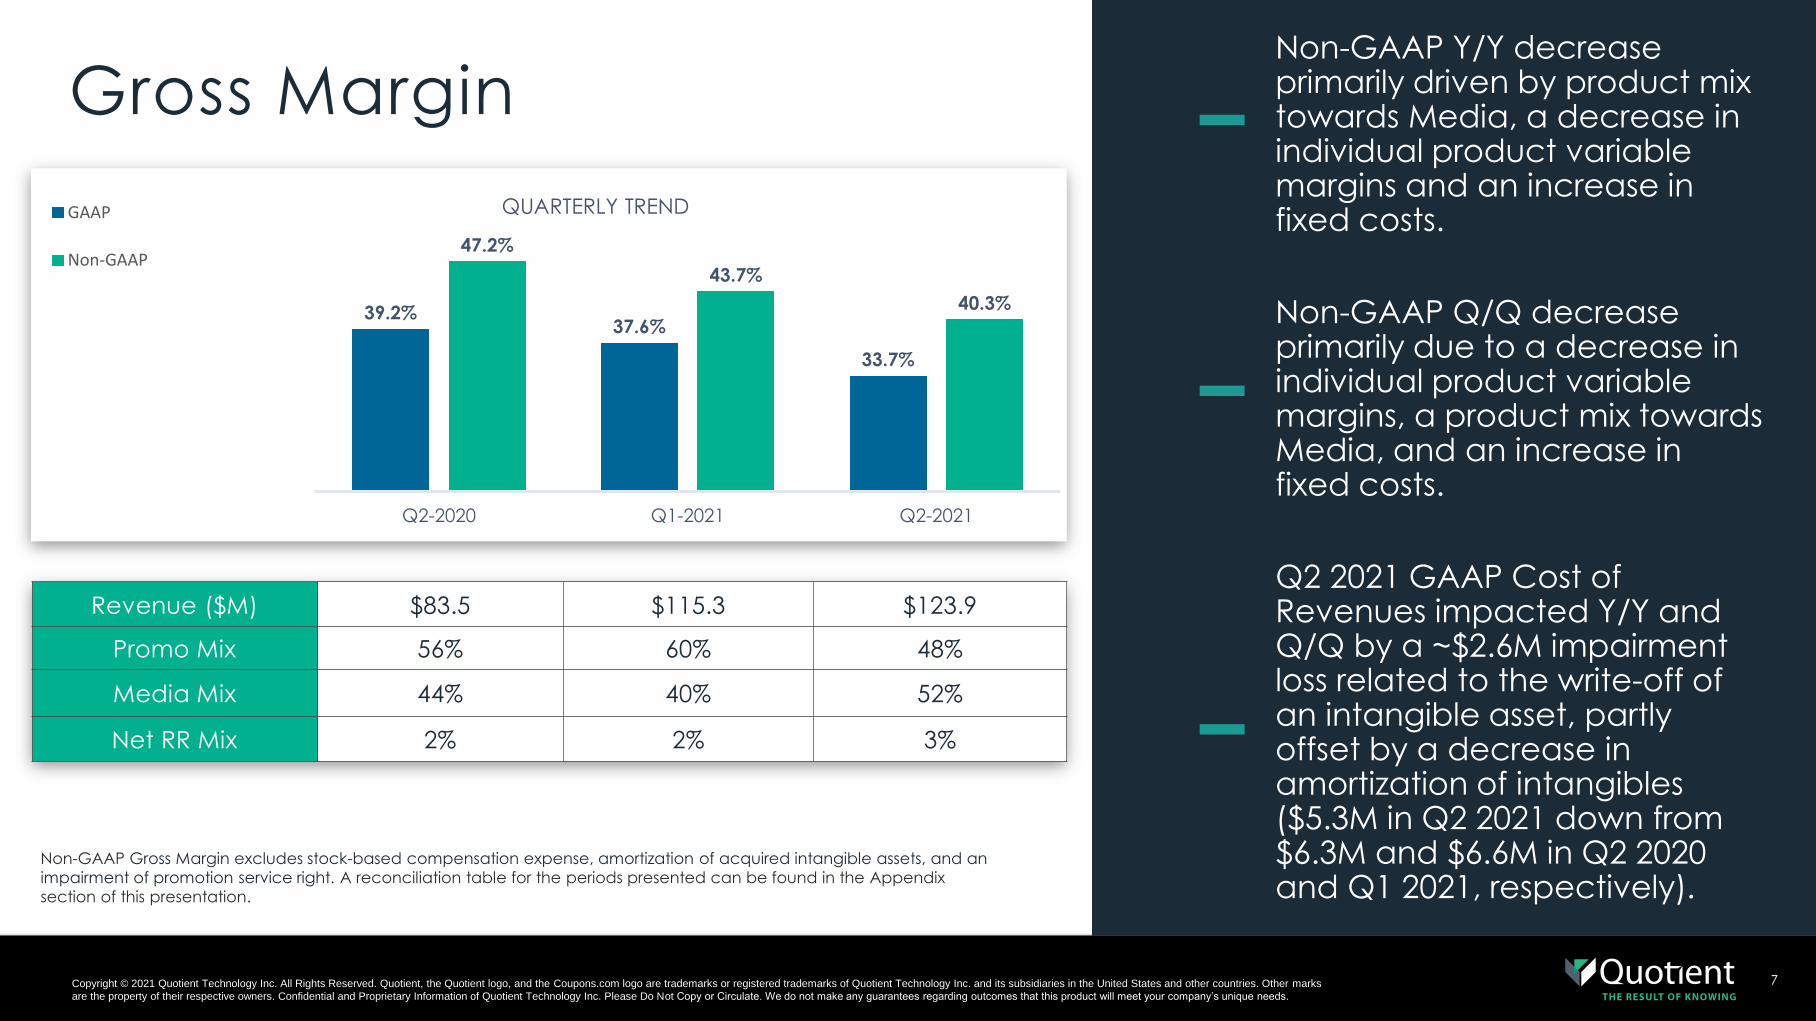
Non-GAAP Gross Margin excludes stock-based compensation expense, amortization of acquired intangible assets, and an
impairment of promotion service right. A reconciliation table for the periods presented can be found in the Appendix
section of this presentation.
Non-GAAP Y/Y decrease primarily driven by product mix towards Media, a decrease in individual product variable margins and an increase in fixed costs.
Gross Margin
Q2 2021 GAAP Cost of Revenues impacted Y/Y and Q/Q by a ~$2.6M impairment loss related to the write-off of an intangible asset, partly offset by a decrease in amortization of intangibles ($5.3M in Q2 2021 down from $6.3M and $6.6M in Q2 2020 and Q1 2021, respectively).
–Non-GAAP Q/Q decrease primarily due to a decrease in individual product variable margins, a product mix towards Media, and an increase in fixed costs.
QUARTERLY TREND
Revenue ($M) $83.5 $115.3 $123.9
Promo Mix 56% 60% 48%
Media Mix 44% 40% 52%
Net RR Mix 2% 2% 3%
–
–
39.2%37.6%
33.7%
47.2%
43.7%
40.3%
Q2-2020 Q1-2021 Q2-2021
GAAP
Non-GAAP

Copyright © 2021 Quotient Technology Inc. All Rights Reserved. Quotient, the Quotient logo, and the Coupons.com logo are trademarks or registered trademarks of Quotient Technology Inc. and its subsidiaries in the United States and other countries. Other marks
are the property of their respective owners. Confidential and Proprietary Information of Quotient Technology Inc. Please Do Not Copy or Circulate. We do not make any guarantees regarding outcomes that this product will meet your company’s unique needs.
8
Q2 2021 GAAP OpEx of $55.1M compared to $48.5M in Q2 2020.
Non-GAAP operating expenses exclude stock-based compensation, change in fair value of contingent consideration,
amortization of acquired intangible assets, acquisition related costs, and restructuring charges. A reconciliation table of the
period presented can be found in the Appendix section of this presentation.
Q2 2021 GAAP OpExY/Y increased by ~$6.7M primarily driven by non-GAAP operating expenses, partly offset by a ~$3.5M reduction fair value of contingent consideration and ~$0.5M in stock-based compensation reduction.
Q2 2021 Non-GAAP OpEx Y/Y increased by ~$10.4M related to headcount growth, higher bonus expense, higher commissions from increased revenues and higher legal expense, partly offset by a decrease in marketing spend.
Q2 2021 Non-GAAP OpExQ/Q increased by ~$1.7M due to professional services, higher commissions, merit increase and headcount growth, partly offset by lower bonus expense, lower employer payroll taxes and higher labor capitalization.
Operating Expenses –
NON-GAAP TREND
–
$21.6$25.2 $26.2
$7.8
$11.1 $10.4$7.4
$9.2 $10.6$36.8
$45.5$47.2
Q2-2020 Q1-2021 Q2-2021
General and Administrative
Research & Development
Sales & Marketing
–
Copyright © 2021 Quotient Technology Inc. All Rights Reserved. Quotient, the Quotient logo, and the Coupons.com logo are trademarks or registered trademarks of Quotient Technology Inc. and its subsidiaries in the United States and other countries. Other marks
are the property of their respective owners. Confidential and Proprietary Information of Quotient Technology Inc. Please Do Not Copy or Circulate. We do not make any guarantees regarding outcomes that this product will meet your company’s unique needs.
9
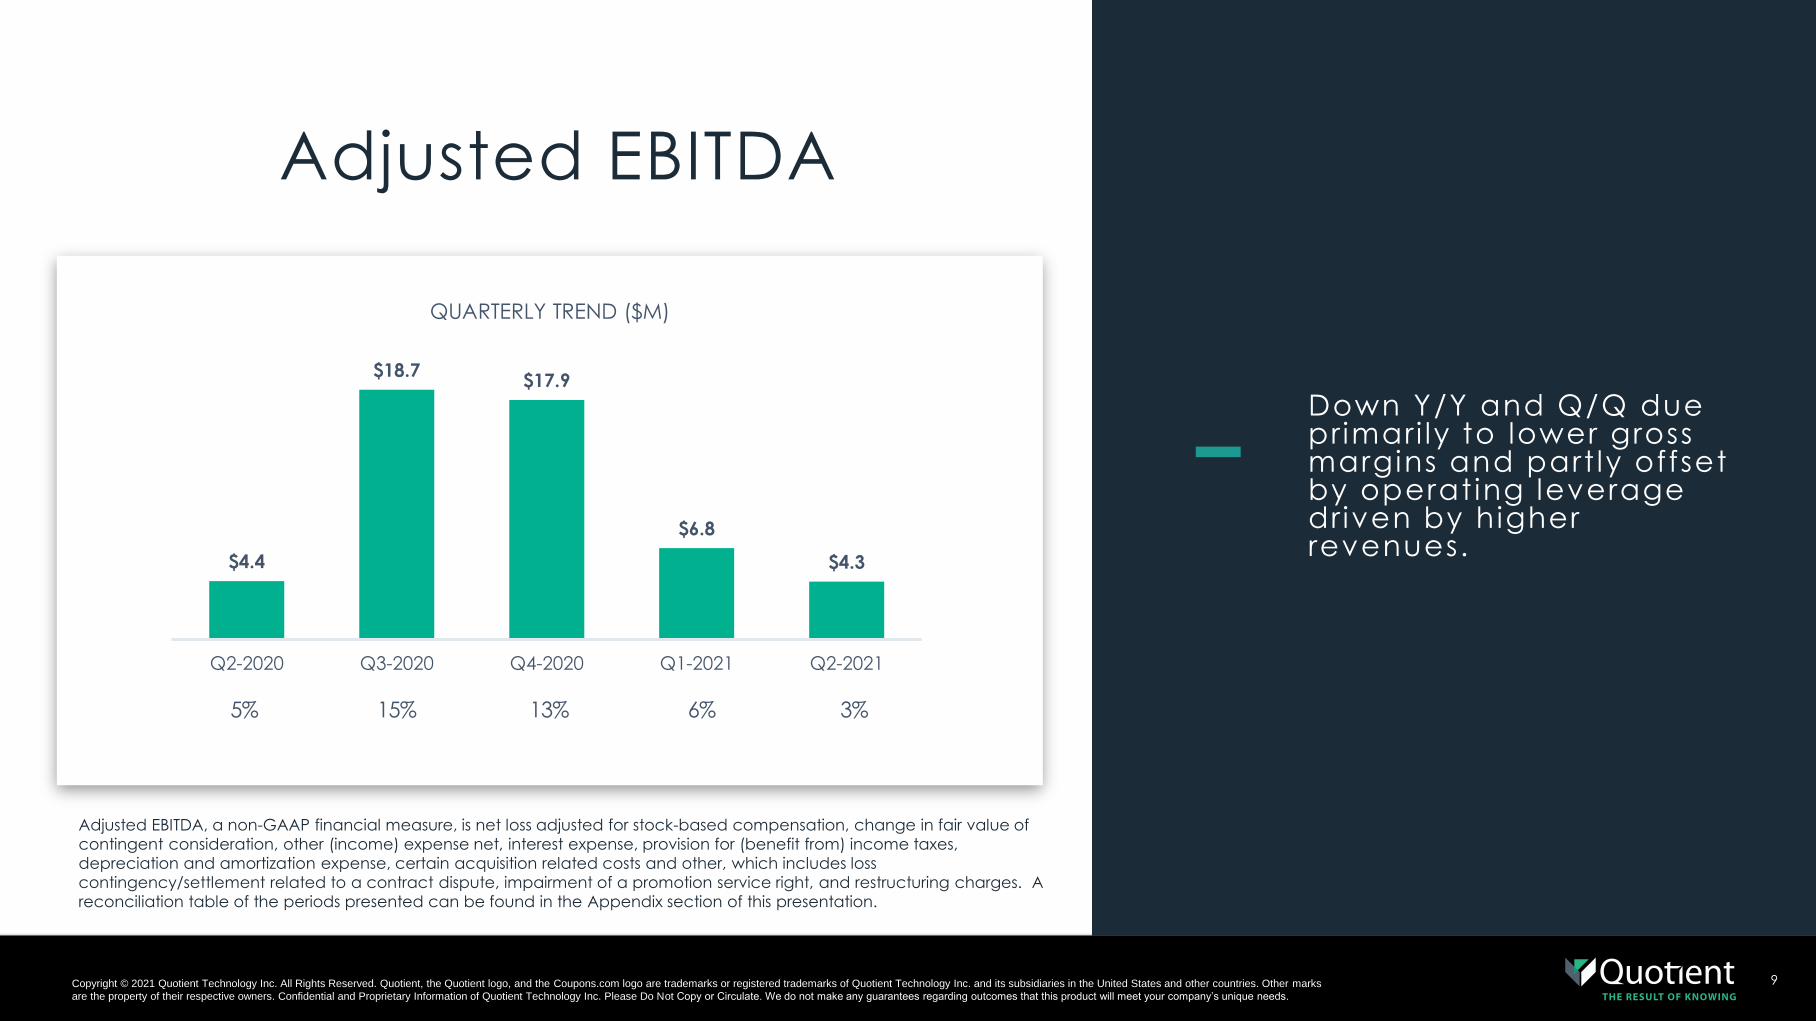
Adjusted EBITDA
Adjusted EBITDA, a non-GAAP financial measure, is net loss adjusted for stock-based compensation, change in fair value of
contingent consideration, other (income) expense net, interest expense, provision for (benefit from) income taxes,
depreciation and amortization expense, certain acquisition related costs and other, which includes loss
contingency/settlement related to a contract dispute, impairment of a promotion service right, and restructuring charges. A
reconciliation table of the periods presented can be found in the Appendix section of this presentation.
Down Y/Y and Q/Q due pr imari ly to lower gross margins and part ly offset by operat ing leverage driven by higher revenues.
–$4.4
$18.7$17.9
$6.8
$4.3
Q2-2020 Q3-2020 Q4-2020 Q1-2021 Q2-2021
QUARTERLY TREND ($M)
5% 15% 13% 6% 3%

Copyright © 2021 Quotient Technology Inc. All Rights Reserved. Quotient, the Quotient logo, and the Coupons.com logo are trademarks or registered trademarks of Quotient Technology Inc. and its subsidiaries in the United States and other countries. Other marks
are the property of their respective owners. Confidential and Proprietary Information of Quotient Technology Inc. Please Do Not Copy or Circulate. We do not make any guarantees regarding outcomes that this product will meet your company’s unique needs.
10
Our guidance presents reasonable estimates based on what we know currently and does not include any additional changes to market dynamics that may take place as a result of the global pandemic.
Second half 2021 revenue is expected to grow ~18% over first half 2021 on a gross basis, based on early indications for our Q3 bookings and our pipeline for the latter part of the year. However, uncertainty around macroeconomic conditions and the potential for the resurgence of the pandemic in some geographic areas remain a concern for the back half of the year.
*Gross basis guidance adds back ~ $5M to $6M of revenue and cost of sales in Q3 and Q4, related to a change in delivery and accounting for sponsored search.
GuidanceFY2021
Q3 Full Year
Low High Low High
Revenue ($M) $126.0 $133.0 $505.0 $522.0
Y/Y Growth 4% 10% 15% 20%
Gross basis ($M)* $131.0 $138.0 $514.0 $531.0
Y/Y Growth 8% 14% 15% 19%
Q3 Full Year
Adjusted EBITDA ($M) $2.0 $12.0 $50.0 $65.0
Y/Y Growth (89)% (36)% 9% 41%
Adjusted EBITDA Margin
2% 9% 10% 12%


Copyright © 2021 Quotient Technology Inc. All Rights Reserved. Quotient, the Quotient logo, and the Coupons.com logo are trademarks or registered trademarks of Quotient Technology Inc. and its subsidiaries in the United States and other countries. Other marks
are the property of their respective owners. Confidential and Proprietary Information of Quotient Technology Inc. Please Do Not Copy or Circulate. We do not make any guarantees regarding outcomes that this product will meet your company’s unique needs.
12
Q2 FY 20 Q1 FY 21 Q2 FY 21
Revenues 83,455$ 115,316$ 123,880$
Cost of revenues (GAAP) 50,731$ 71,984$ 82,161$
(less) Stock-based compensation (387) (423) (401)
(less) Amortization of acquired intangible assets (6,278) (6,593) (5,276)
(less) Impairment of promotion service right— — (2,580)
Cost of revenues (Non-GAAP) 44,066$ 64,968$ 73,904$
Gross margin (GAAP) 32,724$ 43,332$ 41,719$
Gross margin percentage (GAAP) 39.2% 37.6% 33.7%
Gross margin (Non-GAAP)* 39,389$ 50,348$ 49,976$
Gross margin percentage (Non-GAAP) 47.2% 43.7% 40.3%
(Unaudited, in thousands)
RECONCILIATION OF GROSS MARGIN TO NON-GAAP GROSS MARGIN
QUOTIENT TECHNOLOGY INC.
* Non-GAAP gross margin excludes stock-based compensation, amortization of acquired intangible assets and
impairment of a promotion service right.

Copyright © 2021 Quotient Technology Inc. All Rights Reserved. Quotient, the Quotient logo, and the Coupons.com logo are trademarks or registered trademarks of Quotient Technology Inc. and its subsidiaries in the United States and other countries. Other marks
are the property of their respective owners. Confidential and Proprietary Information of Quotient Technology Inc. Please Do Not Copy or Circulate. We do not make any guarantees regarding outcomes that this product will meet your company’s unique needs.
13
Q2 FY 20 Q3 FY 20 Q4 FY 20 Q1 FY 21 Q2 FY 21
Revenues 83,455$ 121,116$ 142,529$ 115,316$ 123,880$
Sales and marketing expenses 23,814 24,555 31,124 27,365 28,467
(less) Stock-based compensation (1,323) (1,187) (1,399) (1,255) (1,181)
(less) Amortization of acquired intangible assets (914) (866) (866) (866) (866)
(less) Restructuring charges — — — — (217)
Non-GAAP Sales and marketing expenses 21,577$ 22,502$ 28,859$ 25,244$ 26,203$
Non-GAAP Sales and marketing percentage 26% 19% 20% 22% 21%
Research and development 8,621 9,744 11,358 12,056 11,411
(less) Stock-based compensation (839) (1,003) (1,108) (972) (977)
Non-GAAP Research and development expenses 7,782$ 8,741$ 10,250$ 11,084$ 10,434$
Non-GAAP Research and development percentage 9% 7% 7% 10% 8%
General and administrative expenses 12,268 12,099 14,720 12,833 15,009
(less) Stock-based compensation (4,457) (3,857) (4,364) (3,194) (3,981)
(less) Acquisiton related costs (387) (393) (1,039) (482) (453)
Non-GAAP General and administrative expenses 7,424$ 7,849$ 9,317$ 9,157$ 10,575$
Non-GAAP General and administrative percentage 9% 6% 7% 8% 9%
Non-GAAP Operating expenses* 36,783$ 39,092$ 48,426$ 45,485$ 47,212$
Non-GAAP Operating expense percentage 44% 32% 34% 39% 38%
(Unaudited, in thousands)
RECONCILIATION OF OPERATING EXPENSES TO NON-GAAP OPERATING EXPENSES
QUOTIENT TECHNOLOGY INC.
* Non-GAAP operating expenses excludes changes in fair value of contingent consideration, stock-based compensation, amortization of acquired intangible
assets, restructuring charges, and acquisition related costs.

Copyright © 2021 Quotient Technology Inc. All Rights Reserved. Quotient, the Quotient logo, and the Coupons.com logo are trademarks or registered trademarks of Quotient Technology Inc. and its subsidiaries in the United States and other countries. Other marks
are the property of their respective owners. Confidential and Proprietary Information of Quotient Technology Inc. Please Do Not Copy or Circulate. We do not make any guarantees regarding outcomes that this product will meet your company’s unique needs.
14
Q2 FY 20 Q3 FY 20 Q4 FY 20 Q1 FY 21 Q2 FY 21
Net loss (19,133)$ (4,218)$ (25,305)$ (13,414)$ (17,201)$
Adjustments:
Stock-based compensation 7,006 6,489 7,350 5,844 6,540
Depreciation and amortization 8,957 8,679 9,830 9,431 7,707
Acquistion related costs and other (1)
388 2,393 7,872 482 3,251
Change in fair value of contingent consideration 3,766 1,562 14,446 285 242
Interest expense 3,610 3,646 3,691 3,730 3,767
Other (income) expense, net (187) 59 (432) 228 (194)
Provision for (benefit from) income taxes (35) 66 458 249 218
Total adjustments 23,505$ 22,894$ 43,215$ 20,249$ 21,531$
Adjusted EBITDA (1)
4,372$ 18,676$ 17,910$ 6,835$ 4,330$
Adjusted EBITDA Margin (2)
5% 15% 13% 6% 3%
(2) Adjusted EBITDA margin is the ratio of Adjusted EBITDA and Revenues.
(Unaudited, in thousands)
RECONCILIATION OF NET LOSS TO ADJUSTED EBITDA AND ADJUSTED EBITDA MARGIN
QUOTIENT TECHNOLOGY INC.
(1) Adjusted EBITDA, a non-GAAP financial measure, is net loss adjusted for stock-based compensation, depreciation and amortization, change in fair value of
contingent consideration, interest expense, other (income) expense, net, provision for (benefit from) income taxes, and acquistion related costs and other, which
includes: loss contingency of $2.0 million related to a contract dispute during Q3 FY 20; settlement of $6.8 million related to a contract dispute during Q4 FY 20,
charge of $2.6 million related to the impairment of a promotion service right and restructuring charge of $0.2 million during Q2 FY21.