Second quarter 2021 results presentation Q2
19
Second quarter 2021 results presentation Q2 Bank Norwegian Group August 13, 2021
Transcript of Second quarter 2021 results presentation Q2
Second quarter 2021
results presentation
Q2Bank Norwegian Group
August 13, 2021
2
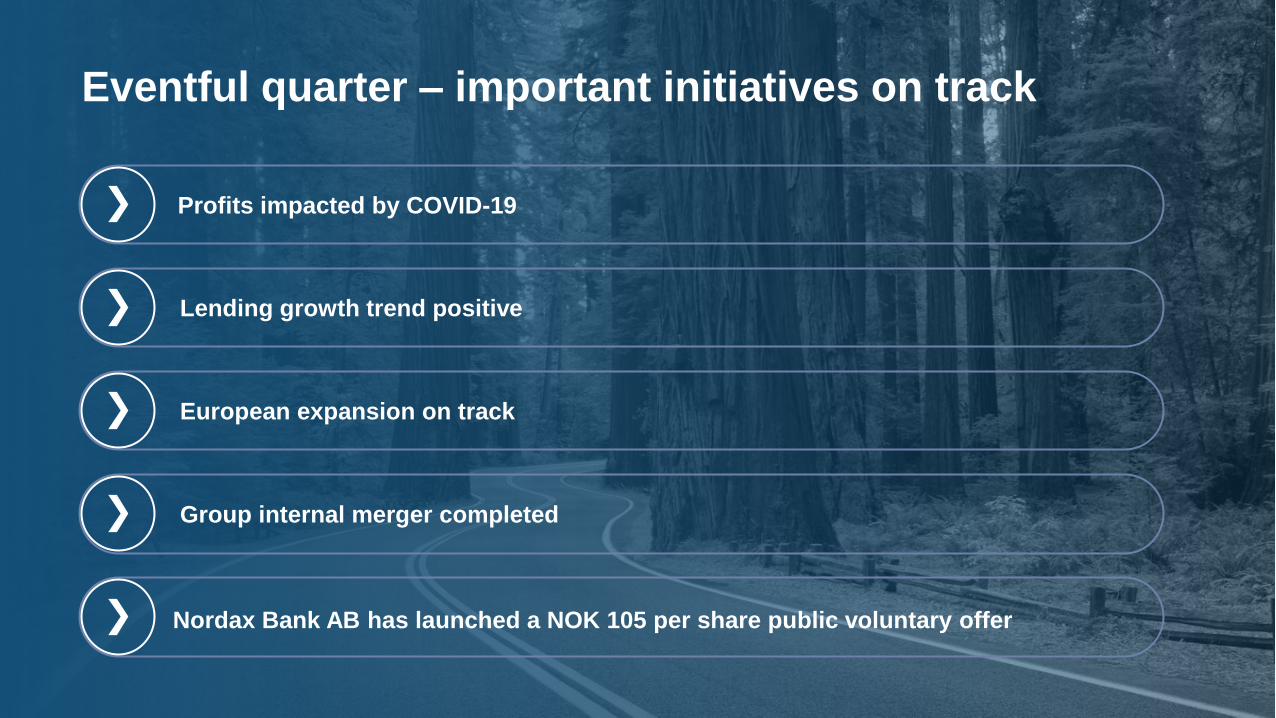
Eventful quarter – important initiatives on track
Profits impacted by COVID-19
Nordax Bank AB has launched a NOK 105 per share public voluntary offer
Lending growth trend positive
European expansion on track
Group internal merger completed
3
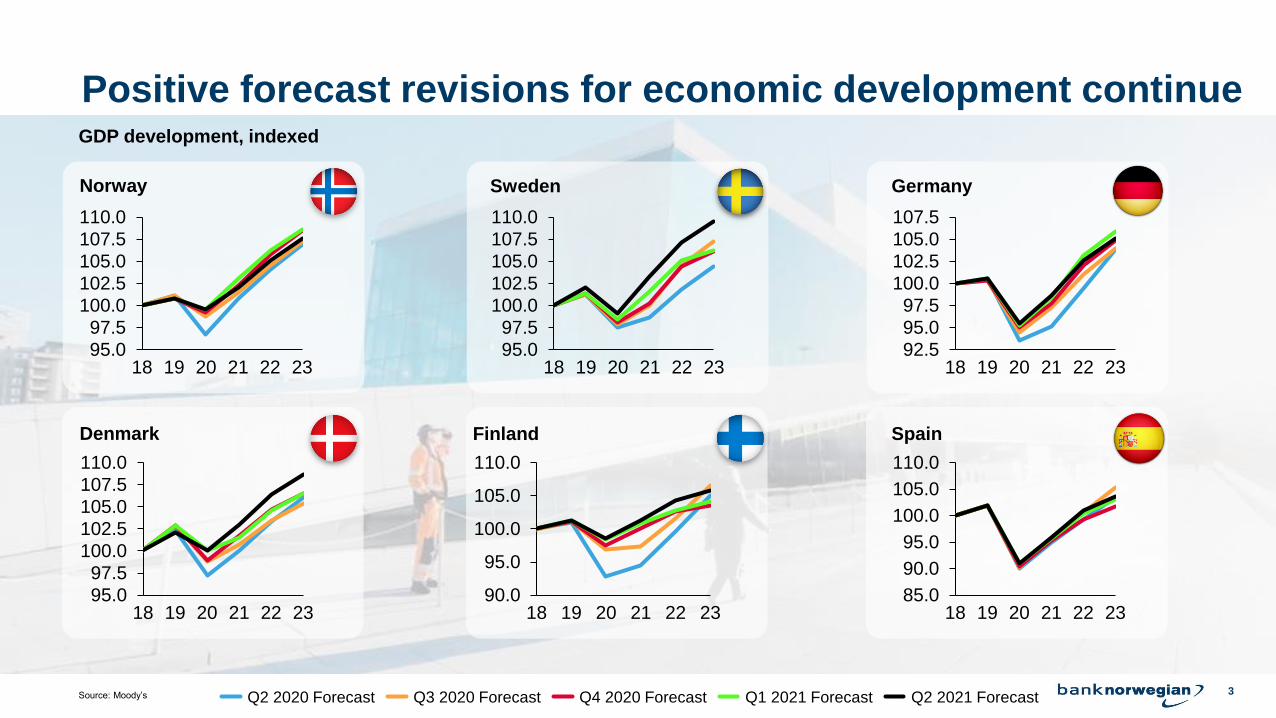
Positive forecast revisions for economic development continueGDP development, indexed
Source: Moody’s
95.0
97.5
100.0
102.5
105.0
107.5
110.0
18 2219 20 21 23
Q2 2020 Forecast Q1 2021 ForecastQ3 2020 Forecast Q4 2020 Forecast Q2 2021 Forecast
Norway Sweden
Denmark Finland
95.0
97.5
100.0
102.5
105.0
107.5
110.0
221918 20 2321
95.0
97.5
100.0
102.5
105.0
107.5
110.0
18 222019 21 2390.0
95.0
100.0
105.0
110.0
18 19 2320 2221
Germany
Spain
92.5
95.0
97.5
100.0
102.5
105.0
107.5
18 212019 22 23
85.0
90.0
95.0
100.0
105.0
110.0
18 19 2220 21 23
4
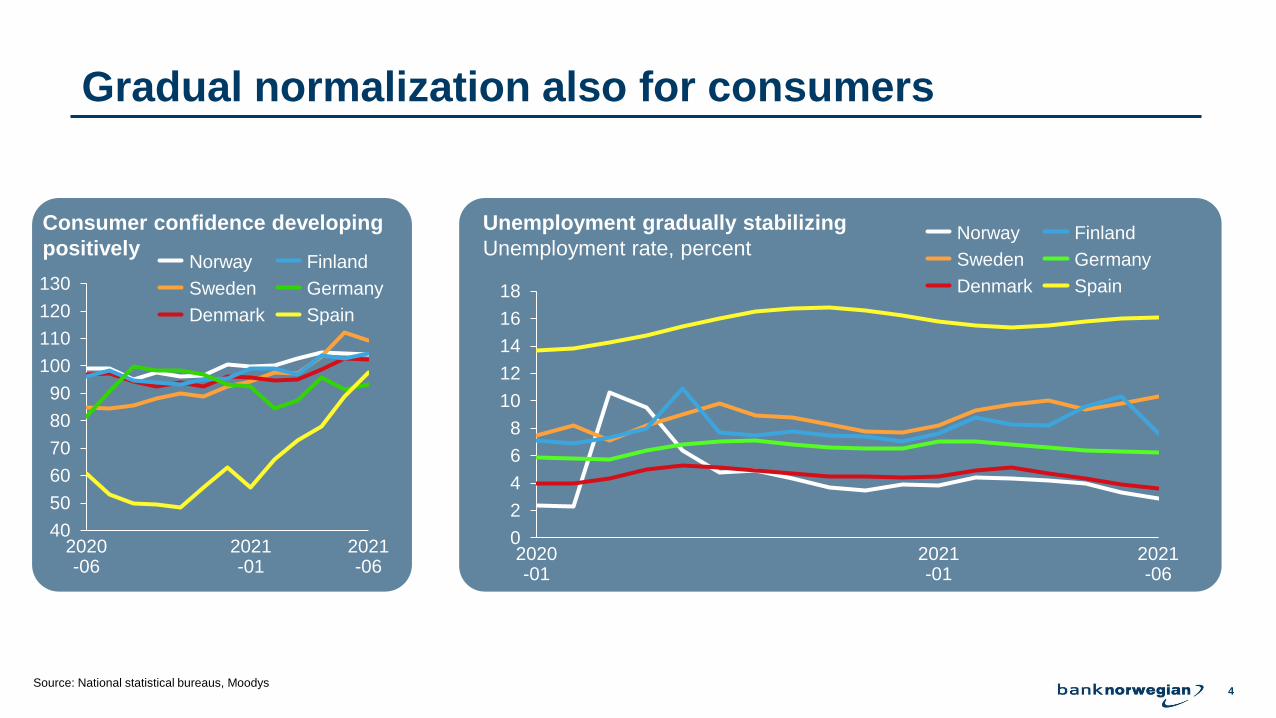
Gradual normalization also for consumers
Consumer confidence developing
positively
40
50
60
70
80
90
100
110
120
130
2020-06
2021-01
2021-06
Norway
Germany
Denmark
Finland
Sweden
Spain
Source: National statistical bureaus, Moodys
0
2
4
6
8
10
12
14
16
18
2020-01
2021-01
2021-06
Norway
Sweden
Denmark
Finland
Germany
Spain
Unemployment gradually stabilizing
Unemployment rate, percent
5
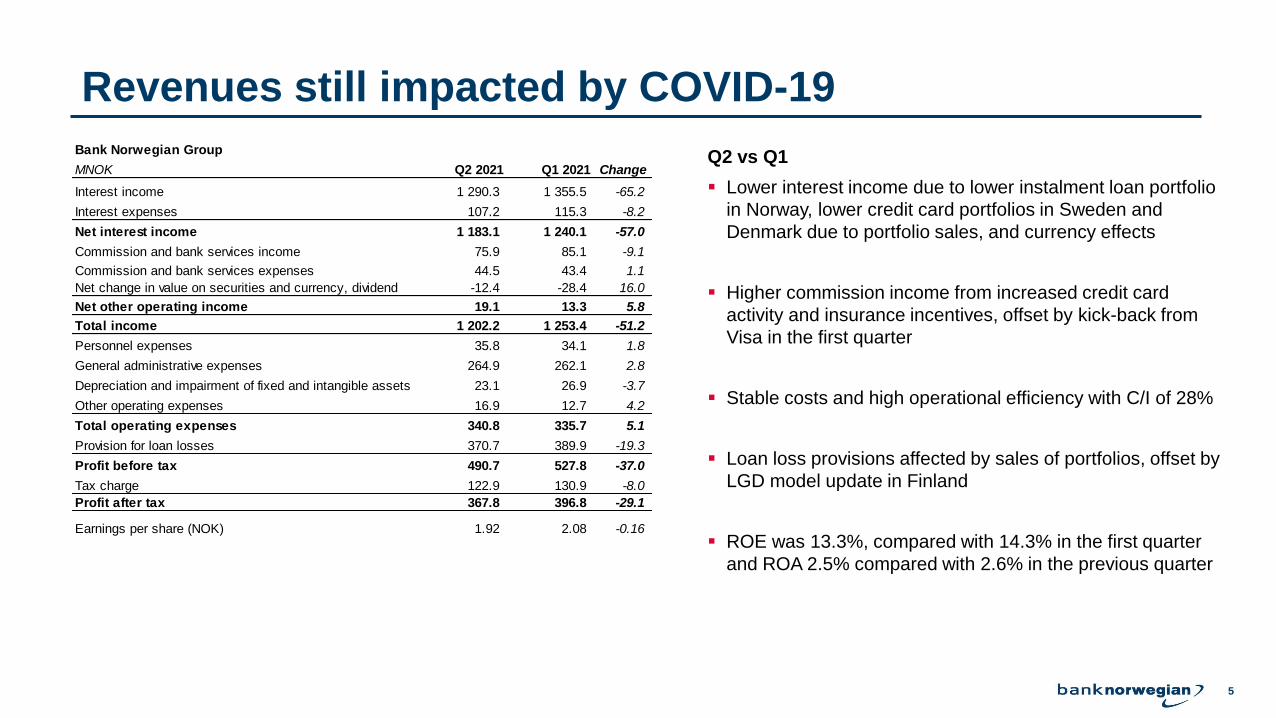
Revenues still impacted by COVID-19
Q2 vs Q1
▪ Lower interest income due to lower instalment loan portfolio
in Norway, lower credit card portfolios in Sweden and
Denmark due to portfolio sales, and currency effects
▪ Higher commission income from increased credit card
activity and insurance incentives, offset by kick-back from
Visa in the first quarter
▪ Stable costs and high operational efficiency with C/I of 28%
▪ Loan loss provisions affected by sales of portfolios, offset by
LGD model update in Finland
▪ ROE was 13.3%, compared with 14.3% in the first quarter
and ROA 2.5% compared with 2.6% in the previous quarter
Bank Norwegian Group
MNOK Q2 2021 Q1 2021 Change
Interest income 1 290.3 1 355.5 -65.2
Interest expenses 107.2 115.3 -8.2
Net interest income 1 183.1 1 240.1 -57.0
Commission and bank services income 75.9 85.1 -9.1
Commission and bank services expenses 44.5 43.4 1.1
Net change in value on securities and currency, dividend -12.4 -28.4 16.0
Net other operating income 19.1 13.3 5.8
Total income 1 202.2 1 253.4 -51.2
Personnel expenses 35.8 34.1 1.8
General administrative expenses 264.9 262.1 2.8
Depreciation and impairment of fixed and intangible assets 23.1 26.9 -3.7
Other operating expenses 16.9 12.7 4.2
Total operating expenses 340.8 335.7 5.1
Provision for loan losses 370.7 389.9 -19.3
Profit before tax 490.7 527.8 -37.0
Tax charge 122.9 130.9 -8.0
Profit after tax 367.8 396.8 -29.1
Earnings per share (NOK) 1.92 2.08 -0.16
6
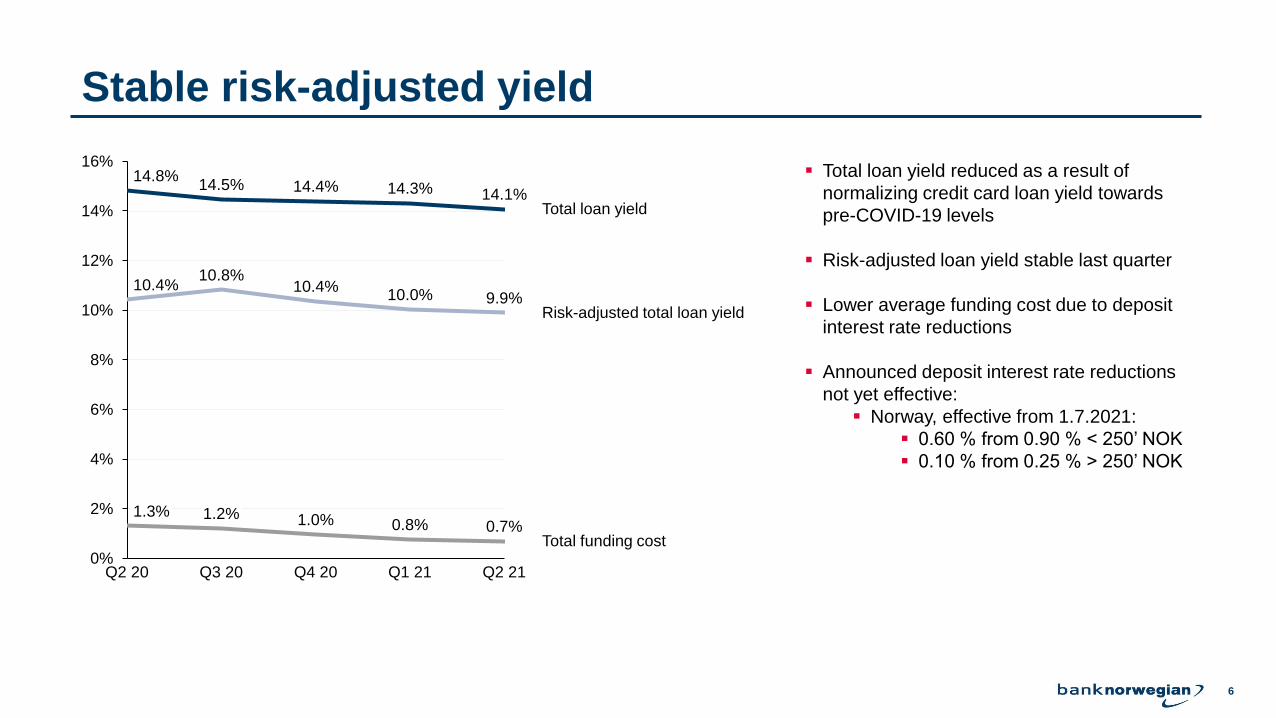
Stable risk-adjusted yield
0%
2%
4%
6%
8%
10%
12%
14%
16%
1.2%
14.8%
10.4%
1.3%
Q2 20
10.8%
14.5%
0.7%
Q3 20
14.4%
Total funding cost
10.4%
1.0%
Risk-adjusted total loan yield10.0%
Q4 20
14.3%
0.8%
Q1 21
14.1%
9.9%
Q2 21
Total loan yield
▪ Total loan yield reduced as a result of
normalizing credit card loan yield towards
pre-COVID-19 levels
▪ Risk-adjusted loan yield stable last quarter
▪ Lower average funding cost due to deposit
interest rate reductions
▪ Announced deposit interest rate reductions
not yet effective:
▪ Norway, effective from 1.7.2021:
▪ 0.60 % from 0.90 % < 250’ NOK
▪ 0.10 % from 0.25 % > 250’ NOK
7
Highlights - Norway
Loan growth
Credit card usage Point Of Sale (POS)
Comments
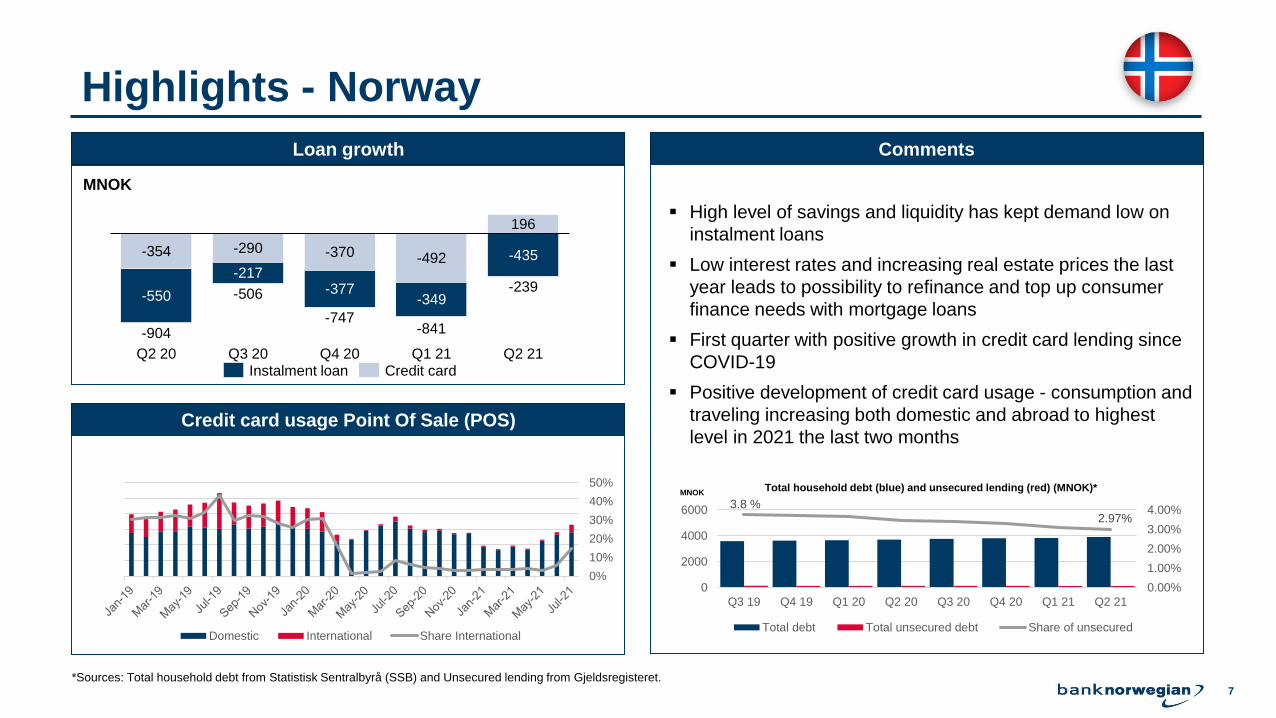
▪ High level of savings and liquidity has kept demand low on
instalment loans
▪ Low interest rates and increasing real estate prices the last
year leads to possibility to refinance and top up consumer
finance needs with mortgage loans
▪ First quarter with positive growth in credit card lending since
COVID-19
▪ Positive development of credit card usage - consumption and
traveling increasing both domestic and abroad to highest
level in 2021 the last two months
MNOK
-354 -290 -370 -492
196
-550
-217-377
-349
-435
Q1 21Q4 20Q2 20
-904
Q3 20
-747
Q2 21
-506
-841
-239
Instalment loan Credit card
MNOK
0%
10%
20%
30%
40%
50%
-
500
1 000
1 500
2 000
2 500
3 000
Domestic International Share International
3.8 %
2.97%
0.00%
1.00%
2.00%
3.00%
4.00%
0
2000
4000
6000
Q3 19 Q4 19 Q1 20 Q2 20 Q3 20 Q4 20 Q1 21 Q2 21
Total household debt (blue) and unsecured lending (red) (MNOK)*
Total debt Total unsecured debt Share of unsecured
MNOK
*Sources: Total household debt from Statistisk Sentralbyrå (SSB) and Unsecured lending from Gjeldsregisteret.
8
Highlights - Sweden
Currency adjusted loan growth*
Credit card usage POS
Comments
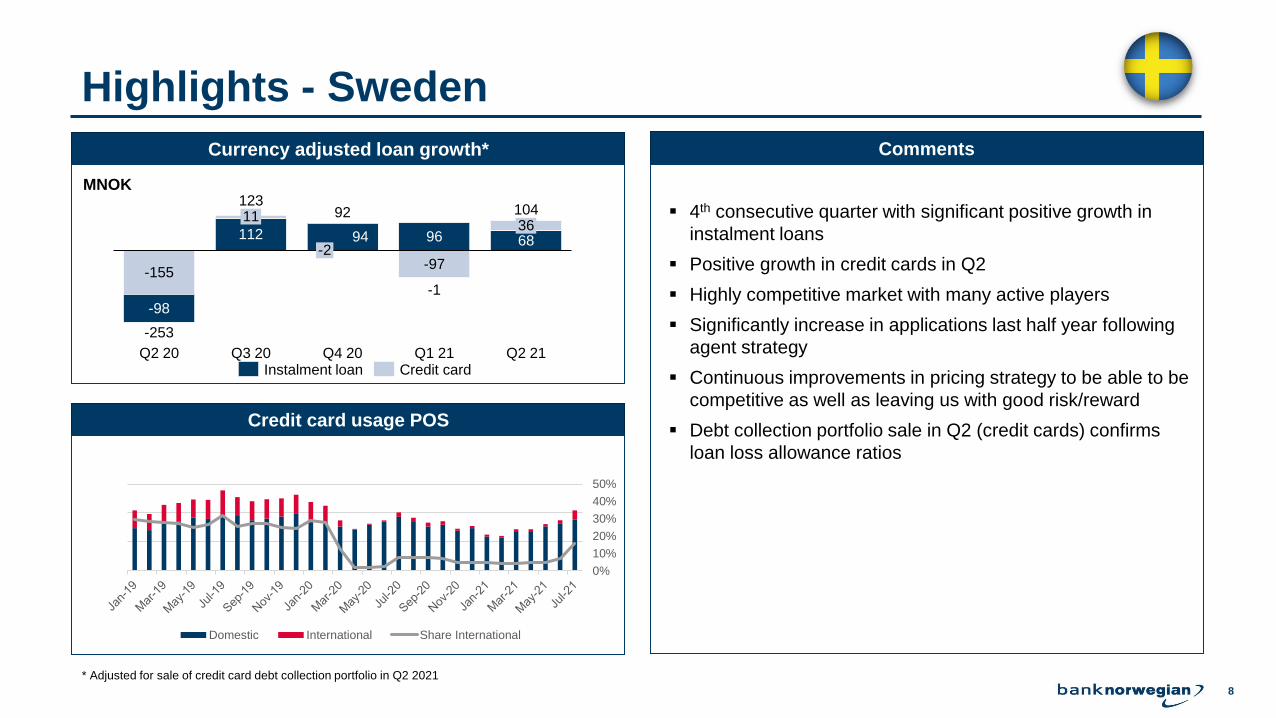
▪ 4th consecutive quarter with significant positive growth in
instalment loans
▪ Positive growth in credit cards in Q2
▪ Highly competitive market with many active players
▪ Significantly increase in applications last half year following
agent strategy
▪ Continuous improvements in pricing strategy to be able to be
competitive as well as leaving us with good risk/reward
▪ Debt collection portfolio sale in Q2 (credit cards) confirms
loan loss allowance ratios
MNOK
MSEK
-155
112 94 96 68
-98
-97
Q4 20
11
Q2 20 Q1 21
123
Q3 20
-2
Q2 21
36104
-253
92
-1
Instalment loan Credit card
* Adjusted for sale of credit card debt collection portfolio in Q2 2021
0%
10%
20%
30%
40%
50%
-
500
1 000
1 500
Domestic International Share International
9
Highlights - Denmark
Currency adjusted loan growth*
Credit card usage POS
Comments
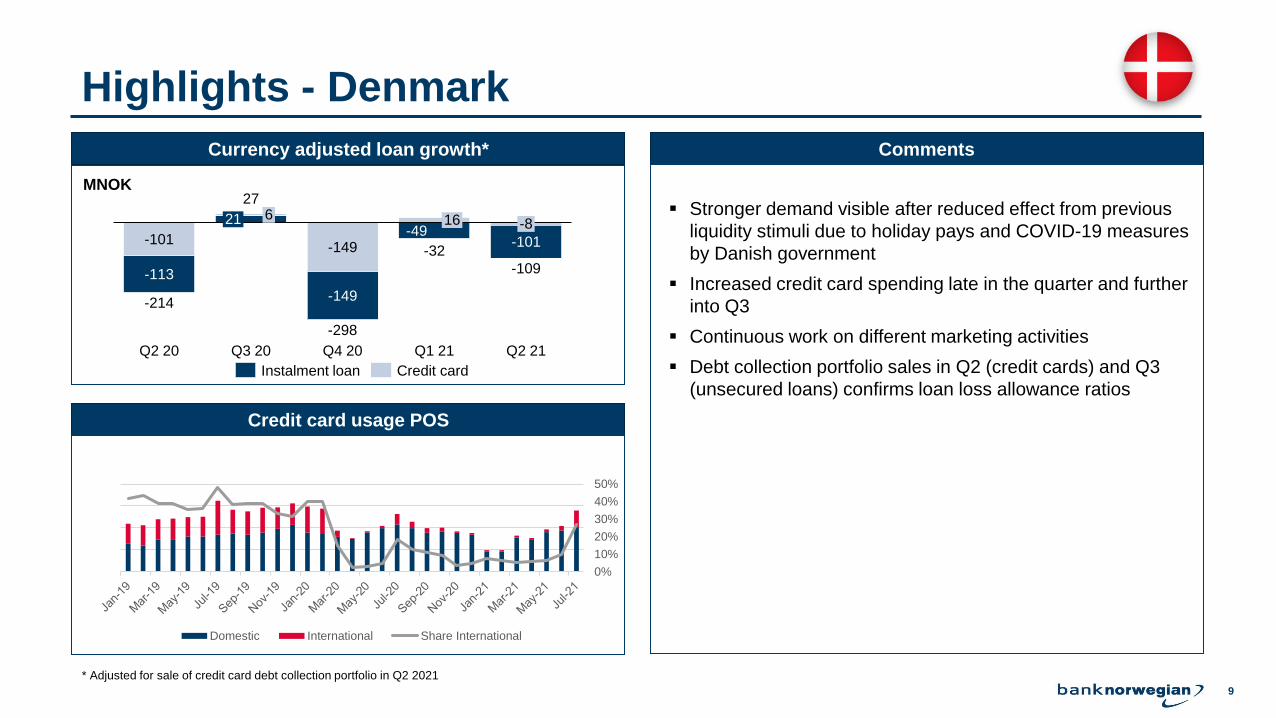
▪ Stronger demand visible after reduced effect from previous
liquidity stimuli due to holiday pays and COVID-19 measures
by Danish government
▪ Increased credit card spending late in the quarter and further
into Q3
▪ Continuous work on different marketing activities
▪ Debt collection portfolio sales in Q2 (credit cards) and Q3
(unsecured loans) confirms loan loss allowance ratios
MNOK
MDKK
-101-149
-113
-149
-49-101
21
Q2 20 Q2 21
6 16
Q3 20 Q4 20 Q1 21
-214
27
-298
-32
-109
-8
Instalment loan Credit card
* Adjusted for sale of credit card debt collection portfolio in Q2 2021
0%
10%
20%
30%
40%
50%
-
50
100
150
200
Domestic International Share International
10
Highlights - Finland
Currency adjusted loan growth
Credit card usage POS
Comments
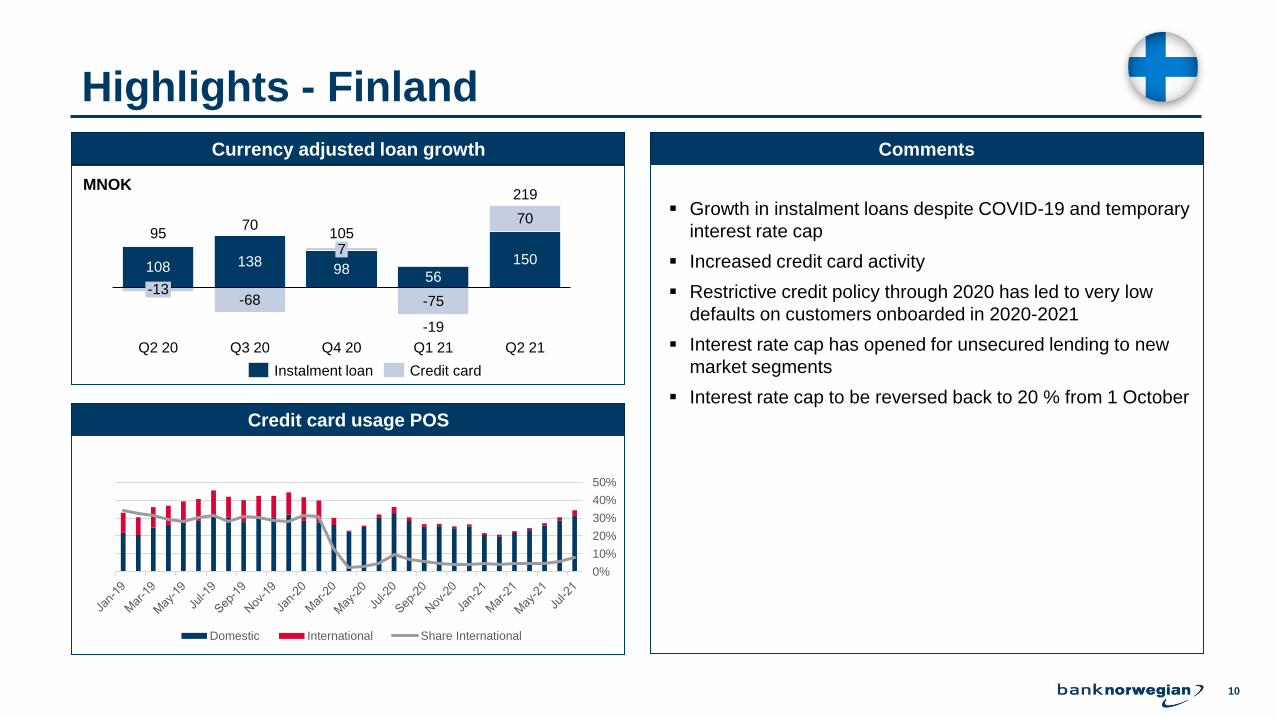
▪ Growth in instalment loans despite COVID-19 and temporary
interest rate cap
▪ Increased credit card activity
▪ Restrictive credit policy through 2020 has led to very low
defaults on customers onboarded in 2020-2021
▪ Interest rate cap has opened for unsecured lending to new
market segments
▪ Interest rate cap to be reversed back to 20 % from 1 October
MNOK
MEUR
108 13898
56
150
-68 -75
7095
-13
Q4 20Q2 20 Q3 20 Q2 21
7
Q1 21
70105
-19
219
Instalment loan Credit card
0%
10%
20%
30%
40%
50%
-
10
20
30
40
50
Domestic International Share International
11
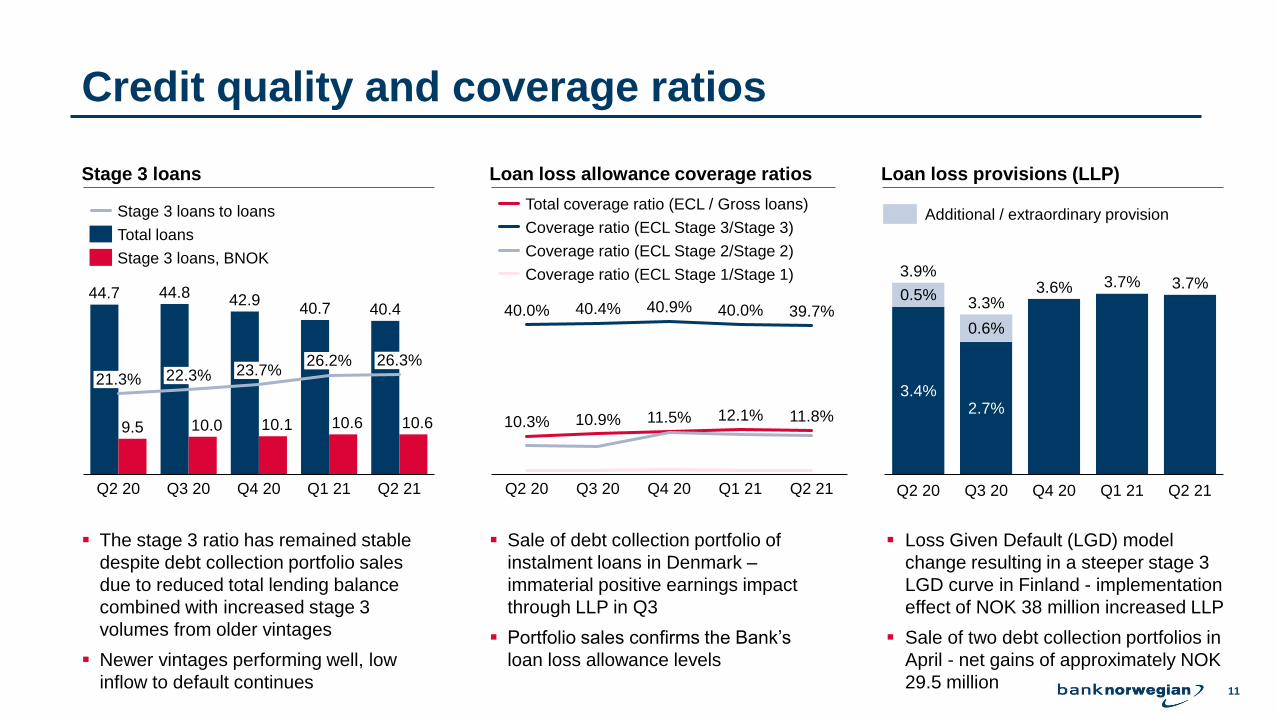
Credit quality and coverage ratios
0
10
20
30
40
50
10
40
0
50
30
20
23.7%
10.6
Q3 20
21.3%
44.7
Q2 20
22.3%
Q4 20 Q1 21
26.2%
10.1
26.3%
Q2 21
9.5
44.8
10.0
42.940.7 40.4
10.6
Stage 3 loans to loans
Total loans
Stage 3 loans, BNOK
10.3% 10.9% 11.5% 12.1% 11.8%
40.0% 40.4% 40.9% 40.0% 39.7%
0%
10%
20%
30%
40%
50%
Q2 21Q4 20Q2 20 Q1 21Q3 20
Stage 3 loans Loan loss allowance coverage ratios Loan loss provisions (LLP)
▪ The stage 3 ratio has remained stable
despite debt collection portfolio sales
due to reduced total lending balance
combined with increased stage 3
volumes from older vintages
▪ Newer vintages performing well, low
inflow to default continues
▪ Loss Given Default (LGD) model
change resulting in a steeper stage 3
LGD curve in Finland - implementation
effect of NOK 38 million increased LLP
▪ Sale of two debt collection portfolios in
April - net gains of approximately NOK
29.5 million
3.4%2.7%
3.6% 3.7% 3.7%0.5%
0.6%
3.3%
3.9%
Q2 20 Q1 21Q3 20 Q4 20 Q2 21
Additional / extraordinary provision
▪ Sale of debt collection portfolio of
instalment loans in Denmark –
immaterial positive earnings impact
through LLP in Q3
▪ Portfolio sales confirms the Bank’s
loan loss allowance levels
Coverage ratio (ECL Stage 2/Stage 2)
Coverage ratio (ECL Stage 3/Stage 3)
Total coverage ratio (ECL / Gross loans)
Coverage ratio (ECL Stage 1/Stage 1)
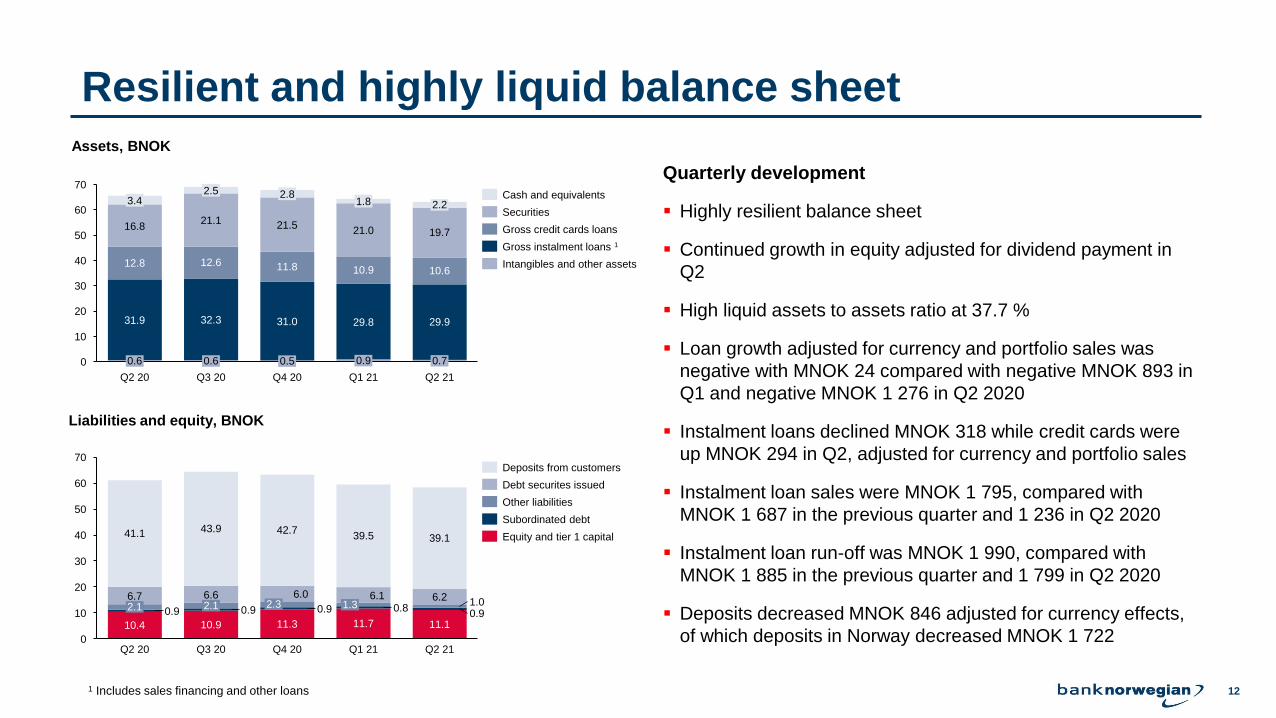
121 Includes sales financing and other loans
Resilient and highly liquid balance sheet
50
60
20
40
70
0
30
10
29.8
0.6
1.8
10.6
Q3 20
2.53.4
16.8
12.8
31.9
0.6
19.7
Q2 20
31.0
21.1
12.6
32.3
11.8
2.8
21.5
0.5
Q4 20
21.0
10.9
0.9
Q1 21
2.2
29.9
0.7
Q2 21
Assets, BNOK
60
10
0
70
40
20
50
30
6.1
Q4 20
41.1
6.26.7
Q2 21
2.10.90.9
10.4
Q1 21Q2 20
6.6
Q3 20
42.7
11.7
6.02.3 0.9
43.9
11.3
39.5
0.91.32.1
39.1
1.0
10.9 11.1
0.8
Liabilities and equity, BNOK
Quarterly development
▪ Highly resilient balance sheet
▪ Continued growth in equity adjusted for dividend payment in
Q2
▪ High liquid assets to assets ratio at 37.7 %
▪ Loan growth adjusted for currency and portfolio sales was
negative with MNOK 24 compared with negative MNOK 893 in
Q1 and negative MNOK 1 276 in Q2 2020
▪ Instalment loans declined MNOK 318 while credit cards were
up MNOK 294 in Q2, adjusted for currency and portfolio sales
▪ Instalment loan sales were MNOK 1 795, compared with
MNOK 1 687 in the previous quarter and 1 236 in Q2 2020
▪ Instalment loan run-off was MNOK 1 990, compared with
MNOK 1 885 in the previous quarter and 1 799 in Q2 2020
▪ Deposits decreased MNOK 846 adjusted for currency effects,
of which deposits in Norway decreased MNOK 1 722
Cash and equivalents
Intangibles and other assets
Securities
Gross credit cards loans
Gross instalment loans 1
Deposits from customers
Debt securites issued
Equity and tier 1 capital
Subordinated debt
Other liabilities
13
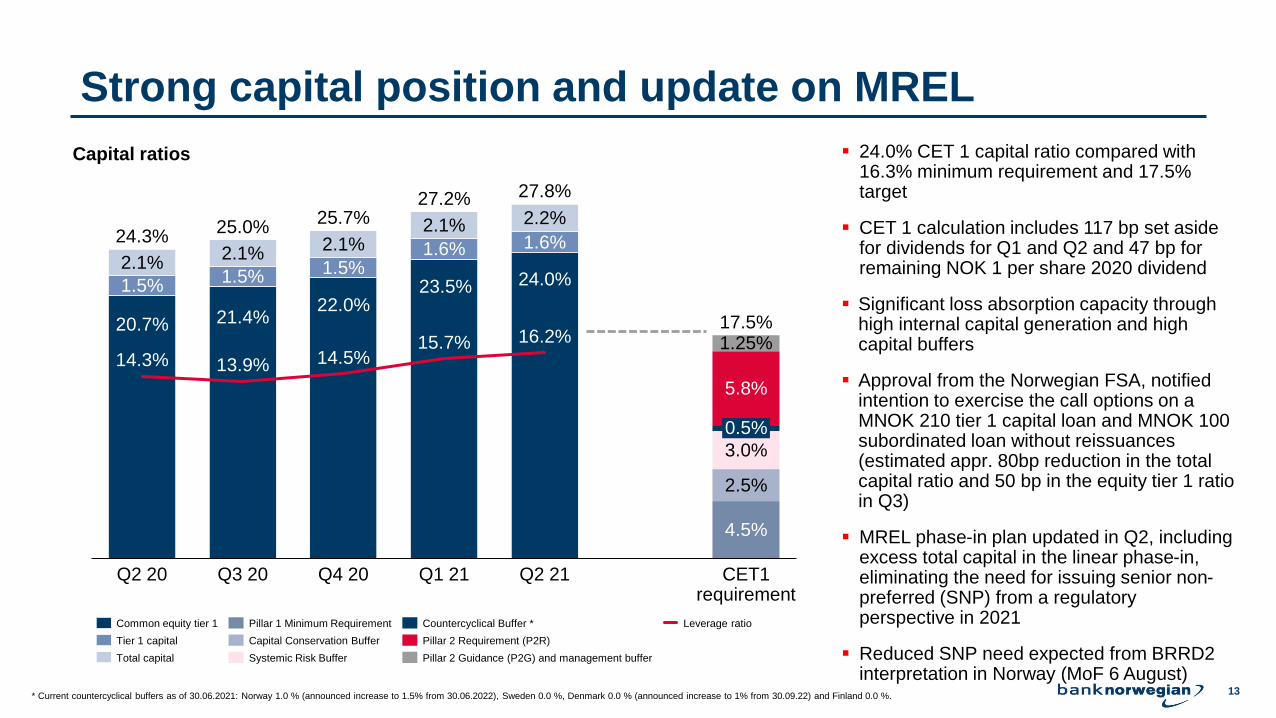
Strong capital position and update on MREL
▪ 24.0% CET 1 capital ratio compared with 16.3% minimum requirement and 17.5% target
▪ CET 1 calculation includes 117 bp set aside for dividends for Q1 and Q2 and 47 bp for remaining NOK 1 per share 2020 dividend
▪ Significant loss absorption capacity through high internal capital generation and high capital buffers
▪ Approval from the Norwegian FSA, notified intention to exercise the call options on a MNOK 210 tier 1 capital loan and MNOK 100 subordinated loan without reissuances (estimated appr. 80bp reduction in the total capital ratio and 50 bp in the equity tier 1 ratio in Q3)
▪ MREL phase-in plan updated in Q2, including excess total capital in the linear phase-in, eliminating the need for issuing senior non-preferred (SNP) from a regulatory perspective in 2021
▪ Reduced SNP need expected from BRRD2 interpretation in Norway (MoF 6 August)
Capital ratios
20.7% 21.4%22.0%
23.5% 24.0%
4.5%
1.5%1.5% 1.5%
1.6% 1.6%
2.5%
2.1%2.1%
2.1%2.1% 2.2%
3.0%
5.8%
14.3% 13.9% 14.5%15.7% 16.2%
Q2 21Q2 20 Q3 20 Q4 20 CET1 requirement
Q1 21
0.5%
1.25%
24.3%25.0%
25.7%27.2% 27.8%
17.5%
Common equity tier 1
Total capital
Tier 1 capital
Pillar 1 Minimum Requirement
Pillar 2 Guidance (P2G) and management buffer
Countercyclical Buffer *
Capital Conservation Buffer
Systemic Risk Buffer
Pillar 2 Requirement (P2R)
Leverage ratio
* Current countercyclical buffers as of 30.06.2021: Norway 1.0 % (announced increase to 1.5% from 30.06.2022), Sweden 0.0 %, Denmark 0.0 % (announced increase to 1% from 30.09.22) and Finland 0.0 %.
14
Leaving an eventful quarter behind, positive sentiment ahead
Our vision remains
….the digital leader for personal loans, credit cards and savings in
Europe
14
Strengthened
position during
pandemic
▪ Improving distribution and customer offering during pandemic
▪ European expansion according to plan with launch Q4 2021
▪ Simplification of legal structure executed, dividend NOK 5 per share paid in May, NOK 1 expected Q4 2021
▪ Credit card activity picking up in all countries
▪ Lean operation with cost control provides flexibility and scalability
▪ Record strong CET1 ready for growth
Strong financial
foundation
15
Appendix
16
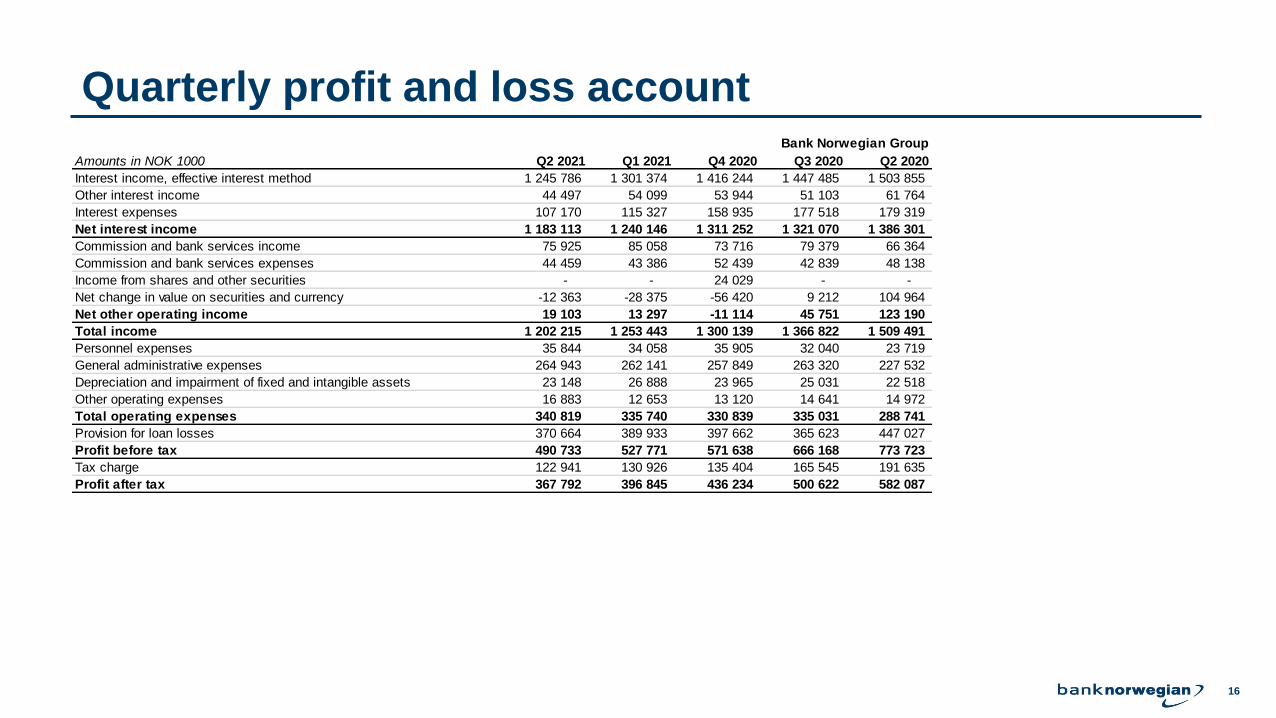
Quarterly profit and loss accountBank Norwegian Group
Amounts in NOK 1000 Q2 2021 Q1 2021 Q4 2020 Q3 2020 Q2 2020
Interest income, effective interest method 1 245 786 1 301 374 1 416 244 1 447 485 1 503 855
Other interest income 44 497 54 099 53 944 51 103 61 764
Interest expenses 107 170 115 327 158 935 177 518 179 319
Net interest income 1 183 113 1 240 146 1 311 252 1 321 070 1 386 301
Commission and bank services income 75 925 85 058 73 716 79 379 66 364
Commission and bank services expenses 44 459 43 386 52 439 42 839 48 138
Income from shares and other securities - - 24 029 - -
Net change in value on securities and currency -12 363 -28 375 -56 420 9 212 104 964
Net other operating income 19 103 13 297 -11 114 45 751 123 190
Total income 1 202 215 1 253 443 1 300 139 1 366 822 1 509 491
Personnel expenses 35 844 34 058 35 905 32 040 23 719
General administrative expenses 264 943 262 141 257 849 263 320 227 532
Depreciation and impairment of fixed and intangible assets 23 148 26 888 23 965 25 031 22 518
Other operating expenses 16 883 12 653 13 120 14 641 14 972
Total operating expenses 340 819 335 740 330 839 335 031 288 741
Provision for loan losses 370 664 389 933 397 662 365 623 447 027
Profit before tax 490 733 527 771 571 638 666 168 773 723
Tax charge 122 941 130 926 135 404 165 545 191 635
Profit after tax 367 792 396 845 436 234 500 622 582 087
17
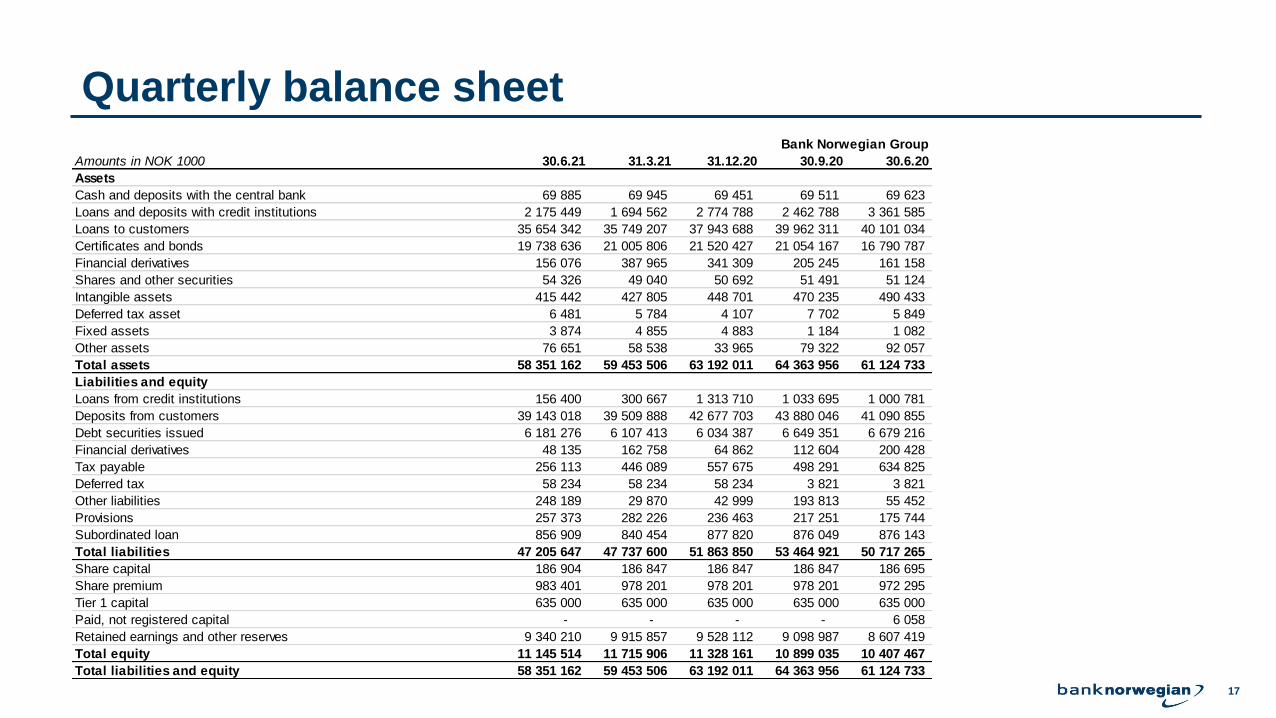
Quarterly balance sheetBank Norwegian Group
Amounts in NOK 1000 30.6.21 31.3.21 31.12.20 30.9.20 30.6.20
Assets
Cash and deposits with the central bank 69 885 69 945 69 451 69 511 69 623
Loans and deposits with credit institutions 2 175 449 1 694 562 2 774 788 2 462 788 3 361 585
Loans to customers 35 654 342 35 749 207 37 943 688 39 962 311 40 101 034
Certificates and bonds 19 738 636 21 005 806 21 520 427 21 054 167 16 790 787
Financial derivatives 156 076 387 965 341 309 205 245 161 158
Shares and other securities 54 326 49 040 50 692 51 491 51 124
Intangible assets 415 442 427 805 448 701 470 235 490 433
Deferred tax asset 6 481 5 784 4 107 7 702 5 849
Fixed assets 3 874 4 855 4 883 1 184 1 082
Other assets 76 651 58 538 33 965 79 322 92 057
Total assets 58 351 162 59 453 506 63 192 011 64 363 956 61 124 733
Liabilities and equity
Loans from credit institutions 156 400 300 667 1 313 710 1 033 695 1 000 781
Deposits from customers 39 143 018 39 509 888 42 677 703 43 880 046 41 090 855
Debt securities issued 6 181 276 6 107 413 6 034 387 6 649 351 6 679 216
Financial derivatives 48 135 162 758 64 862 112 604 200 428
Tax payable 256 113 446 089 557 675 498 291 634 825
Deferred tax 58 234 58 234 58 234 3 821 3 821
Other liabilities 248 189 29 870 42 999 193 813 55 452
Provisions 257 373 282 226 236 463 217 251 175 744
Subordinated loan 856 909 840 454 877 820 876 049 876 143
Total liabilities 47 205 647 47 737 600 51 863 850 53 464 921 50 717 265
Share capital 186 904 186 847 186 847 186 847 186 695
Share premium 983 401 978 201 978 201 978 201 972 295
Tier 1 capital 635 000 635 000 635 000 635 000 635 000
Paid, not registered capital - - - - 6 058
Retained earnings and other reserves 9 340 210 9 915 857 9 528 112 9 098 987 8 607 419
Total equity 11 145 514 11 715 906 11 328 161 10 899 035 10 407 467
Total liabilities and equity 58 351 162 59 453 506 63 192 011 64 363 956 61 124 733
18
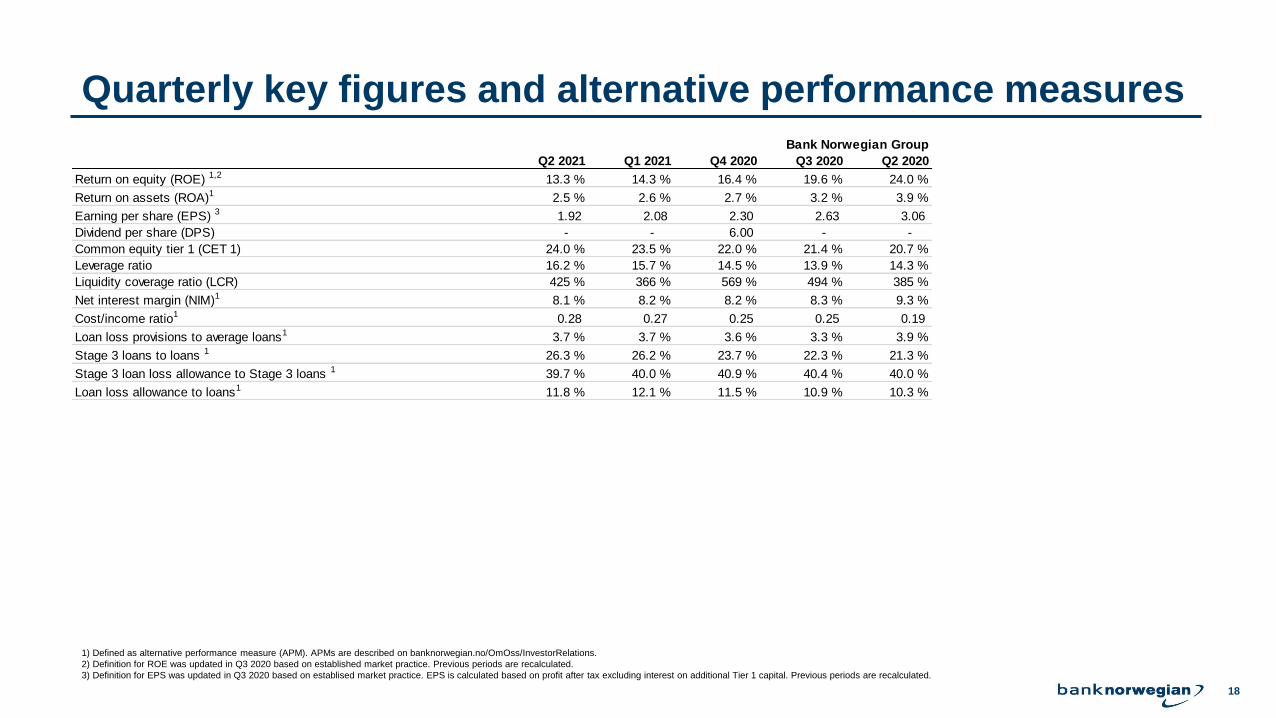
Quarterly key figures and alternative performance measures
1) Defined as alternative performance measure (APM). APMs are described on banknorwegian.no/OmOss/InvestorRelations.
2) Definition for ROE was updated in Q3 2020 based on established market practice. Previous periods are recalculated.
3) Definition for EPS was updated in Q3 2020 based on establised market practice. EPS is calculated based on profit after tax excluding interest on additional Tier 1 capital. Previous periods are recalculated.
Bank Norwegian Group
Q2 2021 Q1 2021 Q4 2020 Q3 2020 Q2 2020
Return on equity (ROE) 1,2 13.3 % 14.3 % 16.4 % 19.6 % 24.0 %
Return on assets (ROA)1 2.5 % 2.6 % 2.7 % 3.2 % 3.9 %
Earning per share (EPS) 3 1.92 2.08 2.30 2.63 3.06
Dividend per share (DPS) - - 6.00 - -
Common equity tier 1 (CET 1) 24.0 % 23.5 % 22.0 % 21.4 % 20.7 %
Leverage ratio 16.2 % 15.7 % 14.5 % 13.9 % 14.3 %
Liquidity coverage ratio (LCR) 425 % 366 % 569 % 494 % 385 %
Net interest margin (NIM)1 8.1 % 8.2 % 8.2 % 8.3 % 9.3 %
Cost/income ratio1 0.28 0.27 0.25 0.25 0.19
Loan loss provisions to average loans1 3.7 % 3.7 % 3.6 % 3.3 % 3.9 %
Stage 3 loans to loans 1 26.3 % 26.2 % 23.7 % 22.3 % 21.3 %
Stage 3 loan loss allowance to Stage 3 loans 1 39.7 % 40.0 % 40.9 % 40.4 % 40.0 %
Loan loss allowance to loans1 11.8 % 12.1 % 11.5 % 10.9 % 10.3 %
19
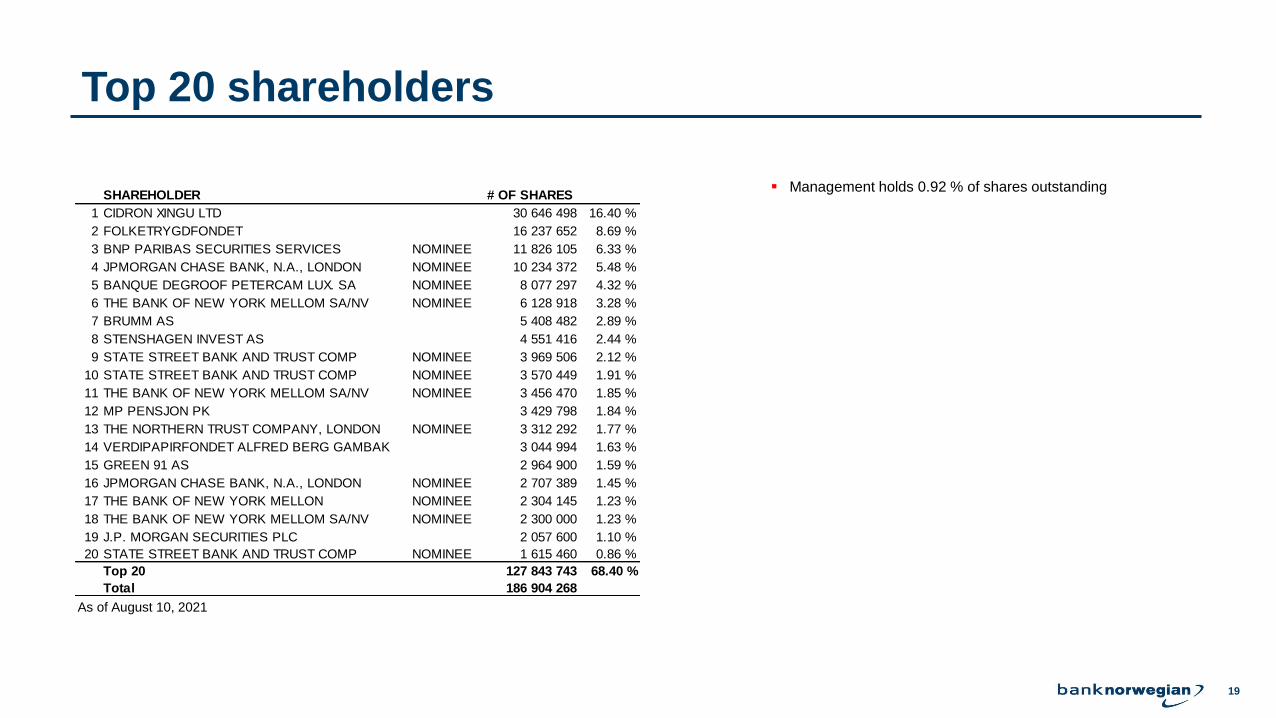
Top 20 shareholders
▪ Management holds 0.92 % of shares outstanding
As of August 10, 2021
SHAREHOLDER # OF SHARES
1 CIDRON XINGU LTD 30 646 498 16.40 %
2 FOLKETRYGDFONDET 16 237 652 8.69 %
3 BNP PARIBAS SECURITIES SERVICES NOMINEE 11 826 105 6.33 %
4 JPMORGAN CHASE BANK, N.A., LONDON NOMINEE 10 234 372 5.48 %
5 BANQUE DEGROOF PETERCAM LUX. SA NOMINEE 8 077 297 4.32 %
6 THE BANK OF NEW YORK MELLOM SA/NV NOMINEE 6 128 918 3.28 %
7 BRUMM AS 5 408 482 2.89 %
8 STENSHAGEN INVEST AS 4 551 416 2.44 %
9 STATE STREET BANK AND TRUST COMP NOMINEE 3 969 506 2.12 %
10 STATE STREET BANK AND TRUST COMP NOMINEE 3 570 449 1.91 %
11 THE BANK OF NEW YORK MELLOM SA/NV NOMINEE 3 456 470 1.85 %
12 MP PENSJON PK 3 429 798 1.84 %
13 THE NORTHERN TRUST COMPANY, LONDON NOMINEE 3 312 292 1.77 %
14 VERDIPAPIRFONDET ALFRED BERG GAMBAK 3 044 994 1.63 %
15 GREEN 91 AS 2 964 900 1.59 %
16 JPMORGAN CHASE BANK, N.A., LONDON NOMINEE 2 707 389 1.45 %
17 THE BANK OF NEW YORK MELLON NOMINEE 2 304 145 1.23 %
18 THE BANK OF NEW YORK MELLOM SA/NV NOMINEE 2 300 000 1.23 %
19 J.P. MORGAN SECURITIES PLC 2 057 600 1.10 %
20 STATE STREET BANK AND TRUST COMP NOMINEE 1 615 460 0.86 %
Top 20 127 843 743 68.40 %
Total 186 904 268