FINANCIAL RESULTS Q2 - FY 2021-22
42
Page 1 INVESTORS PRESENTATION FINANCIAL RESULTS Q2 - FY 2021-22 October 21, 2021
Transcript of FINANCIAL RESULTS Q2 - FY 2021-22

Page 1
INVESTORS
PRESENTATION
FINANCIAL RESULTS
Q2 - FY 2021-22
October 21, 2021
Page 2
The information in this presentation is being provided by IDBI Bank Limited (referred to as ‘the Bank’). The information contained in this presentation is confidential and may not becopied, published, distributed, transmitted or advertised in any media, website or otherwise. By attending a meeting where this presentation is made or by reading thispresentation material, you agree to be bound by following limitations:
The information in this presentation has been prepared for use in presentations by the Bank for information purposes only and does not constitute, or should be regarded as, orform part of any offer/ a prospectus / an offer document, / invitation / inducement or advertisement to sell or issue, or any solicitation or any offer to purchase or subscribe for,any securities of the Bank in any jurisdiction.
The Bank reserves its rights to alter, modify, or otherwise change in any manner the information contained in this presentation without any obligation to update or to otherwisenotify any person about such changes / alteration / modifications made by the Bank. The Bank makes no representation or warranty, express or implied, whatsoever, norreliance should be placed on, the fairness, accuracy, completeness or correctness of the information or any statement or opinions contained in this presentation.
Neither the Bank nor any of its affiliates, directors, advisors, representatives or employees shall have any responsibility or liability whatsoever for any direct or indirect losshowsoever arising to or suffered by any person through use of the information contained in this presentation or otherwise arising in connection with this presentation. Theinformation set out herein may be subject to further updates, completion, revision, verification and amendment and such information may change materially.
You must make your own assessment of the relevance, accuracy and adequacy of the information contained in this presentation and must make independent analysis as youmay consider necessary or appropriate before using such information. . Any opinions expressed in this presentation are subject to change without notice and past performanceis not indicative of future results. By attending this presentation you acknowledge that you will be solely responsible for your own assessment of the market position of the Bankand that you will conduct your own analysis and be solely responsible for forming your own view of the potential future performance of the Bank’s business.
This presentation contains forward‐looking statements based on the currently held beliefs and assumptions of the management of the Bank, which are expressed in good faithand, in their opinion, reasonable. Forward‐looking statements involve known and unknown risks, uncertainties and other factors, which may cause the actual results, financial
condition, performance or achievements of the Bank or industry results, to differ materially from the results, financial condition, performance or achievements expressed orimplied by such forward‐looking statements. The risks and uncertainties relating to these statements include, but are not limited to, risks and uncertainties regarding expansion
plans and the benefits there from, fluctuations in our earnings, our ability to manage growth and implement strategies, changes in deamd, competition in our business includingthose factors which may affect our cost advantage, wage increases in India, our ability to attract and retain highly skilled professionals, our ability to win new contracts, changesin technology, availability of financing, our ability to successfully complete and integrate our expansion plans, liabilities, political instability and general economic conditionsaffecting our industry. Unless otherwise indicated, the information contained herein is preliminary and indicative and is based on management information, current plans andestimates. Industry and market‐related information is obtained or derived from industry publications and other sources and has not been verified by us. Given these risks,uncertainties and other factors, recipients of this document are cautioned not to place undue reliance on these forward‐looking statements. The Bank disclaims any obligation toupdate these forward‐looking statements to reflect future events or developments.
Previous year figures have been regrouped / restated wherever applicable.
By accessing this presentation, you accept this disclaimer and any claims arising out of or in connection with this presentation shall be governed by the laws of India and only thecourts in Mumbai, India, and no other courts shall have jurisdiction over the same.
Disclaimer
Page 3
Content
1
2
3
4
5
6
7
8
9
Highlights
Financial Performance
Business Performance
Treasury Operations
Asset Quality
Capital
Digital Banking and Financial Inclusion
Subsidiaries
Way Forward

Page 4
Highlights
Page 5
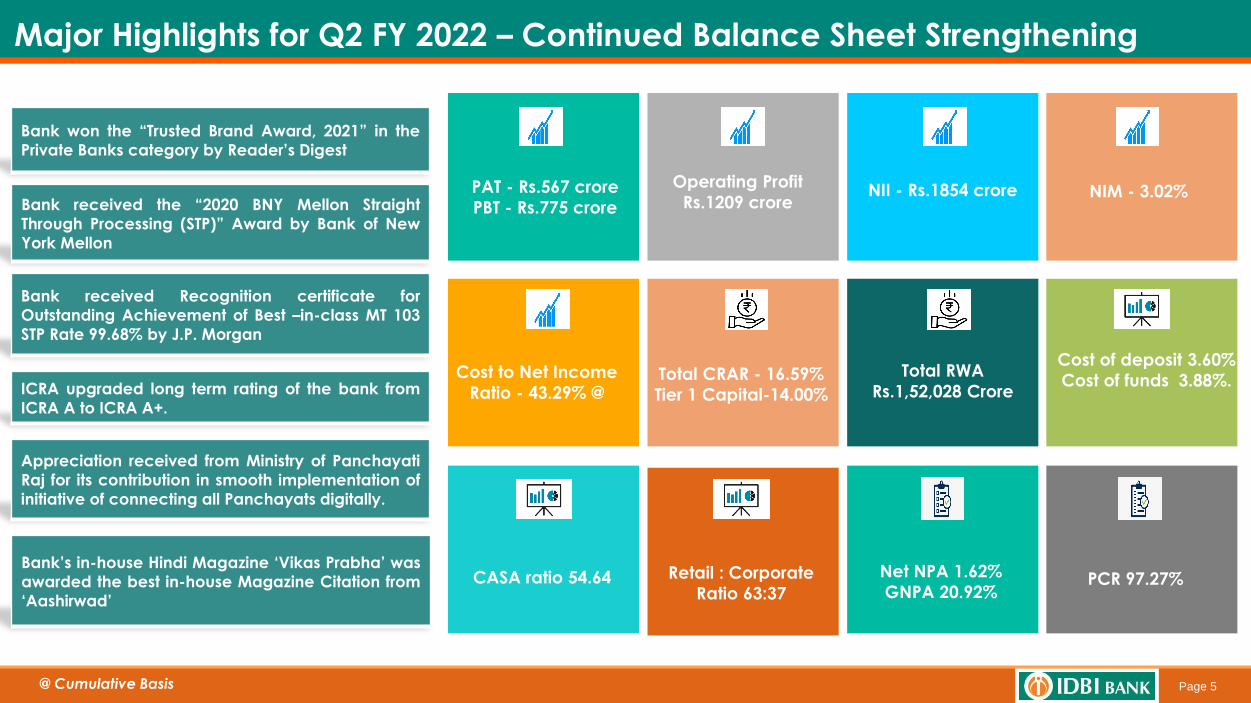
Major Highlights for Q2 FY 2022 – Continued Balance Sheet Strengthening
Net NPA 1.62%
GNPA 20.92%PCR 97.27%
Cost to Net Income
Ratio - 43.29% @
PAT - Rs.567 crore
PBT - Rs.775 crore
Operating Profit
Rs.1209 croreNII - Rs.1854 crore NIM - 3.02%
Total CRAR - 16.59%
Tier 1 Capital-14.00%
Total RWA
Rs.1,52,028 Crore
Retail : Corporate
Ratio 63:37
Cost of deposit 3.60%
Cost of funds 3.88%.
CASA ratio 54.64
Bank received the “2020 BNY Mellon Straight
Through Processing (STP)” Award by Bank of New
York Mellon
Bank received Recognition certificate for
Outstanding Achievement of Best –in-class MT 103
STP Rate 99.68% by J.P. Morgan
Bank won the “Trusted Brand Award, 2021” in the
Private Banks category by Reader’s Digest
ICRA upgraded long term rating of the bank from
ICRA A to ICRA A+.
Bank’s in-house Hindi Magazine ‘Vikas Prabha’ was
awarded the best in-house Magazine Citation from
‘Aashirwad’
@ Cumulative Basis
Appreciation received from Ministry of Panchayati
Raj for its contribution in smooth implementation of
initiative of connecting all Panchayats digitally.
Page 6
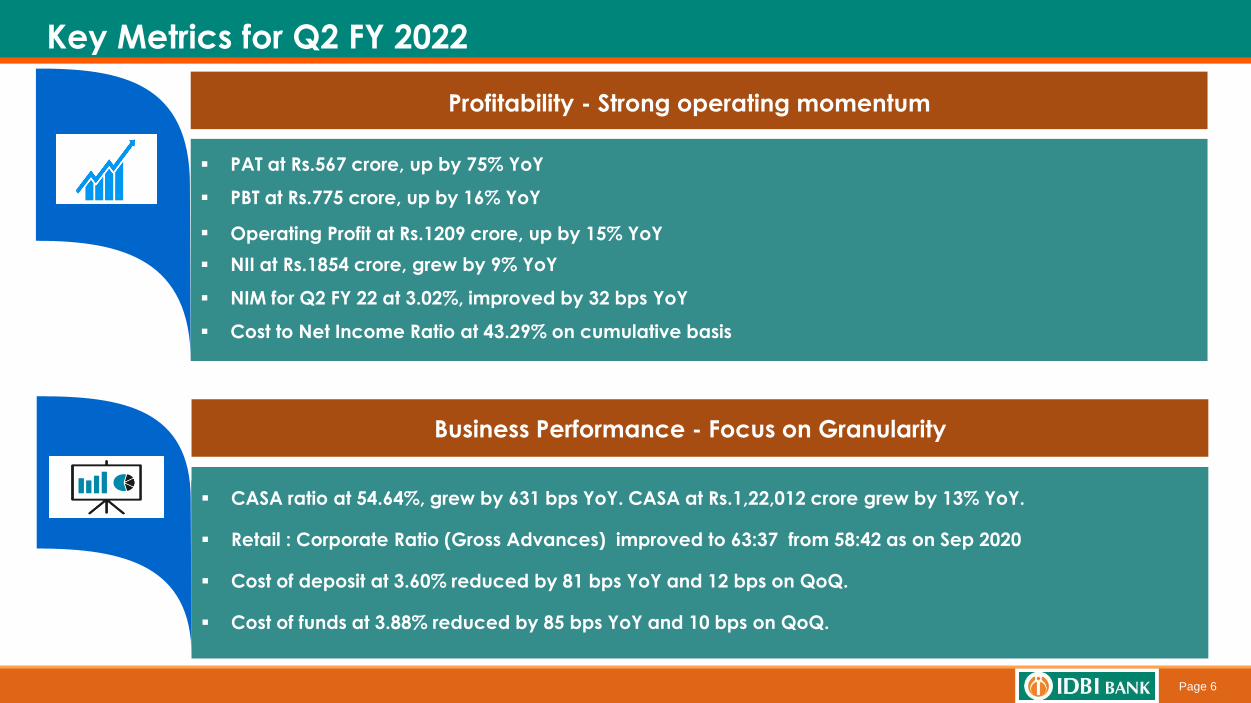
Profitability - Strong operating momentum
CASA ratio at 54.64%, grew by 631 bps YoY. CASA at Rs.1,22,012 crore grew by 13% YoY.
Retail : Corporate Ratio (Gross Advances) improved to 63:37 from 58:42 as on Sep 2020
Cost of deposit at 3.60% reduced by 81 bps YoY and 12 bps on QoQ.
Cost of funds at 3.88% reduced by 85 bps YoY and 10 bps on QoQ.
Business Performance - Focus on Granularity
Key Metrics for Q2 FY 2022
PAT at Rs.567 crore, up by 75% YoY
PBT at Rs.775 crore, up by 16% YoY
Operating Profit at Rs.1209 crore, up by 15% YoY
NII at Rs.1854 crore, grew by 9% YoY
NIM for Q2 FY 22 at 3.02%, improved by 32 bps YoY
Cost to Net Income Ratio at 43.29% on cumulative basis
Page 7
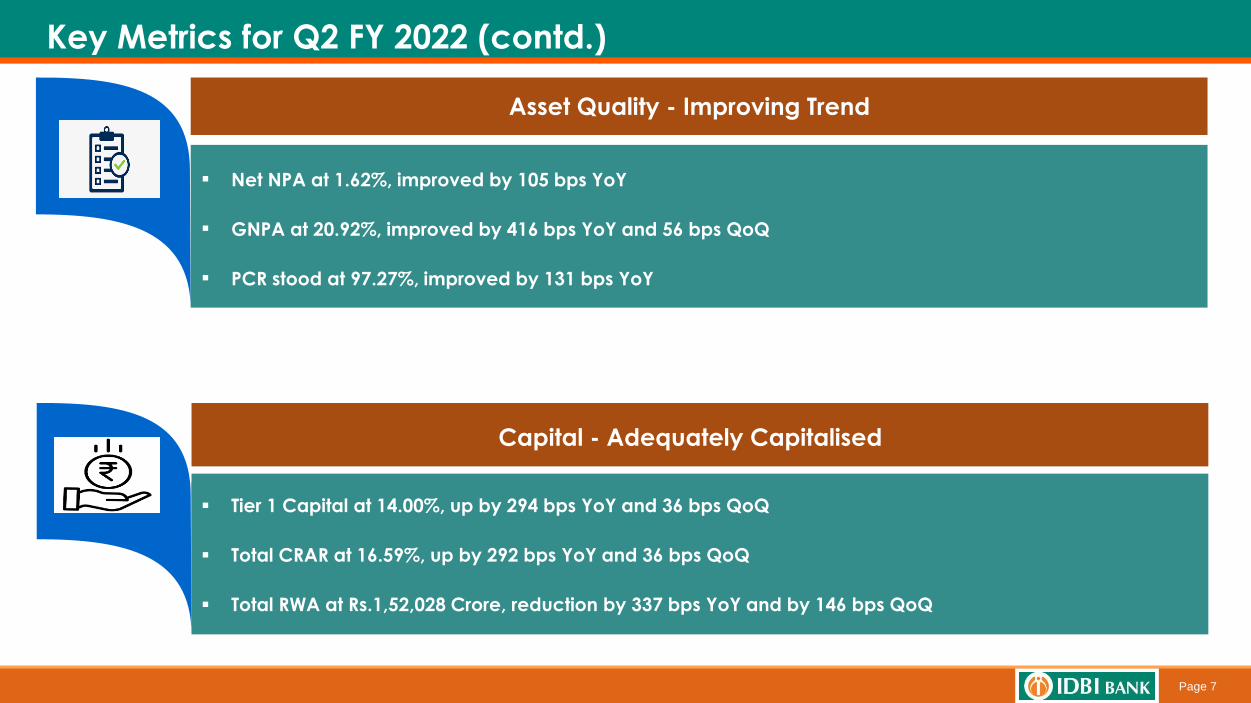
Asset Quality - Improving Trend
Tier 1 Capital at 14.00%, up by 294 bps YoY and 36 bps QoQ
Total CRAR at 16.59%, up by 292 bps YoY and 36 bps QoQ
Total RWA at Rs.1,52,028 Crore, reduction by 337 bps YoY and by 146 bps QoQ
Capital - Adequately Capitalised
Key Metrics for Q2 FY 2022 (contd.)
Net NPA at 1.62%, improved by 105 bps YoY
GNPA at 20.92%, improved by 416 bps YoY and 56 bps QoQ
PCR stood at 97.27%, improved by 131 bps YoY
Page 8
Financial Performance
Page 9
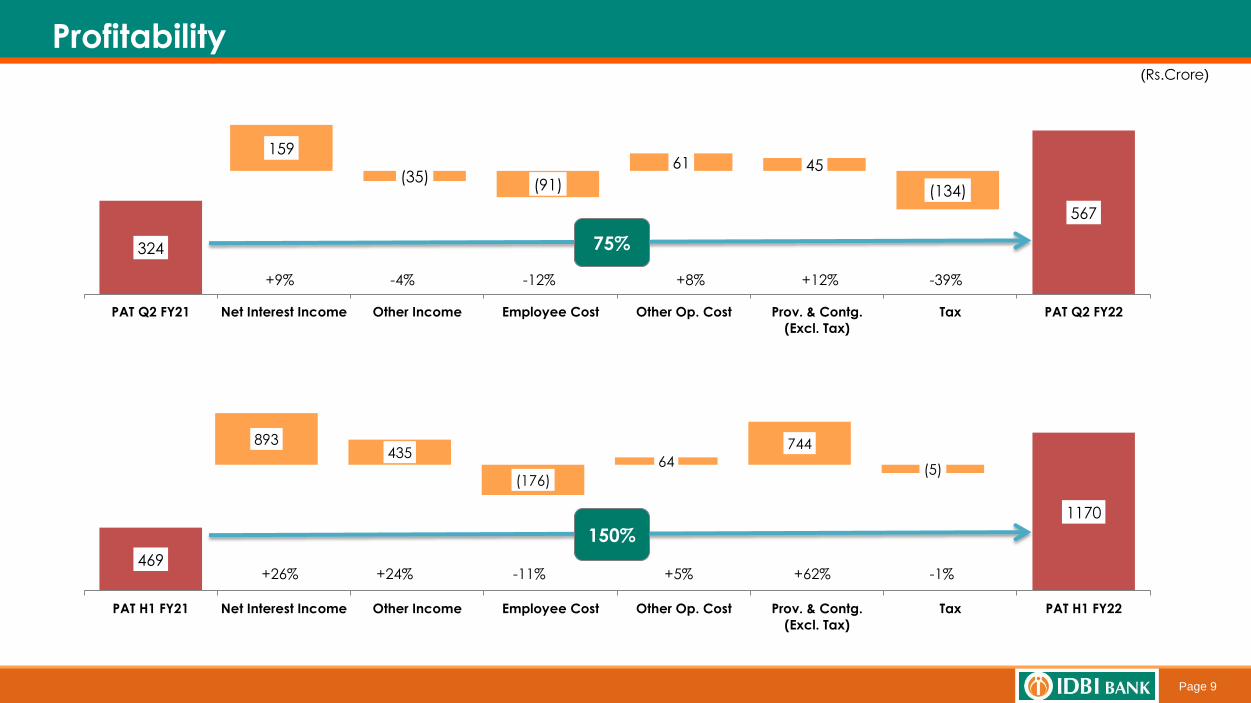
Profitability (Rs.Crore)
324
567
PAT Q2 FY21 Net Interest Income Other Income Employee Cost Other Op. Cost Prov. & Contg.
(Excl. Tax)
Tax PAT Q2 FY22
469
1170
PAT H1 FY21 Net Interest Income Other Income Employee Cost Other Op. Cost Prov. & Contg.
(Excl. Tax)
Tax PAT H1 FY22
+26% +24%
150%
-11% +5% +62% -1%
+9% -4%
75%
-12% +8% +12% -39%
159
(35)(91)
61 45
(134)
893435
(176)
64
744
(5)
Page 10
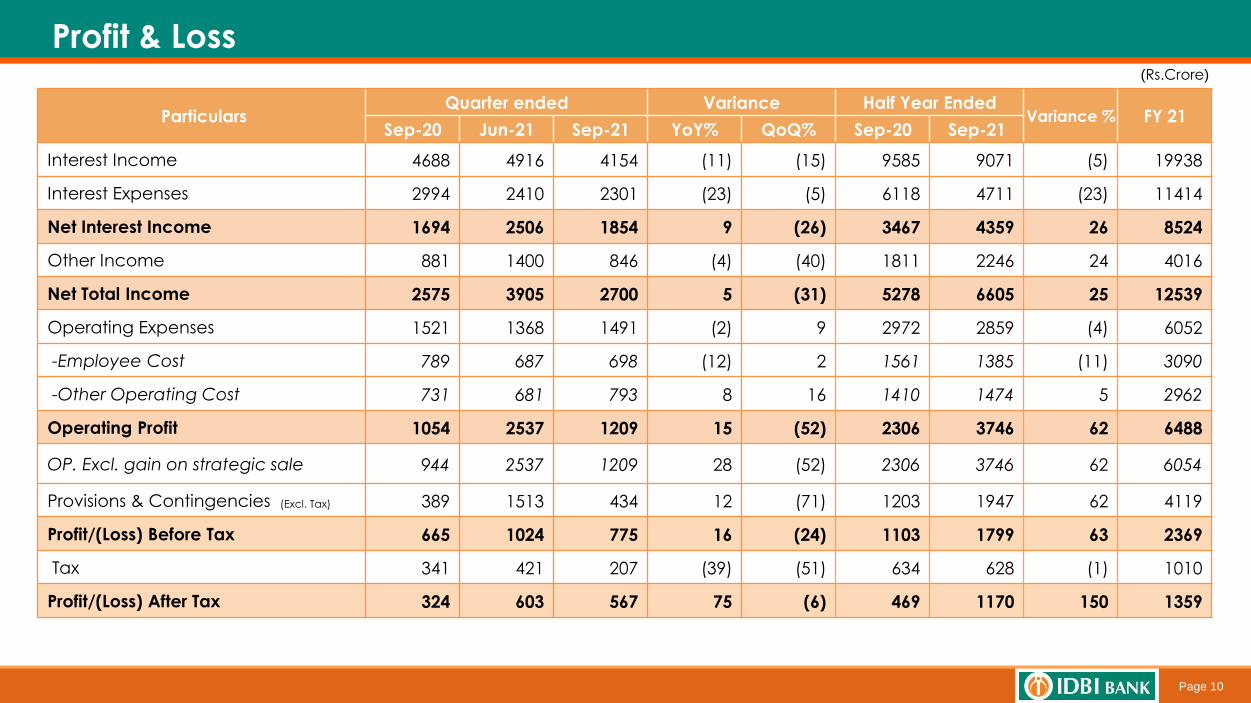
Profit & Loss(Rs.Crore)
ParticularsQuarter ended Variance Half Year Ended
Variance % FY 21Sep-20 Jun-21 Sep-21 YoY% QoQ% Sep-20 Sep-21
Interest Income 4688 4916 4154 (11) (15) 9585 9071 (5) 19938
Interest Expenses 2994 2410 2301 (23) (5) 6118 4711 (23) 11414
Net Interest Income 1694 2506 1854 9 (26) 3467 4359 26 8524
Other Income 881 1400 846 (4) (40) 1811 2246 24 4016
Net Total Income 2575 3905 2700 5 (31) 5278 6605 25 12539
Operating Expenses 1521 1368 1491 (2) 9 2972 2859 (4) 6052
-Employee Cost 789 687 698 (12) 2 1561 1385 (11) 3090
-Other Operating Cost 731 681 793 8 16 1410 1474 5 2962
Operating Profit 1054 2537 1209 15 (52) 2306 3746 62 6488
OP. Excl. gain on strategic sale 944 2537 1209 28 (52) 2306 3746 62 6054
Provisions & Contingencies (Excl. Tax) 389 1513 434 12 (71) 1203 1947 62 4119
Profit/(Loss) Before Tax 665 1024 775 16 (24) 1103 1799 63 2369
Tax 341 421 207 (39) (51) 634 628 (1) 1010
Profit/(Loss) After Tax 324 603 567 75 (6) 469 1170 150 1359
Page 11
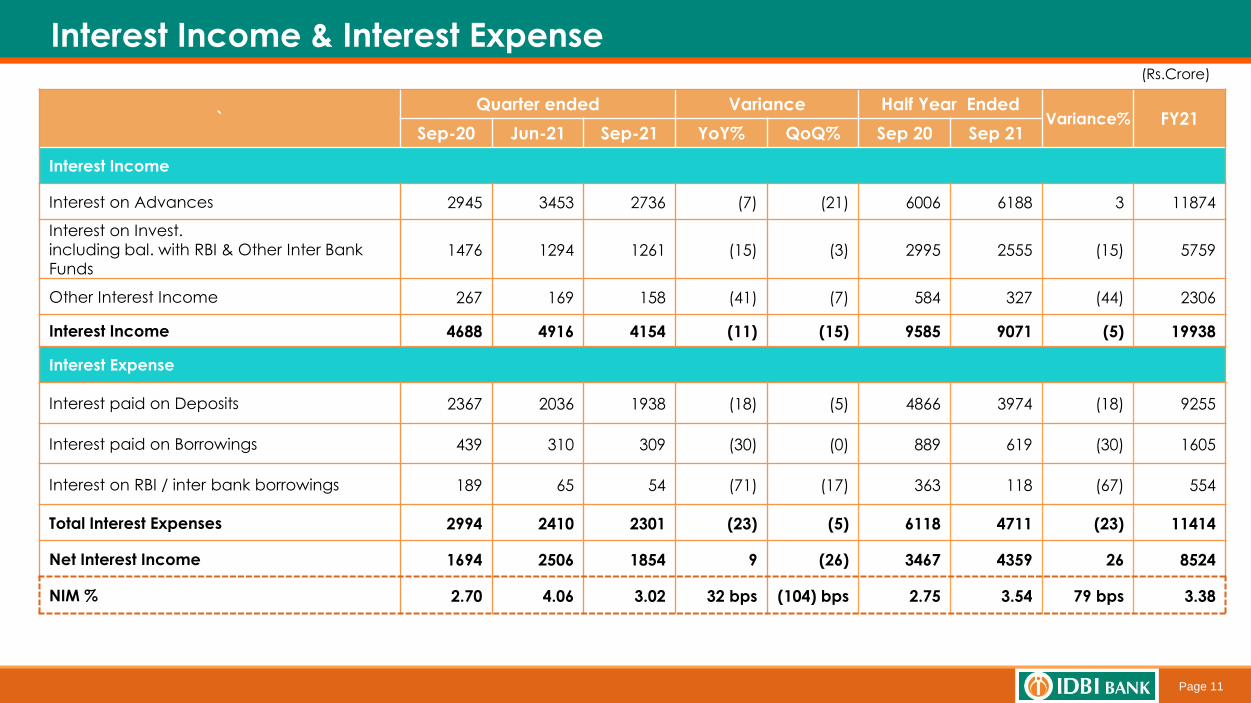
Interest Income & Interest Expense(Rs.Crore)
`Quarter ended Variance Half Year Ended
Variance% FY21 Sep-20 Jun-21 Sep-21 YoY% QoQ% Sep 20 Sep 21
Interest Income
Interest on Advances 2945 3453 2736 (7) (21) 6006 6188 3 11874
Interest on Invest.
including bal. with RBI & Other Inter Bank
Funds 1476 1294 1261 (15) (3) 2995 2555 (15) 5759
Other Interest Income 267 169 158 (41) (7) 584 327 (44) 2306
Interest Income 4688 4916 4154 (11) (15) 9585 9071 (5) 19938
Interest Expense
Interest paid on Deposits 2367 2036 1938 (18) (5) 4866 3974 (18) 9255
Interest paid on Borrowings 439 310 309 (30) (0) 889 619 (30) 1605
Interest on RBI / inter bank borrowings 189 65 54 (71) (17) 363 118 (67) 554
Total Interest Expenses 2994 2410 2301 (23) (5) 6118 4711 (23) 11414
Net Interest Income 1694 2506 1854 9 (26) 3467 4359 26 8524
NIM % 2.70 4.06 3.02 32 bps (104) bps 2.75 3.54 79 bps 3.38
Page 12
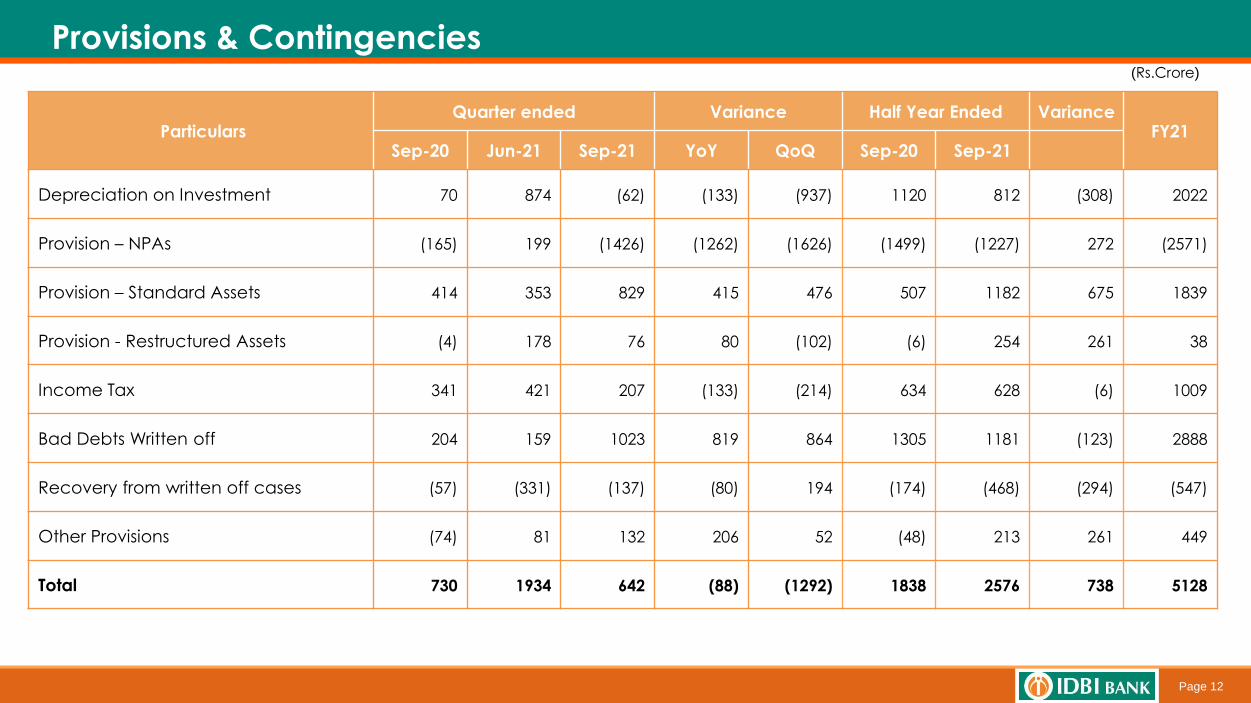
Provisions & Contingencies(Rs.Crore)
ParticularsQuarter ended Variance Half Year Ended Variance
FY21 Sep-20 Jun-21 Sep-21 YoY QoQ Sep-20 Sep-21
Depreciation on Investment 70 874 (62) (133) (937) 1120 812 (308) 2022
Provision – NPAs (165) 199 (1426) (1262) (1626) (1499) (1227) 272 (2571)
Provision – Standard Assets 414 353 829 415 476 507 1182 675 1839
Provision - Restructured Assets (4) 178 76 80 (102) (6) 254 261 38
Income Tax 341 421 207 (133) (214) 634 628 (6) 1009
Bad Debts Written off 204 159 1023 819 864 1305 1181 (123) 2888
Recovery from written off cases (57) (331) (137) (80) 194 (174) (468) (294) (547)
Other Provisions (74) 81 132 206 52 (48) 213 261 449
Total 730 1934 642 (88) (1292) 1838 2576 738 5128
Page 13
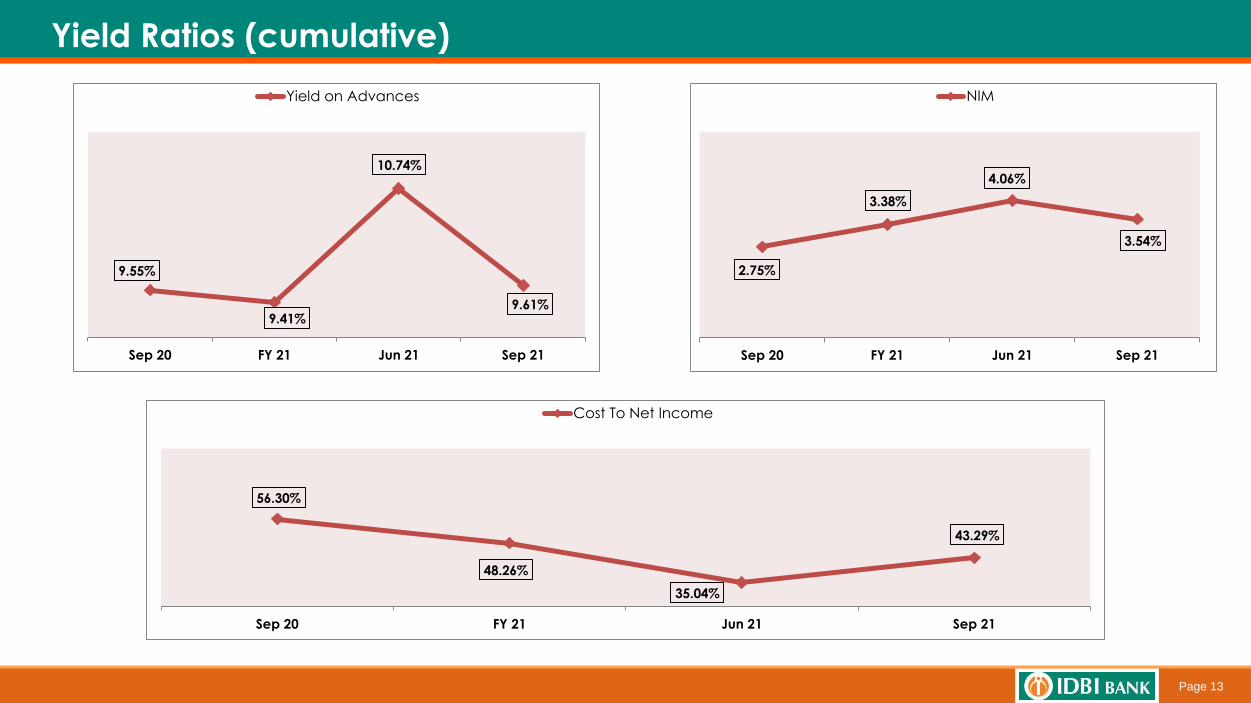
Yield Ratios (cumulative)
9.55%
9.41%
10.74%
9.61%
Sep 20 FY 21 Jun 21 Sep 21
Yield on Advances
56.30%
48.26%
35.04%
43.29%
Sep 20 FY 21 Jun 21 Sep 21
Cost To Net Income
2.75%
3.38%
4.06%
3.54%
Sep 20 FY 21 Jun 21 Sep 21
NIM
Page 14
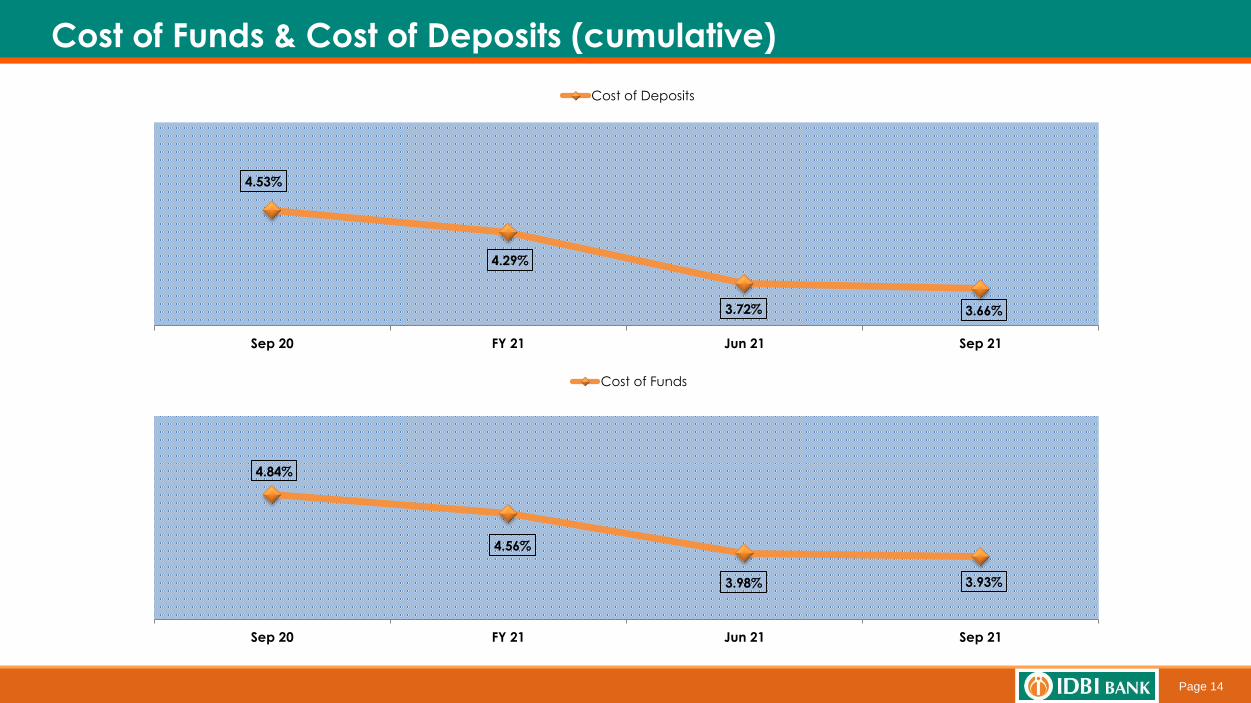
Cost of Funds & Cost of Deposits (cumulative)
4.53%
4.29%
3.72% 3.66%
Sep 20 FY 21 Jun 21 Sep 21
Cost of Deposits
4.84%
4.56%
3.98% 3.93%
Sep 20 FY 21 Jun 21 Sep 21
Cost of Funds
Page 15
Business Performance
Page 16
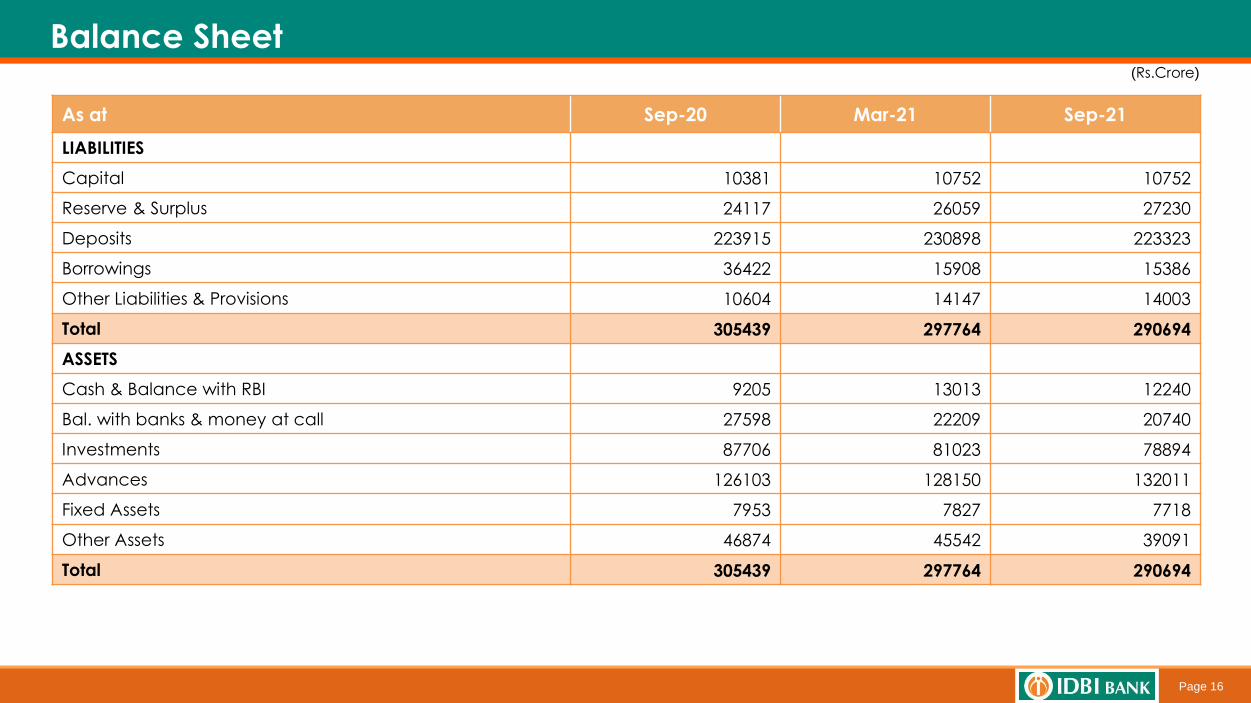
Balance Sheet
As at Sep-20 Mar-21 Sep-21
LIABILITIES
Capital 10381 10752 10752
Reserve & Surplus 24117 26059 27230
Deposits 223915 230898 223323
Borrowings 36422 15908 15386
Other Liabilities & Provisions 10604 14147 14003
Total 305439 297764 290694
ASSETS
Cash & Balance with RBI 9205 13013 12240
Bal. with banks & money at call 27598 22209 20740
Investments 87706 81023 78894
Advances 126103 128150 132011
Fixed Assets 7953 7827 7718
Other Assets 46874 45542 39091
Total 305439 297764 290694
(Rs.Crore)
Page 17
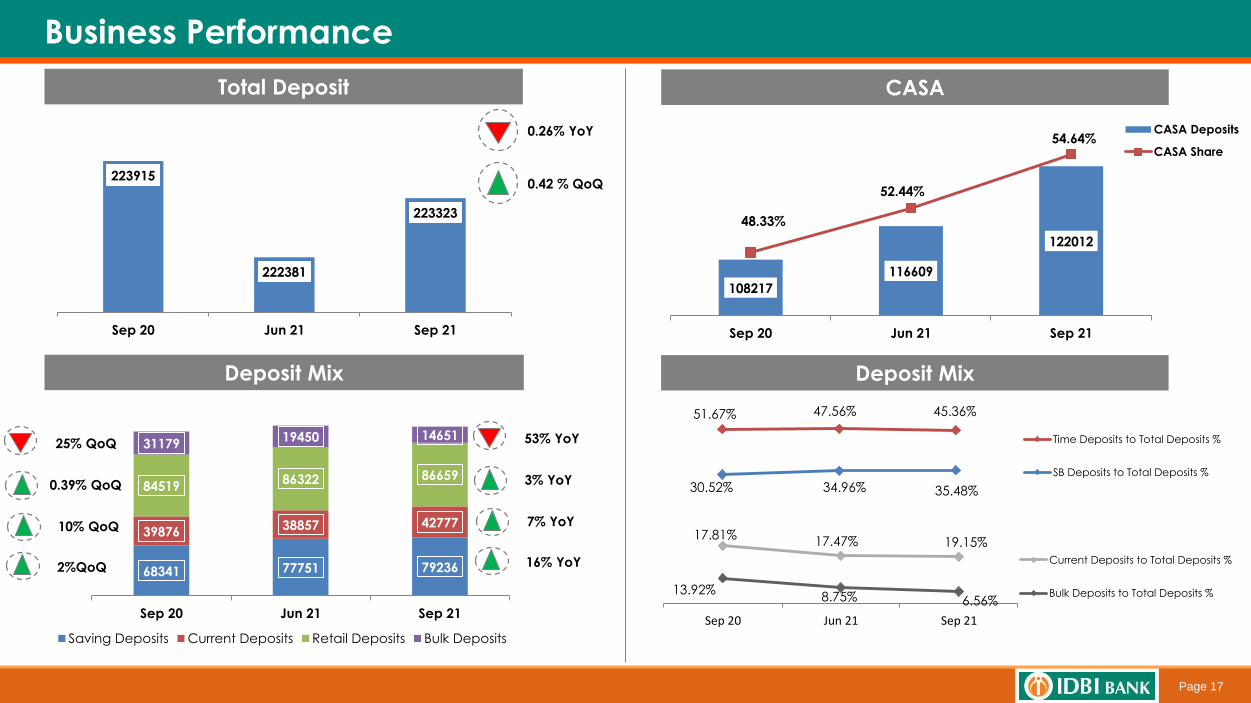
Business Performance
0.26% YoY
53% YoY
3% YoY
7% YoY
16% YoY
Total Deposit CASA
Deposit Mix Deposit Mix
223915
222381
223323
Sep 20 Jun 21 Sep 21
108217
116609
122012
48.33%
52.44%
54.64%
Sep 20 Jun 21 Sep 21
CASA Deposits
CASA Share
68341 77751 79236
3987638857 42777
8451986322 86659
3117919450 14651
Sep 20 Jun 21 Sep 21
Saving Deposits Current Deposits Retail Deposits Bulk Deposits
0.42 % QoQ
25% QoQ
0.39% QoQ
10% QoQ
2%QoQ
30.52% 34.96% 35.48%
51.67% 47.56% 45.36%
Time Deposits to Total Deposits %
SB Deposits to Total Deposits %
13.92%8.75% 6.56%
17.81%17.47% 19.15%
Sep 20 Jun 21 Sep 21
Current Deposits to Total Deposits %
Bulk Deposits to Total Deposits %
Page 18
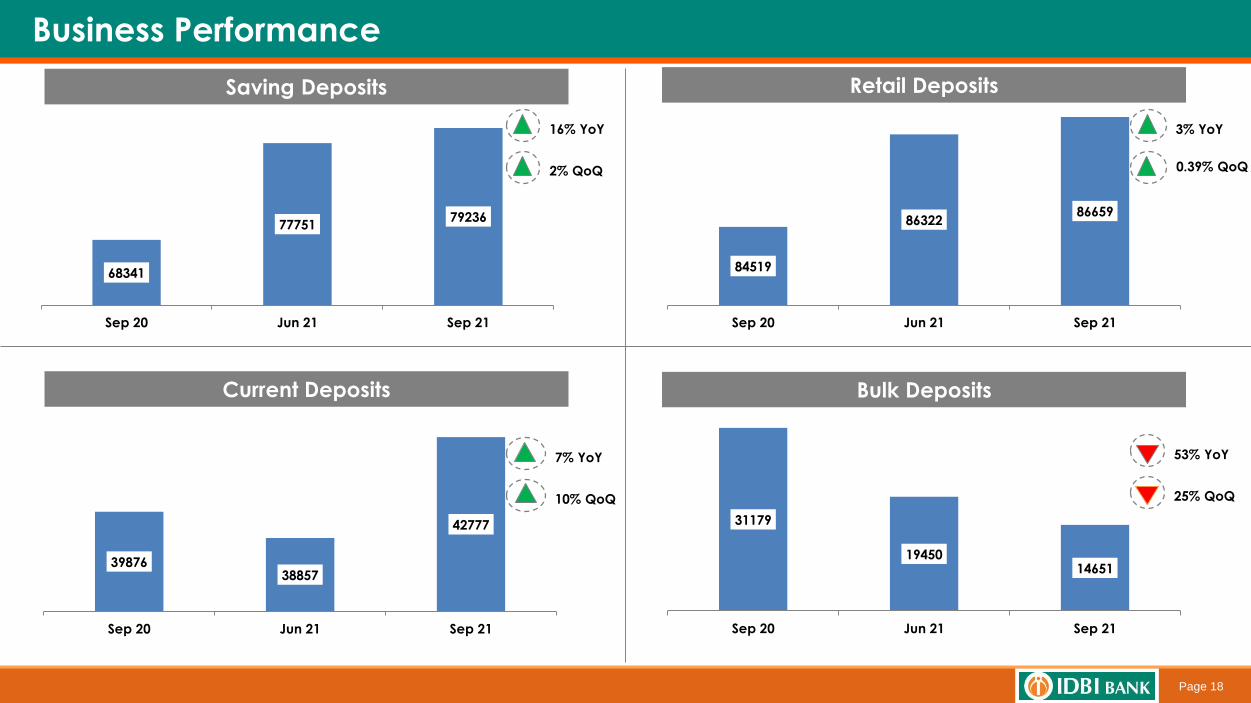
Business Performance
Saving Deposits
Current Deposits
Retail Deposits
Bulk Deposits
68341
7775179236
Sep 20 Jun 21 Sep 21
84519
8632286659
Sep 20 Jun 21 Sep 21
3987638857
42777
Sep 20 Jun 21 Sep 21
31179
1945014651
Sep 20 Jun 21 Sep 21
16% YoY
2% QoQ
7% YoY
10% QoQ
3% YoY
0.39% QoQ
53% YoY
25% QoQ
Page 19
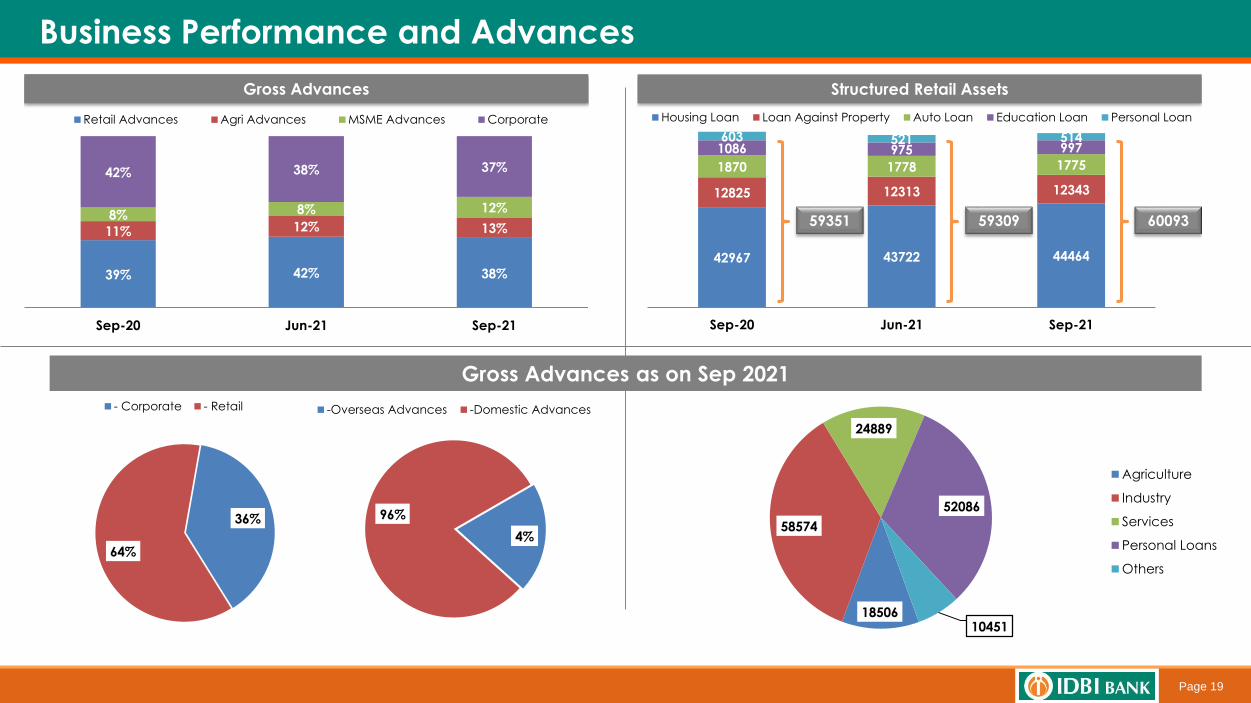
Business Performance and Advances
Gross Advances as on Sep 2021
18506
58574
24889
52086
10451
Agriculture
Industry
Services
Personal Loans
Others
4%
96%
-Overseas Advances -Domestic Advances
36%
64%
- Corporate - Retail
39% 42% 38%
11% 12% 13%8% 8% 12%
42% 38% 37%
Sep-20 Jun-21 Sep-21
Retail Advances Agri Advances MSME Advances Corporate
Gross Advances
42967 43722 44464
12825 12313 12343
1870 1778 1775
1086 975 997603 521 514
Sep-20 Jun-21 Sep-21
Housing Loan Loan Against Property Auto Loan Education Loan Personal Loan
Structured Retail Assets
59351 59309 60093
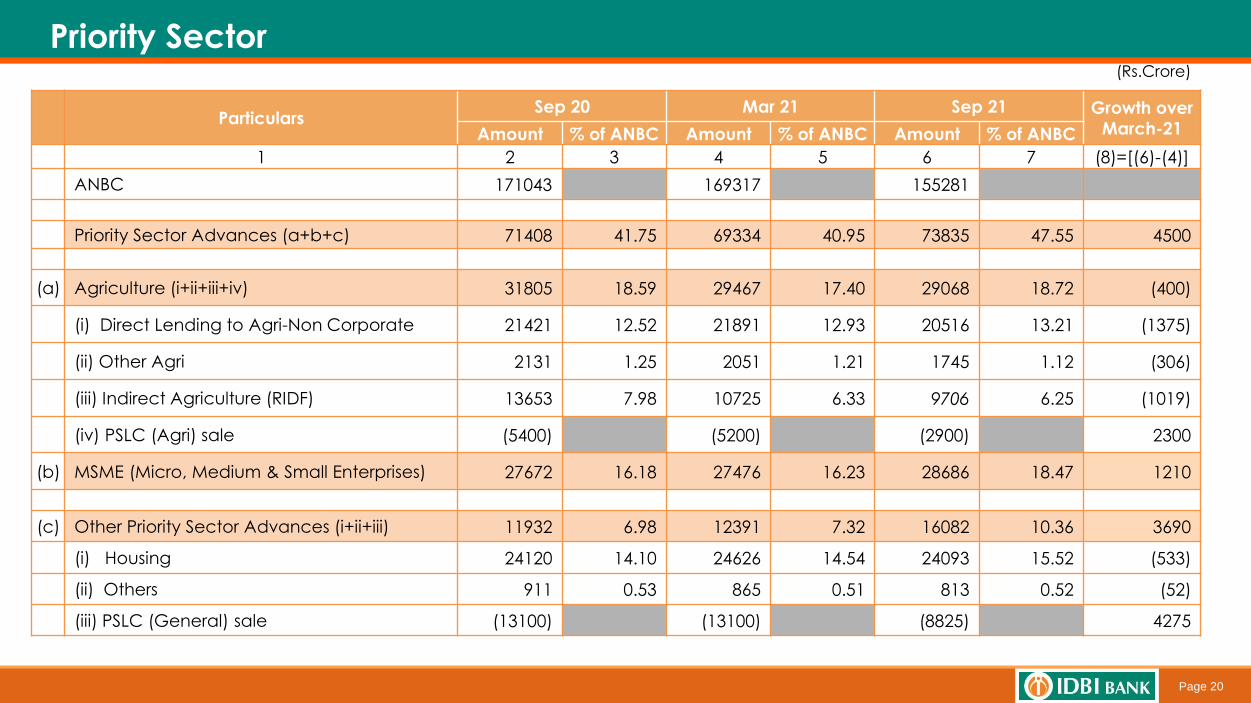
Page 20
(Rs.Crore)
ParticularsSep 20 Mar 21 Sep 21 Growth over
March-21Amount % of ANBC Amount % of ANBC Amount % of ANBC
1 2 3 4 5 6 7 (8)=[(6)-(4)]
ANBC 171043 169317 155281
Priority Sector Advances (a+b+c) 71408 41.75 69334 40.95 73835 47.55 4500
(a) Agriculture (i+ii+iii+iv) 31805 18.59 29467 17.40 29068 18.72 (400)
(i) Direct Lending to Agri-Non Corporate 21421 12.52 21891 12.93 20516 13.21 (1375)
(ii) Other Agri 2131 1.25 2051 1.21 1745 1.12 (306)
(iii) Indirect Agriculture (RIDF) 13653 7.98 10725 6.33 9706 6.25 (1019)
(iv) PSLC (Agri) sale (5400) (5200) (2900) 2300
(b) MSME (Micro, Medium & Small Enterprises) 27672 16.18 27476 16.23 28686 18.47 1210
(c) Other Priority Sector Advances (i+ii+iii) 11932 6.98 12391 7.32 16082 10.36 3690
(i) Housing 24120 14.10 24626 14.54 24093 15.52 (533)
(ii) Others 911 0.53 865 0.51 813 0.52 (52)
(iii) PSLC (General) sale (13100) (13100) (8825) 4275
Priority Sector
Page 21
Treasury Operations
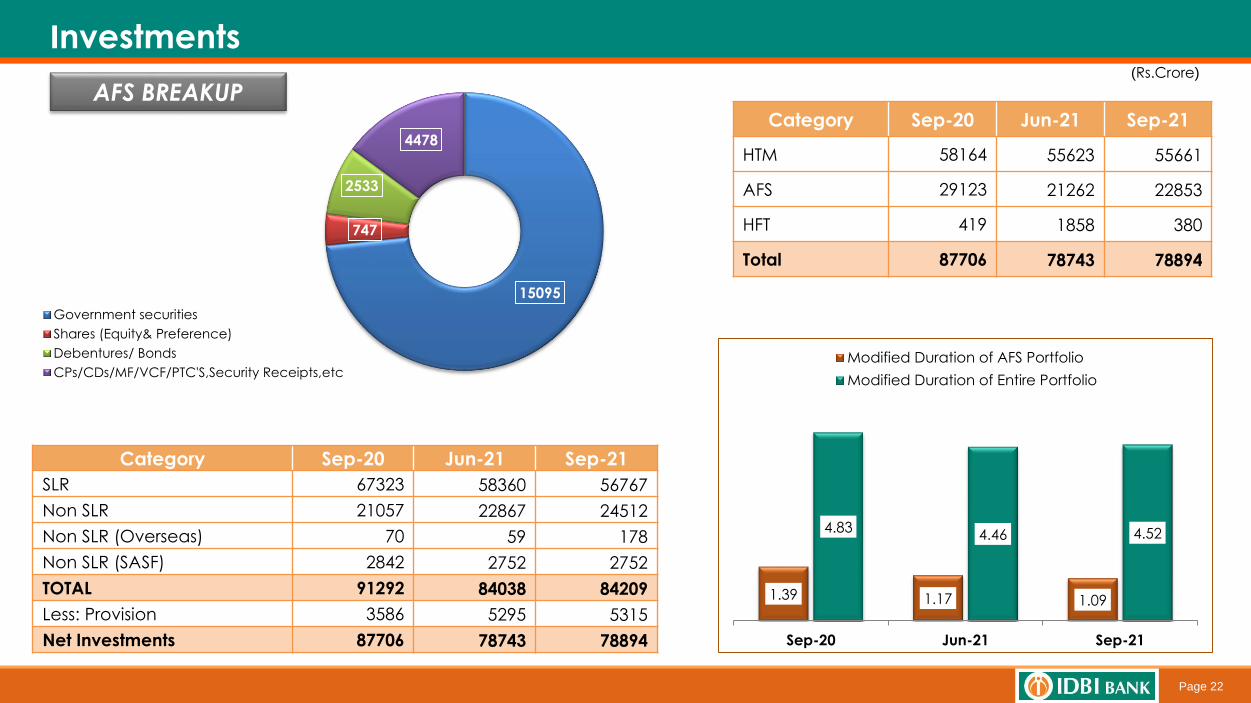
Page 22
Investments
Category Sep-20 Jun-21 Sep-21
HTM 58164 55623 55661
AFS 29123 21262 22853
HFT 419 1858 380
Total 87706 78743 78894
Category Sep-20 Jun-21 Sep-21
SLR 67323 58360 56767
Non SLR 21057 22867 24512
Non SLR (Overseas) 70 59 178
Non SLR (SASF) 2842 2752 2752
TOTAL 91292 84038 84209
Less: Provision 3586 5295 5315
Net Investments 87706 78743 78894
(Rs.Crore)
1.39 1.17 1.09
4.834.46 4.52
Sep-20 Jun-21 Sep-21
Modified Duration of AFS Portfolio
Modified Duration of Entire Portfolio
AFS BREAKUP
15095
747
2533
4478
Government securities
Shares (Equity& Preference)
Debentures/ Bonds
CPs/CDs/MF/VCF/PTC'S,Security Receipts,etc
Page 23
Asset Quality
Page 24
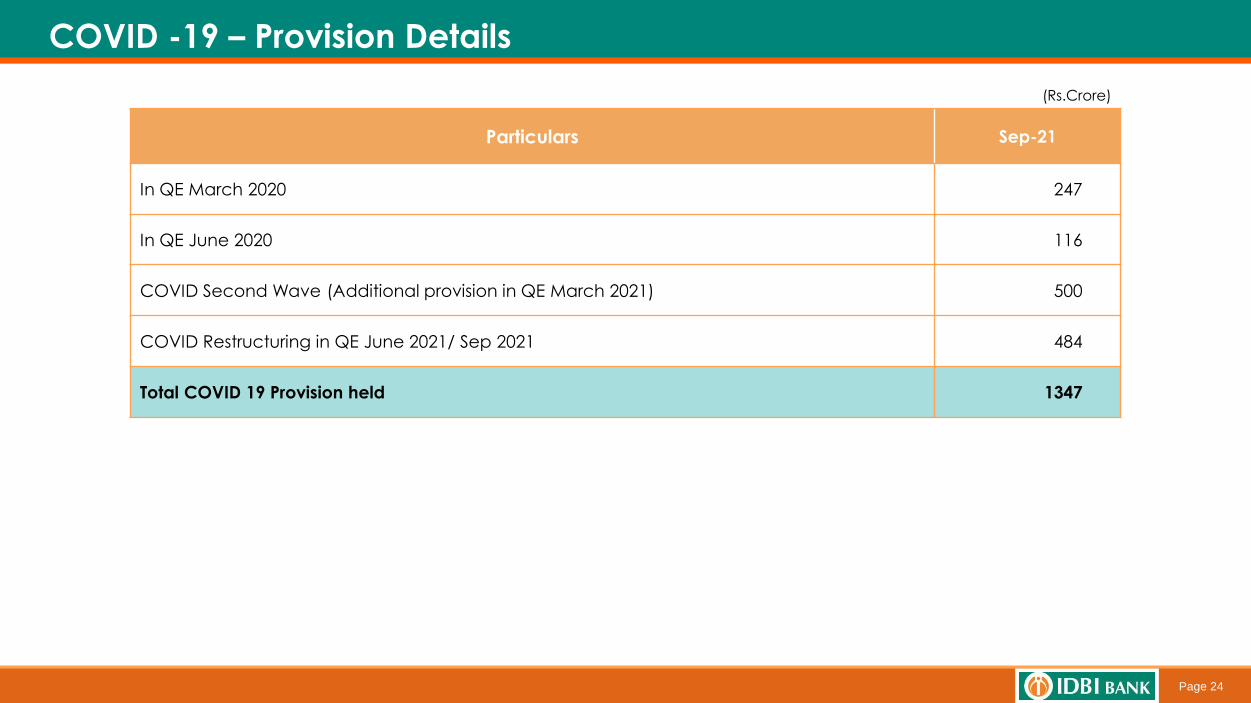
COVID -19 – Provision Details
(Rs.Crore)
Particulars Sep-21
In QE March 2020 247
In QE June 2020 116
COVID Second Wave (Additional provision in QE March 2021) 500
COVID Restructuring in QE June 2021/ Sep 2021 484
Total COVID 19 Provision held 1347
Page 25
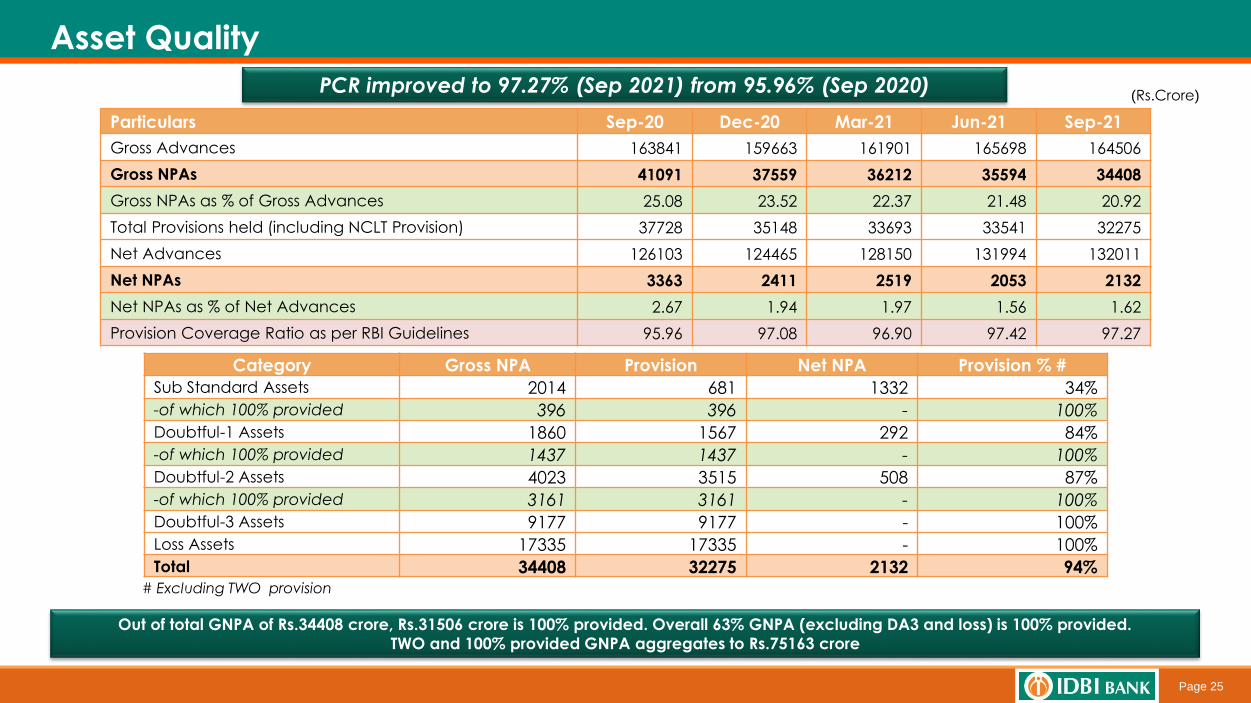
Asset Quality
PCR improved to 97.27% (Sep 2021) from 95.96% (Sep 2020)
Particulars Sep-20 Dec-20 Mar-21 Jun-21 Sep-21
Gross Advances 163841 159663 161901 165698 164506
Gross NPAs 41091 37559 36212 35594 34408
Gross NPAs as % of Gross Advances 25.08 23.52 22.37 21.48 20.92
Total Provisions held (including NCLT Provision) 37728 35148 33693 33541 32275
Net Advances 126103 124465 128150 131994 132011
Net NPAs 3363 2411 2519 2053 2132
Net NPAs as % of Net Advances 2.67 1.94 1.97 1.56 1.62
Provision Coverage Ratio as per RBI Guidelines 95.96 97.08 96.90 97.42 97.27
(Rs.Crore)
Category Gross NPA Provision Net NPA Provision % #
Sub Standard Assets 2014 681 1332 34%
-of which 100% provided 396 396 - 100%
Doubtful-1 Assets 1860 1567 292 84%
-of which 100% provided 1437 1437 - 100%
Doubtful-2 Assets 4023 3515 508 87%
-of which 100% provided 3161 3161 - 100%
Doubtful-3 Assets 9177 9177 - 100%
Loss Assets 17335 17335 - 100%
Total 34408 32275 2132 94%
Out of total GNPA of Rs.34408 crore, Rs.31506 crore is 100% provided. Overall 63% GNPA (excluding DA3 and loss) is 100% provided.
TWO and 100% provided GNPA aggregates to Rs.75163 crore
# Excluding TWO provision
Page 26
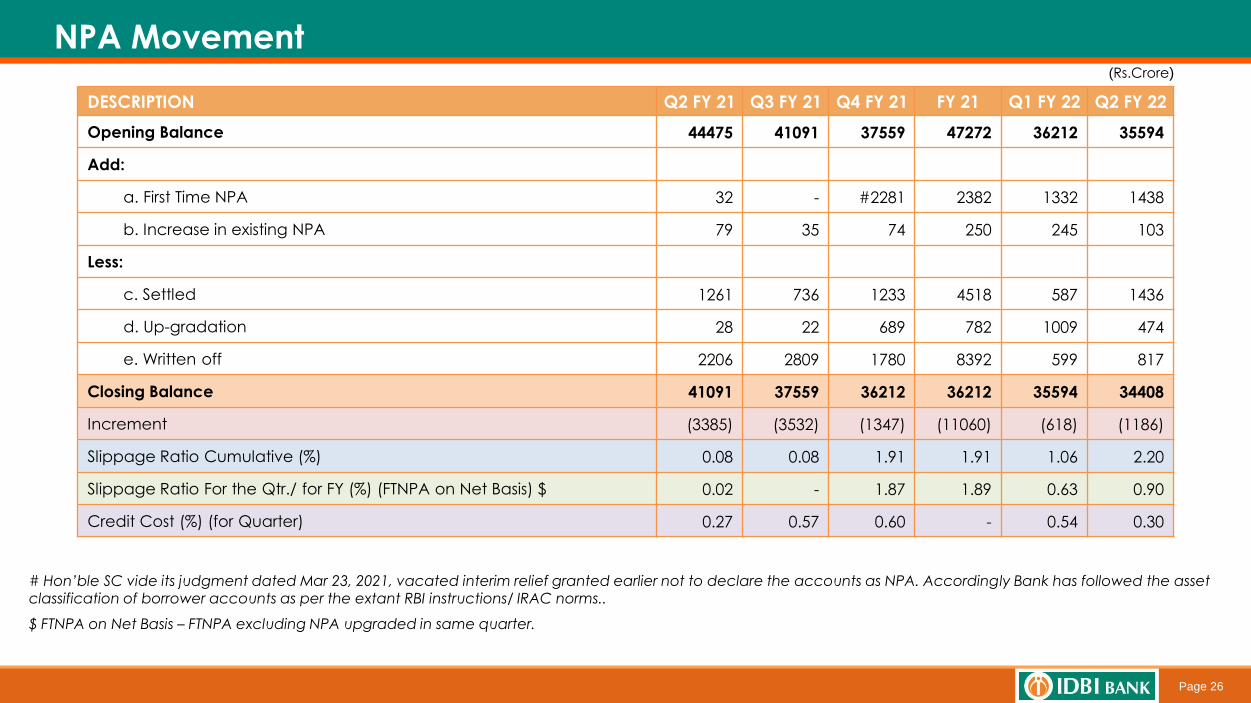
NPA Movement
DESCRIPTION Q2 FY 21 Q3 FY 21 Q4 FY 21 FY 21 Q1 FY 22 Q2 FY 22
Opening Balance 44475 41091 37559 47272 36212 35594
Add:
a. First Time NPA 32 - #2281 2382 1332 1438
b. Increase in existing NPA 79 35 74 250 245 103
Less:
c. Settled 1261 736 1233 4518 587 1436
d. Up-gradation 28 22 689 782 1009 474
e. Written off 2206 2809 1780 8392 599 817
Closing Balance 41091 37559 36212 36212 35594 34408
Increment (3385) (3532) (1347) (11060) (618) (1186)
Slippage Ratio Cumulative (%) 0.08 0.08 1.91 1.91 1.06 2.20
Slippage Ratio For the Qtr./ for FY (%) (FTNPA on Net Basis) $ 0.02 - 1.87 1.89 0.63 0.90
Credit Cost (%) (for Quarter) 0.27 0.57 0.60 - 0.54 0.30
(Rs.Crore)
# Hon’ble SC vide its judgment dated Mar 23, 2021, vacated interim relief granted earlier not to declare the accounts as NPA. Accordingly Bank has followed the asset classification of borrower accounts as per the extant RBI instructions/ IRAC norms..
$ FTNPA on Net Basis – FTNPA excluding NPA upgraded in same quarter.
Page 27
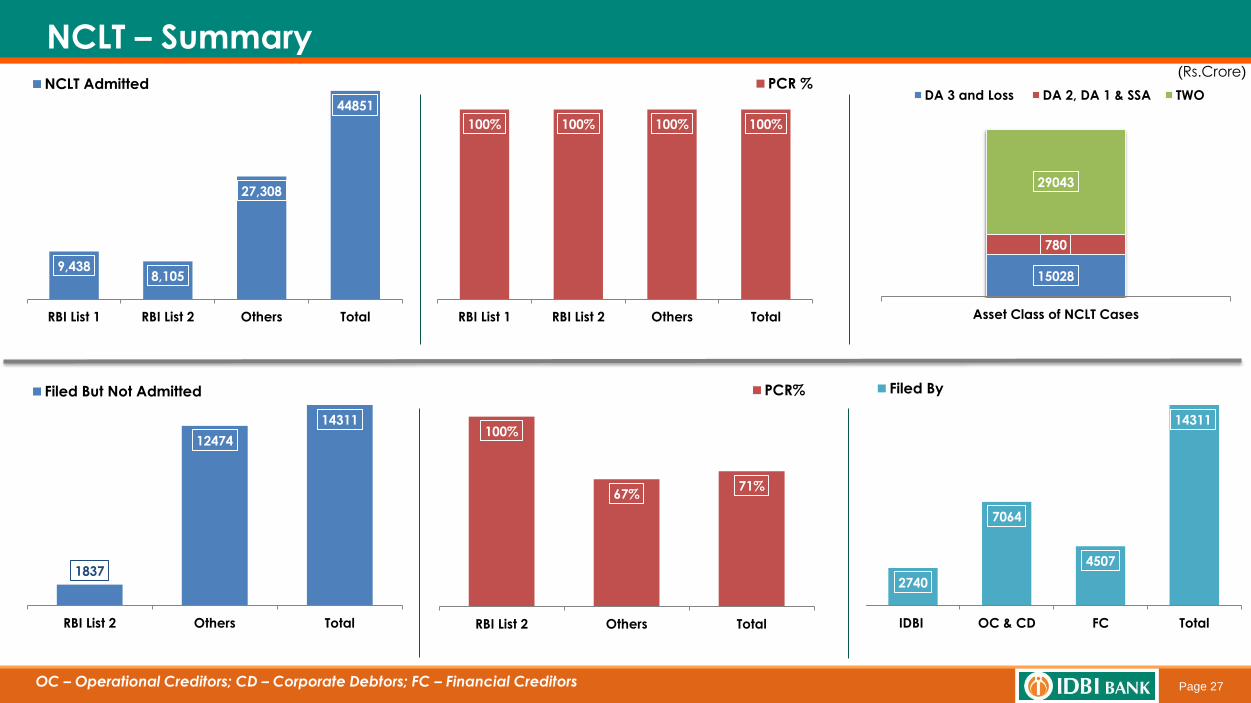
NCLT – Summary(Rs.Crore)
OC – Operational Creditors; CD – Corporate Debtors; FC – Financial Creditors
9,4388,105
27,308
44851
RBI List 1 RBI List 2 Others Total
NCLT Admitted
15028
780
29043
Asset Class of NCLT Cases
DA 3 and Loss DA 2, DA 1 & SSA TWO
1837
12474
14311
RBI List 2 Others Total
Filed But Not Admitted
2740
7064
4507
14311
IDBI OC & CD FC Total
Filed By
100% 100% 100% 100%
RBI List 1 RBI List 2 Others Total
PCR %
100%
67%71%
RBI List 2 Others Total
PCR%
Page 28
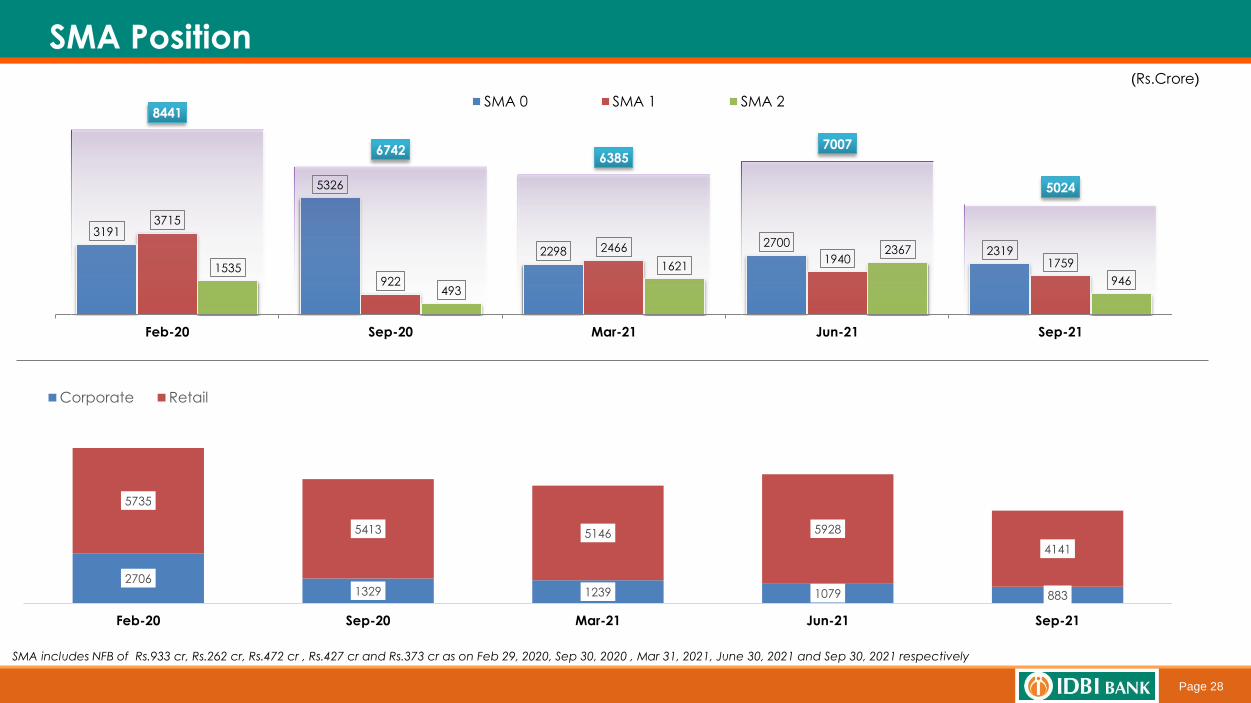
SMA Position (Rs.Crore)
SMA includes NFB of Rs.933 cr, Rs.262 cr, Rs.472 cr , Rs.427 cr and Rs.373 cr as on Feb 29, 2020, Sep 30, 2020 , Mar 31, 2021, June 30, 2021 and Sep 30, 2021 respectively
27061329 1239 1079 883
5735
5413 5146 5928
4141
Feb-20 Sep-20 Mar-21 Jun-21 Sep-21
Corporate Retail
3191
5326
22982700
2319
3715
922
24661940 17591535
493
1621
2367
946
8441
67426385
7007
5024
Feb-20 Sep-20 Mar-21 Jun-21 Sep-21
SMA 0 SMA 1 SMA 2

Page 29
Capital
Page 30
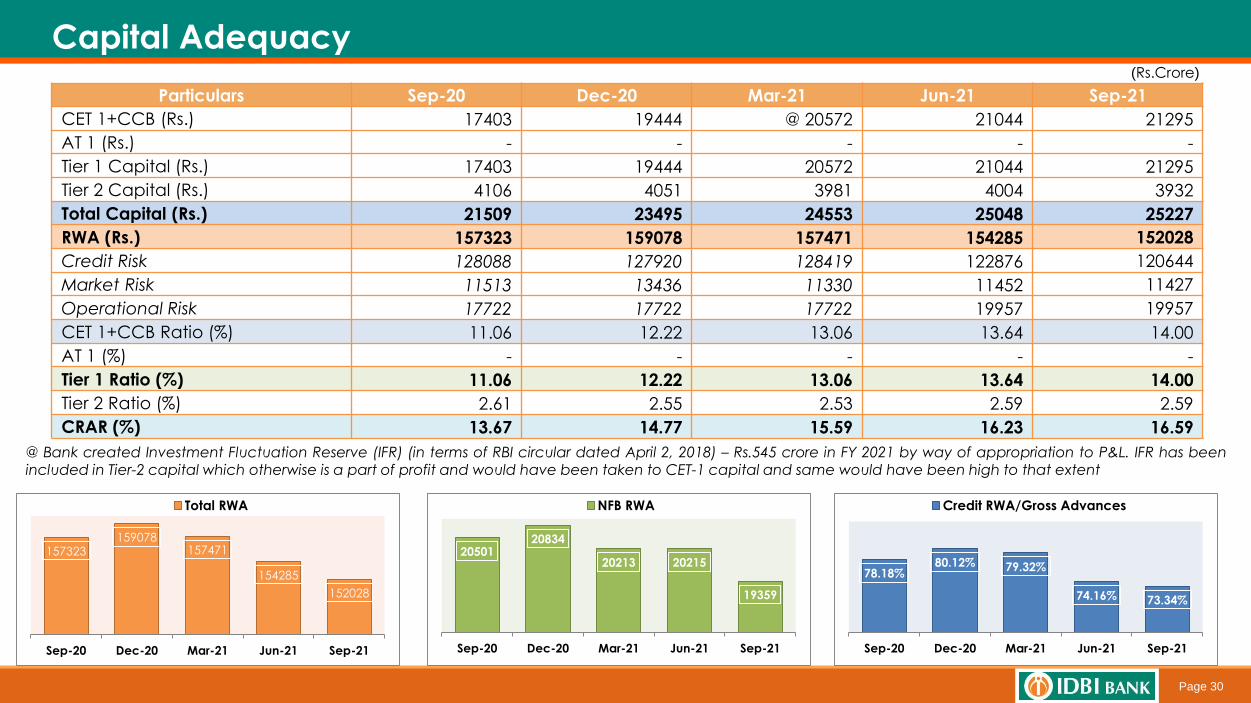
Capital Adequacy
Particulars Sep-20 Dec-20 Mar-21 Jun-21 Sep-21
CET 1+CCB (Rs.) 17403 19444 @ 20572 21044 21295
AT 1 (Rs.) - - - - -
Tier 1 Capital (Rs.) 17403 19444 20572 21044 21295
Tier 2 Capital (Rs.) 4106 4051 3981 4004 3932
Total Capital (Rs.) 21509 23495 24553 25048 25227
RWA (Rs.) 157323 159078 157471 154285 152028
Credit Risk 128088 127920 128419 122876 120644
Market Risk 11513 13436 11330 11452 11427
Operational Risk 17722 17722 17722 19957 19957
CET 1+CCB Ratio (%) 11.06 12.22 13.06 13.64 14.00
AT 1 (%) - - - - -
Tier 1 Ratio (%) 11.06 12.22 13.06 13.64 14.00
Tier 2 Ratio (%) 2.61 2.55 2.53 2.59 2.59
CRAR (%) 13.67 14.77 15.59 16.23 16.59
(Rs.Crore)
@ Bank created Investment Fluctuation Reserve (IFR) (in terms of RBI circular dated April 2, 2018) – Rs.545 crore in FY 2021 by way of appropriation to P&L. IFR has beenincluded in Tier-2 capital which otherwise is a part of profit and would have been taken to CET-1 capital and same would have been high to that extent
157323159078
157471
154285
152028
Sep-20 Dec-20 Mar-21 Jun-21 Sep-21
Total RWA
2050120834
20213 20215
19359
Sep-20 Dec-20 Mar-21 Jun-21 Sep-21
NFB RWA
78.18%80.12% 79.32%
74.16% 73.34%
Sep-20 Dec-20 Mar-21 Jun-21 Sep-21
Credit RWA/Gross Advances
Page 31
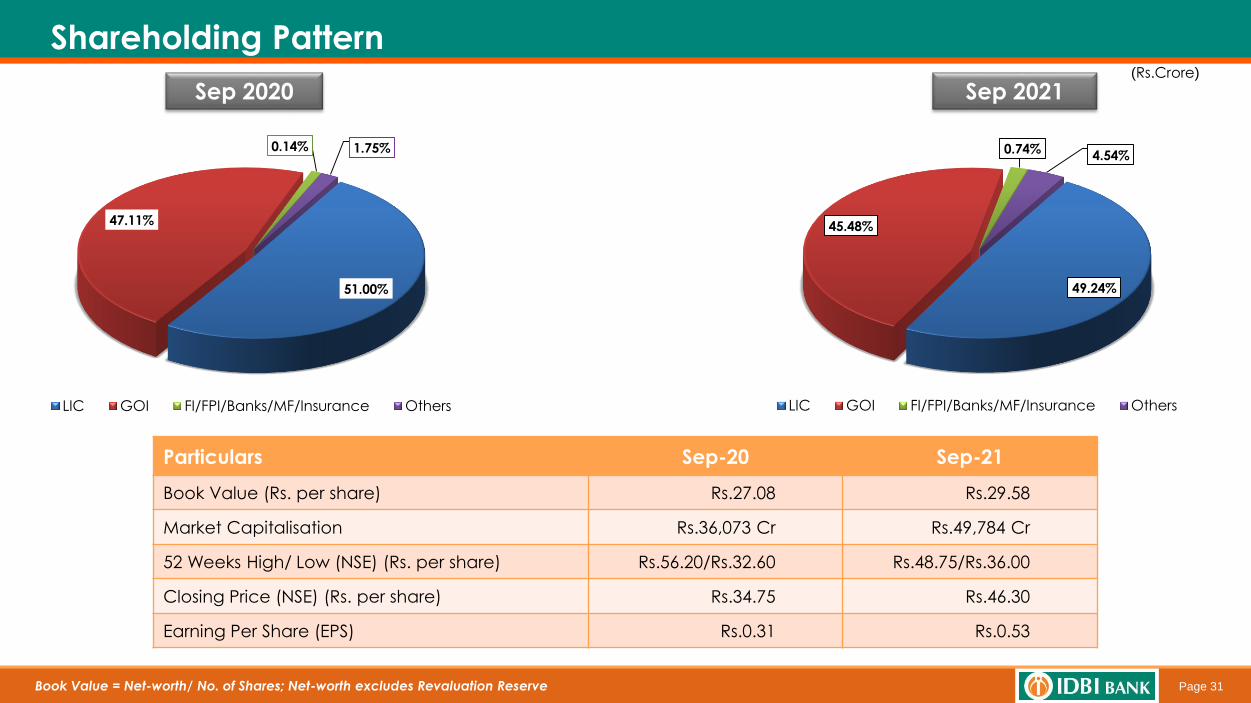
Shareholding Pattern
Sep 2020 Sep 2021
Particulars Sep-20 Sep-21
Book Value (Rs. per share) Rs.27.08 Rs.29.58
Market Capitalisation Rs.36,073 Cr Rs.49,784 Cr
52 Weeks High/ Low (NSE) (Rs. per share) Rs.56.20/Rs.32.60 Rs.48.75/Rs.36.00
Closing Price (NSE) (Rs. per share) Rs.34.75 Rs.46.30
Earning Per Share (EPS) Rs.0.31 Rs.0.53
(Rs.Crore)
51.00%
47.11%
0.14% 1.75%
LIC GOI FI/FPI/Banks/MF/Insurance Others
49.24%
45.48%
0.74%4.54%
LIC GOI FI/FPI/Banks/MF/Insurance Others
Book Value = Net-worth/ No. of Shares; Net-worth excludes Revaluation Reserve
Page 32
Digital Banking & Financial Inclusion
Page 33
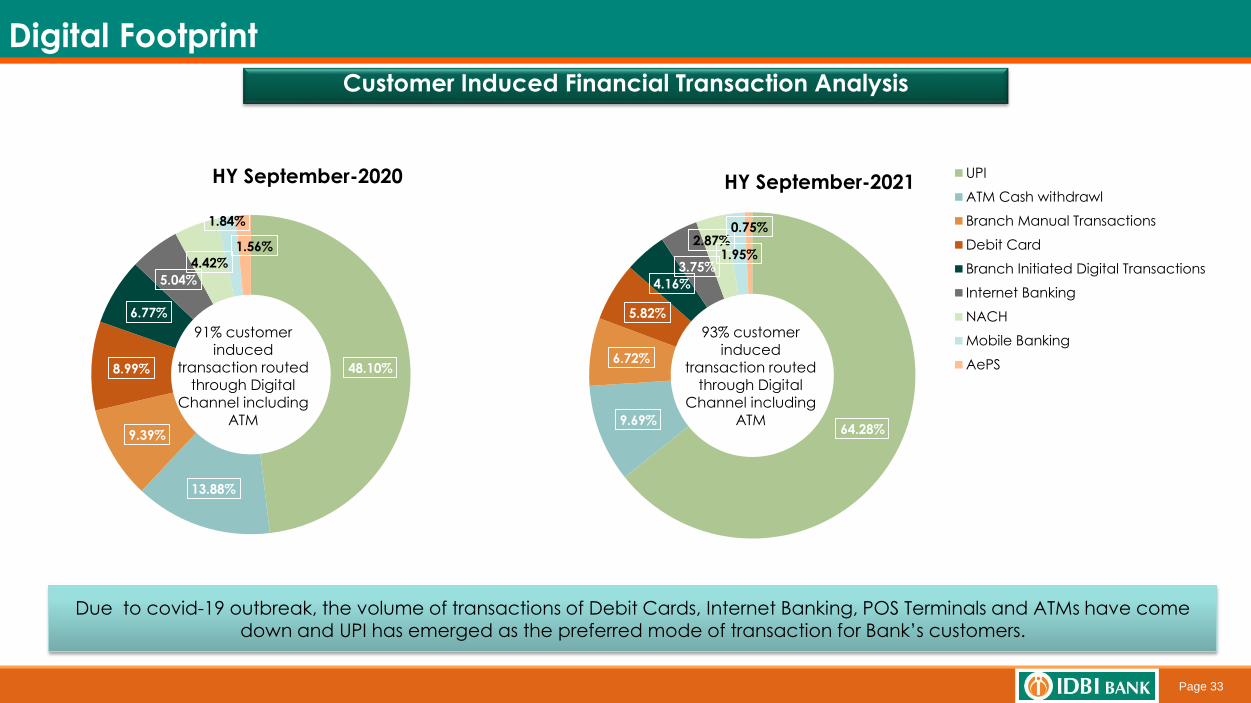
Digital Footprint
Customer Induced Financial Transaction Analysis
48.10%
13.88%
9.39%
8.99%
6.77%
5.04%
4.42%
1.84%
1.56%
HY September-2020
64.28%9.69%
6.72%
5.82%
4.16%
3.75%
2.87%1.95%
0.75%
HY September-2021UPI
ATM Cash withdrawl
Branch Manual Transactions
Debit Card
Branch Initiated Digital Transactions
Internet Banking
NACH
Mobile Banking
AePS
93% customer induced
transaction routed through Digital
Channel including ATM
91% customer induced
transaction routed through Digital
Channel including ATM
Due to covid-19 outbreak, the volume of transactions of Debit Cards, Internet Banking, POS Terminals and ATMs have come down and UPI has emerged as the preferred mode of transaction for Bank’s customers.
Page 34
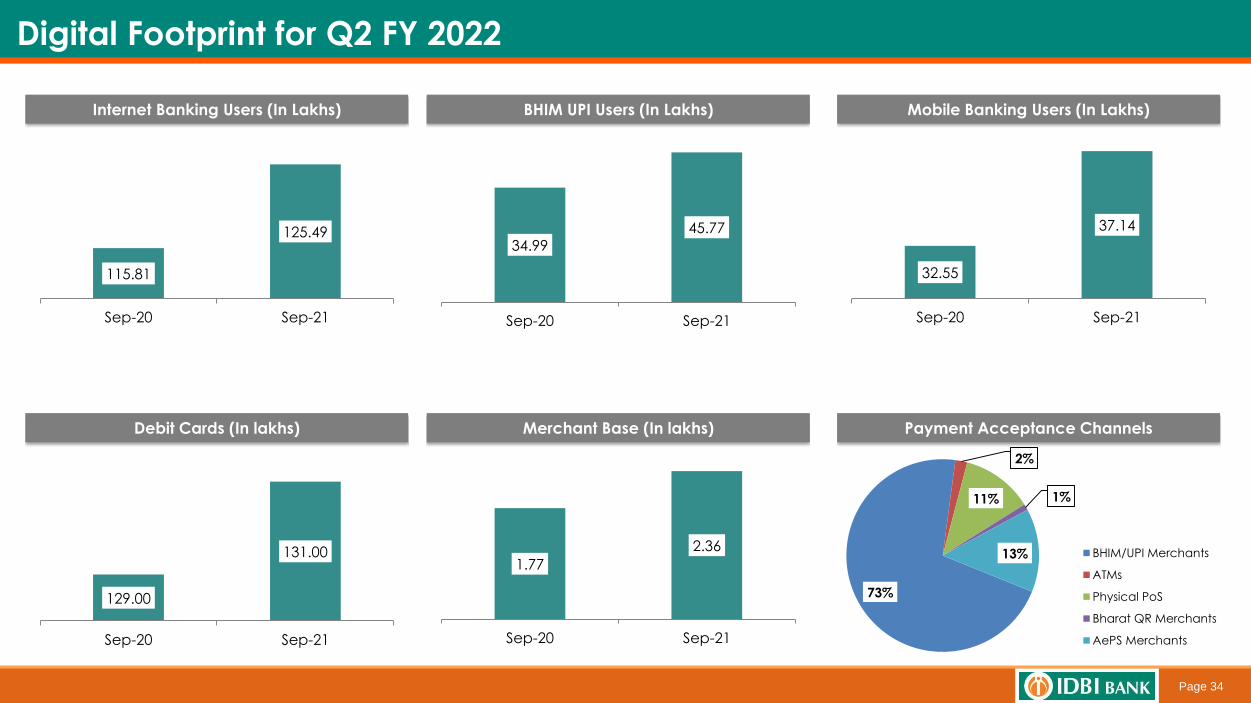
115.81
125.49
Sep-20 Sep-21
Internet Banking Users (In Lakhs)
129.00
131.00
Sep-20 Sep-21
Debit Cards (In lakhs)
Digital Footprint for Q2 FY 2022
73%
2%
11% 1%
13% BHIM/UPI Merchants
ATMs
Physical PoS
Bharat QR Merchants
AePS Merchants
Payment Acceptance Channels
34.99
45.77
Sep-20 Sep-21
BHIM UPI Users (In Lakhs)
32.55
37.14
Sep-20 Sep-21
Mobile Banking Users (In Lakhs)
1.77
2.36
Sep-20 Sep-21
Merchant Base (In lakhs)
Page 35
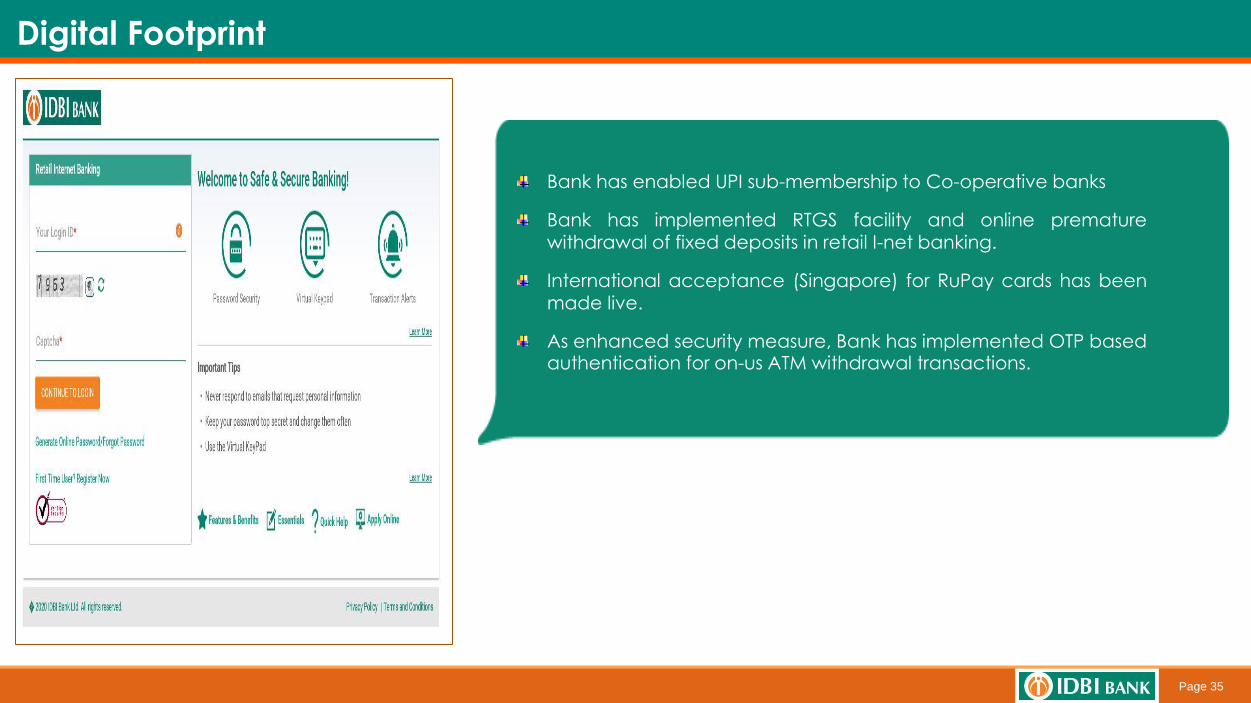
Bank has enabled UPI sub-membership to Co-operative banks
Bank has implemented RTGS facility and online prematurewithdrawal of fixed deposits in retail I-net banking.
International acceptance (Singapore) for RuPay cards has beenmade live.
As enhanced security measure, Bank has implemented OTP basedauthentication for on-us ATM withdrawal transactions.
Digital Footprint
Page 36
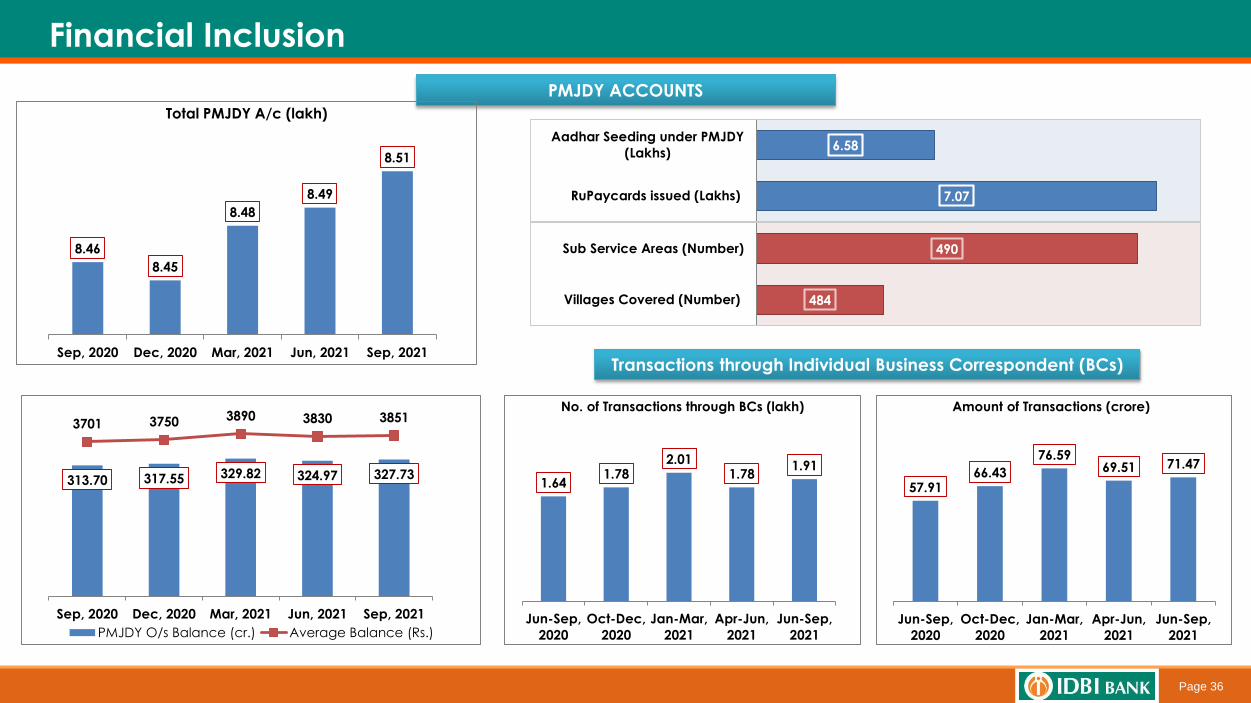
Financial Inclusion
PMJDY ACCOUNTS
Transactions through Individual Business Correspondent (BCs)
7.07
6.58
RuPaycards issued (Lakhs)
Aadhar Seeding under PMJDY
(Lakhs)
484
490
Villages Covered (Number)
Sub Service Areas (Number)8.46
8.45
8.48
8.49
8.51
Sep, 2020 Dec, 2020 Mar, 2021 Jun, 2021 Sep, 2021
Total PMJDY A/c (lakh)
313.70 317.55 329.82 324.97 327.73
3701 3750 3890 3830 3851
Sep, 2020 Dec, 2020 Mar, 2021 Jun, 2021 Sep, 2021
PMJDY O/s Balance (cr.) Average Balance (Rs.)
1.641.78
2.011.78
1.91
Jun-Sep,
2020
Oct-Dec,
2020
Jan-Mar,
2021
Apr-Jun,
2021
Jun-Sep,
2021
No. of Transactions through BCs (lakh)
57.9166.43
76.5969.51 71.47
Jun-Sep,
2020
Oct-Dec,
2020
Jan-Mar,
2021
Apr-Jun,
2021
Jun-Sep,
2021
Amount of Transactions (crore)
Page 37
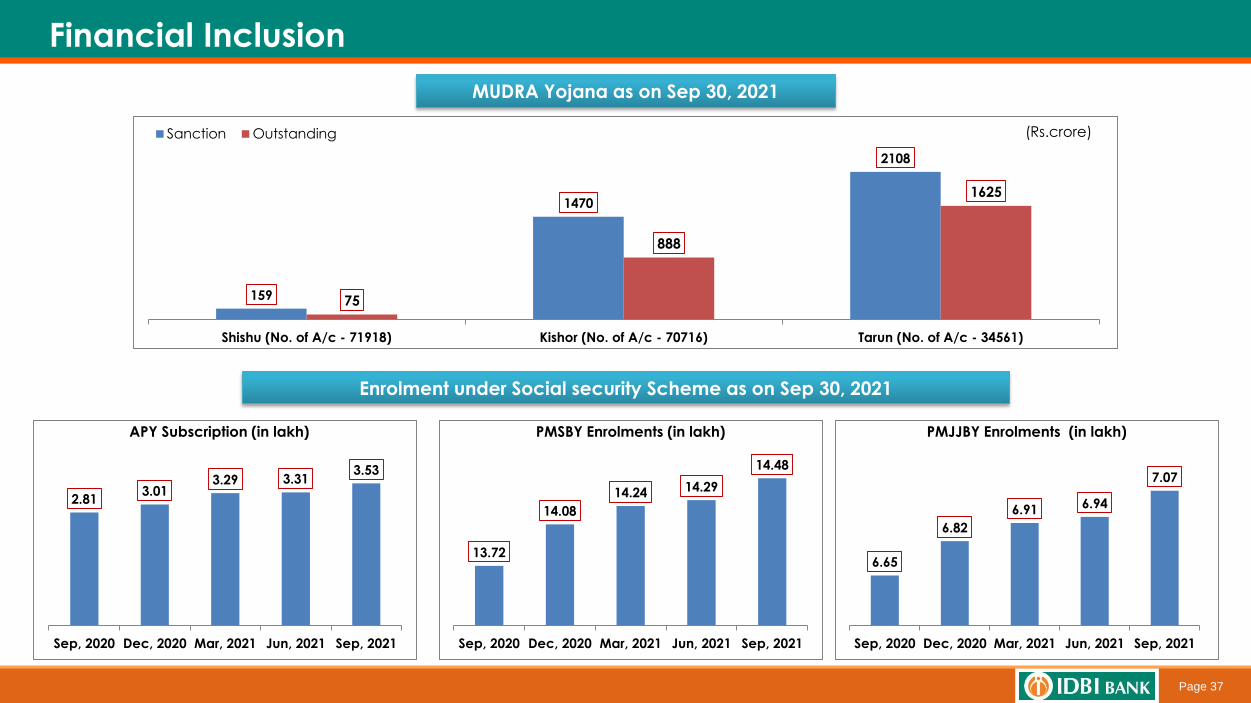
Financial Inclusion
Enrolment under Social security Scheme as on Sep 30, 2021
MUDRA Yojana as on Sep 30, 2021
(Rs.crore)
159
1470
2108
75
888
1625
Shishu (No. of A/c - 71918) Kishor (No. of A/c - 70716) Tarun (No. of A/c - 34561)
Sanction Outstanding
2.813.01
3.29 3.313.53
Sep, 2020 Dec, 2020 Mar, 2021 Jun, 2021 Sep, 2021
APY Subscription (in lakh)
13.72
14.08
14.24 14.29
14.48
Sep, 2020 Dec, 2020 Mar, 2021 Jun, 2021 Sep, 2021
PMSBY Enrolments (in lakh)
6.65
6.82
6.91 6.94
7.07
Sep, 2020 Dec, 2020 Mar, 2021 Jun, 2021 Sep, 2021
PMJJBY Enrolments (in lakh)
Page 38
Subsidiaries
Page 39
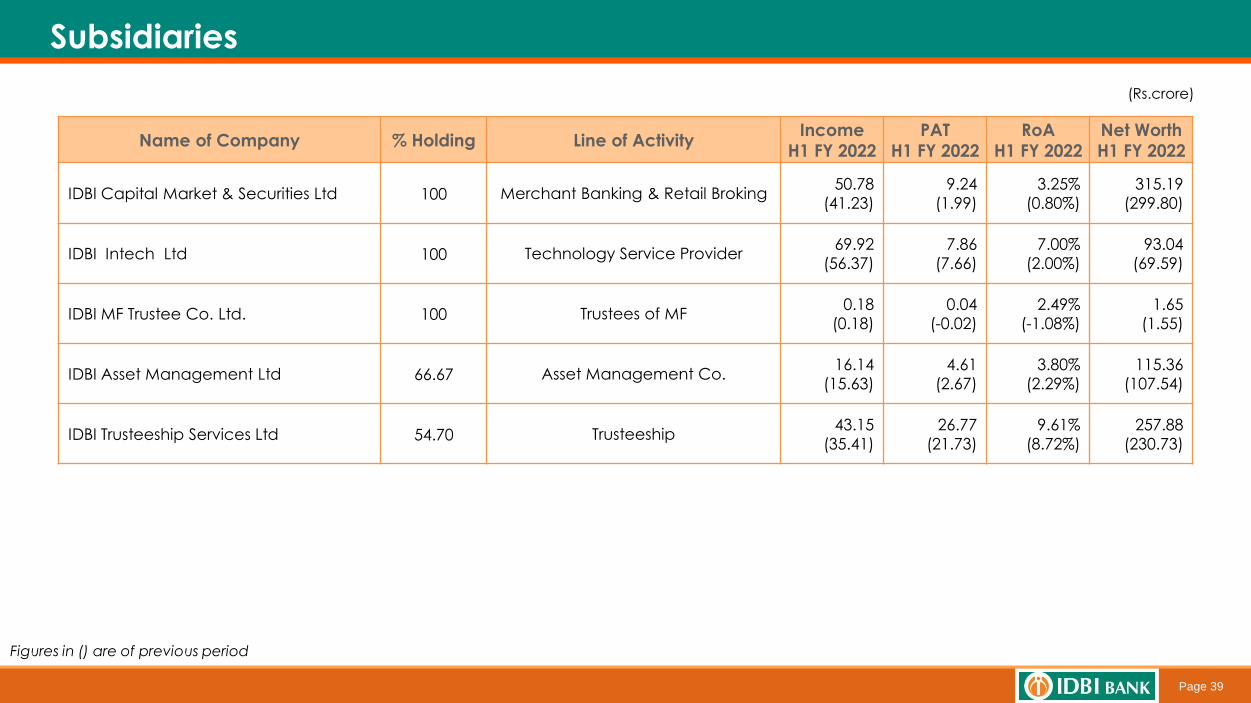
Subsidiaries
Name of Company % Holding Line of ActivityIncome
H1 FY 2022
PAT
H1 FY 2022
RoA
H1 FY 2022
Net Worth
H1 FY 2022
IDBI Capital Market & Securities Ltd 100 Merchant Banking & Retail Broking50.78
(41.23)
9.24
(1.99)
3.25%
(0.80%)
315.19
(299.80)
IDBI Intech Ltd 100 Technology Service Provider69.92
(56.37)
7.86
(7.66)
7.00%
(2.00%)
93.04
(69.59)
IDBI MF Trustee Co. Ltd. 100 Trustees of MF0.18
(0.18)
0.04
(-0.02)
2.49%
(-1.08%)
1.65
(1.55)
IDBI Asset Management Ltd 66.67 Asset Management Co.16.14
(15.63)
4.61
(2.67)
3.80%
(2.29%)
115.36
(107.54)
IDBI Trusteeship Services Ltd 54.70 Trusteeship 43.15
(35.41)
26.77
(21.73)
9.61%
(8.72%)
257.88
(230.73)
(Rs.crore)
Figures in () are of previous period

Page 40
Way Forward
Page 41
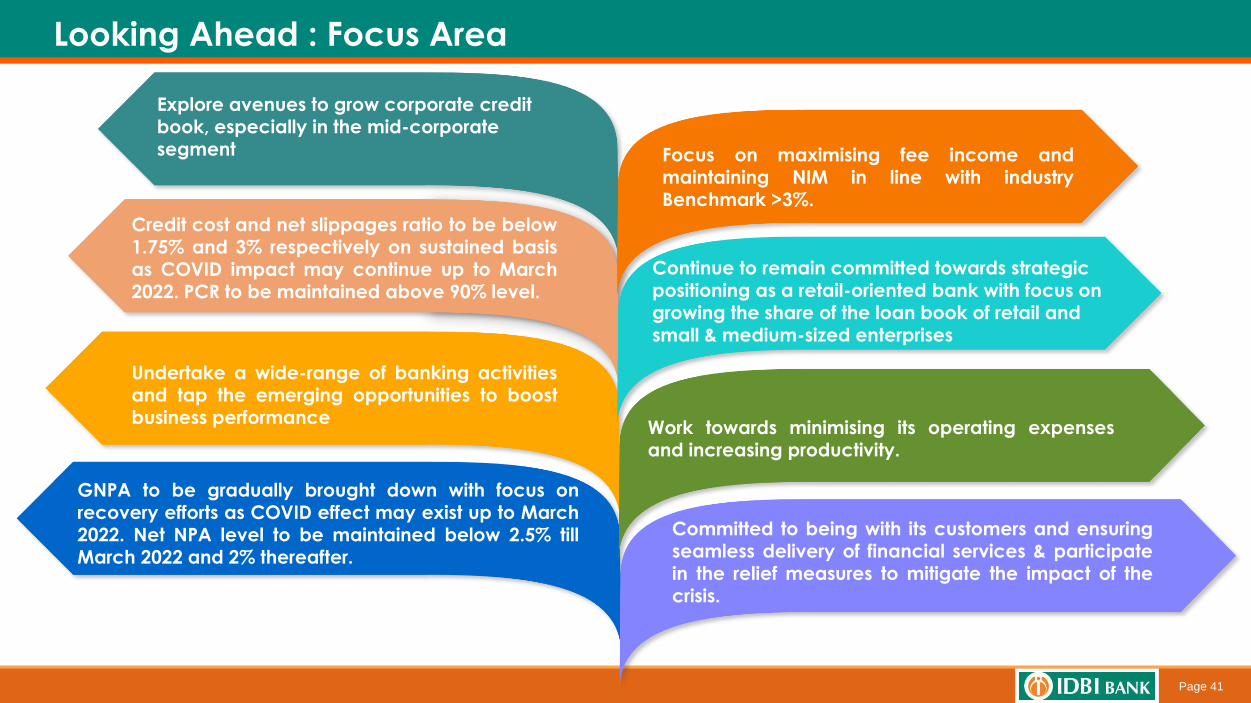
Looking Ahead : Focus Area
Focus on maximising fee income and
maintaining NIM in line with industryBenchmark >3%.
Credit cost and net slippages ratio to be below1.75% and 3% respectively on sustained basisas COVID impact may continue up to March2022. PCR to be maintained above 90% level.
GNPA to be gradually brought down with focus onrecovery efforts as COVID effect may exist up to March2022. Net NPA level to be maintained below 2.5% tillMarch 2022 and 2% thereafter.
Explore avenues to grow corporate credit book, especially in the mid-corporate segment
Undertake a wide-range of banking activitiesand tap the emerging opportunities to boostbusiness performance
Continue to remain committed towards strategic positioning as a retail-oriented bank with focus on growing the share of the loan book of retail and small & medium-sized enterprises
Work towards minimising its operating expensesand increasing productivity.
Committed to being with its customers and ensuringseamless delivery of financial services & participatein the relief measures to mitigate the impact of thecrisis.
Page 42