Preload Monitoring of Bolted L-Shaped Lap Joints Using ...
19
Du, F., Xu, C., Wu, G., & Zhang, J. (2018). Preload monitoring of bolted L- shaped lap joints using virtual time reversal method. Sensors, 18(6), [1928]. https://doi.org/10.3390/s18061928, https://doi.org/10.3390/s18061928 Publisher's PDF, also known as Version of record License (if available): CC BY Link to published version (if available): 10.3390/s18061928 10.3390/s18061928 Link to publication record in Explore Bristol Research PDF-document This is the final published version of the article (version of record). It first appeared online via MDPI at https://doi.org/10.3390/s18061928 . Please refer to any applicable terms of use of the publisher. University of Bristol - Explore Bristol Research General rights This document is made available in accordance with publisher policies. Please cite only the published version using the reference above. Full terms of use are available: http://www.bristol.ac.uk/pure/about/ebr-terms
Transcript of Preload Monitoring of Bolted L-Shaped Lap Joints Using ...

Du, F., Xu, C., Wu, G., & Zhang, J. (2018). Preload monitoring of bolted L-shaped lap joints using virtual time reversal method. Sensors, 18(6), [1928].https://doi.org/10.3390/s18061928, https://doi.org/10.3390/s18061928
Publisher's PDF, also known as Version of record
License (if available):CC BY
Link to published version (if available):10.3390/s1806192810.3390/s18061928
Link to publication record in Explore Bristol ResearchPDF-document
This is the final published version of the article (version of record). It first appeared online via MDPI athttps://doi.org/10.3390/s18061928 . Please refer to any applicable terms of use of the publisher.
University of Bristol - Explore Bristol ResearchGeneral rights
This document is made available in accordance with publisher policies. Please cite only the publishedversion using the reference above. Full terms of use are available:http://www.bristol.ac.uk/pure/about/ebr-terms

sensors
Article
Preload Monitoring of Bolted L-Shaped Lap JointsUsing Virtual Time Reversal Method
Fei Du 1 ID , Chao Xu 1,* ID , Guannan Wu 1,2 and Jie Zhang 3 ID
1 School of Astronautics, Northwestern Polytechnical University, Xi’an 710072, China;[email protected] (F.D.); [email protected] (G.W.)
2 Mechanical Engineering Department, University of Maryland Baltimore County, Baltimore, MD 21250, USA3 Department of Mechanical Engineering, University of Bristol, Bristol BS81TR, UK; [email protected]* Correspondence: [email protected]; Tel.: +86-029-8849-3620
Received: 1 May 2018; Accepted: 12 June 2018; Published: 13 June 2018�����������������
Abstract: L-shaped bolt lap joints are commonly used in aerospace and civil structures. However,bolt joints are frequently subjected to loosening, and this has a significant effect on the safety andreliability of these structures. Therefore, bolt preload monitoring is very important, especially at theearly stage of loosening. In this paper, a virtual time reversal guided wave method is presented tomonitor preload of bolted L-shaped lap joints accurately and simply. In this method, a referencedreemitting signal (RRS) is extracted from the bolted structure in fully tightened condition. Then theRRS is utilized as the excitation signal for the bolted structure in loosening states, and the normalizedpeak amplitude of refocused wave packet is used as the tightness index (TIA). The proposedmethod is experimentally validated by L-shaped bolt joints with single and multiple bolts. Moreover,the selections of guided wave frequency and tightness index are also discussed. The resultsdemonstrate that the relationship between TIA and bolt preload is linear. The detection sensitivity isimproved significantly compared with time reversal (TR) method, particularly when bolt looseningis at its embryo stage. The results also show that TR method is an effective method for detection ofthe number of loosening bolts.
Keywords: bolt preload monitoring; bolt joints; time reversal; structural health monitoring;guided wave
1. Introduction
Bolted joints are widely used in engineering structures such as aerospace and civil structuresbecause of their ease of assembly and high load carrying capacity. However, bolts are frequentlysubjected to loosening due to inappropriate preloads during installation, time varying external loadsduring service, or other environment factors [1]. Bolts loosening may lead to the failure of entirestructure. Therefore, it is critical to monitor bolt preload at an early stage to ensure the safety andreliability of structures [2]. Structural heath monitoring (SHM) techniques enable effective monitoringof bolt preload [3]. Impedance and guided wave-based damage detection techniques have been widelyused for SHM [4]. Electromechanical impedance (EMI) is sensitive to minor changes in the bolt preload.Perera et al. [5] developed a flexible wireless smart sensor framework based on the EMI method,and the system was successfully used for loosening bolt detection. However, the detection area ofEMI is limited to the near field of the piezoelectric active sensor [6]. Therefore, guided wave-basedSHM techniques have received much interest for bolt preload monitoring, due to their sensitivity tosmall structural damages and large sensing range [7]. In addition, integrated impedance and guidedwave method was also developed by utilizing impedance and guided wave signals simultaneously toenhance the performance of damage diagnosis [4].
Sensors 2018, 18, 1928; doi:10.3390/s18061928 www.mdpi.com/journal/sensors

Sensors 2018, 18, 1928 2 of 18
Because ultrasonic wave transmission is strongly tied to contact status of bolted interface, waveenergy dissipation (WED) related methods have been widely studied. To detect fastener integrity inthermal protection panels in space vehicles, Yang and Chang [8] used attenuation energy and speed ofguided wave transmitted across jointed interface to assess bolt torque levels and locations of looseningbolt. Their theoretical analysis based on Hertz contact theory and sinusoidal wavy surface modelshows that the energy of transmitted guided wave is proportional to the true contact area of jointedinterface which mainly depends on bolt preload. Subsequently, Wang et al. [9] used the wave energypropagated across bolted lap joint to monitor bolt preload. However, the energy did not changewith bolt torque when the applied torque reaches a certain value, and this is referred to as saturationphenomenon. Similarly, Amerini and Meo [10] calculated the energy of the transmitted guided wavein frequency domain to assess the tightening state of a bolt lap joint. Yang et al. [11] extended theWED method to composite bolted joints. With a scanning laser ultrasound system, Haynes et al. [12]acquired the full-field wave data and calculated the wave energy before and after the lap joint formonitoring bolt torque levels. Unfortunately, saturation phenomena were also observed in all the aboveexperimental studies. On the other hand, due to multi-mode, dispersion, and boundary-reflection ofguided waves [13], the response signal at a joint structure is quite complex [10]. Hence, Kedra et al. [14]investigated the effects of excitation frequency, time range of received signal, sensor positions on thepreload detection accuracy of the WED method. They pointed out that these parameters must becarefully selected.
Apart from energy or amplitude of the guided wave, phase shift has also been used for quantifyingbolt torques. Zagrai, et al. [15] estimated bolt torques by measuring delays of guided wave transmittedacross bolt joint. Their experimental results demonstrated that bolt torque is proportional to phaseshift of the guided waves. Subsequently, Doyle et al. [16,17] further studied phase shift of guided wavepropagating in a complex panel using piezoelectric sensors sparsely distributed. The results show thatthe time at which phase shift occurs is related to the distance between the location of loosening boltand primary wave propagation path. However, changes of the phase shift induced by a bolted jointare rather small and require sensitive equipment with advanced signal processing capabilities [16].In addition, because received guided waves are very complex, it is difficult to select correct timewindow and the corresponding wave speed to calculate phase shift and the distance between wavepath and damage.
Since guided wave signals are always very complex, Fink et al. [18] extended time reversal methodto guided wave monitoring technique. In time reversal approach, a received signal is reversed andreemitted as an excitation signal, then a reconstruction of the input signal can be obtained at thesource position. Hence, time reversal method can effectively reduce the influences of dispersion andmulti-modal of guided wave. Watkins and Jha [19] adjusted the above time reversal steps, the newprocedure requires one transducer to actuate signals and the other transducer acts as a sensor forall signal paths. This method yields identical signals as the original time reversal method and ismore convenient. As the time reversal procedure is still complicated, Cai et al. [20] presented avirtual time reversal method and the time reversal procedure was replaced by signal operations.The transfer function in the virtual time reversal method was obtained by taking the derivative of thestep pulse responses of a structure. Time reversal-based guided wave monitoring techniques havebeen widely applied to damage detection for metallic plates [21,22] and composite plates [19,23,24].Recently, Parvasi et al. [25] proposed to use time reversal (TR) method to focus guided wave energytransmitted through bolt joint, and then used the refocused amplitude peak as tightness index forpreload detection. The authors also simulated the proposed detection method by a finite elementmodel considering roughness of contact surfaces. Both numerical and experimental results showthat the proposed tightness index increase with bolt torque. However, when the bolt torque isrelatively high, the focused signal peak amplitude changes very slightly. Meanwhile, Wang et al. [26]experimentally investigated the TR guided wave method for bolted preload detection. The results
Sensors 2018, 18, 1928 3 of 18
demonstrate that as the surface roughness of the bolted interface increases, the saturation phenomenonbecomes insignificant.
The applications of the above bolt preload detection methods were limited to flat bolt lap joint.However, L-shaped bolt joints are more common in real structures [27,28]. As the structure ofL-shaped bolt joints are more complicated, complex signal processing methods are always needed.Jalalpour et al. [27] proposed a preload monitoring method for a single 90◦ bolted joint. Fast Fouriertransform, cross-correlation and fuzzy pattern recognition were used to process transmitted waves.However, the fuzzy sets of torque level are limited, and the signal processing procedure iscomplicated. Montoya et al. [29] assessed rigidity of L-shaped bolt joint using transmitted wave energy.Then, Montoya et al. [30] further extended the method to bolt loosening and preload monitoringof satellite panels jointed by right angle bracket. Their experimental results display that somemeasurement parameters, such as the time window of received signal, have a significant effect onsensitivity and repeatability of the measurement [30]. In addition, the measurement method is still notvery sensitive at the early stage of bolt loosening.
From the above literature review, it can be found that many research efforts have dedicated tobolt preload monitoring. However, the detection sensitivity of guided wave-based techniques is stillnot good, especially at the early stage of bolt loosening. On the other hand, the current studies mainlyfocused on flat jointed structures with single bolt, complex bolt jointed structures such as L-shaped boltlap joints with multiple bolts have not been fully studied. Motivated by Ref. [20], a simple virtual timereversal (VTR) method is developed for accurate bolt preload monitoring in this paper. In this method,a referenced reemitting signal (RRS) is extracted from the bolted structure in fully tightened condition(healthy state). Then the RRS is utilized as the excitation signal for the bolted structure in looseningstates (unhealthy states), and the normalized peak amplitude of the received focus wave packet is usedas the tightness index (TIA). The proposed method is experimentally validated by L-shaped bolt jointswith single and multiple bolts and is compared with TR guided wave method. This paper is organizedas follows. Section 2 presents the proposed VTR and its theoretical backgrounds. Then, the experimentsetup and steps are shown in Section 3. Section 4 compares the preload detection results of theproposed VTR method and TR method. The selections of measurement frequency and tightness indexare discussed in Section 5. Finally, conclusions are summarized in Section 6.
2. A Virtual Time Reversal Method
2.1. The Time Reversal Guided Wave Method
The original time reversal (TR) guided wave method has been used for bolt preload detection.The TR procedure for bolt jointed plates can be divided into four steps, which is shown in Figure 1.Step 1, a tone burst input e(t) is applied to transducer A, which activates wave propagation in theplate; Step 2, a wave response signal u(t) is captured by transducer B; Step 3, the recorded signal u(t) isreversed in time domain and is reemitted using transducer B; Step 4, a guided wave signal is capturedby transducer A again, and the original signal is reconstructed [31]. Since the peak amplitude of thereconstructed wave packet can be used for the preload estimation [25]. Therefore, a tightness index(TIA) is defined using the following equation:
TIA =vup
vhp(1)
where vup is the peak amplitude of the reconstructed signal obtained from an unhealthy state, vhpis the peak amplitude of the reconstructed signal obtained from the healthy state. In this way,the reconstructed signal peaks can be normalized for preload estimation.

Sensors 2018, 18, 1928 4 of 18
Figure 1. The procedure of the preload monitoring of a bolt lap joint using TR method.
Usually, PZT transducers are used for both stimulating and capture guided waves. Therefore,while a tone pulse input is emitted from PZT A, the response signal at the sensor PZT B can beexpressed as the following equation [23]:
VB(ω) = VA(ω)G(ω) (2)
where VA(ω), VB(ω), and G(ω) are the input signal at PZT A, received signal at PZT B and structuretransfer function for the given wave propagation path. In step 3, the time reversed signal can bewritten as
V∗B (ω) = V∗A(ω)G∗(ω) (3)
where the superscript * denotes the complex conjugate operation. The transfer function from PZT A toPZT B is assumed to be the same from B to A [31]. Hence, after this time reversal signal is reemittedfrom PZT B to A, the reconstructed signal received at PZT A is
Vrc(ω) = V∗A(ω)G∗(ω)G(ω) (4)
where G*(ω)G(ω) is refer to as time reversal operator. Therefore, the phase-delay factor in the timereversal operator is removed. For a single mode wave, the transducer function can be expressed as [32]
G(ω) = A(ω)e−ik(ω)r (5)
where i, k(ω) and r are imaginary unite, wavenumber of the mode and wave propagation distancebetween A and B. Hence, Equation (4) can be written as
Vrc(ω) = V∗A(ω)|A(ω)|2 (6)
It can be found that the shape of the reconstructed signal is the same as that of the time reversedoriginal signal when the transfer function is independent of frequency. Transfer function is frequencydependent [33], so a narrowband input signal is usually used to enhance time reversal progress [23].
The transfer function G(ω) is corresponding to the impulse response function in time domain.For a bolt jointed structure shown in Figure 1, the transmitted wave energy between the two PZTsensors is proportional to the true contact area of the interface [8]. Hence, as the bolt preload increase,the energy of the impulse response increases and the amplitude of the corresponding G(ω) increases.Accordingly, the reconstructed signal peak obtained by the time reversal method increase at the same
Sensors 2018, 18, 1928 5 of 18
time. Thereby, time reversal method can be used for bolt preload monitoring [25,26]. However, dueto the saturation of true contact area at high bolt preload [25,26], the TR method lost its detectionsensitivity, especially at relative high bolt preload cases.
2.2. A Virtual Time Reversal Method for Bolt Preload Monitoring
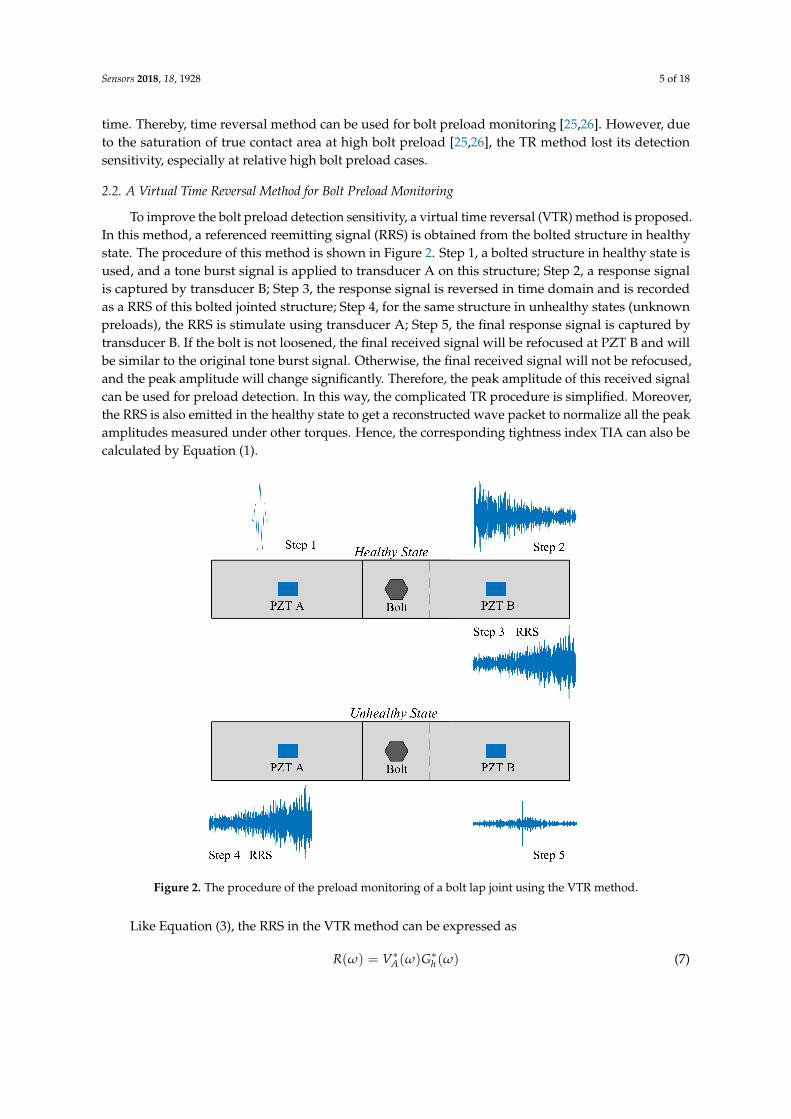
To improve the bolt preload detection sensitivity, a virtual time reversal (VTR) method is proposed.In this method, a referenced reemitting signal (RRS) is obtained from the bolted structure in healthystate. The procedure of this method is shown in Figure 2. Step 1, a bolted structure in healthy state isused, and a tone burst signal is applied to transducer A on this structure; Step 2, a response signalis captured by transducer B; Step 3, the response signal is reversed in time domain and is recordedas a RRS of this bolted jointed structure; Step 4, for the same structure in unhealthy states (unknownpreloads), the RRS is stimulate using transducer A; Step 5, the final response signal is captured bytransducer B. If the bolt is not loosened, the final received signal will be refocused at PZT B and willbe similar to the original tone burst signal. Otherwise, the final received signal will not be refocused,and the peak amplitude will change significantly. Therefore, the peak amplitude of this received signalcan be used for preload detection. In this way, the complicated TR procedure is simplified. Moreover,the RRS is also emitted in the healthy state to get a reconstructed wave packet to normalize all the peakamplitudes measured under other torques. Hence, the corresponding tightness index TIA can also becalculated by Equation (1).
Figure 2. The procedure of the preload monitoring of a bolt lap joint using the VTR method.
Like Equation (3), the RRS in the VTR method can be expressed as
R(ω) = V∗A(ω)G∗h(ω) (7)
Sensors 2018, 18, 1928 6 of 18
where Gh(ω) is the transfer function of the healthy state for the given path. The transfer functionchanges due to the change of bolt preload. Hence, the final received signal in step 5 is
Vrm(ω) = V∗A(ω)G∗h(ω)Guh(ω) (8)
where Guh(ω) is the transfer function of the unhealthy state, and G*h(ω)Guh(ω) is time reversal operator
in VTR.Compared with the Gh(ω), not only the amplitude of Guh(ω) becomes smaller, the phase of Guh(ω)
also changes due to the change of the bolt preload. Hence, the phase-delay factor in the time reversaloperator is not completely removed. For this VTR method, the bolt preload not only affects theamplitude of wave packets, but also the refocusing effectiveness. Consequently, the measurementsensitivity can be improved.
3. Experimental Setup and Procedure
3.1. Experimental Setup and Specimens
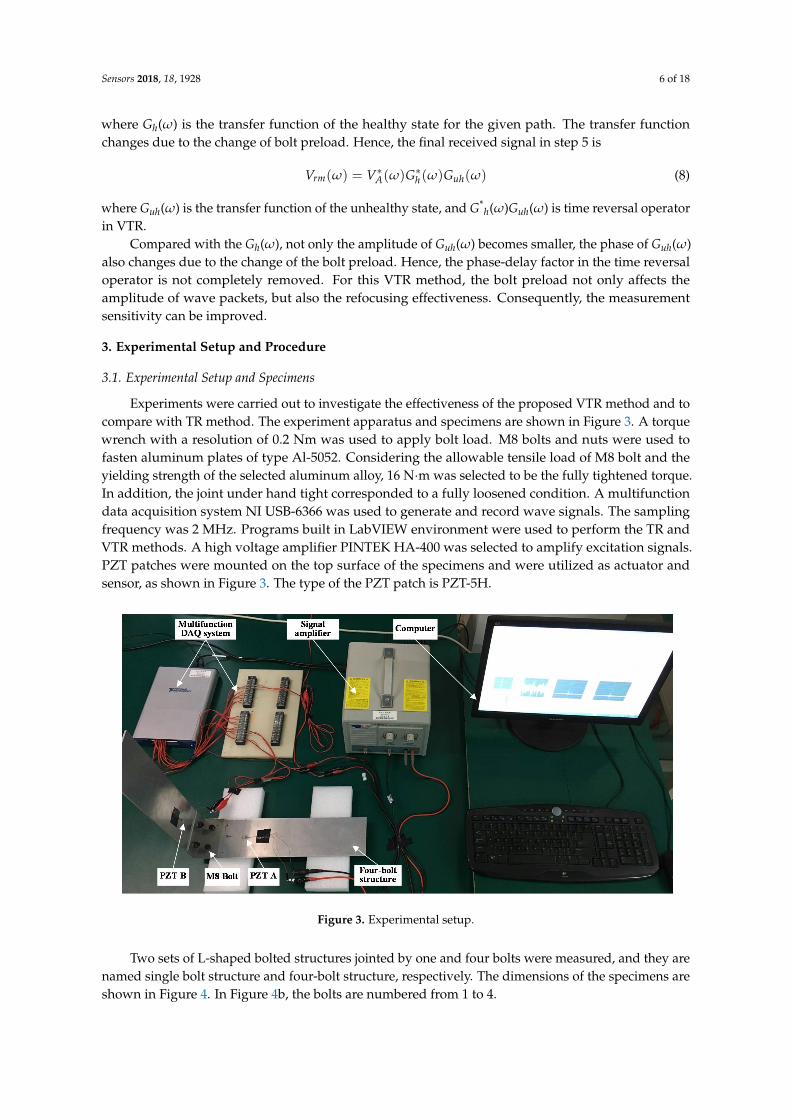
Experiments were carried out to investigate the effectiveness of the proposed VTR method and tocompare with TR method. The experiment apparatus and specimens are shown in Figure 3. A torquewrench with a resolution of 0.2 Nm was used to apply bolt load. M8 bolts and nuts were used tofasten aluminum plates of type Al-5052. Considering the allowable tensile load of M8 bolt and theyielding strength of the selected aluminum alloy, 16 N·m was selected to be the fully tightened torque.In addition, the joint under hand tight corresponded to a fully loosened condition. A multifunctiondata acquisition system NI USB-6366 was used to generate and record wave signals. The samplingfrequency was 2 MHz. Programs built in LabVIEW environment were used to perform the TR andVTR methods. A high voltage amplifier PINTEK HA-400 was selected to amplify excitation signals.PZT patches were mounted on the top surface of the specimens and were utilized as actuator andsensor, as shown in Figure 3. The type of the PZT patch is PZT-5H.
Figure 3. Experimental setup.
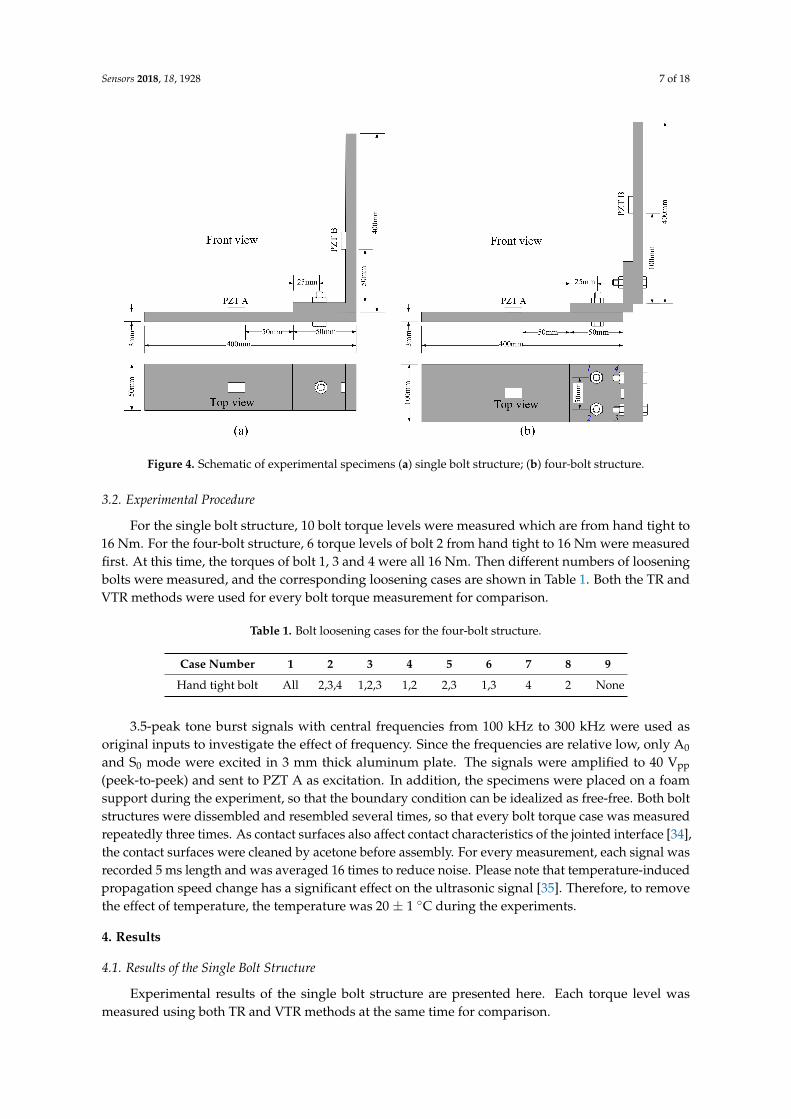
Two sets of L-shaped bolted structures jointed by one and four bolts were measured, and they arenamed single bolt structure and four-bolt structure, respectively. The dimensions of the specimens areshown in Figure 4. In Figure 4b, the bolts are numbered from 1 to 4.
Sensors 2018, 18, 1928 7 of 18
Figure 4. Schematic of experimental specimens (a) single bolt structure; (b) four-bolt structure.
3.2. Experimental Procedure
For the single bolt structure, 10 bolt torque levels were measured which are from hand tight to16 Nm. For the four-bolt structure, 6 torque levels of bolt 2 from hand tight to 16 Nm were measuredfirst. At this time, the torques of bolt 1, 3 and 4 were all 16 Nm. Then different numbers of looseningbolts were measured, and the corresponding loosening cases are shown in Table 1. Both the TR andVTR methods were used for every bolt torque measurement for comparison.
Table 1. Bolt loosening cases for the four-bolt structure.
Case Number 1 2 3 4 5 6 7 8 9
Hand tight bolt All 2,3,4 1,2,3 1,2 2,3 1,3 4 2 None
3.5-peak tone burst signals with central frequencies from 100 kHz to 300 kHz were used asoriginal inputs to investigate the effect of frequency. Since the frequencies are relative low, only A0
and S0 mode were excited in 3 mm thick aluminum plate. The signals were amplified to 40 Vpp
(peek-to-peek) and sent to PZT A as excitation. In addition, the specimens were placed on a foamsupport during the experiment, so that the boundary condition can be idealized as free-free. Both boltstructures were dissembled and resembled several times, so that every bolt torque case was measuredrepeatedly three times. As contact surfaces also affect contact characteristics of the jointed interface [34],the contact surfaces were cleaned by acetone before assembly. For every measurement, each signal wasrecorded 5 ms length and was averaged 16 times to reduce noise. Please note that temperature-inducedpropagation speed change has a significant effect on the ultrasonic signal [35]. Therefore, to removethe effect of temperature, the temperature was 20 ± 1 ◦C during the experiments.
4. Results
4.1. Results of the Single Bolt Structure
Experimental results of the single bolt structure are presented here. Each torque level wasmeasured using both TR and VTR methods at the same time for comparison.
Sensors 2018, 18, 1928 8 of 18
4.1.1. The Time Reversal Method
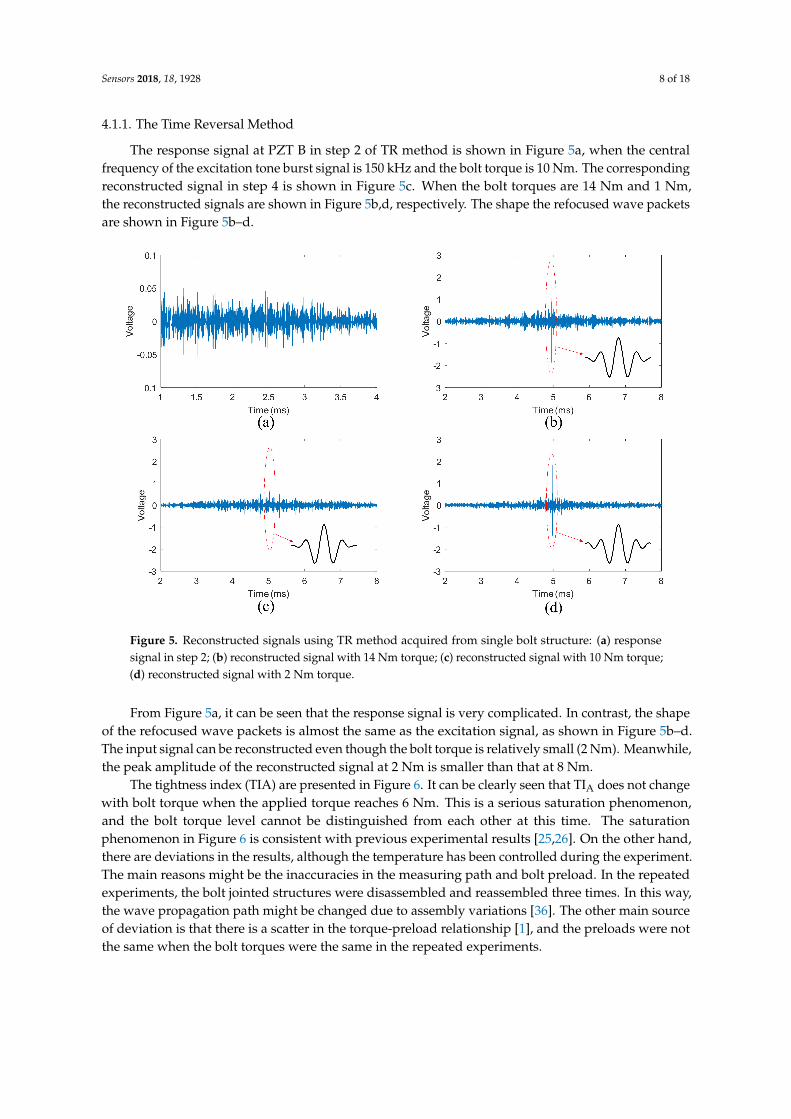
The response signal at PZT B in step 2 of TR method is shown in Figure 5a, when the centralfrequency of the excitation tone burst signal is 150 kHz and the bolt torque is 10 Nm. The correspondingreconstructed signal in step 4 is shown in Figure 5c. When the bolt torques are 14 Nm and 1 Nm,the reconstructed signals are shown in Figure 5b,d, respectively. The shape the refocused wave packetsare shown in Figure 5b–d.
Figure 5. Reconstructed signals using TR method acquired from single bolt structure: (a) responsesignal in step 2; (b) reconstructed signal with 14 Nm torque; (c) reconstructed signal with 10 Nm torque;(d) reconstructed signal with 2 Nm torque.
From Figure 5a, it can be seen that the response signal is very complicated. In contrast, the shapeof the refocused wave packets is almost the same as the excitation signal, as shown in Figure 5b–d.The input signal can be reconstructed even though the bolt torque is relatively small (2 Nm). Meanwhile,the peak amplitude of the reconstructed signal at 2 Nm is smaller than that at 8 Nm.
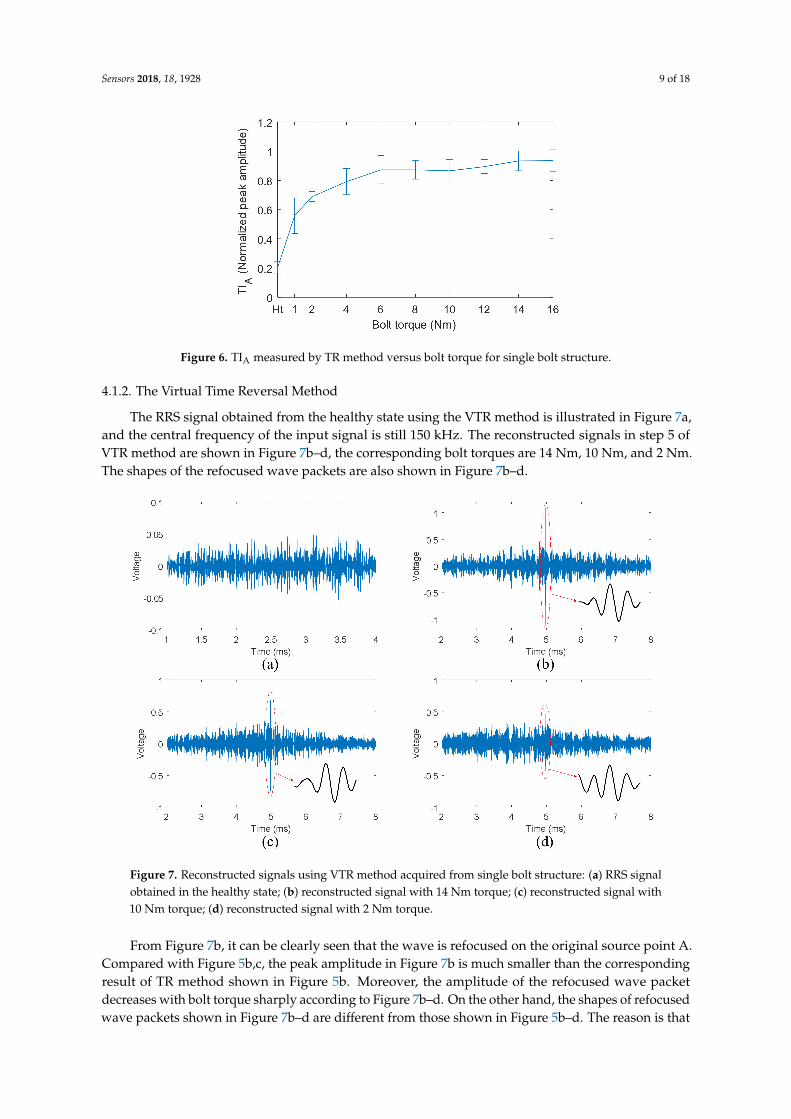
The tightness index (TIA) are presented in Figure 6. It can be clearly seen that TIA does not changewith bolt torque when the applied torque reaches 6 Nm. This is a serious saturation phenomenon,and the bolt torque level cannot be distinguished from each other at this time. The saturationphenomenon in Figure 6 is consistent with previous experimental results [25,26]. On the other hand,there are deviations in the results, although the temperature has been controlled during the experiment.The main reasons might be the inaccuracies in the measuring path and bolt preload. In the repeatedexperiments, the bolt jointed structures were disassembled and reassembled three times. In this way,the wave propagation path might be changed due to assembly variations [36]. The other main sourceof deviation is that there is a scatter in the torque-preload relationship [1], and the preloads were notthe same when the bolt torques were the same in the repeated experiments.
Sensors 2018, 18, 1928 9 of 18
Figure 6. TIA measured by TR method versus bolt torque for single bolt structure.
4.1.2. The Virtual Time Reversal Method
The RRS signal obtained from the healthy state using the VTR method is illustrated in Figure 7a,and the central frequency of the input signal is still 150 kHz. The reconstructed signals in step 5 ofVTR method are shown in Figure 7b–d, the corresponding bolt torques are 14 Nm, 10 Nm, and 2 Nm.The shapes of the refocused wave packets are also shown in Figure 7b–d.
Figure 7. Reconstructed signals using VTR method acquired from single bolt structure: (a) RRS signalobtained in the healthy state; (b) reconstructed signal with 14 Nm torque; (c) reconstructed signal with10 Nm torque; (d) reconstructed signal with 2 Nm torque.
From Figure 7b, it can be clearly seen that the wave is refocused on the original source point A.Compared with Figure 5b,c, the peak amplitude in Figure 7b is much smaller than the correspondingresult of TR method shown in Figure 5b. Moreover, the amplitude of the refocused wave packetdecreases with bolt torque sharply according to Figure 7b–d. On the other hand, the shapes of refocusedwave packets shown in Figure 7b–d are different from those shown in Figure 5b–d. The reason is that

Sensors 2018, 18, 1928 10 of 18
besides amplitude, the phase of the transfer function of unhealthy state is different from that of thetransfer function of healthy state. In addition, this difference increases with the decrease of bolt torque.Hence, the refocusing capability of VTR method decreases with bolt torque noticeably according toEquation (8).
The TIA obtained by VTR method are displayed in Figure 8. It can be clearly observed thatthe relationship between TIA and bolt torque is almost linear, and the saturation phenomenonshown in Figure 6 is completely overcame by VTR method. This linear relationship indicates agood measurement sensitivity of VTR method, especially at the early stage of bolt loosening. Hence, itis possible to the distinguish bolt torque levels from each other using VTR method.
Figure 8. TIA measured by VTR method versus bolt torque.
4.2. Results of the Four-Bolt Structure
Experimental results of the four-bolt structure are presented here. First, 6 torque levels of bolt 2were measured, then different numbers of loosening bolts were measured. Each tight condition wasmeasured using both TR and VTR methods at the same time for comparison.
4.2.1. The Time Reversal Method
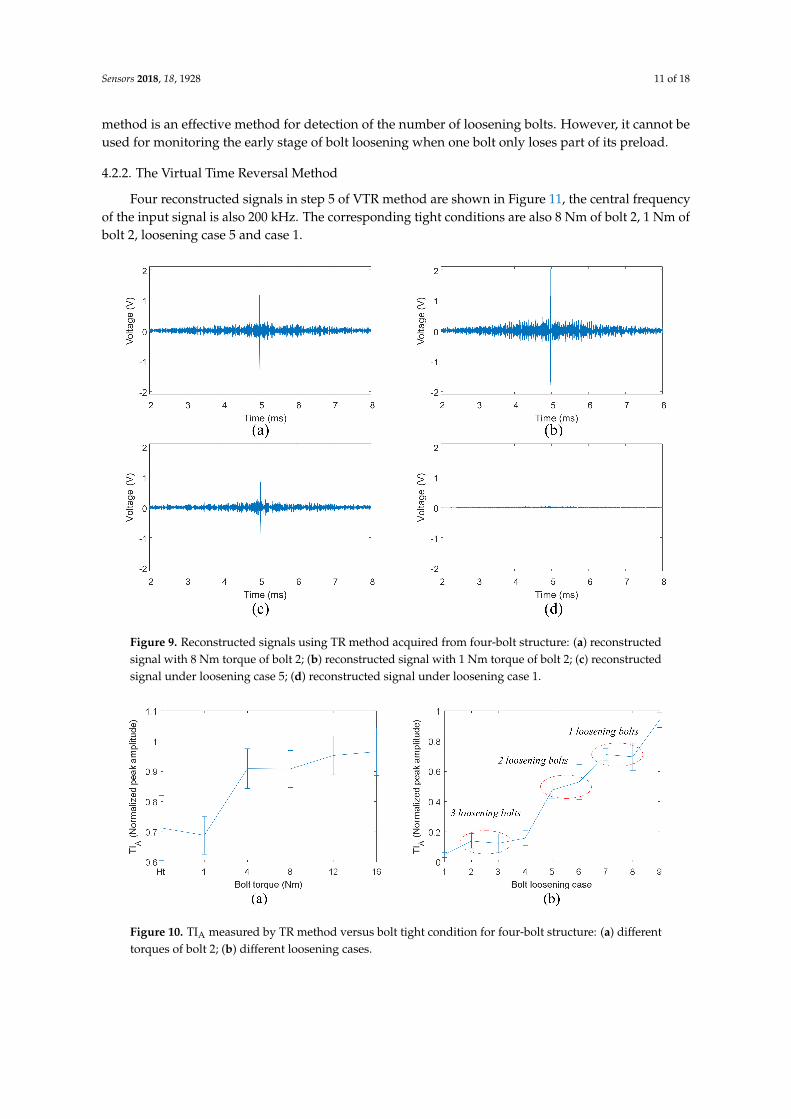
Four reconstructed signals in step 4 of TR method are shown in Figure 9, the central frequency ofthe excitation burst signal is 200 kHz. The corresponding tight conditions are 8 Nm torque of bolt 2,1 Nm torque of bolt 2, loosening case 5 and case 1 listed in Table 1.
From Figure 9a,b, it can be seen that the peak amplitude of the reconstructed signal decreaseslittle with torque of single bolt. However, the peak amplitude decreases obviously when there are twoloosening bolts (Case 5), as shown in Figure 9c. It can also be seen that the input signal can still berefocused even though all four bolts are loosening (Case 1). As expected, the peak amplitude becomesvery small at this time.
The results of TIA are presented in Figure 10. Figure 10a shows the TIA versus torque of bolt2. It can be clearly seen that bolt torques cannot been distinguished from each other by TIA whenthe bolt torque is greater than 4 Nm. Figure 10b displays the TIA versus bolt loosening case listed inTable 1. It can be observed that TIA decreases significantly with the increase of loosening bolt number.Although case 4, 5 and 6 mean 2 bolts loosening, the peak amplitude of case 4 is much smaller thatthese of case 5 and 6. The reason is that the loosening bolts in case 4 (bolt 1 and 2) were located onthe same side of the right angle of the bracket, while the loosening bolts in case 5 and 6 were locatedon both sides of the right angle. This has a significant effect on the energy transfer across the boltinterfaces. Hence, the peak amplitude of case 4 is the same as these of case 2 and 3. Therefore, TR
Sensors 2018, 18, 1928 11 of 18
method is an effective method for detection of the number of loosening bolts. However, it cannot beused for monitoring the early stage of bolt loosening when one bolt only loses part of its preload.
4.2.2. The Virtual Time Reversal Method
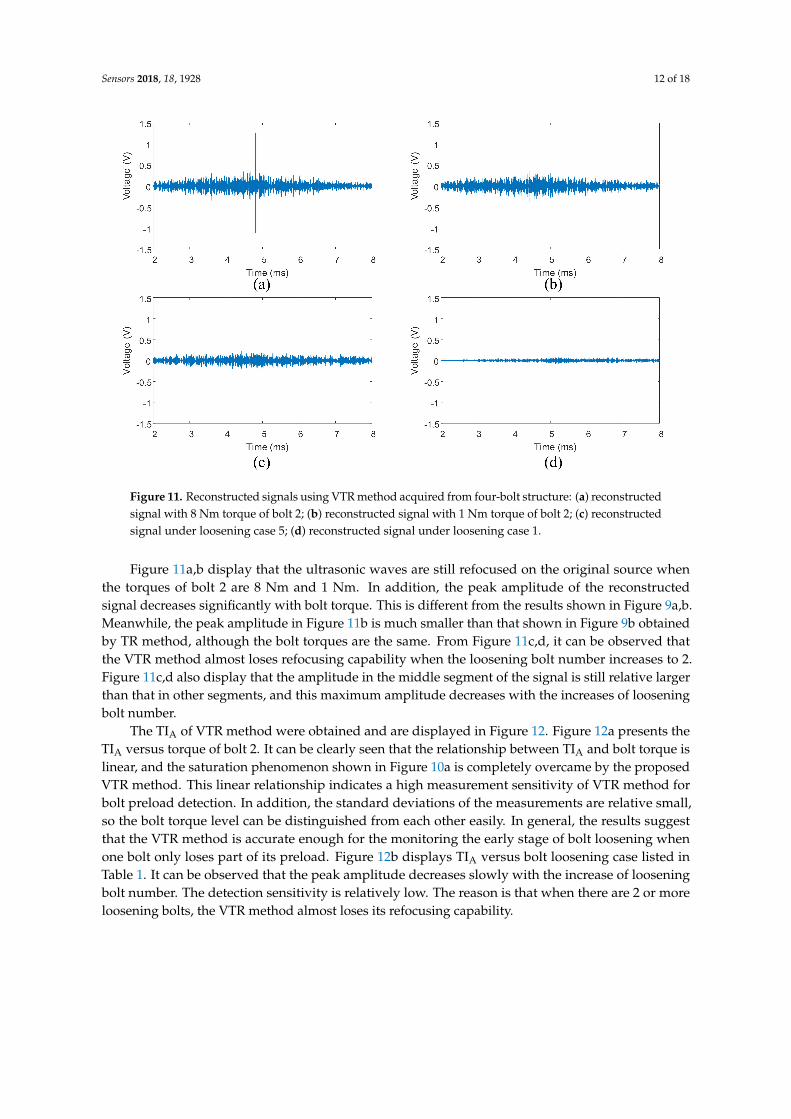
Four reconstructed signals in step 5 of VTR method are shown in Figure 11, the central frequencyof the input signal is also 200 kHz. The corresponding tight conditions are also 8 Nm of bolt 2, 1 Nm ofbolt 2, loosening case 5 and case 1.
Figure 9. Reconstructed signals using TR method acquired from four-bolt structure: (a) reconstructedsignal with 8 Nm torque of bolt 2; (b) reconstructed signal with 1 Nm torque of bolt 2; (c) reconstructedsignal under loosening case 5; (d) reconstructed signal under loosening case 1.
Figure 10. TIA measured by TR method versus bolt tight condition for four-bolt structure: (a) differenttorques of bolt 2; (b) different loosening cases.
Sensors 2018, 18, 1928 12 of 18
Figure 11. Reconstructed signals using VTR method acquired from four-bolt structure: (a) reconstructedsignal with 8 Nm torque of bolt 2; (b) reconstructed signal with 1 Nm torque of bolt 2; (c) reconstructedsignal under loosening case 5; (d) reconstructed signal under loosening case 1.
Figure 11a,b display that the ultrasonic waves are still refocused on the original source whenthe torques of bolt 2 are 8 Nm and 1 Nm. In addition, the peak amplitude of the reconstructedsignal decreases significantly with bolt torque. This is different from the results shown in Figure 9a,b.Meanwhile, the peak amplitude in Figure 11b is much smaller than that shown in Figure 9b obtainedby TR method, although the bolt torques are the same. From Figure 11c,d, it can be observed thatthe VTR method almost loses refocusing capability when the loosening bolt number increases to 2.Figure 11c,d also display that the amplitude in the middle segment of the signal is still relative largerthan that in other segments, and this maximum amplitude decreases with the increases of looseningbolt number.
The TIA of VTR method were obtained and are displayed in Figure 12. Figure 12a presents theTIA versus torque of bolt 2. It can be clearly seen that the relationship between TIA and bolt torque islinear, and the saturation phenomenon shown in Figure 10a is completely overcame by the proposedVTR method. This linear relationship indicates a high measurement sensitivity of VTR method forbolt preload detection. In addition, the standard deviations of the measurements are relative small,so the bolt torque level can be distinguished from each other easily. In general, the results suggestthat the VTR method is accurate enough for the monitoring the early stage of bolt loosening whenone bolt only loses part of its preload. Figure 12b displays TIA versus bolt loosening case listed inTable 1. It can be observed that the peak amplitude decreases slowly with the increase of looseningbolt number. The detection sensitivity is relatively low. The reason is that when there are 2 or moreloosening bolts, the VTR method almost loses its refocusing capability.

Sensors 2018, 18, 1928 13 of 18
Figure 12. TIA measured by VTR method versus bolt tight condition for four-bolt structure: (a) differenttorques of bolt 2; (b) different number of loosening bolts.
5. Discussion
It is well known that the selections of ultrasound frequency and tightness index are very importantfor bolt loosening or preload detection. Hence, the effects of frequency and tightness index arediscussed in this section.
5.1. The Effect of Frequency
The effect of excitation signal frequency on TR and VTR methods is evaluated. Excitationfrequencies from 100 kHz to 300 kHz were investigated. As the above results show, the TR methodis effective for the detection of bolt loosening number. Therefore, bolt loosening number of four-boltstructure were measured by TR method using different frequencies, and the results are presentedin Figure 13a. All the frequencies can be used for loosening number detection. Figure 13a alsoshows that when the central frequency is 100 kHz, the normalized peak amplitudes obtained underdifferent loosening cases are relatively close. Hence, frequency of 100 kHz is not sensitive for boltloosening detection compared with other frequencies. Subsequently, the detection sensitivities of allthe frequencies are evaluated by the following means. Every curve shown in Figure 13a is fitted by astraight line, and the slope of the line are taken as detection sensitivity of the corresponding frequency.The results are shown in Figure 13b. It can be observed that the detection sensitivity generally increaseswith ultrasound frequency, especially when the frequencies are from 100 kHz to 250 kHz.
Figure 13. The effect of frequency on TR method (a) results using different frequencies;(b) detection sensitivity.
Sensors 2018, 18, 1928 14 of 18
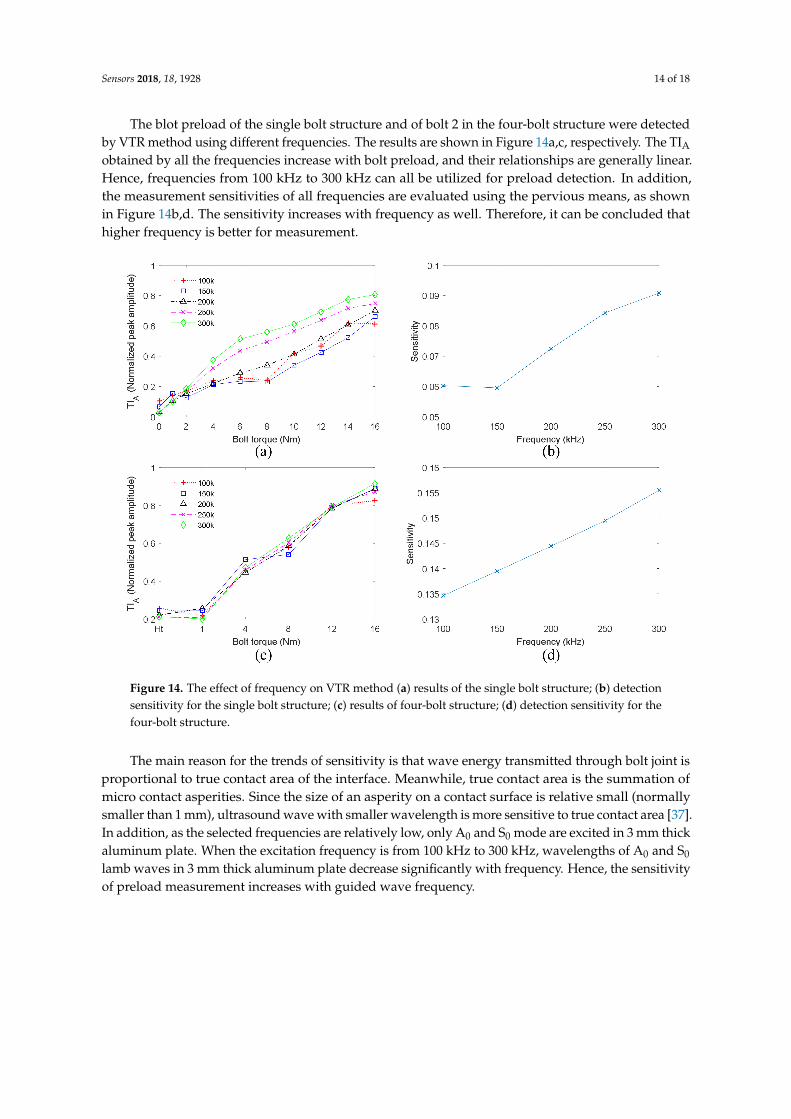
The blot preload of the single bolt structure and of bolt 2 in the four-bolt structure were detectedby VTR method using different frequencies. The results are shown in Figure 14a,c, respectively. The TIA
obtained by all the frequencies increase with bolt preload, and their relationships are generally linear.Hence, frequencies from 100 kHz to 300 kHz can all be utilized for preload detection. In addition,the measurement sensitivities of all frequencies are evaluated using the pervious means, as shownin Figure 14b,d. The sensitivity increases with frequency as well. Therefore, it can be concluded thathigher frequency is better for measurement.
Figure 14. The effect of frequency on VTR method (a) results of the single bolt structure; (b) detectionsensitivity for the single bolt structure; (c) results of four-bolt structure; (d) detection sensitivity for thefour-bolt structure.
The main reason for the trends of sensitivity is that wave energy transmitted through bolt joint isproportional to true contact area of the interface. Meanwhile, true contact area is the summation ofmicro contact asperities. Since the size of an asperity on a contact surface is relative small (normallysmaller than 1 mm), ultrasound wave with smaller wavelength is more sensitive to true contact area [37].In addition, as the selected frequencies are relatively low, only A0 and S0 mode are excited in 3 mm thickaluminum plate. When the excitation frequency is from 100 kHz to 300 kHz, wavelengths of A0 and S0
lamb waves in 3 mm thick aluminum plate decrease significantly with frequency. Hence, the sensitivityof preload measurement increases with guided wave frequency.

Sensors 2018, 18, 1928 15 of 18
5.2. The Selection of Tightness Index
Other than peak amplitude of the reconstructed signal, energy of the transmitted ultrasoundsignal can also be taken as tightness index. In the discrete time domain, the energy of a receivedultrasound signal in time domain [ts, tf] can be simplified as [8]:
E =2π
ωs
t=t f
∑t=ts
V(t)2 (9)
where V(t) and ωs denote the voltage of the discrete sensor signal and its sampling frequency,respectively. In this section, the normalized energy of the refocused wave packet is used as tightnessindex (TIE) to compare with the previous TIA. The length of the refocused wave packet was chosenas the corresponding excitation tone bust signal. The energy of wave packets was also normalizedby reference measurements of the jointed structure in healthy state to calculate TIE. Thus, TIE can beexpressed as:
TIE =Eu
Eh(10)
where, Eu is the energy of the refocused wave packet obtained from an unhealthy state and Eh is theenergy of the refocused wave packet obtained from the healthy state.
Figure 15a,b show TIE vs. torques of the bolt in the single bolt structure and of bolt 2 in thefour-bolt structure, respectively. Both were measured by VTR method. Figure 15c shows TIE measuredby TR method versus bolt loosening number in the four-bolt structure. Please note that the ultrasonicsignals used to calculate TIE are the same as those to obtain the results shown in Figures 8, 10b and 12a.
Figure 15. Results of TIE: (a) TIE versus bolt torque in the single bolt structure; (b) TIE versus torque ofbolt 2 in the four-bolt structure; (c) TIE versus bolt loosening case in the four-bolt structure.
It can be clearly observed that the linearity of the relationships between TIE and bolt torque shownin Figure 15a,b is not as good as the linearity of those shown in Figures 8 and 12a. From Figure 15c,

Sensors 2018, 18, 1928 16 of 18
it can be seen that the TIE of case 1 which is 4 bolts loosening is very close to those of case 2 and 3which are both 3 bolts loosening. At the same time, the difference between case 7 and 8 is relativelylarge, although both case 7 and 8 mean 1 bolt loosening. In addition, the standard deviation of TIE isgreater than that of TIA when bolt torque is relatively high, as shown in Figure 15. Hence, it can beconcluded that the sensitivity and accuracy of TIE are not as good as TIA, so TIA is a better selection oftightness index.
6. Conclusions
In this paper, a virtual time reversal (VTR) guided wave method is presented to monitor boltpreload accurately, and the complicated TR procedure is simplified. The effectiveness of the proposedmethod is experimentally validated by L-shaped bolt joints with single and multiple bolts. Based onthe results presented in this article, the following conclusions can be drawn:
(1) The relationship between bolt torque and the peak amplitude of refocused wave packet measuredby the VTR method is almost linear. Preload detection sensitivity is improved significantlycompared with the TR method, especially at early stage of bolt loosening. The saturationphenomenon is completely overcome by the VTR method. The main reason is that both theamplitude and phase of time reversal operator in VTR change with bolt preload. Hence, the boltpreload not only affects the amplitude of wave packets, but also the refocusing capability.
(2) For the VTR method, the original excitation tone burst signal can be refocused at the originalsource point when the bolt torque is close to healthy state. Nevertheless, the shape of therefocused signal is different from the tone burst signal. In addition, the VTR method almost losesrefocusing capability when the loosening bolt number increases to 2. The results also show thatthe TR method is an effective method for detection of the number of loosening bolts.
(3) The selections of guided wave frequency and tightness index are discussed. Detection sensitivityof VTR and TR methods generally increases with ultrasound frequency. The main reason isthat ultrasound wave with smaller wavelength is more sensitive to true contact area, and thewavelength of the selected lamb wave decreases significantly with frequency. In addition,both wave energy and peak amplitude of refocused wave packet were used as tightness index.The sensitivity and accuracy of peak amplitude is better.
PZT sensors can be used for guided waves and EMI monitoring and the two techniques have theirown technical merits. The combination of the two techniques is effective to improve the performanceof damage monitoring [4,38]. Therefore, how to combine the proposed guided wave method with EMIis the future research work that will enhance the performance of bolt preload monitoring.
Author Contributions: The key method was proposed by F.D., C.X. and G.W. The experiment was designed byC.X. and performed by F.D. and G.W. F.D. analyzed the experimental data. F.D. and J.Z. wrote the paper.
Acknowledgments: This study is supported by the National Natural Science Foundation of China (GrantNo. 51705422) and Science Challenge Project (Grant No. TZ2018007). This study is also supported by ChinaNSAF Project (Grant No. U1530139) and Fundamental Research Funds for the Central Universities (Grant No.3102017OQD004).
Conflicts of Interest: The authors declare no conflict of interest.
References
1. Zhu, L.; Hong, J.; Jiang, X. On controlling preload and estimating anti-loosening performance in threadedfasteners based on accurate contact modeling. Tribol. Int. 2016, 95, 181–191. [CrossRef]
2. He, K.; Zhu, W.D. Detecting Loosening of Bolted Connections in a Pipeline Using Changes in NaturalFrequencies. J. Vib. Acoust. 2014, 136, 8. [CrossRef]
3. Giurgiutiu, V.; Lin, B.; Santoni-Bottai, G.; Cuc, A. Space application of piezoelectric wafer active sensors forstructural health monitoring. J. Intell. Mater. Syst. Struct. 2011, 22, 1359–1370. [CrossRef]

Sensors 2018, 18, 1928 17 of 18
4. An, Y.K.; Sohn, H. Integrated impedance and guided wave based damage detection. Mech. Syst. Signal Process.2012, 28, 50–62. [CrossRef]
5. Perera, R.; Pérez, A.; García-Diéguez, M.; Zapico-Valle, J.L. Active Wireless System for Structural HealthMonitoring Applications. Sensors 2017, 17, E2880. [CrossRef] [PubMed]
6. Zagrai, A.; Doyle, D.; Gigineishvili, V. Piezoelectric wafer active sensor structural health monitoring of spacestructures. J. Intell. Mater. Syst. Struct. 2010, 21, 921–940. [CrossRef]
7. Lowe, P.S.; Duan, W.; Kanfoud, J.; Gan, T.H. Structural Health Monitoring of Above-Ground Storage TankFloors by Ultrasonic Guided Wave Excitation on the Tank Wall. Sensors 2017, 17. [CrossRef] [PubMed]
8. Yang, J.; Chang, F.-K. Detection of bolt loosening in C–C composite thermal protection panels: I. Diagnosticprinciple. Smart Mater. Struct. 2006, 15, 581–590. [CrossRef]
9. Wang, T.; Song, G.; Wang, Z.; Li, Y. Proof-of-concept study of monitoring bolt connection status using apiezoelectric based active sensing method. Smart Mater. Struct. 2013, 22. [CrossRef]
10. Amerini, F.; Meo, M. Structural health monitoring of bolted joints using linear and nonlinearacoustic/ultrasound methods. Struct. Health Monit. 2011, 10, 659–672. [CrossRef]
11. Yang, B.; Xuan, F.Z.; Xiang, Y.; Li, D.; Zhu, W.; Tang, X.; Xu, J.; Yang, K.; Luo, C. Lamb Wave-Based StructuralHealth Monitoring on Composite Bolted Joints under Tensile Load. Materials 2017, 10, 652. [CrossRef][PubMed]
12. Haynes, C.; Yeager, M.; Todd, M.; Lee, J.-R. Health Monitoring of Structural and Biological Systems 2014.In Monitoring Bolt Torque Levels through Signal Processing of Full-Field Ultrasonic Data; International Society forOptics and Photonics: Bellingham, WA, USA, 2014.
13. Dworakowski, Z.; Ambrozinski, L.; Stepinski, T. Multi-stage temperature compensation method for Lambwave measurements. J. Sound Vib. 2016, 382, 328–339. [CrossRef]
14. Kedra, R.; Rucka, M. Research on assessment of bolted joint state using elastic wave propagation. J. Phys.Conf. Ser. 2015, 628. [CrossRef]
15. Zagrai, A.; Doyle, D.; Arritt, B. Embedded nonlinear ultrasonics for structural health monitoring of satellitejoints. Proc. SPIE 2008, 6935. [CrossRef]
16. Doyle, D.; Zagrai, A.; Arritt, B.; Çakan, H. Damage detection in bolted space structures. J. Intell. Mater.Syst. Struct. 2010, 21, 251–264. [CrossRef]
17. Doyle, D.; Zagrai, A.; Arritt, B. Bolted joint integrity for structural health monitoring of responsive spacesatellites. In Proceedings of the 50th AIAA SDM Conference, Palm Springs, CA, USA, 5 May 2009.
18. Ing, R.K.; Fink, M. Time-reversed Lamb waves. In IEEE Transactions on Ultrasonics, Ferroelectrics, and FrequencyControl; IEEE: Piscataway, NJ, USA, 1998.
19. Watkins, R.; Jha, R. A modified time reversal method for Lamb wave based diagnostics of compositestructures. Mech. Syst. Signal Process. 2012, 31, 345–354. [CrossRef]
20. Cai, J.; Shi, L.; Yuan, S.; Shao, Z. High spatial resolution imaging for structural health monitoring based onvirtual time reversal. Smart Mater. Struct. 2011, 20. [CrossRef]
21. Poddar, B.; Kumar, A.; Mitra, M.; Mujumdar, P.M. Time reversibility of a Lamb wave for damage detectionin a metallic plate. Smart Mater. Struct. 2011, 20. [CrossRef]
22. Zeng, L.; Lin, J.; Huang, L.; Zhao, M. Amplitude Dispersion Compensation for Damage Detection UsingUltrasonic Guided Waves. Sensors 2016, 16, E1623. [CrossRef] [PubMed]
23. Park, H.W.; Sohn, H.; Law, K.H.; Farrar, C.R. Time reversal active sensing for health monitoring of acomposite plate. J. Sound Vib. 2007, 302, 50–66. [CrossRef]
24. Zeng, L.; Lin, J.; Huang, L. A Modified Lamb Wave Time-Reversal Method for Health Monitoring ofComposite Structures. Sensors 2017, 17. [CrossRef] [PubMed]
25. Parvasi, S.M.; Ho, S.C.M.; Kong, Q.; Mousavi, R.; Song, G. Real time bolt preload monitoring usingpiezoceramic transducers and time reversal technique—A numerical study with experimental verification.Smart Mater. Struct. 2016, 25. [CrossRef]
26. Wang, T.; Liu, S.; Shao, J.; Li, Y. Health monitoring of bolted joints using the time reversal method andpiezoelectric transducers. Smart Mater. Struct. 2016, 25. [CrossRef]
27. Jalalpour, M.; El-Osery, A.I.; Austin, E.M.; Reda Taha, M.M. Health monitoring of 90◦ bolted joints usingfuzzy pattern recognition of ultrasonic signals. Smart Mater. Struct. 2014, 23. [CrossRef]
28. He, K.; Zhu, W.D. Finite Element Modeling of Structures with L-Shaped Beams and Bolted Joints.J. Vib. Acoust. 2011, 133, 781–798. [CrossRef]

Sensors 2018, 18, 1928 18 of 18
29. Montoya, A.C.; Maji, A.K. An Assessment of Joint Rigidity with Ultrasonic Wave Energy. J. Nondestruct. Eval.2011, 30, 122–129. [CrossRef]
30. Montoya, A.; Doyle, D.; Maji, A.; Dumm, H.-P. Ultrasonic Evaluation of Bolted Connections in Satellites.Res. Nondestruct. Eval. 2014, 25, 44–62. [CrossRef]
31. Park, H.W.; Kim, S.B.; Sohn, H. Understanding a time reversal process in Lamb wave propagation.Wave Motion 2009, 46, 451–467. [CrossRef]
32. Xu, B.; Giurgiutiu, V. Single Mode Tuning Effects on Lamb Wave Time Reversal with Piezoelectric WaferActive Sensors for Structural Health Monitoring. J. Nondestruct. Eval. 2007, 26, 123–134. [CrossRef]
33. Zeng, L.; Lin, J.; Bao, J.; Joseph, R.P.; Huang, L. Spatial resolution improvement for Lamb wave-baseddamage detection using frequency dependency compensation. J. Sound Vib. 2017, 394, 130–145. [CrossRef]
34. Lin, Q.; Li, B. Comparison of the influences of surface texture and boundary slip on tribological performances.Math. Probl. Eng. 2015. [CrossRef]
35. Herdovics, B.; Cegla, F. Compensation of phase response changes in ultrasonic transducers caused bytemperature variations. Struct. Health Monit. 2018. [CrossRef]
36. Guo, J.; Li, B.; Liu, Z.; Hong, J.; Wu, X. Integration of geometric variation and part deformation into variationpropagation of 3-D. assemblies. Int. J. Prod. Res. 2016, 54, 5708–5721. [CrossRef]
37. Du, F.; Li, B.; Hong, J. Application of ultrasound technique to evaluate contact condition on the fayingsurface of riveted joints. J. Eng. Tribol. 2015, 229. [CrossRef]
38. Sevillano, E.; Sun, R.; Perera, R. Damage detection based on power dissipation measured with PZT sensorsthrough the combination of electro-mechanical impedances and guided waves. Sensors 2016, 16, 639.[CrossRef] [PubMed]
© 2018 by the authors. Licensee MDPI, Basel, Switzerland. This article is an open accessarticle distributed under the terms and conditions of the Creative Commons Attribution(CC BY) license (http://creativecommons.org/licenses/by/4.0/).