SIMULATION AND EXPERIMENTAL WORK OF SINGLE LAP BOLTED JOINT … · factors that potentially...
15
Suranaree J. Sci. Technol. 14(4):331-345 Fatigue and Fracture Research Group, Department of Mechanical and Manufacturing Engineering, University of Putra Malaysia, 43400 Serdang, Selangor, Malaysia. E-mail: [email protected] * Corresponding author SIMULATION AND EXPERIMENTAL WORK OF SINGLE LAP BOLTED JOINT TESTED IN BENDING Aidy Ali * , Ting Wei Yao, Nuraini Abdul Aziz, Muhammad Yunin Hassan and Barkawi Sahari Received: Jun 13, 2007; Revised: Nov 29, 2007; Accepted: Nov 30, 2007 Abstract This paper presents the simulation and experiment work on the prediction of stress analysis in a single lap bolted joint under bending loads. A three-dimensional finite element model of a bolted joint has been developed using MSC Patran and MSC Nastran FEM commercial package. In the simulation, different methods in modelling the contact between the joint, which affects the efficiency of the models were detailed. Experimental work was then conducted to measure strains and deformations of the specimens for validation of the developed numerical model. A four-point bending load type of testing was used in both the simulation and experiment works. The results from both simulation and experiment were then compared and show good agreement. Several factors that potentially influenced the variation of the results were noted. Finally, critical areas were identified and confirmed with the stress distribution results from simulation. Keywords: Bolted joints, FEM, MSC Nastran, MSC Patran Introduction A bolted joint is one of the joining techniques employed to hold two or more parts together to form an assembly in mechanical structures. One of the advantages of a bolted joint over other joint types, such as welded and riveted joints, is that they are capable of being dismantled. A bolted joint is considered as an important element to be employed in civil, mechanical and aeronautic structures. The previous studies on the behaviour of a single lap bolted joint were mostly dedicated to tension load at the end of plate. An early study was performed by Ireman (1998) in which a three- dimensional finite element model of bolted composite joints was developed to determine the non-uniform stress distribution through the thickness of composite laminates in the vicinity of a bolt hole. The single lap bolted joint was loaded in tension. A similar study was carried out by McCarthy et al. (2005) where the effects of bolt-hole clearance on the mechanical behaviour of a bolted composite (graphite/ epoxy) joint were investigated. Furthermore, Ju et al. (2004) studied the nominal applied
Transcript of SIMULATION AND EXPERIMENTAL WORK OF SINGLE LAP BOLTED JOINT … · factors that potentially...
Suranaree J. Sci. Technol. 14(4):331-345
Fatigue and Fracture Research Group, Department of Mechanical and Manufacturing Engineering,University of Putra Malaysia, 43400 Serdang, Selangor, Malaysia. E-mail: [email protected]
* Corresponding author
SIMULATION AND EXPERIMENTAL WORK OF SINGLE LAPBOLTED JOINT TESTED IN BENDING
Aidy Ali*, Ting Wei Yao, Nuraini Abdul Aziz, Muhammad Yunin Hassan andBarkawi SahariReceived: Jun 13, 2007; Revised: Nov 29, 2007; Accepted: Nov 30, 2007
Abstract
This paper presents the simulation and experiment work on the prediction of stress analysis in asingle lap bolted joint under bending loads. A three-dimensional finite element model of a boltedjoint has been developed using MSC Patran and MSC Nastran FEM commercial package. In thesimulation, different methods in modelling the contact between the joint, which affects theefficiency of the models were detailed. Experimental work was then conducted to measure strainsand deformations of the specimens for validation of the developed numerical model. A four-pointbending load type of testing was used in both the simulation and experiment works. The resultsfrom both simulation and experiment were then compared and show good agreement. Severalfactors that potentially influenced the variation of the results were noted. Finally, critical areaswere identified and confirmed with the stress distribution results from simulation.
Keywords: Bolted joints, FEM, MSC Nastran, MSC Patran
Introduction
A bolted joint is one of the joining techniques
employed to hold two or more parts together to
form an assembly in mechanical structures. One
of the advantages of a bolted joint over other
joint types, such as welded and riveted joints, is
that they are capable of being dismantled.
A bolted joint is considered as an important
element to be employed in civil, mechanical
and aeronautic structures.
The previous studies on the behaviour of
a single lap bolted joint were mostly dedicated
to tension load at the end of plate. An early study
was performed by Ireman (1998) in which a three-
dimensional finite element model of bolted
composite joints was developed to determine
the non-uniform stress distribution through the
thickness of composite laminates in the vicinity
of a bolt hole. The single lap bolted joint was
loaded in tension. A similar study was carried
out by McCarthy et al. (2005) where the effects
of bolt-hole clearance on the mechanical
behaviour of a bolted composite (graphite/
epoxy) joint were investigated. Furthermore,
Ju et al. (2004) studied the nominal applied
332 Simulation and Experimental work of Single Lap Bolted Joint Tested in Bending
force of the steel bolted connection. Relatively
few studies have dealt with the behaviour of a
bolted joint in bending. For instance,
Krishnamurthy (1980) investigated the
behaviour of a steel bolted connection where
the connection transfers the bending moment
from the beam to a column or to the cross
section of another beam.
Kovács et al. (2004) carried out an experi-
mental study on the behaviour of bolted
composite joints. The composite base columns
were investigated under cyclic loading. Su and
Siu (2004) analysed the nonlinear response of a
bolt group under in-plane loading using the
numerical method. In order to predict the
physical behaviours of the structure with a
bolted joint, simulation with three dimensional
finite element models is desirable. With the
recent increase in computing power, three-
dimensional finite element modelling of a bolted
joint in bending has become feasible.
Many structural applications are
subjected to bending forces which effectively
result in combined tension and shear loads
acting simultaneously on the fastener. This
commonly occurs in building frames and bridge
deck systems when the connections are required
to transmit moments to ensure continuous
structural action. The study of a single lap bolted
joint in bending is an important topic especially
in civil and mechanical structures application.
Although much research and testing has been
accomplished by applying shear loads, there is
still limited bending load analysis for many
alternative details. Research should be pursued
until cost effective and attractive solutions
are available for all subjected force types.
Therefore, the objectives of this work are: (1) to
develop a finite element model of a single lap
bolted joint in bending, and (2) to analyse the
stress distribution in the bolt and the plate
under bending loads.
Materials and Methods
A single bolted lap joint consists of a bolt, a nut,
washers and two plates. Most often bolts used
in machining are made to SAE standard J429
(Unified Engineering, 2006). The bolt and nut
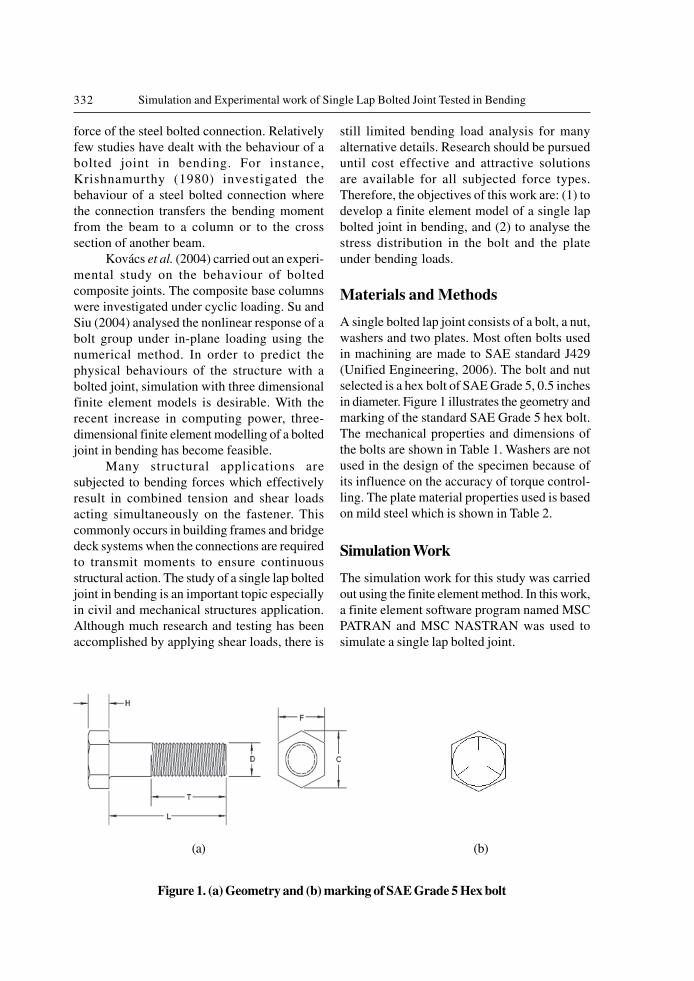
selected is a hex bolt of SAE Grade 5, 0.5 inches
in diameter. Figure 1 illustrates the geometry and
marking of the standard SAE Grade 5 hex bolt.
The mechanical properties and dimensions of
the bolts are shown in Table 1. Washers are not
used in the design of the specimen because of
its influence on the accuracy of torque control-
ling. The plate material properties used is based
on mild steel which is shown in Table 2.
Simulation Work
The simulation work for this study was carried
out using the finite element method. In this work,
a finite element software program named MSC
PATRAN and MSC NASTRAN was used to
simulate a single lap bolted joint.
Figure 1. (a) Geometry and (b) marking of SAE Grade 5 Hex bolt
(a) (b)
333Suranaree J. Sci. Technol. Vol. 14 No. 4; October-December 2007
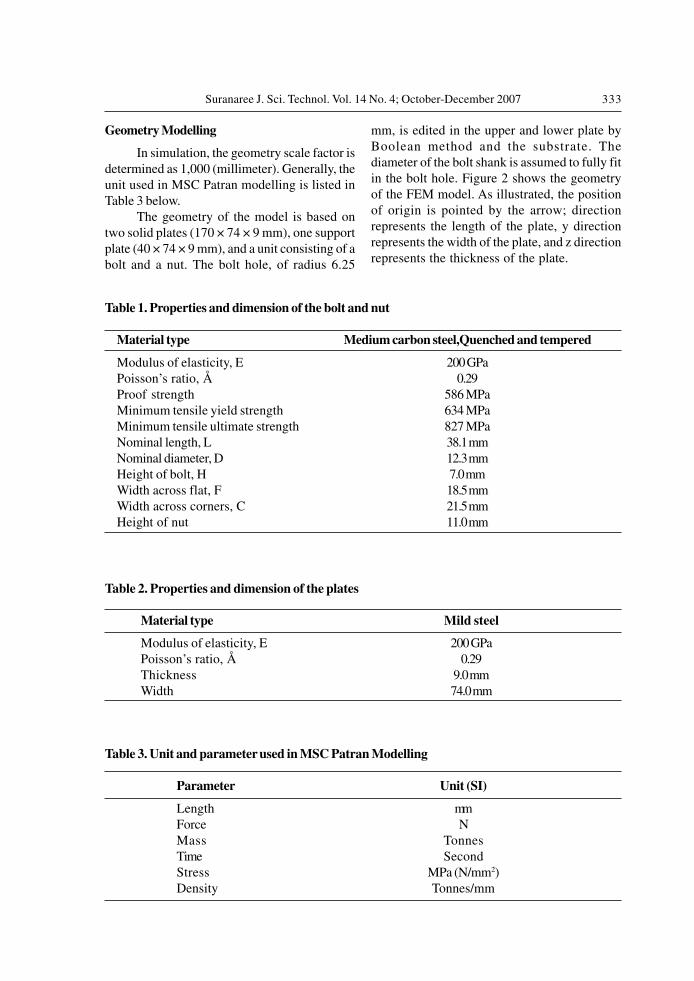
Geometry Modelling
In simulation, the geometry scale factor is
determined as 1,000 (millimeter). Generally, the
unit used in MSC Patran modelling is listed in
Table 3 below.
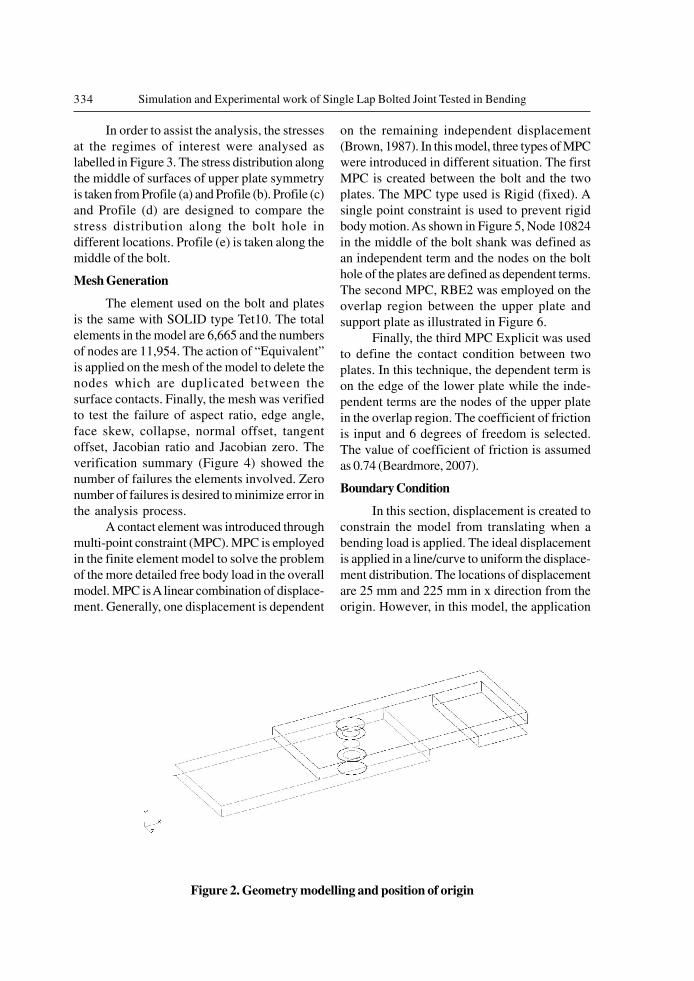
The geometry of the model is based on
two solid plates (170 × 74 × 9 mm), one support
plate (40 × 74 × 9 mm), and a unit consisting of a
bolt and a nut. The bolt hole, of radius 6.25
mm, is edited in the upper and lower plate by
Boolean method and the substrate. The
diameter of the bolt shank is assumed to fully fit
in the bolt hole. Figure 2 shows the geometry
of the FEM model. As illustrated, the position
of origin is pointed by the arrow; direction
represents the length of the plate, y direction
represents the width of the plate, and z direction
represents the thickness of the plate.
Table 1. Properties and dimension of the bolt and nut
Material type Medium carbon steel,Quenched and tempered
Modulus of elasticity, E 200 GPa
Poisson’s ratio, Å 0.29
Proof strength 586 MPa
Minimum tensile yield strength 634 MPa
Minimum tensile ultimate strength 827 MPa
Nominal length, L 38.1 mm
Nominal diameter, D 12.3 mm
Height of bolt, H 7.0 mm
Width across flat, F 18.5 mm
Width across corners, C 21.5 mm
Height of nut 11.0 mm
Table 2. Properties and dimension of the plates
Material type Mild steel
Modulus of elasticity, E 200 GPa
Poisson’s ratio, Å 0.29
Thickness 9.0 mm
Width 74.0 mm
Table 3. Unit and parameter used in MSC Patran Modelling
Parameter Unit (SI)
Length mm
Force N
Mass Tonnes
Time Second
Stress MPa (N/mm2)
Density Tonnes/mm
334 Simulation and Experimental work of Single Lap Bolted Joint Tested in Bending
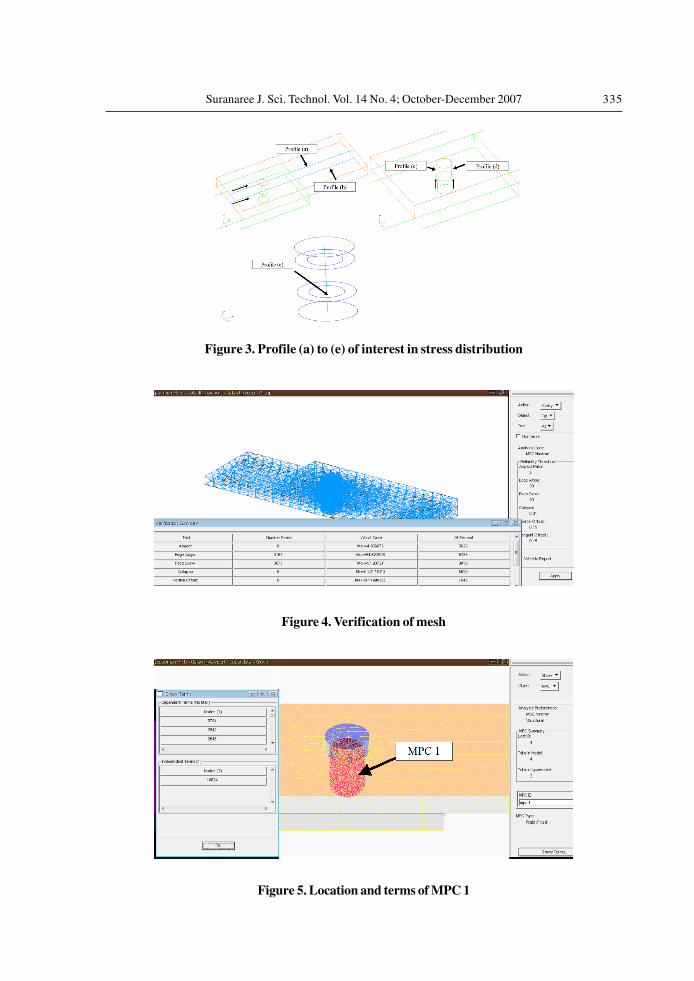
In order to assist the analysis, the stresses
at the regimes of interest were analysed as
labelled in Figure 3. The stress distribution along
the middle of surfaces of upper plate symmetry
is taken from Profile (a) and Profile (b). Profile (c)
and Profile (d) are designed to compare the
stress distribution along the bolt hole in
different locations. Profile (e) is taken along the
middle of the bolt.
Mesh Generation
The element used on the bolt and plates
is the same with SOLID type Tet10. The total
elements in the model are 6,665 and the numbers
of nodes are 11,954. The action of “Equivalent”
is applied on the mesh of the model to delete the
nodes which are duplicated between the
surface contacts. Finally, the mesh was verified
to test the failure of aspect ratio, edge angle,
face skew, collapse, normal offset, tangent
offset, Jacobian ratio and Jacobian zero. The
verification summary (Figure 4) showed the
number of failures the elements involved. Zero
number of failures is desired to minimize error in
the analysis process.
A contact element was introduced through
multi-point constraint (MPC). MPC is employed
in the finite element model to solve the problem
of the more detailed free body load in the overall
model. MPC is A linear combination of displace-
ment. Generally, one displacement is dependent
on the remaining independent displacement
(Brown, 1987). In this model, three types of MPC
were introduced in different situation. The first
MPC is created between the bolt and the two
plates. The MPC type used is Rigid (fixed). A
single point constraint is used to prevent rigid
body motion. As shown in Figure 5, Node 10824
in the middle of the bolt shank was defined as
an independent term and the nodes on the bolt
hole of the plates are defined as dependent terms.
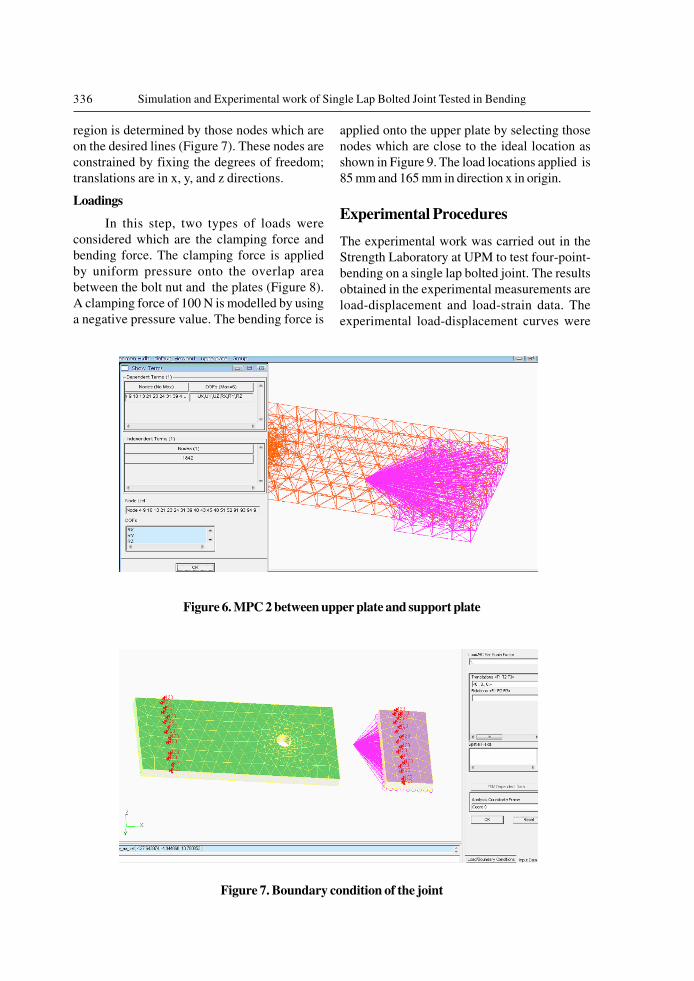
The second MPC, RBE2 was employed on the
overlap region between the upper plate and
support plate as illustrated in Figure 6.
Finally, the third MPC Explicit was used
to define the contact condition between two
plates. In this technique, the dependent term is
on the edge of the lower plate while the inde-
pendent terms are the nodes of the upper plate
in the overlap region. The coefficient of friction
is input and 6 degrees of freedom is selected.
The value of coefficient of friction is assumed
as 0.74 (Beardmore, 2007).
Boundary Condition
In this section, displacement is created to
constrain the model from translating when a
bending load is applied. The ideal displacement
is applied in a line/curve to uniform the displace-
ment distribution. The locations of displacement
are 25 mm and 225 mm in x direction from the
origin. However, in this model, the application
Figure 2. Geometry modelling and position of origin
335Suranaree J. Sci. Technol. Vol. 14 No. 4; October-December 2007
Figure 3. Profile (a) to (e) of interest in stress distribution
Figure 4. Verification of mesh
Figure 5. Location and terms of MPC 1
336 Simulation and Experimental work of Single Lap Bolted Joint Tested in Bending
region is determined by those nodes which are
on the desired lines (Figure 7). These nodes are
constrained by fixing the degrees of freedom;
translations are in x, y, and z directions.
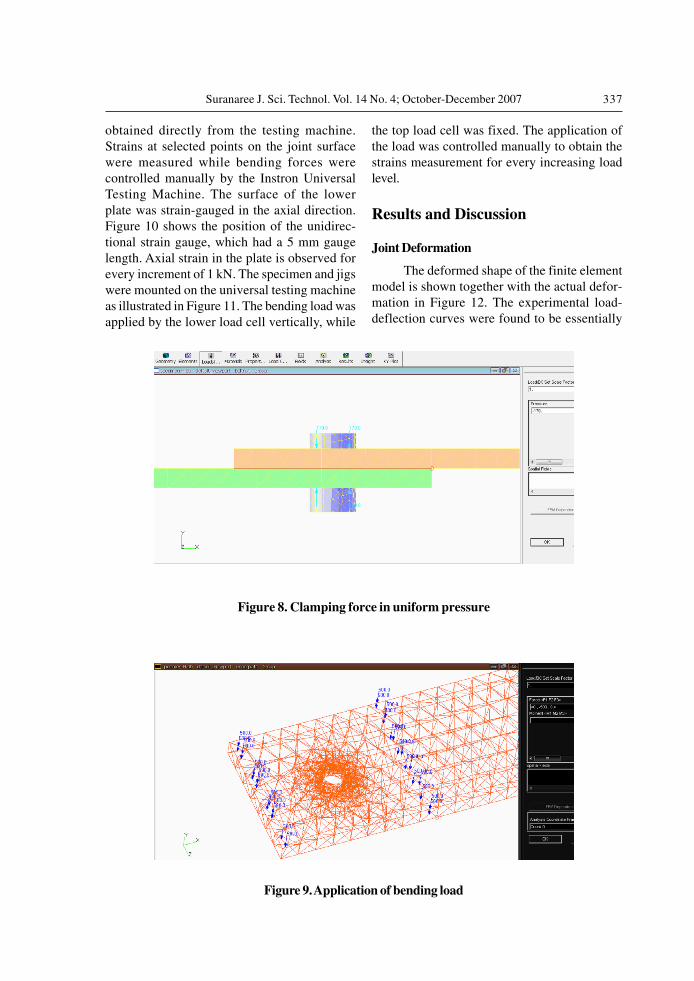
Loadings
In this step, two types of loads were
considered which are the clamping force and
bending force. The clamping force is applied
by uniform pressure onto the overlap area
between the bolt nut and the plates (Figure 8).
A clamping force of 100 N is modelled by using
a negative pressure value. The bending force is
applied onto the upper plate by selecting those
nodes which are close to the ideal location as
shown in Figure 9. The load locations applied is
85 mm and 165 mm in direction x in origin.
Experimental Procedures
The experimental work was carried out in the
Strength Laboratory at UPM to test four-point-
bending on a single lap bolted joint. The results
obtained in the experimental measurements are
load-displacement and load-strain data. The
experimental load-displacement curves were
Figure 6. MPC 2 between upper plate and support plate
Figure 7. Boundary condition of the joint
337Suranaree J. Sci. Technol. Vol. 14 No. 4; October-December 2007
obtained directly from the testing machine.
Strains at selected points on the joint surface
were measured while bending forces were
controlled manually by the Instron Universal
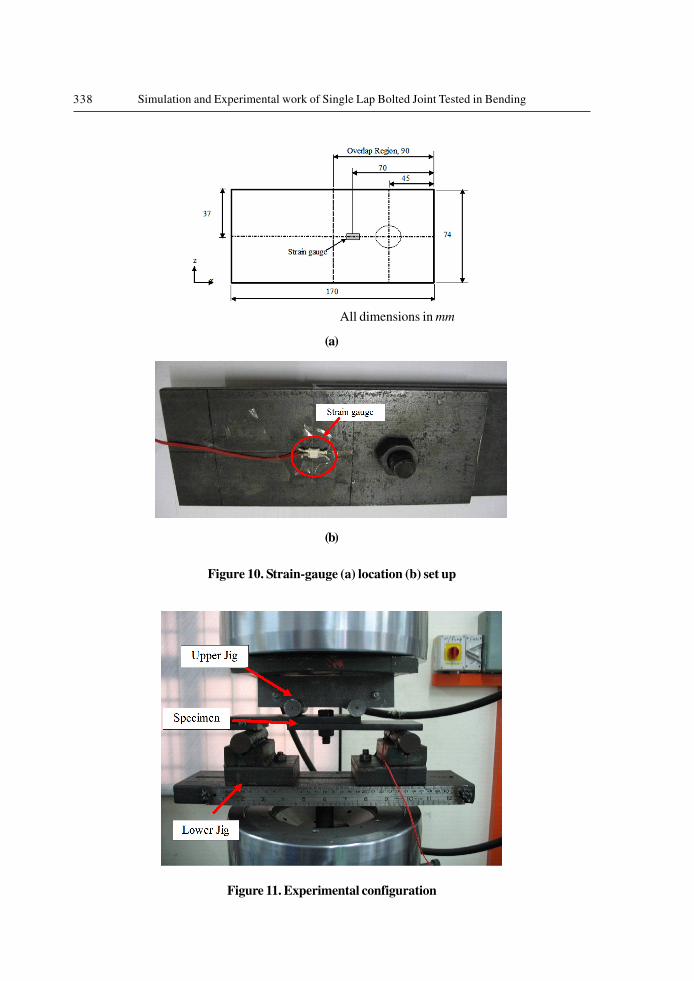
Testing Machine. The surface of the lower
plate was strain-gauged in the axial direction.
Figure 10 shows the position of the unidirec-
tional strain gauge, which had a 5 mm gauge
length. Axial strain in the plate is observed for
every increment of 1 kN. The specimen and jigs
were mounted on the universal testing machine
as illustrated in Figure 11. The bending load was
applied by the lower load cell vertically, while
the top load cell was fixed. The application of
the load was controlled manually to obtain the
strains measurement for every increasing load
level.
Results and Discussion
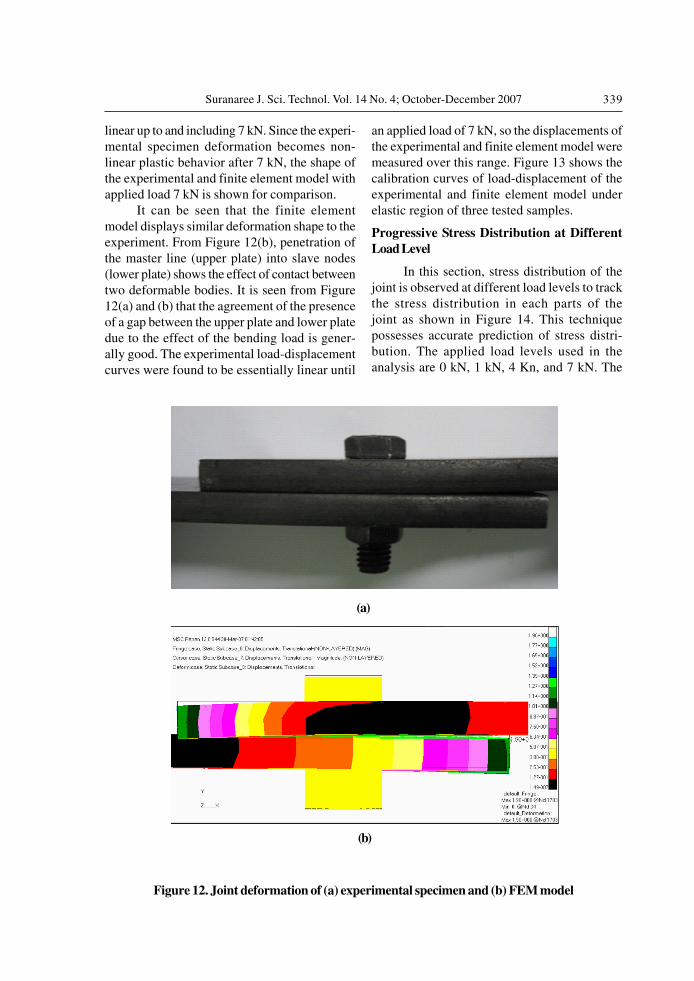
Joint Deformation
The deformed shape of the finite element
model is shown together with the actual defor-
mation in Figure 12. The experimental load-
deflection curves were found to be essentially
Figure 8. Clamping force in uniform pressure
Figure 9. Application of bending load
338 Simulation and Experimental work of Single Lap Bolted Joint Tested in Bending
Figure 10. Strain-gauge (a) location (b) set up
Figure 11. Experimental configuration
All dimensions in mm
(a)
(b)
339Suranaree J. Sci. Technol. Vol. 14 No. 4; October-December 2007
linear up to and including 7 kN. Since the experi-
mental specimen deformation becomes non-
linear plastic behavior after 7 kN, the shape of
the experimental and finite element model with
applied load 7 kN is shown for comparison.
It can be seen that the finite element
model displays similar deformation shape to the
experiment. From Figure 12(b), penetration of
the master line (upper plate) into slave nodes
(lower plate) shows the effect of contact between
two deformable bodies. It is seen from Figure
12(a) and (b) that the agreement of the presence
of a gap between the upper plate and lower plate
due to the effect of the bending load is gener-
ally good. The experimental load-displacement
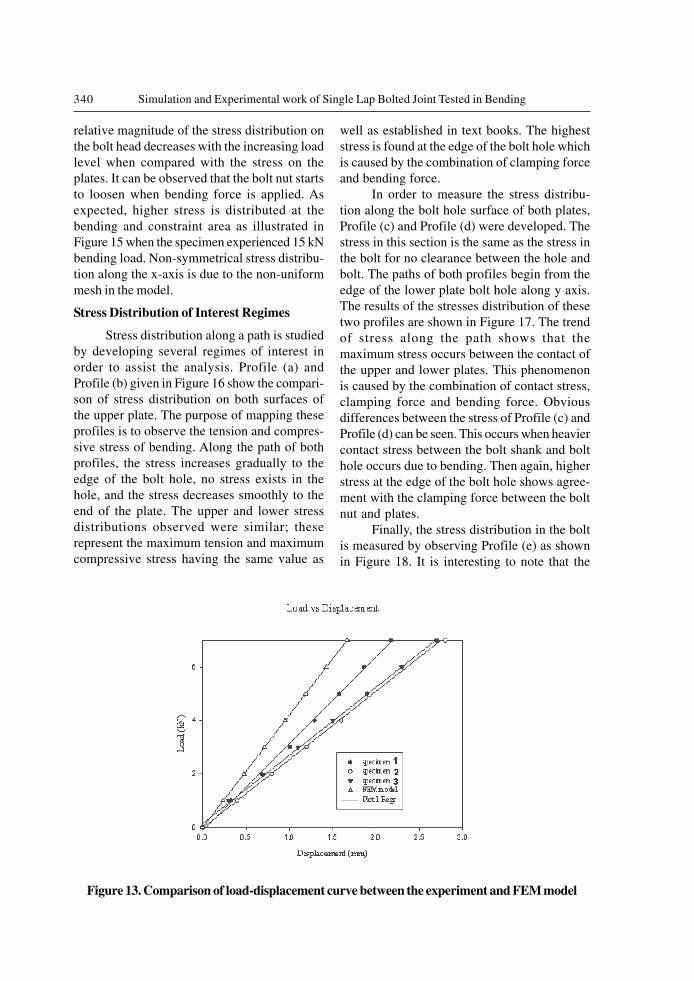
curves were found to be essentially linear until
an applied load of 7 kN, so the displacements of
the experimental and finite element model were
measured over this range. Figure 13 shows the
calibration curves of load-displacement of the
experimental and finite element model under
elastic region of three tested samples.
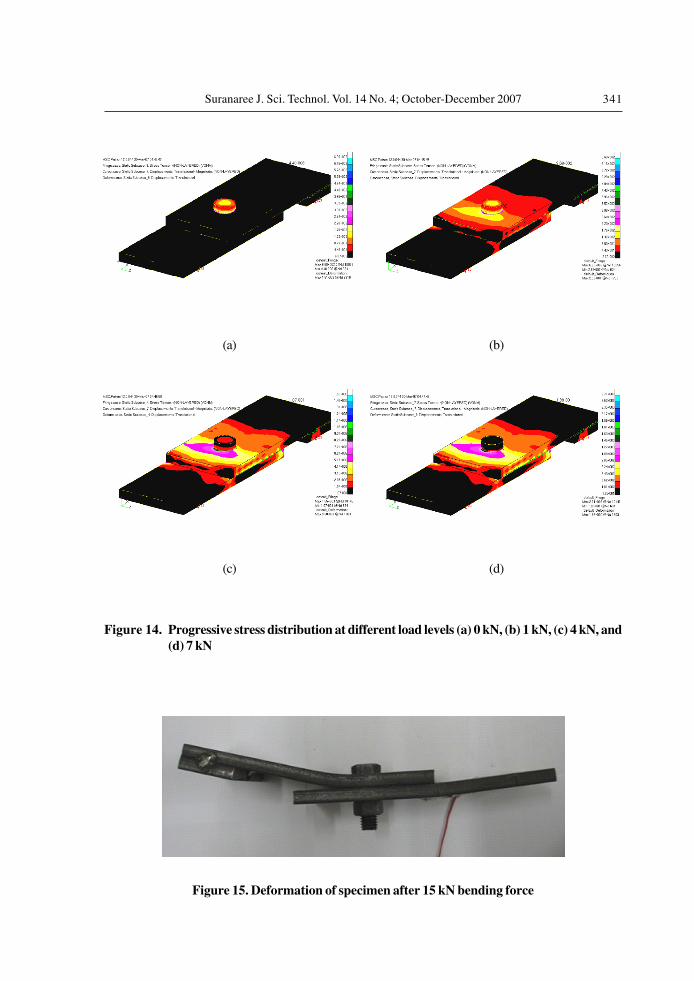
Progressive Stress Distribution at DifferentLoad Level
In this section, stress distribution of the
joint is observed at different load levels to track
the stress distribution in each parts of the
joint as shown in Figure 14. This technique
possesses accurate prediction of stress distri-
bution. The applied load levels used in the
analysis are 0 kN, 1 kN, 4 Kn, and 7 kN. The
(a)
(b)
Figure 12. Joint deformation of (a) experimental specimen and (b) FEM model
340 Simulation and Experimental work of Single Lap Bolted Joint Tested in Bending
relative magnitude of the stress distribution on
the bolt head decreases with the increasing load
level when compared with the stress on the
plates. It can be observed that the bolt nut starts
to loosen when bending force is applied. As
expected, higher stress is distributed at the
bending and constraint area as illustrated in
Figure 15 when the specimen experienced 15 kN
bending load. Non-symmetrical stress distribu-
tion along the x-axis is due to the non-uniform
mesh in the model.
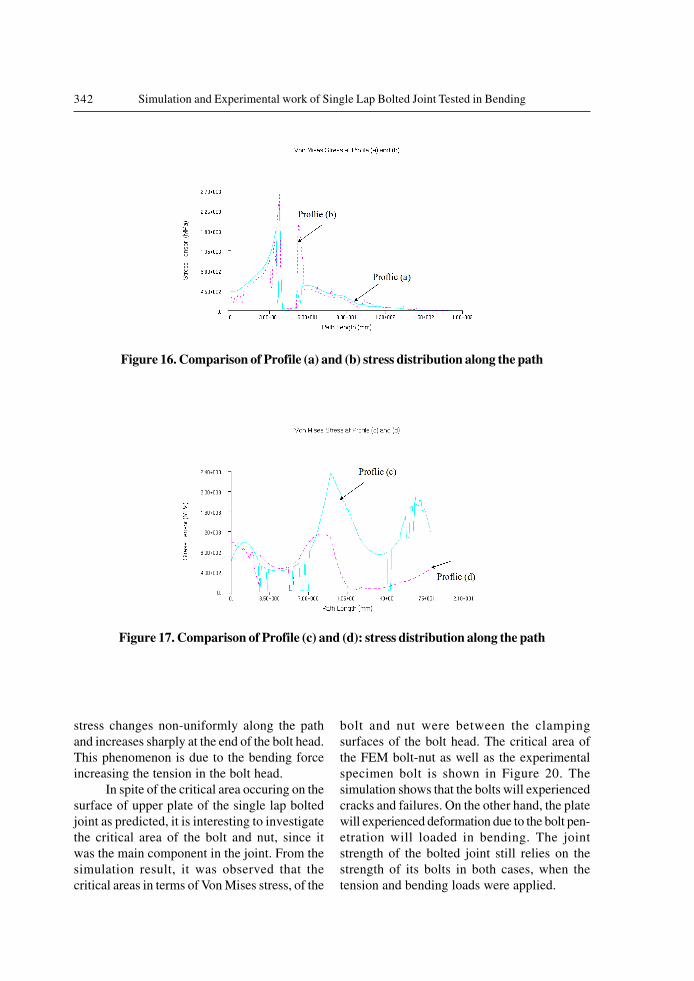
Stress Distribution of Interest Regimes
Stress distribution along a path is studied
by developing several regimes of interest in
order to assist the analysis. Profile (a) and
Profile (b) given in Figure 16 show the compari-
son of stress distribution on both surfaces of
the upper plate. The purpose of mapping these
profiles is to observe the tension and compres-
sive stress of bending. Along the path of both
profiles, the stress increases gradually to the
edge of the bolt hole, no stress exists in the
hole, and the stress decreases smoothly to the
end of the plate. The upper and lower stress
distributions observed were similar; these
represent the maximum tension and maximum
compressive stress having the same value as
well as established in text books. The highest
stress is found at the edge of the bolt hole which
is caused by the combination of clamping force
and bending force.
In order to measure the stress distribu-
tion along the bolt hole surface of both plates,
Profile (c) and Profile (d) were developed. The
stress in this section is the same as the stress in
the bolt for no clearance between the hole and
bolt. The paths of both profiles begin from the
edge of the lower plate bolt hole along y axis.
The results of the stresses distribution of these
two profiles are shown in Figure 17. The trend
of stress along the path shows that the
maximum stress occurs between the contact of
the upper and lower plates. This phenomenon
is caused by the combination of contact stress,
clamping force and bending force. Obvious
differences between the stress of Profile (c) and
Profile (d) can be seen. This occurs when heavier
contact stress between the bolt shank and bolt
hole occurs due to bending. Then again, higher
stress at the edge of the bolt hole shows agree-
ment with the clamping force between the bolt
nut and plates.
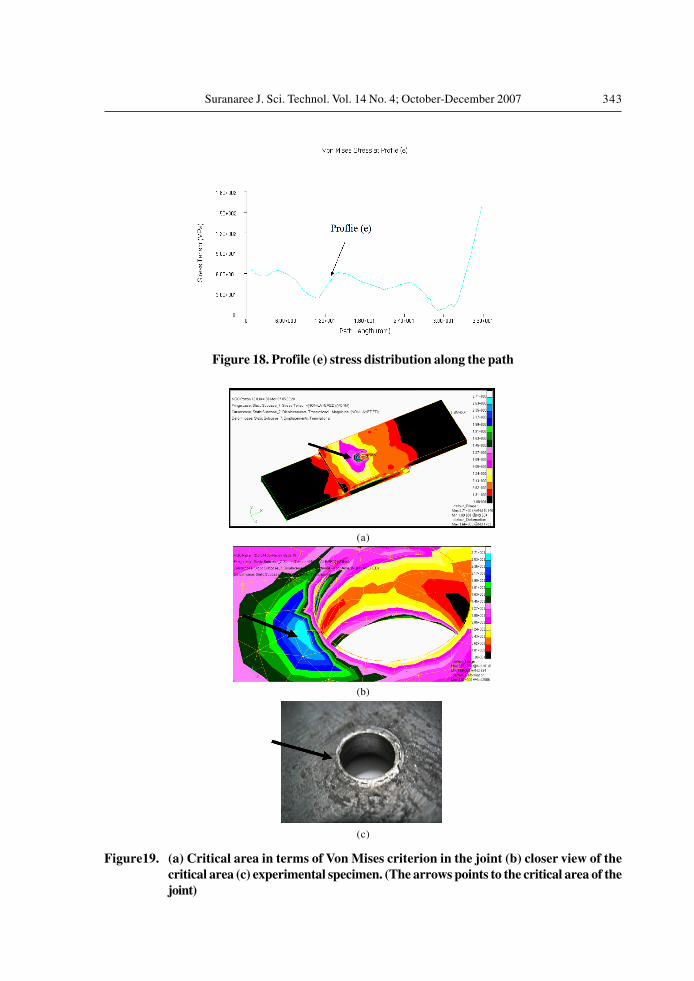
Finally, the stress distribution in the bolt
is measured by observing Profile (e) as shown
in Figure 18. It is interesting to note that the
Figure 13. Comparison of load-displacement curve between the experiment and FEM model
341Suranaree J. Sci. Technol. Vol. 14 No. 4; October-December 2007
(a) (b)
(c) (d)
Figure 14. Progressive stress distribution at different load levels (a) 0 kN, (b) 1 kN, (c) 4 kN, and(d) 7 kN
Figure 15. Deformation of specimen after 15 kN bending force
342 Simulation and Experimental work of Single Lap Bolted Joint Tested in Bending
Figure 16. Comparison of Profile (a) and (b) stress distribution along the path
Figure 17. Comparison of Profile (c) and (d): stress distribution along the path
stress changes non-uniformly along the path
and increases sharply at the end of the bolt head.
This phenomenon is due to the bending force
increasing the tension in the bolt head.
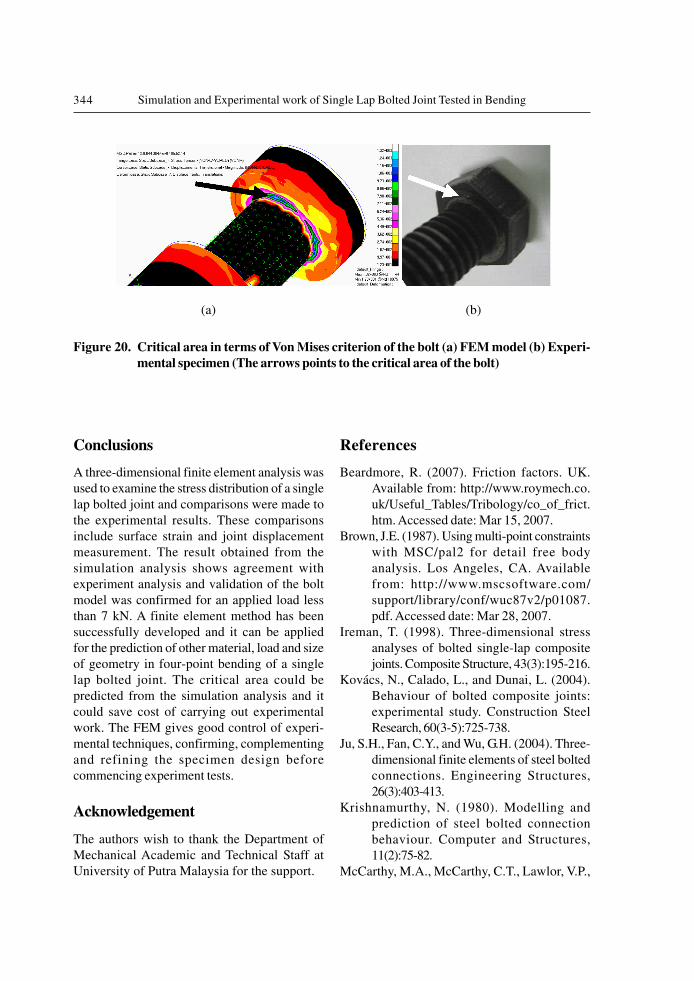
In spite of the critical area occuring on the
surface of upper plate of the single lap bolted
joint as predicted, it is interesting to investigate
the critical area of the bolt and nut, since it
was the main component in the joint. From the
simulation result, it was observed that the
critical areas in terms of Von Mises stress, of the
bolt and nut were between the clamping
surfaces of the bolt head. The critical area of
the FEM bolt-nut as well as the experimental
specimen bolt is shown in Figure 20. The
simulation shows that the bolts will experienced
cracks and failures. On the other hand, the plate
will experienced deformation due to the bolt pen-
etration will loaded in bending. The joint
strength of the bolted joint still relies on the
strength of its bolts in both cases, when the
tension and bending loads were applied.
343Suranaree J. Sci. Technol. Vol. 14 No. 4; October-December 2007
Figure 18. Profile (e) stress distribution along the path
Figure19. (a) Critical area in terms of Von Mises criterion in the joint (b) closer view of thecritical area (c) experimental specimen. (The arrows points to the critical area of thejoint)
(a)
(b)
(c)
344 Simulation and Experimental work of Single Lap Bolted Joint Tested in Bending
Figure 20. Critical area in terms of Von Mises criterion of the bolt (a) FEM model (b) Experi-mental specimen (The arrows points to the critical area of the bolt)
(a) (b)
Conclusions
A three-dimensional finite element analysis was
used to examine the stress distribution of a single
lap bolted joint and comparisons were made to
the experimental results. These comparisons
include surface strain and joint displacement
measurement. The result obtained from the
simulation analysis shows agreement with
experiment analysis and validation of the bolt
model was confirmed for an applied load less
than 7 kN. A finite element method has been
successfully developed and it can be applied
for the prediction of other material, load and size
of geometry in four-point bending of a single
lap bolted joint. The critical area could be
predicted from the simulation analysis and it
could save cost of carrying out experimental
work. The FEM gives good control of experi-
mental techniques, confirming, complementing
and refining the specimen design before
commencing experiment tests.
Acknowledgement
The authors wish to thank the Department of
Mechanical Academic and Technical Staff at
University of Putra Malaysia for the support.
References
Beardmore, R. (2007). Friction factors. UK.
Available from: http://www.roymech.co.
uk/Useful_Tables/Tribology/co_of_frict.
htm. Accessed date: Mar 15, 2007.
Brown, J.E. (1987). Using multi-point constraints
with MSC/pal2 for detail free body
analysis. Los Angeles, CA. Available
from: http://www.mscsoftware.com/
support/library/conf/wuc87v2/p01087.
pdf. Accessed date: Mar 28, 2007.
Ireman, T. (1998). Three-dimensional stress
analyses of bolted single-lap composite
joints. Composite Structure, 43(3):195-216.
Kovács, N., Calado, L., and Dunai, L. (2004).
Behaviour of bolted composite joints:
experimental study. Construction Steel
Research, 60(3-5):725-738.
Ju, S.H., Fan, C.Y., and Wu, G.H. (2004). Three-
dimensional finite elements of steel bolted
connections. Engineering Structures,
26(3):403-413.
Krishnamurthy, N. (1980). Modelling and
prediction of steel bolted connection
behaviour. Computer and Structures,
11(2):75-82.
McCarthy, M.A., McCarthy, C.T., Lawlor, V.P.,

345Suranaree J. Sci. Technol. Vol. 14 No. 4; October-December 2007
and Stanley, W.F. (2005). Three-dimen-
sional finite element analysis of single-
bolt, single-lap composite bolted joint:
Part I – Model development and valida-
tion. Composite Structure, 71(2):140-155.
Su, R.K.L. and Siu, W.H. (2004). Nonlinear
response of bolt groups under in-plane
loading. Engineering Structures, 26(3):403-
413.
Unified Engineering. (2006). Hex head bolt
makings. Aurora, IL. Available from: Inc.
http://www.unified-eng.com/scitech/bolt/
boltmarks.html. Accessed date: Apr 26,
2007.