EFFECTS OF DESIGN PARAMETERS ON A SINGLE-LAP, BOLTED …
81
EFFECTS OF DESIGN PARAMETERS ON A SINGLE-LAP, BOLTED JOINT; USING INTERNAL AND SURFACE STRAIN MEASUREMENT TECHNIQUES By John Woodruff A THESIS Submitted to Michigan State University in partial fulfillment of the requirements for the degree of Master of Science Mechanical Engineering 2011
Transcript of EFFECTS OF DESIGN PARAMETERS ON A SINGLE-LAP, BOLTED …

EFFECTS OF DESIGN PARAMETERS ON A SINGLE-LAP, BOLTED JOINT; USING
INTERNAL AND SURFACE STRAIN MEASUREMENT TECHNIQUES
By
John Woodruff
A THESIS
Submitted to
Michigan State University
in partial fulfillment of the requirements
for the degree of
Master of Science
Mechanical Engineering
2011

ABSTRACT
EFFECTS OF DESIGN PARAMETERS ON A SINGLE-LAP, BOLTED JOINT; USING
INTERNAL AND SURFACE STRAIN MEASUREMENT TECHNIQUES
By
John Woodruff
Composite materials have emerged as a method of engineering high strength structures to
specific tasks at a low weight cost. The strength to weight ratio makes composite materials ideal
for replacing metal components in vehicles, but the plates have to be thick enough to withstand
impacts during service use. Often, the weakest point of any composite panel is the point at
which it is fastened to the vehicle frame. A bolting method is identified as the fastening
mechanism of choice and is applied to a single-lap joint geometry for this study. Fastening
parameters included bolt-to-hole clearance, and the use of inserts.
A combination of measurements taken using embedded fiber optic strain gages, digital
image correlation, and stiffness data was used to determine the optimum design characteristics.
It was seen that clearance had a negative effect on the stiffness of the joint, increased clearance
from the zero percent clearance had an immediate effect on decreasing the stiffness of the joint.
Also, the fiber optic strain gages found that there was a significant strain concentration just
inside the interface between the overlap of the bolted composite to aluminum plates. Initial
increase in clearance was seen to increase this concentration. Also, in studying the use of inserts
it was found that an aluminum insert at the largest diameter tested of 0.75” outer diameter was
the best performing geometry. Overall, the design recommendations were that there should be
minimal to no clearance, with an aluminum insert with an outer diameter of 0.75”.

Copyright
John Woodruff
2011

iv
To my family and friends, for their constant guidance and support

v
ACKNOWLEDGEMENTS
Completion of this master’s degree would not have been possible without the dedication
of my research advisor, Dr. Gaetano Restivo. It has been a long path from the day I entered the
Composite Vehicle Research Center (CVRC) and Dr. Restivo’s research group. Looking back I
can understand the way I have been developed as a professional and engineer. Dr. Restivo’s
guidance provided direction in research, technical support in the laboratory, and in helping that I
successfully disseminated the information developed during research to the organizations that
support our work. Of course, there are many other intangible professional traits that I have
learned through interaction with Dr. Restivo that have led to my own personal success.
Also, I have to thank the faculty of the M.S. committee, Dr. Somerton and Dr. Liu. Both
Professors have provided substantial support during the time I spent as a student and researcher.
Dr. Somerton has helped lead me through class work as an undergraduate student, a graduate
student, as well as provided significant career guidance. Dr. Liu has taught me engineering
principles through the classroom and helped ensure that I was successful in fulfilling the thesis
requirement of the M.S. degree.
Further acknowledgement must be provided to the staff and other faculty of the CVRC.
Dr. Patterson has provided the necessary oversight to align the research with the goals of the
facilities funders. Also, Dr. Hong was generous to provide both the work space, and basic
equipment necessary to conduct the experiments described in this thesis. Use of Digital Image
Correlation (DIC) equipment was provided by Dr. Conway, and his expertise was crucial in
conducting a successful experiment.
Lastly, I would not be able to have had the opportunity to attend graduate school if not
for the generous contribution of the Tank Army Research Development and Engineering Center

vi
(TARDEC) for funding the researched I performed at the CVRC. Through the support of
TARDEC I have been provided with tremendous opportunity to learn research skills, develop
knowledge of engineering through a hands-on approach, and disseminate what I have learned to
those both inside and outside of the engineering field.

vii
TABLE OF CONTENTS
LIST OF TABLES ix
LIST OF FIGURES x
Chapter 1
Introduction 1
1.1 motivation 1
1.2 0bjective 2
1.3 background 3
1.3.1 purely numerical analyses 4
1.3.2 purely experimental analyses 7
1.3.3 both numerical and experimental analyses 9
1.3.4 fiber optic strain gage studies 14
1.3.5 literature review conclusions 18
1.4 tables and figures 21
1.5 references 31
Chapter 2
Effects of clearance on thick, single-lap, bolted joints using through-the-thickness
measurement techniques 33
2.1 introduction 33
2.2 composite manufacturing 35
2.3 experimental setup 37
2.4 experimental results 38
2.5 discussion 38
2.6 conclusions 40
2.7 table and figures 41
2.8 references 48
Chapter 3
Joints with inserts; combined strain analysis 49
3.1 introduction 49
3.2 experimental setup 50
3.3 experimental results 52
3.4 discussion 54
3.5 conclusion 56
3.6 tables and figures 59
3.7 references 66

viii
Chapter 4
Summary and conclusions 68
4.1 clearance conclusions 68
4.2 insert conclusions 68
4.3 design recommendations 70

ix
LIST OF TABLES
Table 1-1: Two percent offset bearing strength, as determined from
stress-strain diagram 23
Table 2-1: Material properties of the composite specimen 45
Table 2-2: Stiffness characteristics of each test configuration 45
Table 2-3: Material properties of finite element components 46
Table 3-1: Material properties of the composite panel in the 1 and 2 directions 60
Table 3-2: Stiffness of the single-lap, bolted joint 61
Table 3-3: Sensitivity test measurements; RSG to DIC comparison 64

x
LIST OF FIGURES
Figure 1-1: Hole diameters listed in box, (a) hole in inboard row,
(b) hole in outboard row 21
Figure 1-2: strain in bearing plane; μ = friction coefficient, λ = percent clearance 21
Figure 1-3: (left) Hole without insert, (right) hole with insert 22
Figure 1-4: Stiffness comparison for clearance conditions 22
Figure 1-5: Acoustic emissions hits vs. applied bolt torque: (left) 0.5 inch bolt, 22
(right) 0.25 inch bolt
Figure 1-6: Bearing strain value comparison for three insert variations 23
Figure 1-7: (left) Stress in bearing plane – pin connected, (right) Stress in bearing
plane – bolt connected 24
Figure 1-8: Load vs. Displacement data for four bolt tightness combinations;
two bolts used in configuration 25
Figure 1-9: (a) initial contact area, (b) intermediate, (c) final, (d) experiment 25
Figure 1-10: Tested insert geometries 25
Figure 1-11: Normalized WDS output compared to strain: (a) for RG830 filter
(b) Interference filter 26
Figure 1-12: Test specimen geometry variations (above), and listing of actual
specimens made (bottom) 27
Figure 1-13: Results of tensile and compressive tests 28
Figure 1-14: Longitudinal strain measurement (top), transverse strain
measurement (bottom) 29
Figure 2-1: Dimensions of the FOS gage locations within the composite panel 41
Figure 2-2: Location of the gage and edges of specimen 41
Figure 2-3: Gages are glued in place with epoxy resin 42
Figure 2-4: Vacuum bag setup for hand layup process 42

xi
Figure 2-5: (A) Mechanical mounting device, (B) Specimen loaded into MTS 43
Figure 2-6: (A) 0 percent clearance, (B) 3 percent clearance, (C) 5 percent clearance 44
Figure 2-7: Strain Profile for all clearance levels at 6000N 45
Figure 3-1: Lap joint loaded into the MTS machine 59
Figure 3-2: Insert Dimensions 59
Figure 3-3: Locations of RSG gages for sensitivity tests 59
Figure 3-4: Baseline, 12.7mm (0.5”) hole diameter with no insert 60
Figure 3-5: Strain profile of 15.875mm (0.625”) insert for all three metals 60
Figure 3-6: Strain profile of 19.05mm (0.75”) insert for all three metals 61
Figure 3-7: Surface strains in 1-direction taken down the center 62
Figure 3-8: Surface strains in the 2-direction taken above the hole at 6000N 62
Figure 3-9: (a) 15.875mm (0.625”) steel insert, (b) 19.05mm(0.75”) aluminum insert 64

1
Chapter 1. Introduction
1.1 Motivation
Large advancements have occurred in the field of composite materials for use in
automotive and aerospace application. Advancements have been generated by demands for
“greener”, more fuel efficient vehicles that also maintained or increased overall safety
capabilities. In order to maintain the safety aspects of a ground transportation vehicle, thicker
panels were developed. Panels were made thicker in order to provide a safe ride in a more
hazardous environment. Such an environment would include heavy day to day wear and tear, as
well as the prospect of collisions with other objects or vehicles. Other hazards, such as
projectiles, have been included in this environment when composite panels were to be used in
military vehicles. Failure of the composite panel by impact with these objects has been a real
possibility.
The location where the composite panel is fastened to the metallic vehicle frame was of
great importance. At this location, stress concentrations developed upon impact with objects in
the course of the vehicle’s journey. And stress concentrations may cause the panel to fail. If a
composite panel was to be utilized to its full potential, then the load transfer between the
composite panel and the aluminum frame of the vehicle would have to be further developed.
Bolting was chosen as the means of fastening since it provided the fastest method of securing or
removing a panel from a vehicle frame, while still providing a strong connection. The single-lap
bolted joint was a standard test setup for composite fastening of this type. The test setup
consisted of a single composite plate bolted to an aluminum plate of equal dimensions.

2
Several parameters surrounding the single-lap, bolted joint have significant impact of the
strength and load-distribution properties of the joint. One such parameter is clearance between
the bolt and the hole. When a clearance existed and the lap joint was being loaded in tension, the
bolt would tilt, which provided a variation in the contact surface area between the bolt and the
hole surface. A variation in contact surface area allowed strain concentrations to build around
narrow segments of the hole. Strain concentrations lead to failures at high loads. Knowing the
full effects of clearance can determine when a panel must be removed from field use. Another
parameter was the use of a sleeve, or insert, between the bolt and the hole. An insert can help
modify the load distribution properties of the joint to alleviate strain concentrations. Several
different materials and sizes were available for the insert and provide different responses to the
applied load. Optimization of the two joint parameters, clearance and use of inserts, was vital for
determining the strongest available joint configuration.
1.2 Objective
The overall goal is to determine the optimal design parameters for fastening composite
panels to vehicles for use in ground transportation. In order to make such determinations, a
strong understanding of the fastening mechanism, the single-lap, bolted joint, must be obtained.
To do this, several measurement techniques are employed to take experimental measurements on
the surface of the composite panel, and internally. Traditional surface measurement techniques
using resistance strain gages are used as well as in addition to more advanced digital image
correlation (DIC) techniques, which are brought on to discover full-field strain maps. Internally,
embedded fiber optic strain gages (FOSG) will provide experimental measurements right at the
strain concentration locations during loading.

3
As a second parameter of the study, the ability to take strain readings at finite locations
within the composite panel is explored. It was a goal of the study to show the reliability of
embedded fiber optic strain gages in various geometries and loading conditions.
Lastly, the effects of the parameters of the joint are understood through experimental
analysis. Effects of an incremental increase in clearance will be determined. Also, the uses of
various material and size inserts will be shown. In the conclusion of the study will come the
final recommendations for the most effective geometry of the joint.
1.3 Background
Researchers have used numerous tools to develop knowledge on the single lap joint.
These tools are identified as two major categories, one being numerical studies, the other being
physical experimentation. Numerical studies are done using mainly commercial code such as
Abaqus or ANSYS with LS-DYNA, but there are exceptions. Physical experimentations are also
common and are carried out through various methods such as resistance strain gages, acoustic
testing, digital speckle photography and many others. Often both numerical and experimental
studies are used as a means of further validating results for a given experiment. A summary of
research performed on variations of the parameters of the lap joint is given here and separated
into three categories, purely numerical studies, purely experimental studies, and studies that
contain both numerical and experimental work.

4
1.3.1 Purely Numerical Analyses
Further investigation of the behavior of a single lap bolted joint was conducted by
Tserpes et al. (2002). In this configuration one plate was a composite material while the other
was aluminum. This study looked at the constructiveness of using Hashin’s failure criteria as
well as a modified version of the same criteria to further develop the accuracy of a 3-D
numerical model. This model was created using ANSYS FE code and incorporated eight-noded
SOLID46 3D ANSYS elements. Hashin’s failure criterion incorporated the shear stress
contribution toward failure. It was seen in the results of the properly constructed model that both
transverse normal and shear stresses affected the matrix strength. Failure was said to occur when
the first significant irregularity or change in the slope of the load-displacement curve took place.
It was also noticed that the incorporation of the shear stress causes conservative estimates of
when failure occurred. Incorporation of the Hashin failure criteria showed improvement since
prior to the involvement of this criteria FE results generally failed quicker than an actual
specimen would. The model was eventually validated against reference load-displacement data.
Effects of pitch distance, row spacing, end distance and bolt diameter on multi-fastened
composite joints has been studied by Chutima et al. (1996) to see the influences of such
parameters on the load distribution on a double lap joint. A two-dimensional FE model has been
employed to investigate these parameters. Results show that friction between the pin and
composite plate will have negligible effect on the load transfer between pins. Also, the outboard
pin of the inboard row experienced the highest stresses under a load. Further, when the pitch
distance exceeded approximately six times the pin diameter, load transfer between pins is almost
unaffected. Varying edge distance between one and three times the pin diameter produced a

5
more uniform load transfer. As far as bolt diameter was concerned, the lesser diameter holes
have a higher ratio of radial stress to net tension stress and this trend is represented in Figure (1).
In this figure the vertical axis represents the stress in the bearing plane normalized by the net
tensile stress seen in the region between outer hole rows.
Effects of friction, clearance, bolt elasticity, stacking sequence and clamp-up on the
contact surfaces around the bolt of a double lap bolted composite joint were studied by Chen et
al. (1995). These results discovered that the shape of the contact surface and the distribution of
contact points varied significantly during the whole contact process. Data showed that clearance
decreased the load capacity of the composite laminate by increasing strains in the bearing plane,
proving to have a negative effect on the design. This data is represented in Figure (2) for two
values of friction coefficients and is compared against reference experimental data.
Lastly, it was seen that “proper clamping torque will smoothen the failure of the
structure”. This stemmed from the washer causing lower tensile inter-laminar normal stress, or
higher compressive inter-laminar normal stress around the boundary of the hole. Verification of
this study was obtained through comparison with reference experimentation data.
A study involving metallic inserts was performed by Kradinov et al. (2005). This study
was performed to determine the results of varying the thickness and lay-up of the laminates,
while using metallic inserts, on the overall strength of the joint. To test the thickness variable a
double lap joint of two composite laminates sandwiching an aluminum plate was created. The
aluminum plate was of a uniform thickness of 0.31”, while the laminate plates vary in cross

6
section (thickness), and lay-up. The lay-up of each section was [(45/0/ -45/0)2/0/90/45/0]s,
[(45/0/-45/0)2/0/90/45]s and [(45/0/-45/0)2/0/90]s and corresponds to areas of cross section
thickness of 0.1356”, 0.1243” and 0.113” respectively. Data has shown that the magnitude of the
radial stresses changed as the thickness of the laminate decreased. However, stress concentration
remains similar both in magnitude and behavior no matter the change in laminate thickness.
Also, stress distribution on the bolt remained unchanged throughout the varying laminate
thicknesses. Single lap joints were tested in this study as well as the double lap. In the case of
the single lap joint, the joint was comprised of one laminate plate bolted to an aluminum plate,
both with uniform thicknesses of 0.117” and 0.31” respectively. The laminate lay-up was
[(45/0/-45/0)2/0/90]s for the composite plate. Three bolts were used to combine the two plates.
It is seen in Figure (3) that inserts greatly reduced the magnitude of the stress and altered the
behavior of the stress, which is critical to predicting failure.
A study on the effects of clearance in a single-lap, bolted joint were conducted using
MSC.marc code by McCarthy et al (2003). In the study, a laminate of 5.2mm thickness was
bolted to an aluminum plate using a 8mm bolt. Four clearance conditions, values of 0, 1, 2 and 3
percent, were implemented to determine the effects on the stiffness of the joint. The results
clearly showed a reduction in stiffness with an increase in clearance. Contact between the bolt
and the hole was reduced significantly from the increase in clearance, resulting in the decrease in
the load bearing area, and hence stiffness as shown by Figure (4). Good agreement was seen
between the finite element analysis and experimental results.

7
1.3.2 Purely Experimental Analyses
Kostreva (2002) conducted acoustic emission non-destructive testing experiments to
determine the preload torque limit of bolted single lap composite joints. Each lap in the joint
consisted of the same IM7/8552 prepeg material with fiber configurations of (n(0, ±45, 90))s,
where n = 3, 4,5. The plates had a smooth finish on both sides and a thickness of 0.132”, 0.176”,
and 0.220”. In addition to this, three different bolts sizes, 0.125”, 0.250” and 0.500”, were
initially considered for use, but only the two largest bolts actually performed tests for each
laminate thickness. With the use of NAS1587-8 washers and self locking thread nuts it was seen
that the bolt threads would shear before the laminate was damaged. Evidence of this is shown in
Figure (5), which reflects that bolt failure occurs at approx the 22 ft-lbs range and from
inspection of the laminate afterward producing no signs of damage. Differences between the
acoustic emissions hits between the graphs are from there being hits registered from the turning
of the washer, while applying the torque, for the 0.5 inch bolt, which was eliminated in the 0.25
inch bolt test by applying a calcium grease. These tests indicated that when determining torque
preload, there was little to be concerned about in the area of damage to the laminate.
Bolt-hole clearance effects on joint strength are studied by M.A. McCarthy and V.P.
Lawlor et al (2002). A single lap joint configuration consisting of an aluminum plate and a
composite plate meeting ASTM standard D5961/D5961 M-96 with a single, titanium, 8mm bolt
was tested and measurements in the bearing plane were taken using extensometers. Also, torque
levels of 0.5 Nm, representing a finger-tight configuration, and a torque level of 16 Nm were
used on a specimen with a protruding head bolt and a quasi-isotropic layup in the experiment.
Another specimen was used with a protruding head bolt, finger-tight configuration and a zero-

8
dominated layup. Four different clearance values were used in the experiment, those being neat-
fit, 80μm, 160μm, 240μm, representing clearances of zero percent, one percent, two percent and
three percent. It was noted form previous studies that the allowable percentage of clearance
decreased with an increased hole diameter. Results from this experiment showed that ultimate
displacement was larger for larger clearances. Clearance does result in a change in joint
stiffness, with the larger clearance resulting in the lower stiffness. In terms of two percent offset
bearing strength, only finger-tight joints with protruding head bolts show a significant effect. An
increase in clearance at first provides for an increase in strength, and then a decrease in strength
for the larger clearance values, this is seen in Table (1)
Also, there was a trend in the ultimate strength that presented 80μ as the optimum
clearance. For the fully pre-torqued, quisi-isotropic configuration no clear trend was developed.
Herrera-Franco et al (1992) examined the possibility of using a plastic inserts versus
aluminum inserts in double lap composite joints. The idea was to determine if using a plastic
insert that had material properties weaker than that of the composite plate could then help to
plastically deform the insert to fill any void created between the plate and pin during loading.
This would in theory increase the contact surface area and lessen strain concentrations. High
sensitivity Moiré interferometry was used to measure surface strains in the plates. Results
between the plastic insert and the aluminum insert were very different. Both inserts lessened
stress concentrations in the bearing plane and in the ligament areas, the plastic insert lessened
bearing stress by 50 percent in the area approximately two radii from the hole and the shearing
stress by 50 percent in the same area, while the aluminum lessened the bearing stress by

9
approximately 75 percent in the same region and the shearing stress by about 90 percent in that
region. It is interesting that a slight increase in tensile stress is seen in the ligament region for the
plastic insert while this stress decreased by about 90 percent for the aluminum insert. This is
explained graphically in Figure (6)
1.3.3 Both Numerical and Experimental Analyses
In order to use FEA in three dimensions as an effective modeling tool it must be shown to
correlate well with experimentation. Three-dimensional FEA can accurately model effects in the
third dimension on the lap joint, such as bolt tightness, making it a powerful tool. McCarthy et
al. (2005) have produced a model which strongly correlated analysis results with what can be
expected in physical experiments. Their model was a single lap single bolt configuration with a
composite surface mounted upon an aluminum surface and created using the MSC.Marc code.
By defining contact bodies as sub-parts of joint components, then using a contact table to define
which bodies would come into contact with each other, further computational efficiency was
achieved. It should be noted that the more contact surfaces available the higher the
computational time. Further, this particular model noticed significant secondary bending which
created a saddling effect. Their model tried to minimize overhanging nodes and refined a non-
over-lap region. For an even more accuracy, use of assumed strain formulation with first order
elements was implemented. There was a routine that allowed separate tensile and compressive
properties to be implemented. It was noted in the research that while computational time is
decreased by modeling the washers as part of the bolt, it did not accurately model the physical
characteristics of the system. Another point was made to use the analytical rather than discrete
contact. This is so the outward normal from an element which identifies the stresses on the

10
element would be continuous in nature between elements rather than piecewise. The piecewise
approach did not allow for proper movement of elements about each other and so they get stuck
so to speak, which provided an inaccurate model. Good agreement was found between the
numerical model created and with the experimentation done using 3mm length strain gages,
although some improvements were made.
McCarthy et al (2005) examined two methods used to model friction using finite element
software and compared the results with experimental data to further understand how to improve
finite element modeling capabilities. The code used for numerical modeling was MSC.Marc and
the physical experiment was performed on a specimen chosen to comply with ASTM standards
and made of a single lap joint of two composite plates with layers made with HTA / 6376 high-
strength carbon fiber-epoxy material. The specimen was loaded into a Zwick mechanical testing
machine for analysis. The methods of modeling friction in question are a “continuous” friction
model and the other is known as the stick-slip friction procedure. These models are used to
represent the contact motion and to deal with discontinuities that inherently exist in a function
representing such a motion. These discontinuities can cause convergence problems and had to
be examined to determine which was more accurate. The continuous model, which uses a
continuous function to represent the motion itself, did not match well against experimental
results. However, the stick-slip model provided numerical results that closely matched
experimental results.
Iancu et al, (2005) investigated the stress and strain of the bearing plane of a thick, single
lap joint with an aluminum plate and a composite plate bolted together. Measurements were

11
taken by embedded-polariscope photoelasticity and embedded resistance strain gages. Loading
was performed with a dead-weight level system. These results were compared to a FE model
created in Abaqus using C3D8I eight-node, solid elements. There was reasonable agreement
between experimental and numerical experimentation and it is seen in Figure (8) that the higher
the torque applied to the bolt the lower the maximum stress in the plate. However, if a certain
value of torque is exceeded, joint failure will occur.
Ekh et al (2004) tested for secondary bending in a single lap, multi-bolt joint comprised
of a composite plate manufactured from A54/8552, which is a fiber reinforced plastic, and an
aluminum plate from AA7475-T76 bolted together using titanium bolts. This study showed that
as load increased the bending near the edges of the plate increased, although secondary bending
did decrease. Also, bending is seen to be more severe for the composite plate in the region
where it does not overlap with the aluminum plate. Results from FE analysis using Abaqus
matched well with experimental results found from digital speckle photography (DSP).
John D. Pratt et al. (2002) conducted a study to decide what influence the head angle and
head size of a countersink bolt would have on single lap single bolt joints for panels constructed
of three different materials. These materials were, 2024-T3 clad aluminum alloy, 7075-T6 clad
aluminum alloy and annealed Ti-6Al-4V titanium alloy. It was thought that by varying bolt head
geometry the joint elongation would vary. Tests were conducted using bolts with geometries
that varied five different head angles and five head heights. Results showed that bolt head height
had a greater effect on joint elongation than head angle. Also, it was seen that for thinner panels,
80 degree head angle was the optimum design, while for thicker panels the 120 degree head

12
angle was best. Overall, thinner heads produced the best results due to maintaining the straight
hole bearing area. Parameter effects were determined by measuring the deformation energy
necessary for a joint elongation equal to 9 percent of the 4.0 mm fastener shank diameter against
the panel thickness for the case of 2024-T3 clad aluminum. Varying head angles in ten degree
increments between 80 and 120 degrees were incorporated into the tests.
A study conducted by Nassar et al. (2007) found strong correlations between the behavior
of a composite material in a single lap double bolted joint to the tightness of the bolts
themselves. In conducting the study the joint was modeled numerically using Abaqus, which
was a 3-D model comprised of Brick-C3D8R elements. The results from the numerical study
were then compared to experimental testing performed on a MTS tensile machine for validation
with damage assessment done using an optical microscope. Between the two bolts of the joint,
four different combinations of tightness were observed. Those combinations being both tight,
both loose, one tight and one loose, and then switching which bolt was tight and which one was
loose. It was seen that delamination occurred around the surface of the composite for loose
bolts. Loose bolts could also cause inter-laminar delamination. When bolts where held tight,
the matrix and fiber cracked when the washers were placed eccentrically around the holes.
Tightened bolts created lateral support for the joint which ultimately ended up causing fiber
compressive failure in the joint. Most importantly it should be noted that two bolts were
necessary in order to cause fiber compressive failure in the composite since the lateral support is
necessary. It should be observed that there was strong comparison between the numerical results
and the experimental results for load displacement data, which is represented for all four
13
combinations in Figure (11). This data shows how tight bolts are superior to loose bolts by
allowing a higher stress prior to bearing failure.
C.T. McCarthy and M.A. McCarthy used the three dimensional model created as
mentioned previously to then study the effects of bolt-hole clearance. The model was a single
bolt single lap configuration with a composite surface mounted on an aluminum plate with an
8mm hole. It was found that during the loading process the shape of the contact surface and the
distribution of contact points would vary. This phenomenon is displaced in Figure (12).
Less of a contact surface is achieved between the bolt and the hole when a clearance was
made larger. Measurements show that across the shear plane the contact area is 105 -110
degrees when the clearance was made significantly large. This is compared to 160 – 170 degrees
being seen when there is no clearance. Of course, less contact surface and still applying the
same load lead to a larger stress on the contact surface. More specifically, the radial stress was
seen to increase with increased clearance, as well as the tangential stress to less of a degree.
Also, FEA results show that an accurate modeling of the decrease in stiffness of the joint was
achieved. Finite Element results compared well with experimental results obtained by 3mm gage
length strain gages.
Experiments have been conducted by Camanho et al. (2005) to investigate the ability of a
metallic insert, which is bonded to the composite material, to strengthen the single shear lap
joint. In order to determine the best geometry of the insert, a numerical study on three insert

14
geometries was performed. Abaqus was used to create a 3-D model comprised of 20-node
laminated brick solid elements and the insert geometries can be seen in Figure (13).
It was determined that insert A had the optimum results. Data concluded that the
geometry of insert A promotes load distribution to the surface of the laminate and therefore a
higher yield load for the adhesive is predicted. With this known the experimental study to
determine the damage initiation could be carried out using insert A. In the experimentation the
insert was made of aluminum and was placed through two composite laminate sheets of
unidirectional Texipreg HS 160 REM CFRP. Also, the insert was secured to the laminate using
an epoxy adhesive (Araldite 420A/B). The two composite plates where then bolted together
using 6mm diameter steel bolts. The inserts have shown to increase the strength of the lap joints.
In fact, damage occurred at only 5.00 Kn load with no insert, but did not begin to be seen until
10.10 Kn when insert A was present. These results were determined using piezoelectric acoustic
emission (AE) transducers mounted on the specimen to determine damage initiation.
Conclusions drawn from this study are that the use of bonded metallic inserts increased
the failure load, the efficiency of single-shear lap joints, and the load corresponding to the onset
of damage in the composite.
1.3.4 Fiber Optic Strain Gage Studies
A complete system for measuring strain using Bragg grating fiber optics strain gages and
a wave demodulation system, used as a strain interrogator, was developed and validated by Melle
et al (1993). Advantages to using this system are rooted in the ability of it to provide a linear

15
output behavior. This type of output behavior eliminates measured direction ambiguity and
provides system interruption immunity, and such immunity would indicate that there is an
environmental insensitivity.
A simple setup was developed for testing this strain interrogation system, known as the
wavelength demodulation system (WDS). A 1.0 cm Bragg grating in 3M low-birefringent fiber
was mounted on a cantilever beam, with an RSG gage mounted on the opposing side. The same
setup was created for a 1.5 cm Bragg grating gage made with a high-birefringant E-type fiber,
which would eventually be the only gage used in experimentation. The WDS was used with two
different filters being applied to the light reflected back from the gage, one for each separate
experimental setup. One of those filters was a high-pass RG830 colored glass filter and the other
an interference filter. Each setup then provided a different filtering function associated with each
filter that adjusts the intensity of the back reflected light from the gage. Different linear regions
exist for each filtering function, which allows for a different measureable wavelength domain for
each filter
Due to the gage used in experimentation being made of a hi-birefringence fiber, there is a
slow and fast axis for the reflected signal. Results showed a sensitivity of 0.648 pm/με and
0.644 pm/ με for the fast and slow axis respectively. The intensity of the filtered back reflected
light is compared to a unfiltered reference intensity. This ratio of filtered to unfiltered light
intensity determined the output of the WDS. An applied strain should provide a linear output
relationship to this light intensity ratio since the filtering function is applied through it’s linear

16
range. Actual output of the WDS under each filtering condition is normalized to the value seen
at zero strain and shown in figure (16).
It can be observed from these graphs that a slight non-linearity exists. This phenomenon
is due to the fiber having a hi-birefringence. This birefringence causes the WDS to have to
average the signals of the fast and slow axis to provide an overall output value. However, this
problem can be avoided by using a lo-birefringence fiber, and a truly linear output relationship
would be found. . Also, for the RG830 filter a range of 35,600 με was found, compared to just
4335 με for the interference filter. These values are deterimined by the limited linear range of
the filtering functions.
In a study conducted by Lopez-Anido et al (2003) extrinsic Fabry-Perot interferometric
(EFPI) fiber optic strain gages were embedded in composite panels made of 14 layers of E-glass
unidirectional fiber. The optimum size fiber optic cable was found to be 80-93μm polymide and
80-103μm acrylate coating for testing conducted under longitudinal and transverse tension.
Gages were embedded in plies seven and eight in directions parallel and perpendicular to the
fibers by being stitched to each ply. Stitching the gages to the plies was determined to be the
most effective method of securing them to the ply to prevent slippage, while still remaining non-
evasive in nature. It was found that orientating the gages parallel to the surrounding fibers was
the optimum condition since this did not allow for large resin pockets to build around the gage.
Leads for these gages were made to protrude out of the side of the specimen, known as the
ingress/egress point, and were protected with an additional layer of Teflon sheathing over the
existing sensor sheathing. Panels were constructed using a vacuum assisted resin transfer

17
molding process. Tensile and compressive tests were performed on the specimens of various
shape and orientation as listed Figure (17).
Results showed that embedded EFPI sensors oriented both parallel and perpendicular to
the fiber reinforcement direction did not cause significant detrimental effects on the tensile and
compressive modulus or strength of the E-glass/ vinyl ester composites, which is shown in
Figure (18).
Also it should be stated that in the most difficult challenge in conducting this research
was the prevention of sensor lead damage upon panel construction. Observations during testing
showed that a signal loss could occur if the radius of the bend in the cable was less than 12.7 mm
(0.5 inches). Another interesting point is that EFPI sensors behave the same whether embedded
in the composite material or mounted on the surface due to their insensitivity to transverse strain.
This insensitivity occurs due to the air gap between the partial mirrors in the not having a
photoelastic effect.
Mawatari et al (2008) set out to create a numerical model based on experimental data that
could predict the transverse and axial strains seen in a fiber optic strain gage with two Bragg
gratings. It has been seen that when a transverse strain is applied to a polarization maintaining
fiber and that strain was not equal in value to the poisons ration multiplied by the axial stress, a
birefringent condition was created. This condition allowed for two variations of the reflected
wavelength to be send back, one along the fast axis, the other along the slow axis. This change
in wavelength from the original input, unstrained signal, can then be used to measure the

18
transverse strains. Experiments proved that the longitudinal strain varies linearly with the
wavelength, while the transverse strains did not. This is seen below in Figure (19).
Initially a linear model was created, but this was not significant due to large errors.
These large errors are derived from the fact that the relationship between the transverse strain
seen and the wavelength sent back to the interrogator was non-linear. The non-linear model
which accounts for this phenomenon is much more accurate as shown in Figure (20).
1.3.5 Literature Review Conclusions
The composite to aluminum lap joint has been studied and developed by many research
groups. It was seen in these studies that increasing the contact surface area between the bolt and
the hole was of great importance in decreasing stress concentrations and improving the strength
of the joint. Several factors affect the ability to maximize this contact surface area, and therefore
maximize the strength of the joint itself. Some of these factors include bolt-to-hole clearance,
the geometry of the hole itself, and weather or not an insert is present in the hole.
Hole geometry was of interest, although few adjustments have been made to the hole in
order to increase joint strength. Hole diameter has been studied as a parameter and it was seen in
multi-bolt, multi-row specimens that smaller diameter holes lead to higher stress concentrations
in the bearing plane as shown in Figure (1). As a further adjustment to the hole-bolt interface,
countersink bolts were tested and were shown not to be effective versus bolts that maintain the
straight hole bearing area. This trend was displayed best in Figure (8), where thinner heads
could withstand higher deformation energies under the same joint elongation. Beyond this there

19
was little research dealing with changing hole geometry and further work could be employed to
study hole geometry as a parameter more fully.
Clearance between the bolt and the hole was a parameter widely studied with very
consistent results. In single lap joints, experiments found that large clearances decreased the
contact surface area, which lead to larger stress concentrations. In fact, in the study by C.T.
McCarthy and M.A. McCarthy, for a hole of 8mm diameter, the contact surface area was
decreased from 160 to 170 degrees around the hole for minimal clearances to about 105-110
degrees for larger clearances. This was further looked at with the double lap joint by Chen et al
(1995) and like the single lap joint it was found that the shape of the contact surface and the load
distribution of contact points varied significantly during the whole contact process. This resulted
in higher stress concentrations for larger clearances as represented by the presence of high strain
values depicted in Figure (2) above. Clearance was looked at from the perspective of finding
proper tolerances and interestingly, results showed that for a finger-tight protruding head bolt, a
small clearance can provide an increase in joint strength, followed by a trend of decreasing joint
strength for any further increase in clearance. Table (1) illustrated that for an 8mm bolt,
clearance values between neat-fit and 160μm show the possibility of the bearing plane to hold
higher values of stress than when either no clearance is present or values greater than 160μm are
present. This trend of seeing a small increase in strength followed by a decrease leaves open the
possibility of finding more exact tolerances. Further research should be focused on a narrow
range of clearance values in search of finding proper tolerances. Finding these tolerances can
include a focused on different hole sizes or the inclusion of pre-tension effects.

20
The most significant factor in increasing the joint strength has been the inclusion of an
insert into the bolting configuration. Aluminum inserts in single lap joints have nearly doubled
the load necessary for initiation of damage to the matrix material. In one study of a single lap
joint by Camanho, P.P, Tavares, C.M.L., et al. (2005) it was seen onset of damage to the material
increased from 5.0 Kn to 10.1 Kn with the inclusion of the aluminum insert and is further
illustrated in Figure (12). The idea of using inserts was extended to the multi-bolt setup for
single lap joints, which saw a greatly reduced magnitude of the stress and altered the behavior of
the stress in the joint as compared to a joint with no inserts. Actually, the radial stress from the
hole decreased from about 320 lb/in to approximately120 lb/in in this joint configuration and is
shown graphically in Figure (3). Further development lead to changes in the insert itself. A
study using “soft” inserts was conducted in which the “soft” insert is made of a material that
would deform under the load and hopefully fill any void between the bolt and the hole, thus
increasing contact surface area. However, results showed that this design did not decrease stress
concentrations as much as the aluminum insert had. In fact, the soft insert showed a decrease in
bearing stress of 50 percent, while the aluminum insert decreased bearing stress by 75 percent,
which can be referenced in Figure (5). Still though, insert design remains a promising area of
expansion for the study of increasing joint strength with areas such as insert geometry available
for future study.

21
1.4 Tables and Figures
Figure 1-1: Hole diameters listed in box, (a) hole in inboard row, (b) hole in outboard row
Figure 1-2: strain in bearing plane; μ = friction coefficient, λ = percent clearance,
P (
kN
)
ε (10-6
)
σr
/ σ
T
(a) inboard (b) outboard
0 40 80 120 0 40 80 120 Contact angle Contact angle
5
8 8
6.35 6.35
10 10
13 13
16 16
5
4
3
1
2
0
0
1
4
3
2
0 1000 2000 3000
2.0
3.0
4.0
1.0
Experimental
PAFEC (µ = 0 , λ = 0)
µ = 0 , λ = 0 µ = 0 , λ = 1% µ = 0.2 , λ = 0 µ = 0.2 , λ = 1%
σr
/ σ
T

22
Figure 1-3: (left) Hole without insert, (right) hole with insert
Neat Fit
80
microns
160
microns
240
microns
Percentage
change from
C1 (Models)
- -4.2% -8.5% -11.7%
Percentage
change from
C1
(Experiments)
- -1.9% -7.3% 10.4%
Figure 1-4: Stiffness comparison for clearance conditions
Figure 1-5: Acoustic emissions hits vs. applied bolt torque: (left) 0.5 inch bolt, (right) 0.25 inch
bolt
Angle, ϴ
Res
ult
ant
stre
ss, lb
/in
Res
ult
ant
stre
ss, lb
/in
Angle, ϴ
Aco
ust
ic E
mis
sion H
its
Torque (ft-lbs)
Aco
ust
ic E
mis
sion H
its
Torque (ft-lbs)
tangential
radial
tangential
400
200
0
-200
80
0
40
-40
-80
-120
0 60 120 180 240 300 360 0 60 120 180 240 300 360
radial
0 5 10 15 20 25
30
20
10
0
0 40 80 120 160 200
30
20
10
0

23
Clearance neat-fit 80microns 160 microns 240 microns
Average Value (Mpa) 529.8 541.2 517 490
Diff. from Neat-Fit - +2.2% -2.4% -7.5%
Table 1-1: Two percent offset bearing strength, as determined from stress-strain diagram
Figure 1-6: Bearing strain value comparison for three insert variations
Str
ain e
r
Position Y (mm)
No Insert Plastic Insert Aluminum Insert After Glue Failure Aluminum Insert Before Glue Failure
800.0
0.0
-8
00.0
-1
600.0
-2
400.0
-15.2 -7.6 0.0 7.6
D d
X
Y
XA
P
Edge of Pin Hole
Insert-Laminate Interface

24
Figure 1-7: (left) Stress in bearing plane – pin connected, (right) Stress in bearing plane – bolt
connected
Load (N) Load (N)
Pin Connection –shear stress Bolt Connection (2.82 Nm) – shear stress
τ23
(kP
a)
τ23
(kP
a)
D - EXP
E - EXP
F - EXP D - FEM E - FEM
F - FEM
50 100 150 200 250 1000 200 400 600 800
0
500
1000
2000
2500
1500
0
1000
2000
5000
6000
4000
3000

25
LT-TB = Loose top bolt – tight bottom bolt, TT-TB = Tight top bolt, loose bottom bolt
Figure 1-8: Load vs. Displacement for four bolt tightness combinations; two bolt configuration
Figure 1-9: (a) initial contact area, (b) intermediate, (c) final, (d) experiment
Figure 1-10: Tested insert geometries
(a) (b) (c)
(a) (b) (c) (d)
Load
(N
)
Load
(N
)
Load
(N
)
Load
(N
)
Displacement (mm)
Displacement (mm) Displacement (mm)
Displacement (mm)
(c) TT-TB (d) LT-LB
(a) LT-TB (b) TT-LB FEA
EXP.
0
1000
2000
3000
0.1 0.2 0.3 0.4 0.5 0.6 0 0.2 0.4 0.6
500
1000
1500
2000
2500
0
0 0.2 0.4 0.6
3000
2000
1000
0
3000
2000
1000
0 0.2 0.4 0.6 0
0

26
Figure 1-11: Normalized WDS output vs. strain: (a) for RG830 filter (b) Interference filter
Strain (microstrain)
Strain (microstrain)
WD
S O
utp
ut
(norm
aliz
ed u
nit
s)
WD
S O
utp
ut
(norm
aliz
ed u
nit
s)
(a)
(b)
800
1.06
1.05
1.04
1.03
1.02
1.01
1.00
0.99
0.98
0.97
0.96
0.95
0.94 -2400 -1600 -800 0 1600 2400
1.50
1.45
1.40
1.35
1.30
1.25
1.20
1.15
1.10
1.05
1.00
0.95
0 100 200 300 400 500 600 700 800 900 1000
R-squared: 0994
Standard Error:
98 microstrain
R-squared: 0.991
Standard Error:
28 microstrain
Loading
Unloading

27
Panel
Type
ASTM Test
Method
Fiber
Reinforcement
Direction
Length
(mm)
Gage
Area
Width
(mm)
Shape Tabbing
T0 D3039 0˚ 250 9 Rectangular Yes
T90 D3039/D638 90˚ 250 20 Dog bone No
C0 D3410 0˚ 180 12 Rectangular No
C90 D3410 90˚ 150 19 Rectangular No
Panels ASTM Test
Method
Panel
Thickness
(mm)
Number of Test
Specimen with
Embedded FOS
Number
of
Controlled
Test
Specimen
FOS Direction
Relative to
Fiber
Reinforcement
FOS Lead
Routing in
Grip Area
T0-1
T0-2 D3039
5.37
5.70
5
5
5
5 Parallel
Lateral
edge
End edge
T90-1
T90-2 D3039/D638
5.42
5.39
5
5
5
5 Perpendicular Later edge
C0-1 D3410 5.56 5 5 Parallel End edge
C90-1
C90-2 D3410
7.12
4.49
5
5
5
5 Perpendicular
Lateral
Edge
Figure 1-12: Test specimen geometry variations (above), and listing of actual specimens
made (bottom)
Test Specimen Geometry
Test Specimen: FOS Direction and Lead Routing

28
With Embedded Sensors Control (No Embedded Sensors)
Mechanical Property Mean
(Mpa)
COV
(%)
Mean
(Mpa)
COV
(%)
Mean
(Mpa)
COV
(%)
Mean
(Mpa)
COV
(%)
Panel T0-1 Panel T0-2 Panel T0-1 Panel T0-2
Fiber Volume Ratio,
Vf(%) 54.8 51.7 54.8 51.7
Longitudinal
Modulus, E1t 39,670 3.3 46,347 35.5 39,538 1.8 39,338 4.1
Longitudinal Tensile
Strength, F1t 662.1 31.4 486.8 27.6 842.1 3.3 720.6 4.7
Panel T90-1 Panel T90-2 Panel T90-1 Panel T90-2
Fiber Volume Ratio,
Vf(%) 54.3 54.6 54.3 54.6
Transverse Modulus,
E2t 11960 10.7 12,030 14.2 12,040 9 11,530 3.8
Transverse Tensile
Strength, F2t 29.1 16.2 29.32 16.4 31.95 11.5 32.27 4.7
With Embedded Sensors Control (No Embedded
Sensors)
Mechanical
Property
Mean
(Mpa)
COV
(%)
Mean
(Mpa)
COV
(%)
Mean
(Mpa)
COV
(%)
Mean
(Mpa)
COV
(%)
Panel C0-1 Panel C0-1
Fiber Volume
Ratio, Vf(%)
53 53
Longitudinal
Modulus, E1c
36,190 34.6 39,597 13.1
Longitudinal
Compressive
Strength, F1c
426.5 5.7 385.2 25.9
Panel C90-1 Panel C90-2 Panel C90-1 Panel C90-2
Fiber Volume
Ratio, Vf(%)
41.4 53.6 41.4 53.6
Transverse
Modulus, E2c
9184 19 11,635 7.9 8,438 11.7 10,249 23.5
Transverse
Compressive
Strength, F2c
92.35 5.5 100.6 2.8 94.58 4.8 102.8 4.2
Figure 1-13: Results of tensile and compressive tests
Effect of Embedded Sensors on Tensile Mechanical Properties
Effect of Embedded Sensors on Compressive Mechanical Properties

29
Figure 1-14: Longitudinal strain measurement (top), transverse strain measurement (bottom)
Wav
elen
gth
(nm
) W
avel
ength
(nm
)
Longitudinal Load P (N)
Transverse Load Q (N/mm)
L1 L2
L1 L2
1302
1301.8
1301.6
1301.4
1301.2
0 2 4 6 8 10 12
1305
1304
1303
1302
1301 0 0.5 1 1.5 2 2.5

30
REFERENCES

31
REFERENCES
[1] Tserpes, K.I., Labeas, G., et al. (2002) “Strength prediction of bolted joints in graphite/epoxy
composite laminates.” Composites: Part B 33: 521-529
[2] Chutima, Surachate, Blackie, Alvin P. (1996).”Effect of pitch distance, row spacing, end
distance and bolt diameter on multi-fastened composite joints” Composites Part A 27A: 105-110
[3] Chen, Wen-Hwa, Lee, Shyh-Shiaw, et al. (1995) “Three-dimensional contact stress analysis
of a composite laminate with bolted joint.” Composite Structures 30: 287-297
[4] Kradinov, V., Madenci, E., et al. (2005). “Bolted lap joints of laminates with varying
thickness and metallic inserts.” Composite Structures 68: 75-85
[x] McCarthy, M.A., McCarthy, C.T. (2003). “Finite Element Analysis of the Effects of
Clearance on Single-Shear, Composite Bolted Joints.” Journal of Plastics, Rubber and
Composites 32: 65-70
[5] Kostreva, K.M. (2002). “Torque Limit for Bolted Joint for Composites Part B
Experimentation.” NASA Technical Reports
[6] McCarthy, M.A., Lawlor, V.P., et al. (2002) “Bolt-hole clearance effects and strength criteria
in single-bolt, single-lap, composite bolted joints.” Composites Science and Technology 62:
1415-1431.
[7] Herrara-Franco, Pedro, Cloud, Gary L., (1992). “Strain-Relief inserts for Composite
Fasteners – An Experimental Study.” Journal of Composite Materials 26: 751
[8] McCarthy, M.A., McCarthy, C.T., et al. (2004). “Three-dimensional finite element analysis
of single-bolt, single-lap composite bolted joints: part I-model development and validation.”
Composite Structures 71: 140-158
[9] McCarthy, C.T., McCarthy, M.A. et al. (2005). “Experience with Modeling Friction in
Composite Bolted Joints” Journal of Composite Materials 39: 1881-1908.
[10] Iancu, F. Ding, X. et al (2005) “Three-dimensional investigation of thick single-lap bolted
joints.” Experimental Mechanics 45: 351-358
[11] Ekh, Johan, Schon, Joakim, et al. (2005). “Secondary bending in multi fastener, composite-
to-aluminum single shear lap joints” Composites: Part B 36: 195-208
[12] Pratt, John D., Pardoen, Gerard. (2002). “Influence of Head Geometry on bolted Joint
Behavior” Journal of Aerospace Engineering 15:4:136-153

32
[13] Nassar, Sayed A., Virupaksha, Vinayshankar L., et al. (2007). “Effect of Bolt Tightness on
the Behavior of Composite Joints.” Journal of Pressure Vessel Technology 129-1: 43-51
[14] McCarthy, M.A., McCarthy, C.T. (2004). “Three-dimensional finite element analysis of
single-bolt, single-lap composite bolted joints: part II-effects of bolt-hole clearance” Composite
Structures 71: 159-175
[15] Camanho, P.P, Tavares, C.M.L., et al. (2005). “Increasing the efficiency of composite
single-shear lap joints using bonded inserts.” Composites: Part B 36: 372-383.
[16] Melle, S. M., Liu K., Measures, R.M. (1993). “Practical Fiber-Optic Bragg Grating Strain
Gauge System”. Applied Optics. 32: 3601 – 3609
[17] Lopez-Anido, R., Fifield, S. (2003). “Experimental Methodology for Embedding Fiber
Optic Strain Sensors in Fiber Reinforced Composites Fabricated by the VARTM/SCRIMP
Process”. Structural Health Monitoring 247 – 254.
[18] Mawatari, T., Nelson, D. (2008). “A multi-parameter Bragg grating fiber optic sensor and
triaxial strain measurement” Smart Materials and structures 17

33
Chapter 2. Effects of Clearance on Thick, Single-Lap, Bolted Joints Using Through-the-
Thickness Measurement Techniques
2.1 Introduction
Clearance between the bolt and the hole of the composite panel has been an important
factor in the strength of the joint. When the lap joint was being pulled in tension, the bolt would
tilt, which provided a variation in the contact surface area between the bolt and the hole surface
through the thickness of the panel. The larger the contact surface area that was maintained
during testing, the better the load distribution between the bolt and the hole surface. Initial
clearance between the bolt and the hole was seen to have a significant effect of the ability to
maintain the maximum surface area contact and the strength of the joint.
In order to properly develop the single-lap, bolted joint, a literature review was conducted
to identify the current state of research on the topic. Papers were compiled and reviewed in order
to determine what was currently known about clearance in thick composite panels. Studies
reviewed included many numerical and experimental techniques.
Initially, the effects of changing the bolt tightness and shape were examined [1]. Results
showed that the single-lap, bolted joint maintained a greater stiffness and strength when the bolts
used did not have a countersunk head shape. The reason for this was simply that the straight-
hole bearing area was maintained for non-countersunk bolts. Also, the tightness of the bolt was
examined and experiments clearly showed that a higher torque value produced stiffer joints [2,3].

34
A study was performed with a thin single-lap joint with an 8 mm diameter hole was
tested for small clearance values [4]. It was seen that as clearance increased, the contact surface
area decreased from 160 – 170 degrees around the hole for a zero percent clearance condition to
105 – 110 degrees at the largest clearance value of three percent. The same author performed
another study which had shown the effects of clearance on stiffness and bearing strength was
affected [5]. In this study, increased clearance showed a decrease in joint stiffness. However
ultimate bearing strength was not affected by clearance. Other numerical studies had found
similar results when clearance was tested to determine the effects [6,7]. One such study
concluded that clearance decreased the load capacity of the joint and was overall a negative
design characteristic. This was a very general statement, but in line with other research groups
findings.
Interest in further analyzing clearance effects on the lap joint has led to developments in
measuring techniques. Fiber optic strain gages of various types have been considered for use in
taking through-the-thickness measurements within the composite panel. These gages have the
advantage of being very small in gage length, are immune to electromagnetic interference and
they can be embedded non-invasively into a composite panel [8,9]. The material properties in
the region of the gage do not change and point measurements of strain are available.
Measurements could then be used to experimentally validate finite element models.
One study exists as an attempt at developing an understanding of the strain profile at low
loads [10]. In this study, fiber optic strain gages were embedded within a thick 12.7mm (0.5”)
composite panel of the single-lap joint at regular intervals through-the-thickness above the hole.

35
Measurements using a loading frame setup then provided data for low loads of a strain profile
though-the-thickness. Results showed good correlation for pin joint setups with FEA models.
However, there was discrepancy between the FEA model for the bolted configuration with the
experimental data. It should be remembered that the tests in this study were conducted at low
loads.
The next logical step in the development of the lap-joint is to then use embedded fiber
optic strain gage technology to understand the effects of clearance. Creating a specimen similar
to [10] provides a more thorough understanding of the actual strain profile when tested through a
higher loading range. Also, changes in the strain profile above the hole when clearance is
present are experimentally determined.
2.2 Composite Manufacturing
A composite specimen for testing was constructed using a hand layup process with
vacuum bagging. The process included attaching the Bragg grating fiber optic strain gages to the
plies prior to creating the specimen. Then, once the gages were secured and their location
marked, the layup process began. The plies were inserted with the attached gages in the proper
order to know their location in the thickness direction of the final specimen.
The specimen tested was constructed from a plain weave S-Glass material and an epoxy
resin. The S-Glass was chosen due to having superior tensile strength than the E-glass. The
epoxy resin was 635 Epoxy and used a 3:1 ratio of Epoxy to hardener. The epoxy, hardener and
fiber are supplied by US Composites.

36
The actual dimensions of the panel were chosen as ratios of the hole diameter. The hole
diameter was known to be 12.7mm (0.5 inches) for this panel. A thickness to hole diameter ratio
of 1:1 was used. Also, the ratio of edge distance to hole diameter was 4:1 moving laterally from
the hole, and 3:1 from the top of the plate to the center of the hole. The locations of the gages
within the composite plate are shown in Figure (1). The two fiber optic strain gages to be used in
this experiment are provided by Technica SA and are located at the places designated as 3 and 4
on the above diagram. In order to obtain data for the 1 and 2 locations the specimen was simply
reversed. The gages are Bragg grating fiber optic strain gages and have a gage length of 2mm
with a maximum strain output of approximately 12,000 microstrain. The 2mm gage length was
chosen since it is small, and works accurately for taking strain readings at specified points in the
presence of a large strain gradient. Also, a 3mm protective armor cable was used to protect the
internal fiber optic cable from shearing off at the ingress/egress point after construction. Further
protection was provided at the adapter, where the cable connects to the interrogator. The
FC/APC adapter had attached to it a strain distributing support.
The gages were applied to a ply prior to the hand layup process. This was done by first
marking the edges of the specimen and the location of the center of the gage with a thin black
cotton string as shown in Figure (2). String was used so that during the layup process the plies
with gages can be aligned via the string. Lastly, the gage was glued in place using the same
epoxy and hardener that will be used during the hand layup process and is shown in Figure (3).

37
The composite panel was created large enough so that specimens for tensile tests could be
cut from the same panel that the test specimen would be made from. Tensile tests were used to
determine the material properties of the composite panel for use in a finite element model used
for experimental validation. The hand layup process was performed by inserting the plies with
the gages at the desired interval. Overall, 60 plies were used including the two with gages
attached. Since the gages were inserted at locations 0.1 inches and 0.2 inches in from the front
surface, this meant they were located as plies 12 and 24. A vacuum bag system was used to pull
extra resin out of the specimen after the layup process was completed. The setup for the panel
construction can be viewed in Figure (4).
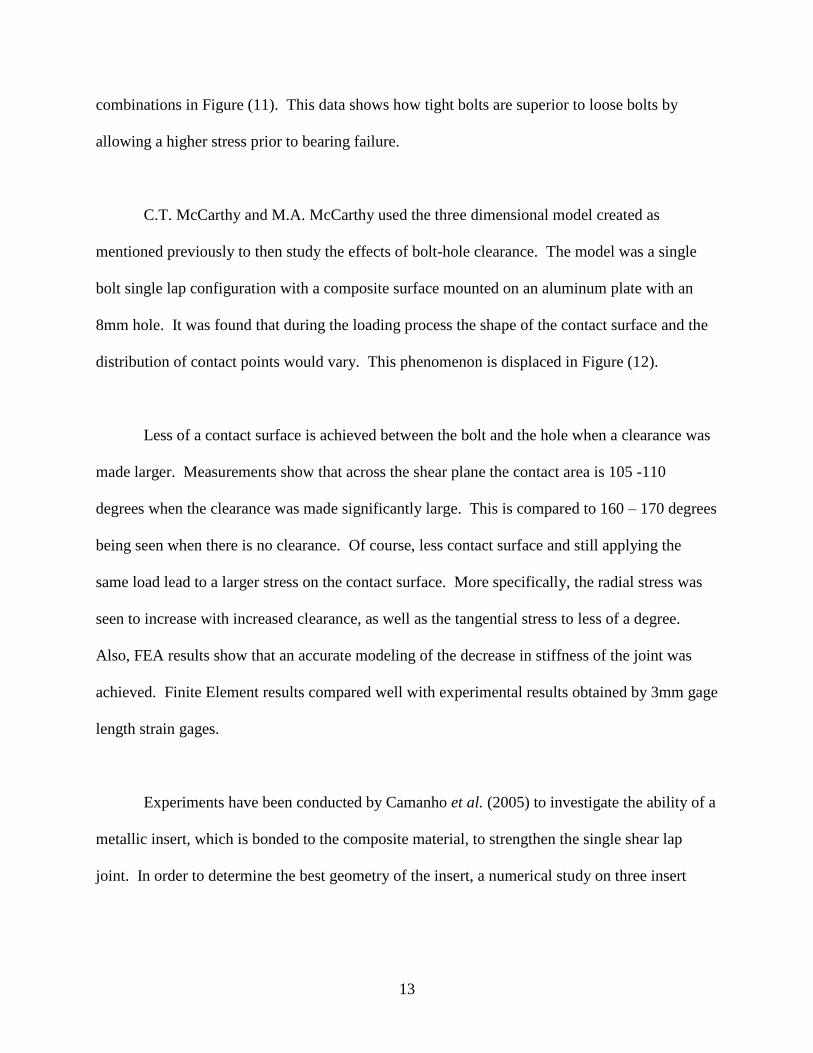
2.3 Experimental Setup
The embedded, lap-joint specimen was tested using a tensile testing machine. Wedge
grips were used to hold in place a mounting device created to hold the specimen. A mounting
device was used since the lap joint specimen was too thick to fit into the wedge grips of the MTS
machine and is shown in Figure (5). Displacement was set to 1.0 mm per minute and the
specimen was loaded from 0 – 10,500 N. This loading range was sufficient to develop a linear
trend for stiffness data. Fiber optic strain gage data was compiled by Labview software. Testing
was performed to determine the optimum bolt to hole clearance condition. For these tests the
hole size would remain constant while the bolt would be varied in diameter to reflect clearance
values of 0,1,2,3,4 and five percent. As a precaution testing was first performed on gage
locations three and four since lower strains were expected at the gages. After these tests were
successfully concluded, tests were carried out for gage locations one and two.

38
2.4 Experimental Results
As mentioned, tensile tests were first performed to determine material properties for use
in FEA. Young’s modulus for the through the thickness direction was specified as that of the
matrix material. Table (1) shows the material properties.
Stiffness testing on the embedded, lap-joint specimen provided results that were similar
to what was seen in tests on much thinner panels. The stiffest condition was seen when there
was no clearance between the bolt and the bolt hole. All clearance results can be seen in Table
(2). The zero clearance condition was seen to be the optimal configuration of the joint, with the
five percent clearance the poorest performing configuration.
Fiber optic strain gages have provided very interesting data of the strain profile through
the thickness of the specimen as shown in Figure (6). Gage two had higher strains than gage one
for all tests. Increased clearance from zero to three percent increased the strain seen at all gage
by similar proportions to the values at zero percent. However, once clearance was further
increased to five percent only the strains at the gages furthest from the interface between the
aluminum plate and the composite panel continued to see increased strain. Strain values at
6000N were averaged for the four tests at each clearance level and compared in Figure (7). In
this manner, the effects of clearance on strain concentrations can more easily be seen.
2.5 Discussion
Experimentation has shown interesting data on the strain profile during loading for the
thick, single, lap-bolted joint as well as the optimum clearance condition. A large strain

39
concentration existed nearer the interface of the composite and aluminum plates, at the gage one
and two locations. The strain concentration was seen to initially increase with clearance until
five percent clearance was reached. At five percent clearance, a leveling effect had begun in the
strain profile. Also, there is much alignment between the stiffness data created in these tests and
what has been seen for similar research projects on joints that were constructed of mainly thinner
panels. In the embedded specimen, stiffness was seen to be optimized when clearance does not
exist at all. There was an 11.04 percent decrease in stiffness from the zero percent to the one
percent conditions. Such a large decrease in stiffness has shown the importance of maintaining a
tight tolerance on the bolt-hole clearance for use of such a composite plate when used in field
applications.
The strain profile through the thickness at the two gage locations was very revealing.
Past numerical studies have all shown that the highest strain values are at the interface of the
composite plate and the aluminum plate and decrease substantially away from the interface of the
two plates. Experimental evidence provided by the embedded Bragg grating fiber optic strain
gages has showed that the highest strain values are located a little further in from this interface at
the location of gage two. However, gages one and two did both read substantially higher than
gages three and four. The difference in what was seen in experimentation and other numerical
studies was largely due to a slight translation of the gages during the hand rolling process, and a
stiffening effect in the composite panel near the interface of the two plates.

40
2.6 Conclusions
The focal point of this study was to determine the effects of clearance on the strain profile
through the thickness of the specimen and the optimal stiffness value for a thick composite panel.
The composite specimen contained 60 layers of S-glass in an Epoxy resin resulting in a 12.7mm
(0.5 inch) thick composite panel. Point measurements for strain in the bearing plane of the
composite specimen were determined experimentally using Bragg grating fiber optic strain gages
embedded into the specimen.
Analysis of the data provided conclusions regarding the effects of clearance on strain
concentrations and on the stiffness of the joint. The concentration was highest at gage two,
which was toward the front of the specimen, but further into the thickness than gage one. Also,
strain seen under three percent of clearance was increased from the zero percent clearance
conditions at all gages by approximately the same proportion. A further increase in strain to five
percent only resulted in an increase in strain at gages three and four, the gages furthest from the
interface between the two plates.
Stiffness was seen to follow similar trends to thin composite panels. Any increase in
clearance beyond the zero clearance condition lead to a decrease in stiffness. Zero clearance was
then the optimum condition at 10.02 KN / mm and five percent was the least stiff at 8.7 KN /
mm. Overall, it was seen that increased clearance decreased stiffness, and any initial increase in
clearance from zero percent caused a higher concentration of clearance nearest gage one and
two.

41
2.7 Tables and Figures
Figure 2-1: Dimensions of the FOS gage locations within the composite panel
For interpretation of the references to color in this and all other figures, the reader is referred to
the electronic version of this thesis
Figure 2-2: Location of the gage and edges of specimen
Aluminum
plate
Fiber optic
strain gages
Composite
plate
12.5
1.8
12.7
2.54
12.7
4 3 2 1

42
Figure 2-3: Gages are glued in place with epoxy resin
Figure 2-4: Vacuum bag setup for hand layup process
Vacuum
Pump
Sandwich FOS Gage
Cables
Resin
Trap

43
Figure 2-5: (A) Mechanical mounting device, (B) Specimen loaded into MTS
(a)
0
2000
4000
6000
8000
10000
12000
-14000-12000-10000-8000-6000-4000-20000
Strain (micrometers)
Load vs F.O.S. Strain: 0 Percent Clearance
Testing
fixture
Aluminum
Bolt
Composite
sample
Testing
fixture
Loc. 1 Loc. 2
Loc. 3 Loc. 4
Load vs F.O.S. Strain: 0 Percent Clearance
Strain (micrometers)
Load
(N
)
1 2 3 4
gages
0 -2000 -6000 -10000 -14000
12000
10000
8000
6000
4000
2000
0

44
Load vs F.O.S. Strain: 3 Percent Clearance
0
2000
4000
6000
8000
10000
12000
-18000-16000-14000-12000-10000-8000-6000-4000-20000
Strain (micrometers)
Lo
ad
(N
)
(b)
Load vs. F.O.S. Strain: 5 Percent Clearance
0
2000
4000
6000
8000
10000
12000
-14000-12000-10000-8000-6000-4000-20000
Strain (micrometers)
Lo
ad
(N
)
(c)
Figure 2-6: (A) 0 percent clearance, (B) 3 percent clearance, (C) 5 percent clearance
Strain (micrometers)
Strain (micrometers)
Load
(N
) Load vs F.O.S. Strain: 3 Percent Clearance
Load vs F.O.S. Strain: 5 Percent Clearance
Load
(N
)
1
4 3 2 1
4 3 2 1
gages
gages
0 -2000 -6000 -10000 -14000 -18000
0 -2000 -6000 -10000 -14000 -18000
12000
10000
8000
6000
4000
2000
0
10000
8000
6000
4000
2000
0
12000
Loc. 4
Loc. 3 Loc. 1 Loc. 2

45
Figure 2-7: Strain Profile for all clearance levels at 6000N
Embedded Specimen
Ex (GPa) 19.56
ν12 0.12
Table 2-1: Material properties of the composite specimen
Embedded Specimen Stiffness Results (N/mm)
Test # 0% 1% 2% 3% 4% 5%
1 8296 7610 8182 7438 9517 8317
2 10564 7628 7602 8945 8252 9213
3 10858 8438 7859 9133 8977 8273
4 9970 9806 10003 10209 9014 8638
5 10359 10334 10160 9376 9179 8772
6 10387 9947 9973 8963 9621 9040
Average 10072 8961 8963 9011 9093 8709
Δ from 0 (%) N/A -11.04 -11.01 -10.54 -9.72 -13.54
Table 2-2: Stiffness characteristics of each test configuration.
Depth through the Composite Plate (mm in x-direction)
Clearance Effects on the Strain Profile at a
6000N Load x
0 Percent
1 Percent
3 Percent
5 Percent
-4000
-8000
-10000
-12000
-14000
Str
ain (
mic
rom
eter
s)
-2000
-6000
0 2 4 6 8 10 12

46
Material
Properties
Ex Ey Ez Vxy Vxz=Vyz Gxy
(GPa)
Gxz=Gyz Density
(Kg/m3) (GPa) (GPa) (GPa) (GPa) (GPa) (GPa)
Aluminum
7075
72 72 72 0.33 0.33 28 28 2800
Steel Bolt 200 200 200 0.3 0.3 77.2 77.2 7860
Washer 200 200 200 0.3 0.3 77.2 77.2 7860
Composite
Plate
19.546 19.546 3.3 0.121 0.11 2.9 1.9 2700
Table 2-3: Material properties of finite element components

47
REFERENCES

48
REFERENCES
[1] Pratt, John D., Pardoen, Gerard. (2002). “Influence of Head Geometry on bolted Joint
Behavior” Journal of Aerospace Engineering 15:4:136-153
[2] Iancu, F. Ding, X. et al (2005) “Three-dimensional investigation of thick single-lap bolted
joints.” Experimental Mechanics 45: 351-358
[3] Nassar, Sayed A., Virupaksha, Vinayshankar L., et al. (2007). “Effect of Bolt Tightness on
the Behavior of Composite Joints.” Journal of Pressure Vessel Technology 129-1: 43-51
[4] McCarthy, M.A., McCarthy, C.T. (2004). “Three-dimensional finite element analysis of
single-bolt, single-lap composite bolted joints: part II-effects of bolt-hole clearance” Composite
Structures 71: 159-175
[5] McCarthy, M.A., Lawlor, V.P., et al. (2002) “Bolt-hole clearance effects and strength criteria
in single-bolt, single-lap, composite bolted joints.” Composites Science and Technology 62:
1415-1431.
[6] Chen, Wen-Hwa, Lee, Shyh-Shiaw, et al. (1995) “Three-dimensional contact stress analysis
of a composite laminate with bolted joint.” Composite Structures 30: 287-297
[7] McCarthy, M.A., McCarthy, C.T. (2003). “Finite Element Analysis of the Effects of
Clearance on Single-Shear, Composite Bolted Joints.” Journal of Plastics, Rubber and
Composites 32: 65-70
[8] Baldwin, C., Mendex, Alexis. (2005) “Introduction to Fiber Optic sensing with Emphasis on
Bragg Grating Sensor Technologies; short course 102” Course Presented: SEM Annual
Conference and Exposition on Experimental and Applied Mechanics
[9] Lopez-Anido, R., Fifield, S. (2003). “Experimental Methodology for Embedding Fiber Optic
Strain Sensors in Fiber Reinforced Composites Fabricated by the VARTM/SCRIMP Process”.
Structural Health Monitoring: 247 – 254.
[10] Isaicu, Gabriel (2006). “Three-Dimensional Strain Analysis of Single-Lap Bolted Joints in
Thick Composites using Fiber-Optic Strain gages and Finite Element Method” Master’s Thesis,
Department of Mechanical Engineering, MSU
[11] Marannano, G., Restivo, G. et al (2010). “GIUNZIONI BULLONATE FRA COMPOSITO
E ALLUMINIO: STUDIO DEL GIOCO MEDIANTE FIBRE OTTICHE

49
Chapter 3. Joints with Inserts; Combined Strain Analysis
3.1 Introduction
Of interest in this study, are the effects of using metallic inserts to improve the strength of
the bolted joint. Inserts can improve the contact surface area created between the bolt and the
hole, thus improving the strain distribution around the hole, leading to a stronger overall joint.
Stiffness will be tested as well as the actual buildup of strain concentrations above the hole by
use of fiber optic strain gages (FOSG).
To properly investigate the improvement of the single-lap, bolted joint using inserts, a
review of previous work in the area was conducted. The review helps to understand the current
state of the technology in order take the most appropriate steps in advancing the state of the
technology.
Fastening parameters affecting strain distribution around the bolt hole help to define the
proper geometry to explore in the single-lap, bolted joint. Bolt diameter has a great impact on
the distribution of stress from the bolt, to the composite plate. Naturally, a thinner bolt is known
to provide higher strain concentrations near the contact of the bolt and hole due to the existence
of a smaller contact surface area [1]. In the aerospace industry the use of countersink bolts is
common practice. The effects of this bolt geometry have been shown to decrease the stiffness of
the joint [2]. Tightness of the bolt is a strong factor in distributing loads. Higher torque values
provided for stiffer joints [3,4]. Overall, a protruding head bolt, in other words not a countersink
bolt, is shown to be most effective in conjunction with thicker bolts in maintaining joint strength.

50
To provide the strongest panel, the maximum contact surface area between the bolt and
the hole must be maintained. A tilting of the bolt occurs during the loading process since the two
panels in a single-lap, bolted joint overlap instead of being completely in line with each other.
Any clearance between the bolt and the hole will only serve to further decrease the contact
surface area and decrease stiffness [5,6,7,8]. Also, the use of metallic inserts has shown the
ability to greatly increase the stiffness of the joint [9,10].
Initial studies have been performed to show that fiber optic strain gages can be
successfully used to take internal measurements in composite panels. Embedded fiber optic
strain gages have shown to be non-invasive to the material properties of the composite [11,12].
The embedding method has been used to take an initial look at the strain profile above the hole in
the single-lap, bolted joint configuration [13,14]
3.2 Experimental Setup
A second composite panel was constructed in the same manner as in the previous
experiment, with a hand layup process with vacuum bag assisted curing. Different in this
experiment from the previous, however, is that four gages are embedded, so the panel does not
need to be reversed to obtain strain readings at four locations during testing. All four gages were
separated by equal distances. The composite panel manufactured and used in the lap joint setup
was tested to determine the effects of the use of an insert surrounding the bolted hole. Inserts
were cut to two different sizes and constructed of steel, aluminum or brass. Fiber optic strain
gages were used to determine the strain profile above the hole during loading. Also, digital

51
image correlation (DIC) was used to determine surface strains on the free face of the lap joint.
Lastly, stiffness of the joint was determined using load and displacement data collected by an
MTS machine. The combination off all three measurement sources, FOS gages, DIC surface
measurements, and MTS data provided a strong, experimentally determined knowledge of the
single-lap, bolted joint mechanics
To apply the tensile load, an MTS 810 was utilized. By themselves, the composite plate
and the aluminum plate are too thick to be gripped directly by the MTS machine. The single-lap,
bolted joint was then placed into a special loading device that could then be gripped by the MTS.
A picture of the mounting device with the lap joint loaded into it is shown in Figure (1). Once
loaded into the MTS, a displacement driven loading rate of 1.0 mm per minute was applied. To
protect the gages, the loading was kept below 8,000N.
Initially, the hole size was left to 12.7mm (0.5”) and no insert was used. A 12.7mm
(0.5”) diameter steel bolt was used for fastening in all experiments. Both the strain profile above
the hole, using the average of the values determined from four tests using the fiber optic strain
gages was taken, and then the DIC measurements were taken without an insert present. Next, the
hole was widened to 0.625”, and an insert of the same outer diameter was placed into the
composite and aluminum plates. The insert was one solid piece extending between the two
plates and once again, a 12.7mm (0.5”) diameter bolt was used. Both FOS and DIC tests were
again conducted in the same manner as without the insert. Finally, the hole is once again
widened to 0.75” and inserts of the same material, but larger outer diameter are inserted for
testing. All insert dimensions are shown in Figure (2).

52
Once all DIC experiments under all configurations were completed, sensitivity tests were
performed to determine the accuracy of the DIC measurements. A steel 0.75” outer diameter
insert was used in the experimental configuration. The sensitivity tests were performed by
applying two resistance strain gages to the surface of the specimen. These gages were applied
15mm above the hole, and separated 25mm from a line running vertically down the center of the
specimen and are shown in Figure (3). Measurements from the two surface gages were
compared to strains recorded from the DIC measurements in the y-direction.
3.3 Experimental Results
Initially, tensile tests were performed to determine the material properties of the
composite panel. The panel was pulled in tension unidirectional by the MTS machine while
resistance strain gages mounted onto strips of the composite panel recorded strain values. Tests
concluded by determine the material properties shown in Table (1).
Next the composite panel in the single-lap, bolted joint setup was installed into the MTS
machine. This panel was tested for the strain profile through the thickness of the panel using the
embedded fiber optic strain gages. Five tests were for the baseline, and four tests for all
configurations involving inserts were performed and averaged, with the exception of the thinner
diameter aluminum insert, which had three tests. Results of the tests for the baseline test, the
15.875mm (0.625”) and the 19.05mm (0.75”) outer diameter inserts are compiled and shown in
Figures (4-6).

53
MTS data provided stiffness data for the single-lap bolted joint. Stiffness data was
recorded for the same tests the FOS data was recorded. After averaging, the data was compiled
into Table (2).
Surface strain data was collected for strain in the 1 and 2 directions, as well as graphics
displaying the full field strain map. The full field strain map of the configurations that have
performed the best at distributing the load applied have generated for the sake of being concise.
The strain in the 1-direction is taken across a line spanning the center of the plate from
the bottom to the top and is shown in Figure (7). Similarly, strain in the 2-direction is taken
across a single line. However, this line spans from the left to the right side of the plate, and just
above the washer’s top edge. Results of strain the 2-direction are displayed in Figure (8). The
full field results shown encompass the entire region surrounding the hole and washer. In Figure
(9) the strain map is displayed for strain in the y, or 2-direction. Table (3) shows the sensitivity
test data, comparing RSG gages to DIC measurements.
After all analysis was complete, the composite specimen has been analyzed internally,
and externally. Internally, fiber optic strain gages revealed the strain profile through the
thickness of the specimen. Stiffness results were analyzed using data collected by the MTS
machine. Lastly, surface strains were recorded using DIC. All these measurement techniques
combined to provide a robust analysis of the single-lap, bolted joint under experimentation.
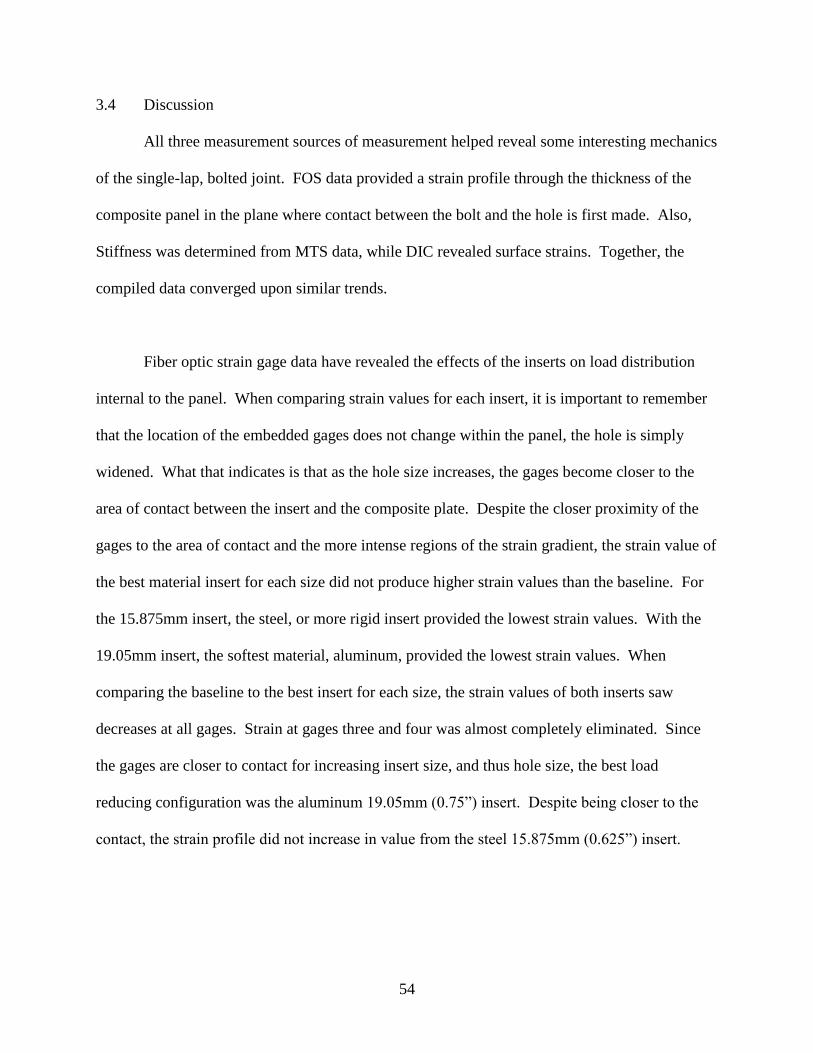
54
3.4 Discussion
All three measurement sources of measurement helped reveal some interesting mechanics
of the single-lap, bolted joint. FOS data provided a strain profile through the thickness of the
composite panel in the plane where contact between the bolt and the hole is first made. Also,
Stiffness was determined from MTS data, while DIC revealed surface strains. Together, the
compiled data converged upon similar trends.
Fiber optic strain gage data have revealed the effects of the inserts on load distribution
internal to the panel. When comparing strain values for each insert, it is important to remember
that the location of the embedded gages does not change within the panel, the hole is simply
widened. What that indicates is that as the hole size increases, the gages become closer to the
area of contact between the insert and the composite plate. Despite the closer proximity of the
gages to the area of contact and the more intense regions of the strain gradient, the strain value of
the best material insert for each size did not produce higher strain values than the baseline. For
the 15.875mm insert, the steel, or more rigid insert provided the lowest strain values. With the
19.05mm insert, the softest material, aluminum, provided the lowest strain values. When
comparing the baseline to the best insert for each size, the strain values of both inserts saw
decreases at all gages. Strain at gages three and four was almost completely eliminated. Since
the gages are closer to contact for increasing insert size, and thus hole size, the best load
reducing configuration was the aluminum 19.05mm (0.75”) insert. Despite being closer to the
contact, the strain profile did not increase in value from the steel 15.875mm (0.625”) insert.

55
Data from the MTS machine helped describe the overall displacement of the joint during
loading. Interestingly enough, there was little difference in stiffness from the baseline, to the
smaller inserts. However, when the inserts were increased in diameter, a small, but noticeable
decrease in stiffness occurred. This decrease is possibly due to a more significant decrease in the
cross sectional area of the tension bearing portion of the composite pane located to the left and to
the right of the bolt. Overall, stiffness was not largely affected by the presence of the inserts.
Surface strains for the composite specimen were compiled by a digital image correlation.
Data was analyzed graphically for areas of interest, and two-dimensional strains maps were
created for the entire exposed surface of the lap joint. The baseline configuration of no insert
showed the most intense y direction strains across the specimen. Most significantly, the presence
of any insert greatly reduces surface strains over the baseline, and the larger inserts appear to
have the most significant effect. Also, it is seen from the same figure that the steel insert with
the outer dimension of 15.875mm has the lowest surface strains in the y-direction. The
aluminum insert is seen to have the lowest strain for the insert with a 19.05mm outer dimension.
Results for the FOS strain gages showed the same results for strains in the y-direction located
just inside from the surface represented with this data.
It should be noted however that the sensitivity of the DIC system is a concern. Several
factors of the experimental setup affect the sensitivity, those being the grid spacing and facet size
for measurements within the software, also, the size of the area of measurement, the out of plane
displacement of the specimen during loading, lens imperfections, and the speckle pattern.

56
Full field strain maps have shown the effects of secondary bending. Below the washer
and hole the strain in the 2-direction is compressive. So although the plate is pulled in tension,
the effect of bending is the greatest force in the superposition of the two stresses. Also, the
bending effect if eliminated just after the center of the hole, which is why the plate then only sees
tension in the 2-direction. Overall strain values are much smaller on the surface then in the
interior of the specimen. Also, comparison of DIC to RSG data in the sensitivity test showed a
good correlation between RSG and DIC data for location 1. However, at Location 2, there was a
large discrepancy averaging 190 micro-strain. This might have been due to out of plane
displacement of the specimen, or a poor speckle pattern in the region. There was a wide
variation in values of the DIC readings at this location, while the RSG where much more
consistent.
Considering all the measurements taken, the single-lap, bolted joint has been thoroughly
analyzed both internally, and on the surface. Measurements from taken from all the utilized
sources confirm similar results for the effects of joint strength using inserts of various metals and
sizes.
3.5 Conclusions
Overall, the different configurations of the single-lap, bolted joint provided for seven
different design possibilities. Data from numerous tools converged on the same results providing
a validation of each test method. With this in mind, it is clear that the optimum design is the
joint that incorporates the aluminum insert at 19.05mm (0.75”).

57
Fiber optic strain gage data has revealed that an increase in the size of the insert provided
a decrease in the strain intensity in the bearing plane, above the hole. Interestingly, the stiffer
steel insert was the optimal design for the smaller insert size, while the aluminum insert was
more ideal for the larger insert size.
Using digital image correlation, the recommendation of using the steel insert at the
smaller dimension, and the aluminum at the larger was validated. Both of those inserts produced
the smallest amount of strain above the hole for their corresponding insert size. Although, an
important fact remains that the strain on the outer surface of the composite panel is dramatically
smaller than that seen internally, especially nearest to the interface of the aluminum and
composite plates. Sensitivity measurements have shown that DIC data in these tests were not as
consistent as the other measurements methods used in this study.
Stiffness, as determined from the MTS data was the most interesting. While there was
little change overall in stiffness between any of the tests, it was clear that a minor decrease in
stiffness occurs for the larger inserts. Most interesting about this trend is that the larger inserts
showed an ability to decrease the strain above the hole the most significantly, as shown with
FOS and DIC. A conclusion can then be drawn then that the reason for the decrease in stiffness
is most likely due to the decrease in the cross-sectional area of the composite material created
from the increased size of the hole to accommodate the insert. In support of this idea, was the
fact that the softer insert was most effective for the larger inserts tested. With the increased
displacement of a less stiff joint, an insert that could more closely conform to the hole, such as
with a softer material like aluminum over steel, would be most effective. In light of all the data

58
collected, it is clear that the aluminum insert of outer dimension 19.05mm was the most effective
insert.
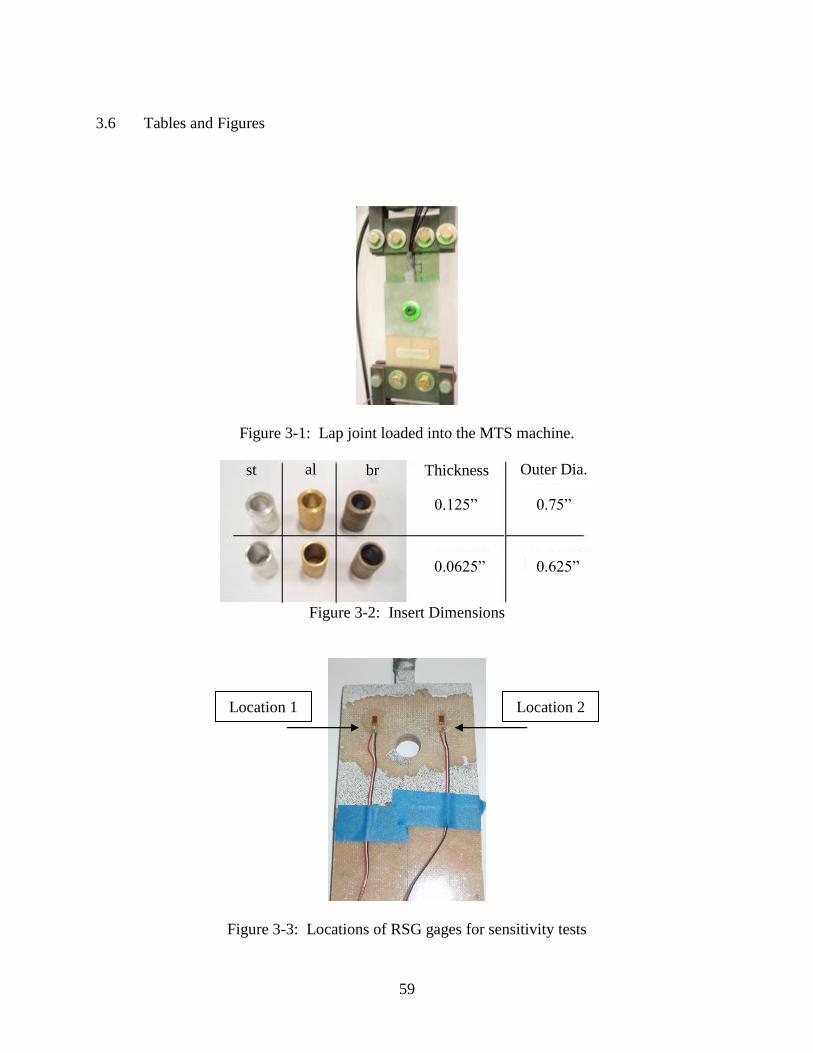
59
3.6 Tables and Figures
Figure 3-1: Lap joint loaded into the MTS machine.
Figure 3-2: Insert Dimensions
Figure 3-3: Locations of RSG gages for sensitivity tests
Location 1 Location 2
al br st Thickness Outer Dia.
0.125”
0.0625” 0.625”
0.75”

60
Ex 18.663 Gpa
V12 0.113
Table 3-1: Material properties of the composite panel in the 1 and 2 directions
Figure 3-4: Baseline, 12.7mm (0.5”) hole diameter with no insert
Figure 3-5: Strain profile of 15.875mm (0.625”) insert for all three metals
Strain Profile for Baseline; No Insert
-2000
-1800
-1600
-1400
-1200
-1000
-800
-600
-400
-200
0
0 2 4 6 8 10 12
Distance from the Composite to Aluminum Plate Interface (mm)
Str
ain
(m
icro
)
Baseline 12.7mm (0.5")
Strain Profile at 6000N: 15.875mm(0.625") Inserts
-3000
-2500
-2000
-1500
-1000
-500
0
0 2 4 6 8 10 12
Distance from the Composite to Aluminum Plate Inteface
Str
ain
(m
icro
)
Aluminum
Steel
Brass
Strain Profile at 6000N: 15.875mm (0.625”) Inserts
aluminum
steel
brass
0 2 4 6 8 10 12
Distance from the Composite to Aluminum Plate Interface
Str
ain (
mic
ro)
-500
-1000
-1500
-2000
-2500
-3000
0
Baseline 12.7mm (0.5”)
Distance from the Composite to Aluminum Plate Interface (mm) 0 2 4 6 8 10 12
S
trai
n (
mic
ro)
Strain Profile for Baseline; No Insert
-2000
-1600
-1200
-800
-400
0
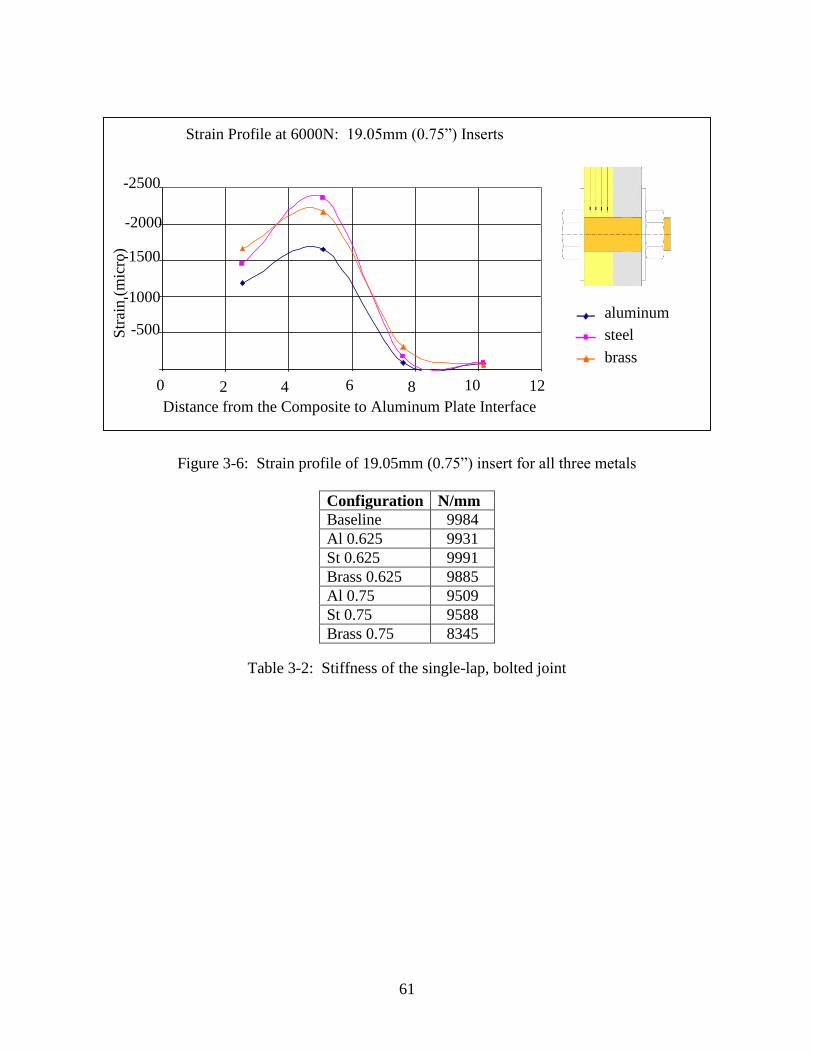
61
Figure 3-6: Strain profile of 19.05mm (0.75”) insert for all three metals
Configuration N/mm
Baseline 9984
Al 0.625 9931
St 0.625 9991
Brass 0.625 9885
Al 0.75 9509
St 0.75 9588
Brass 0.75 8345
Table 3-2: Stiffness of the single-lap, bolted joint
Strain Profile at 6000N: 19.05mm (0.75") Inserts
-2500
-2000
-1500
-1000
-500
0
0 2 4 6 8 10 12
Distance from the Composite to Aluminum Plate Interface
Str
ain
(m
icro
)
Aluminum
steel
Brass
aluminum
steel
brass
Distance from the Composite to Aluminum Plate Interface
Strain Profile at 6000N: 19.05mm (0.75”) Inserts
0 2 4 6 8 10 12
Str
ain (
mic
ro)
-500
-1000
-1500
-2000
-2500

62
Figure 3-7: Surface strains in 1-direction taken down the center
Surface Strain Above Hole at 6000N
-1.5
-1
-0.5
0
0.5
1
-50 -40 -30 -20 -10 0 10 20 30 40 50
Position (mm)
Str
ain
(m
m/m
)
AL 0.625"
ST 0.625"
Brass 0.625"
AL 0.75"
ST 0.75"
Brass 0.75"
BASE
Figure 3-8: Surface strains in the 2-direction taken above the hole at 6000N
-50
-40
-30
-20
-10
0
10
20
30
40
50
-2 -1.5 -1 -0.5 0 0.5 1
Po
sit
ion
(m
m)
Strain (mm/m)
AL 0.625"
ST 0.625"
Brass 0.625"
AL 0.75"
ST 0.75"
Brass 0.75"
BASE
Strain (mm/m)
AL 0.625”
ST 0.625”
Brass 0.625”
AL 0.75”
ST 0.75”
Brass 0.75”
BASE
Posi
tion (
mm
)
50
40
30
20
10
0
-10
-20
-30
-40
-50
-2 -1.5 -1 -0.5 0 0.5 1
X
Y
Position (mm)
Str
ain (
mm
/m)
Surface Strain Above Hole at 6000N
X
Y
BASE
AL0.625”
Brass0.625”
Brass0.625”
AL0.75”
ST0.75”
ST0.625”
0 1.0 3.0 2.0 4.0 -1.0 -2.0 -3.0 -4.0 -5.0 5.0
1
0.5
0
-0.5
-1
-1.5

63
(a)
Figure 3-9: (a) 15.875mm (0.625”) steel insert, (b) 19.05mm(0.75”) aluminum insert
0.0
-0.4
0.4
-0.8
0.8
-1.2
1.2
-1.6
1.6
-2.0
2.0
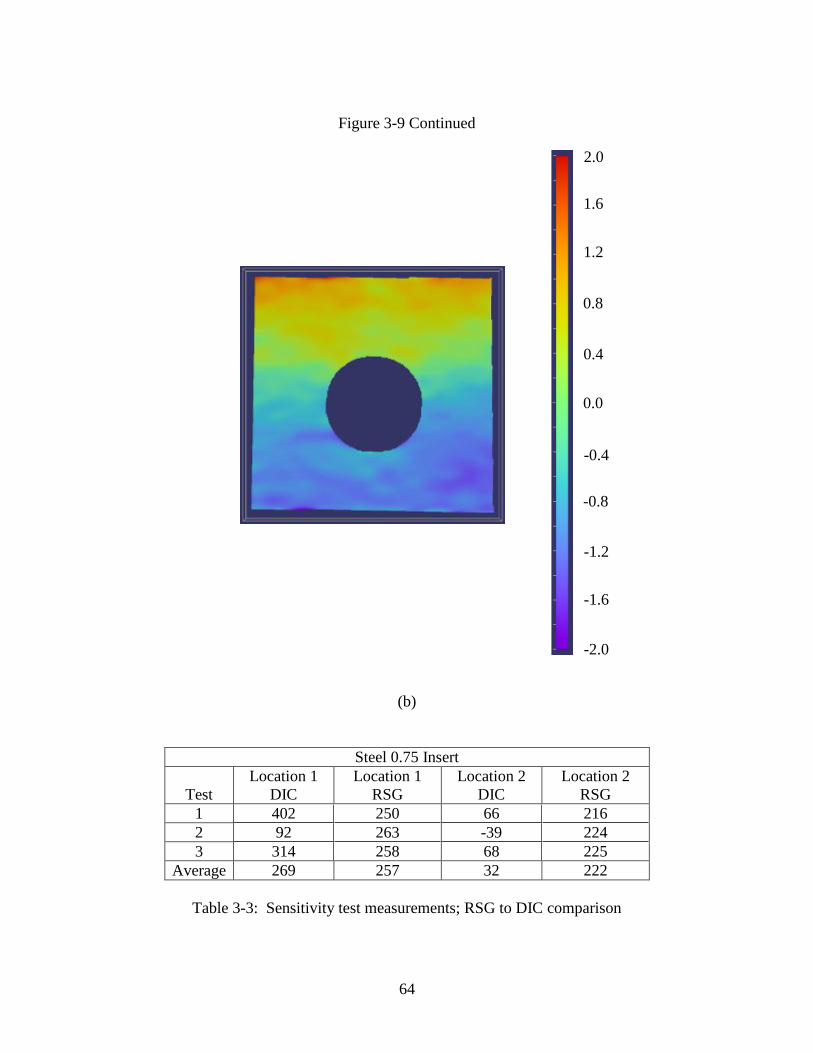
64
Figure 3-9 Continued
(b)
Steel 0.75 Insert
Test
Location 1
DIC
Location 1
RSG
Location 2
DIC
Location 2
RSG
1 402 250 66 216
2 92 263 -39 224
3 314 258 68 225
Average 269 257 32 222
Table 3-3: Sensitivity test measurements; RSG to DIC comparison
0.0
-0.4
0.4
-0.8
0.8
-1.2
1.2
-1.6
1.6
-2.0
2.0

65
REFERENCES

66
REFERENCES
[1] Chutima, Surachate, Blackie, Alvin P. (1996).”Effect of pitch distance, row spacing, end
distance and bolt diameter on multi-fastened composite joints” Composites Part A 27A: 105-110
[2] Pratt, John D., Pardoen, Gerard. (2002). “Influence of Head Geometry on bolted Joint
Behavior” Journal of Aerospace Engineering 15:4:136-153
[3] Iancu, F. Ding, X. et al (2005) “Three-dimensional investigation of thick single-lap bolted
joints.” Experimental Mechanics 45: 351-358
[4] Nassar, Sayed A., Virupaksha, Vinayshankar L., et al. (2007). “Effect of Bolt Tightness on
the Behavior of Composite Joints.” Journal of Pressure Vessel Technology 129-1: 43-51
[5] McCarthy, M.A., McCarthy, C.T. (2004). “Three-dimensional finite element analysis of
single-bolt, single-lap composite bolted joints: part II-effects of bolt-hole clearance” Composite
Structures 71: 159-175
[6] McCarthy, M.A., Lawlor, V.P., et al. (2002) “Bolt-hole clearance effects and strength criteria
in single-bolt, single-lap, composite bolted joints.” Composites Science and Technology 62:
1415-1431.
[7] Chen, Wen-Hwa, Lee, Shyh-Shiaw, et al. (1995) “Three-dimensional contact stress analysis
of a composite laminate with bolted joint.” Composite Structures 30: 287-297
[8] McCarthy, M.A., McCarthy, C.T. (2003). “Finite Element Analysis of the Effects of
Clearance on Single-Shear, Composite Bolted Joints.” Journal of Plastics, Rubber and
Composites 32: 65-70
[9] Herrara-Franco, Pedro, Cloud, Gary L., (1992). “Strain-Relief inserts for Composite
Fasteners – An Experimental Study.” Journal of Composite Materials 26: 751
[10] Camanho, P.P, Tavares, C.M.L., et al. (2005). “Increasing the efficiency of composite
single-shear lap joints using bonded inserts.” Composites: Part B 36: 372-383.
[11] Baldwin, C., Mendex, Alexis. (2005) “Introduction to Fiber Optic sensing with Emphasis on
Bragg Grating Sensor Technologies; short course 102” Course Presented: SEM Annual
Conference and Exposition on Experimental and Applied Mechanics
[12] Lopez-Anido, R., Fifield, S. (2003). “Experimental Methodology for Embedding Fiber
Optic Strain Sensors in Fiber Reinforced Composites Fabricated by the VARTM/SCRIMP
Process”. Structural Health Monitoring: 247 – 254.

67
[13] Isaicu, Gabriel (2006). “Three-Dimensional Strain Analysis of Single-Lap Bolted Joints in
Thick Composites using Fiber-Optic Strain gages and Finite Element Method” Master’s Thesis,
Department of Mechanical Engineering, MSU
[14] Marannano, G., Restivo, G. et al (2010). “GIUNZIONI BULLONATE FRA COMPOSITO
E ALLUMINIO: STUDIO DEL GIOCO MEDIANTE FIBRE OTTICHE INGLOBATE NELLO
SPESSORE”. AIAS – Italian Association for stress Analysis National Conference 2010.

68
Chapter 4. Summary and Conclusions
4.1 Clearance Conclusions
Results from the clearance studies came in the form of both stiffness measurements, and
through embedded fiber optic strain gages. Stiffness measurements found results similar to what
was seen in thinner composite panel single-lap, bolted joints. The initial onset of clearance
caused a dramatic drop in stiffness measuring about 11 percent. Stiffness remained at about the
same value as clearance increased, until the maximum decrease in stiffness was seen at five
percent. Strain readings from the fiber optic strain gages showed that most of the load is
transferred through the area of the panel which is closest to the aluminum plate. Gage locations
one and two read significantly higher than three and four, with gage location two reading the
highest, indicating the area of the strain concentration. Initial clearance showed an increase in
the strain concentration at gage location two. At three percent clearance strain was increased at
all gage locations, with gage two still the highest. Further increase in clearance to five percent
showed a leveling of the strain profile, but very high strain values through the thickness of the
panel.
4.2 Insert Conclusions
The strength of the joint was determined though several means for the insert study.
Stiffness calculations, embedded fiber optic strain gages, and DIC were employed. Using all
three sources of measurement, a well rounded internal and external investigation was performed.

69
Stiffness measurements were interesting in that some explanation was necessary in order
to initially understand them. The no-insert condition was actually the stiffest at 9.984 KN / mm.
Applying the thinner diameter inserts of 0.625” outer diameter provided about the same stiffness
as the baseline condition. Lastly the largest diameter inserts of 0.75” outer diameter provided the
least stiff condition. The reason for this is that the cross sectional area of the composite plate on
either side of the hole was reduced as the hole was made larger to accommodate the insert.
Reducing the cross sectional area meant a higher strain in those regions, and a larger
displacement, thus a lower stiffness. So in these experiments, stiffness did not predict the load
carrying capability of the joint.
The fiber optic strain gages discovered trends in the strain profile through the thickness of
the specimen above the hole, and a strain concentration. The concentration was once again at the
location of gage two, as seen in clearance tests. For the inserts of the outer diameter of 0.625”,
the steel material worked best. A strain value of 1634 micrometers was seen for the steel insert,
as compared to 1911 micrometers and 2671 micrometers for the brass and aluminum inserts
respectively. In the case of the larger diameter inserts, the aluminum insert performed best.
Values of 1657 micrometers, 2175 micrometers, and 2362 micrometers for the aluminum, brass,
and steel inserts respectively. What should be noticed, is that the insert with the highest modulus
of elasticity performed best at the lower insert size, and the lowest modulus the poorest
performing. However, for the larger diameter that trend reversed. The reason for this is the fact
that as the stiffness decreased for the larger diameter inserts, the softer material was able to
elastically deform to fill the hole and provide the best load distribution. It should be noted that
the strain values between the smaller diameter inserts and that of the larger diameter inserts

70
should not be directly compared. As the hole widened to accommodate the larger inserts, the
contact region moved closer to the gage locations, since the gages remained stationary in their
position within the panel. Direct comparison of strain values can only be done between inserts
of similar size.
Lastly, surface strain measurements were compiled using a 2-D digital image correlation
system. The best performing insert was determined by locating the condition that minimized the
strain value seen above the hole, where contact is made between the bolt and the hole.
Measurements found the same results the fiber optic strain gages found, that being the steel was
the best insert for the smaller insert size, and the aluminum the best insert for the larger size, and
overall any insert performed better than the no insert condition. DIC images showed that there is
compression below the hole due to bending, and tension in the rest. There is an exception of a
small area of compression is seen just above the hole due to the contact of the bolt.
4.3 Design Recommendations
In order to successfully implement the composite plate into field use, design
recommendations regarding the studied fastening parameters must be determined. The previous
studies have used internal and external methods of measuring the effects of clearance and inserts
on the joint strength. Overall, it was determined that clearance has a negative effect on joint
strength. Any fastening design should try to make the bolt to hole connection a snug fit, of
approximately zero percent. If clearance reaches a value of three percent, the panel should be
removed from service. Inserts were found to help the performance of a joint significantly. An
aluminum insert of 0.75” outer diameter should be used.