Preliminary findings on possible Euro 7 emission limits ...
56
LDV Exhaust 1 Presenter: Prof. Zissis Samaras Online AGVES Meeting 8 April 2021
Transcript of Preliminary findings on possible Euro 7 emission limits ...

LDV Exhaust
1
Presenter: Prof. Zissis Samaras
Online AGVES Meeting 8 April 2021
Study on post-EURO 6/VI emission standards in Europe
Dr. A. Balazs, Dr. M. Ehrly (FEV)Dr. A. Kontses, Dr. A. Dimaratos, Dr. D. Kontses (LAT/AUTh)P. Aakko (VTT)Dr. N. Ligterink (TNO)J. Andersson, T. Scarbrough (Ricardo)Prof. L. Ntziachristos (Emisia)
With lots of contributions from our colleagues

Study on post-EURO 6/VI emission standards in Europe
Objectives and Methodology Pollutants for inclusion in Euro 7 Findings from Euro 6 LDV
Emission performance of current state-of-the-art technologies (reg/non-reg species) Identification of operating/testing conditions that are related with emission excursions
Testing conditions for Euro 7 – LDV Euro 7 limits and technologies – LDV
Technology packages Emission performance (simulations + demos) Emissions limits scenarios (for PO2)
Contents – LDV exhaust

Study on post-EURO 6/VI emission standards in Europe
Objectives and Methodology Pollutants for inclusion in Euro 7 Findings from Euro 6 LDV
Emission performance of current state-of-the-art technologies (reg/non-reg species) Identification of operating/testing conditions that are related with emission excursions
Testing conditions for Euro 7 – LDV Euro 7 limits and technologies – LDV
Technology packages Emission performance (simulations + demos) Costs Emissions limits scenarios (for PO2)
Contents – LDV exhaust

Study on post-EURO 6/VI emission standards in Europe
Step 1Development of
emissions database withperformance of latest technology vehicles within and beyond
current testing boundaries
Step 2Analysis of emissions
database and identification of current best performing vehicles
and technologies
Step 3Identification of critical operating conditions,
identification of future technologies, building of technology packages for
further evaluation
Step 4Development of test
protocol and evaluation of emissions
performance of future technology packages and
cost estimates
Step 5Proposal of emissions limits and technology
scenarios and costs, as inputs for the CBA/IA
study
5
Methodology
Comments
Emissions databaseWide range of test conditions within and
beyond the current boundaries: urban short trips, Stop&Go, regeneration events,
new pollutants etc.
Technology assessmentCharacterisation of technologies using test
data, demo cars and simulationInput from stakeholder consultations and
literature
Outcome of the analysisLimit scenarios, technologies and costs
Euro 7 testing conditionsPotential side effects (e.g. technology implications, CO2 penalty/benefit etc.)
5

Study on post-EURO 6/VI emission standards in Europe6
Euro 7 options (ToR of our Part A and B Studies)
• Euro 7 options examined in the Impact Assessment study Option 0: BaU – same limits as today Option 1: Refined architecture (simplification) – same limits as today
(adoption of the strictest today’s limits) Option 2: Option 1 + lower AP limits (reg/unreg)/advanced tests – lower limits Option 3: Option 2 + lifetime compliance/OBM/geofencing – lower limits

Study on post-EURO 6/VI emission standards in Europe
All driving conditions coveredNormal conditions of use significantly wider coverage of driving conditions compared to current RDEExtended conditions of use Almost all driving conditions are included
Coverage of driving conditions:Any trip distance and composition (U/R/M share) is allowedNo restriction for dynamic driving (except from first 2km under the normal driving conditions)Coverage of all ambient temperature, altitude relevant for EuropeEmissions with trailer towing are also controlled
7
In a nutshell: CLOVE Euro 7 proposal advancements

Study on post-EURO 6/VI emission standards in Europe
Stricter limits compared to Euro 6 e.g NOx limit at least 50% lower (normal conditions) than Euro 6
Wide market introduction of mature technologies and optimization EHC, higher filtration efficiency particle filters
Introduction of new pollutants, both exhaust and non-exhaustPN10, NMOG, NH3, N2O, HCHO, CH4, brake emissions
Extended durabilityEvolution from OBD to OBMSimplification of the regulatory framework
8
In a nutshell: CLOVE Euro 7 proposal advancements

Study on post-EURO 6/VI emission standards in Europe
Objectives and Methodology Pollutants for inclusion in Euro 7 Findings from Euro 6 LDV
Emission performance of current state-of-the-art technologies (reg/non-reg species) Identification of operating/testing conditions that are related with emission excursions
Testing conditions for Euro 7 – LDV Euro 7 limits and technologies – LDV
Technology packages Emission performance (simulations + demos) Emissions limits scenarios (for PO2)
Contents – LDV exhaust

Study on post-EURO 6/VI emission standards in Europe
Ammonia, NH3 AQ (1,3,4,8) - /Yes LDS, QCL, FTIR / on-board PEMS could be by QCL or FTIR.
Nitrous Oxide, N2O GHG & AQ (1, 6) Yes/Yes GC-ECD, QCL, NDIR, FTIR / on-board could be FTIR or QLC.
Methane, CH4 GHG & AQ (1, 5) Yes (not for cars)/Yes FID with cutter, GC-FID, FTIR / on-board could be FTIR.
Formaldehyde, HCHO AQ (1,2,5) - /Yes DNPH&HPLC, PTR-MS, FTIR / on-board could be FTIR.
Non-Methane Organic Gases, NMOG
AQ (1,2,5,8) - /Calculated NMOG could be FID (THC) minus CH4 plus HCHO. If other than FID (THC), oxygenates to be analysed by FTIR, GC.
10
Proposed species to be included in Euro 7
(1) health (2) vegetation (3) acidification (4) eutrophication (5) tropospheric ozone (6) stratospheric ozone (7) GWP black carbon (8) sec. aerosols
Species Groups PEMS availableTraditional/New Technologies in-laboratory /on-board
Nitrogen Oxides, NOx AQ (1,2,3,4,5,8) Yes/Yes Dual CLD, NDUV, QCL, FTIR / on-board PEMS could be by QCL or FTIR.
Carbon Monoxide, CO AQ (1) Yes/Yes NDIR, FTIR /PEMS currently poor. Improvement needed by using e.g. FTIR.
Solid particles, SPN AQ (1) - /Yes PN23 available. PN10 at the market-ready stage. PMP work.
Particulate matter, PM AQ (1,7,8) Yes (not for cars) PM-PEMS used for HDVs is not practical for cars.
New species

Study on post-EURO 6/VI emission standards in Europe11
Recommendation for limitation on-road/laboratory
NOx CO SPN10 PM NH3 N2O CH4 HCHO NMOG THCMeasured or not
Yes Yes Yes Yes Yes Yes Yes Yes Calc. (2)
Yes
LIMIT on-road
Yes Yes Yes No (3)
Yes Yes (1)
Yes(1)
Yes No (3)
No (3)
LIMIT in-lab
No (4)
No (4)
No (4)
Yes No (4)
Yes (1)
Yes(1)
No(4)
Yes No (4)
(1) Option a. To limit N2O and CH4 individually. Option b. N2O and CH4 for calculation of CO2e for potential GHG certification and GHG in-use monitoring.
(2) THC, HCHO, CH4 for calculation of NMOG: THC (FID) minus CH4 plus HCHO. FID has response factor for carbonyls other than HCHO. If THC not measured with FID, aldehydes and alcohols analysed separately.
(3) If PEMS is sufficiently accurate, CH4, THC and PM can be measured on-road subject to the same limits as in-lab.
(4) On-road limits apply, if measured in-laboratory (chassis or engine dynamometer) at the same time as CO2.

Study on post-EURO 6/VI emission standards in Europe
Objectives and Methodology Pollutants for inclusion in Euro 7 Findings from Euro 6 LDV
Emission performance of current state-of-the-art technologies (reg/non-reg species) Identification of operating/testing conditions that are related with emission excursions
Testing conditions for Euro 7 – LDV Euro 7 limits and technologies – LDV
Technology packages Emission performance (simulations + demos) Emissions limits scenarios (for PO2)
Contents – LDV exhaust

Study on post-EURO 6/VI emission standards in Europe
Sources:CLOVE “Euro 7” measurement campaigns and own data
JRC “Euro 7” measurement campaigns and own data
H2020 projects (DownToTen, GVI - Green NCAP)
Stakeholders (AECC, Vitesco, Bosch, DENSO, IFPEN)
Based on selected data from the above sources a CLOVE LDV database was developed comprising:
71 vehicles (19 Euro 6d and 52 6d-temp)
~700 tests (on-road and lab)
13
The emissions database

Study on post-EURO 6/VI emission standards in Europe14
Emission performance within current RDE boundaries Euro 6d and 6d-temp
Most vehicles already at low levels, well below the current limits when tested within current RDE, although further development is needed in some cases
High SPN observed only in technologies currently not included in regulation (PFI)
Fraction [%] of tests (urban | total) below: NOx CO SPN23
Limit* 94% | 98% 95% | 94% 93% | 97%
0.5×Limit* 75% | 87% 80% | 78% 81% | 87%
* Refers to the lowest current limit without conformity factor (e.g. 60 mg/km NOx)
On-
road
test
s
Urban Total MotorwayRural
Urban Total MotorwayRural
MotorwayRuralUrban Total

Study on post-EURO 6/VI emission standards in Europe15
Emission performance within current RDE boundaries Euro 6d only
* Refers to the lowest current limit without conformity factor (e.g. 60 mg/km NOx)
On-
road
test
s
* Refers to the lowest current limit without conformity factor (e.g. 60 mg/km NOx)
Fraction [%] of tests (urban | total) below: NOx CO SPN23
Limit* 97% | 100% 88% | 94% 88% | 97%
0.5×Limit* 76% | 97% 74% | 65 % 59% | 79%
Urban Total MotorwayRural
Urban Total MotorwayRural
MotorwayRuralUrban Total
Similar trends compared to all Euro 6d and d-temp vehicles regarding fuel/technologies comparison
The highest emitters in all species are mainly from Euro 6d-temp vehicles

Study on post-EURO 6/VI emission standards in Europe16
Emission performance beyond current RDE boundaries Euro 6d and 6d-temp
Tests beyond current RDE boundaries in terms of: driving dynamics (high v*a), high positive elevation gain, trip composition (U/R/M shares), DPF regeneration
NOx: challenging for diesel
SPN: challenging for diesel mainly during regen, also for some GDI with GPF
CO: challenging for gasoline, mainly GDI
Emission excursions are related to specific driving conditions next slides
On-
road
test
s
* Refers to the lowest current limit without conformity factor (e.g. 60 mg/km NOx)
Fraction [%] of tests (urban | total) below: NOx CO SPN23
Limit* 77% | 80% 78% | 78% 78% | 80%
0.5×Limit* 51% | 65% 64% | 63% 64% | 68%

Study on post-EURO 6/VI emission standards in Europe17
Emission performance beyond current RDE boundaries Euro 6d only
On-
road
test
s
* Refers to the lowest current limit without conformity factor (e.g. 60 mg/km NOx)
Fraction [%] of tests (urban | total) below: NOx CO SPN23
Limit* 78% | 86% 75% | 69% 68% | 71%
0.5×Limit* 56% | 69% 61% | 54% 44% | 53%
Similar trends compared to all Euro 6 vehicles regarding fuel/technologies comparison
Most high emitters of diesel NOx, gasoline CO and PFI SPN are from Euro 6d-temp vehicles
Study on post-EURO 6/VI emission standards in Europe18
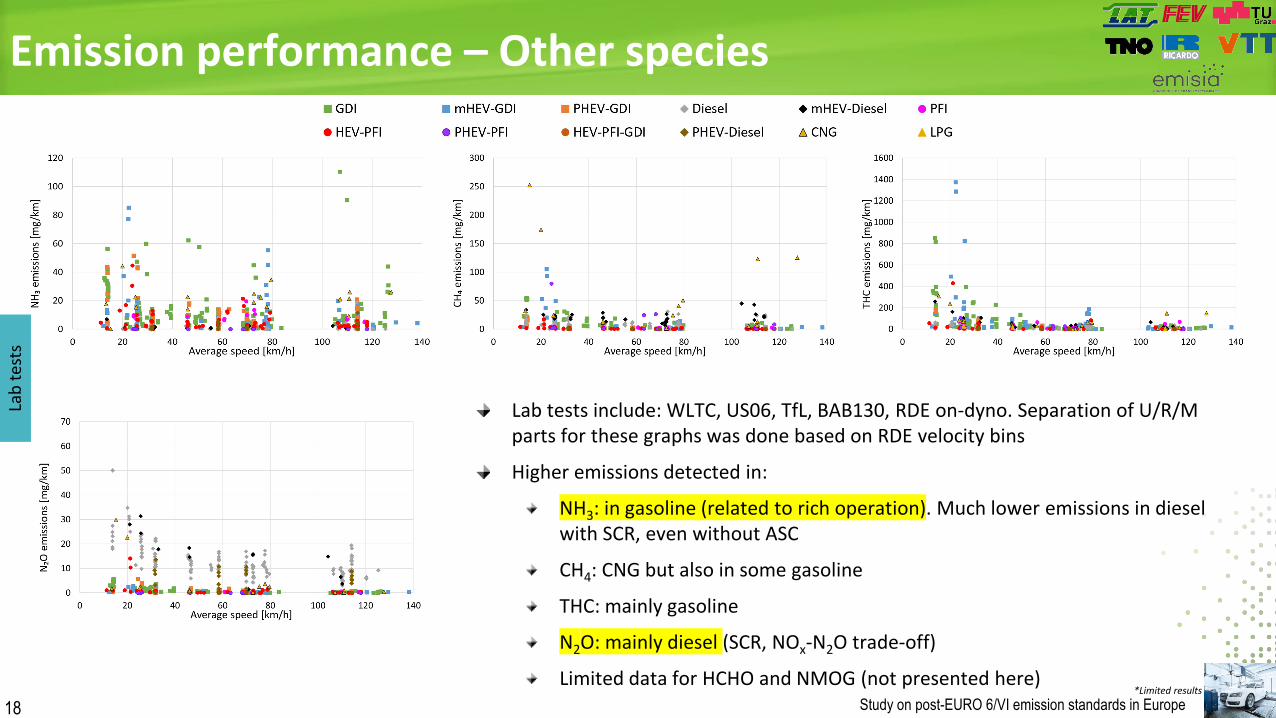
Emission performance – Other species
Lab tests include: WLTC, US06, TfL, BAB130, RDE on-dyno. Separation of U/R/M parts for these graphs was done based on RDE velocity bins
Higher emissions detected in:
NH3: in gasoline (related to rich operation). Much lower emissions in diesel with SCR, even without ASC
CH4: CNG but also in some gasoline
THC: mainly gasoline
N2O: mainly diesel (SCR, NOx-N2O trade-off)
Limited data for HCHO and NMOG (not presented here)*Limited results
Lab
test
s

Study on post-EURO 6/VI emission standards in Europe19
RDE emissions are low but increased emissions observed at:
Cold start – short tripsLow ambient temperatureHigh engine power events/periods
Harsh accelerationsUphill driving, high vehicle payload and/or trailer pullingHigh vehicle speed
Idling and low load driving which may occur during traffic congestion (severe stop-and-go situations). DPF regeneration and when filter is cleanHigh SPN from technologies currently not included in regulation (PFI and NG)

Study on post-EURO 6/VI emission standards in Europe20
Cold start – short tripsAl
l tes
tsW
ithin
cur
rent
RDE
High contribution of cold start, especially in short trips. NOx emissions at 2 km are 3.3 times higher compared to 16km (avg of all vehicles, all tests)
Areas above and below mean values: standard deviation

Study on post-EURO 6/VI emission standards in Europe21
Cold start – short trips, example tested vehicles
In all vehicles high cold start effect in short cycles
Higher cold start contribution in diesel compared to gasoline for the same cycles e.g. TfL
Shorter “cold start period” in gasoline compared to diesel
PHEV: similar trends with gasoline, but high emission peaks also during the cycle duration
Euro 6d diesel vehicle Euro 6d-temp gasoline vehicle
Euro 6d gasoline PHEV

Study on post-EURO 6/VI emission standards in Europe22
Low ambient temperature
Clear effect of low ambient temperature over different test cycles
Main difference observed in cold-start
Euro 6d diesel vehicle Euro 6d-temp gasoline vehicle
Study on post-EURO 6/VI emission standards in Europe23
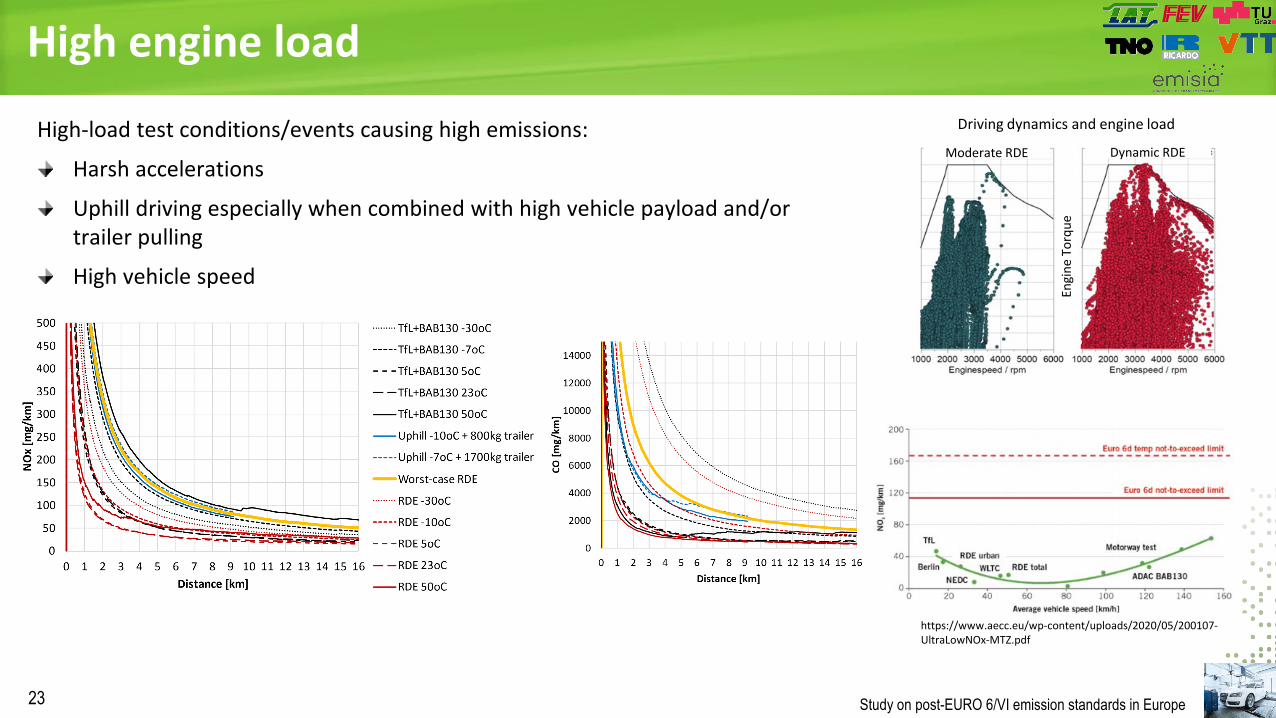
High engine load
High-load test conditions/events causing high emissions:
Harsh accelerations
Uphill driving especially when combined with high vehicle payload and/ortrailer pulling
High vehicle speed
Driving dynamics and engine load
Moderate RDE Dynamic RDE
Engi
ne T
orqu
e
https://www.aecc.eu/wp-content/uploads/2020/05/200107-UltraLowNOx-MTZ.pdf

Study on post-EURO 6/VI emission standards in Europe24
High engine load effects (from H2020 GVI)
High v×apos is associated with high NOx (diesel) and CO (petrol). The PEMS heavy trip generally has higher emissions than the cold (regular) trips for the same high(er) v×apos bins.
Each point has at least 20 seconds of data

Study on post-EURO 6/VI emission standards in Europe25
Low load – idling
Emissions during long idling were found to increase in some diesel vehicles due to EATS low temperature
No similar issue for gasoline
Start&Stop system can eliminate this issue, but this may not always be possible e.g. air-condition on, low battery level
Request for heating measures in the future regulation to keep the EATS warm in long idle phases
Idle period Idle period
Dies
el

Study on post-EURO 6/VI emission standards in Europe26
DPF regeneration – SPN emissions
Significant effect of DPF regeneration on PN emissions. Emissions on tests with DPF regeneration can be more than 2 orders of magnitude higher compared to tests without regen.
Filtration efficiency of “clean” filters still an issue both in diesel (during and after regen) and GPF (passive regen)
Increase of NOx emissions was also observed during DPF regeneration, but this issue is expected to be eliminated already at (late) Euro 6 stages
Similar on-road test w/o DPF regen
On-road test with DPF regen
Test/Phase PN emissions [p/km]
Total test w/ DPF regen 5.4Ε+11
DPF regeneration period 4.9E+12
Total test w/o DPF regen 7.9E+10
7:1

Study on post-EURO 6/VI emission standards in Europe
Objectives and Methodology Pollutants for inclusion in Euro 7 Findings from Euro 6 LDV
Emission performance of current state-of-the-art technologies (reg/non-reg species) Identification of operating/testing conditions that are related with emission excursions
Testing conditions for Euro 7 – LDV Euro 7 limits and technologies – LDV
Technology packages Emission performance (simulations + demos) Emissions limits scenarios (for PO2)
Contents – LDV exhaust

Study on post-EURO 6/VI emission standards in Europe28
Testing conditions for Euro 7
“very cold”
“long idling”
“stop-and-go”
“short trips”
“full load”
“up hill”
“high accelerations”
“high altitudes”Normal Conditions of
Use
Emiss
ions
, Veh
icle
kilo
met
ers
Veh.km
Emissions performance of current Euro 6d vehicles
Driving conditions used for the assessment of Euro 7 technology packages (next section)
Normal conditions of useo Fully compliant with current RDE
test boundarieso Corresponding to “moderate” RDE
conditions
Extended conditions of useo Worst-case RDE
Extendedconditions of use
Extendedconditions of use

Study on post-EURO 6/VI emission standards in Europe
0
400
800
1200
1600
2000
2400
0 5 10 15 20 25 30 35 40
Cum
ulat
ive
NO
xEm
issio
ns [m
g]
Distance [km]
Budget: 30 × 16 = 480 mg/test Normal conditions
Functional form of emission limits
CLOVE approach to emissions limitation recognises the challenges of short tests, idle and “stop and go” on per km basisLimit approach: a budget up to 16 km and a constant value in mg/km or #/km above 16 kmA restriction is applied to the maximum power developed for the first e.g. 1 to 2 km and 1 to 2 min

Study on post-EURO 6/VI emission standards in Europe
Proposed testing conditions for Euro 7Parameter Current RDE boundaries
EURO 7Normal Conditions of use
EURO 7Extended Conditions of use
Emission Limit Form Constant value in mg/km or #/km A budget up to 16 km and a constant value in mg/km or #/km above 16 km
3 times the limit of normal conditions
Ambient temperature [oC] Moderate: 0 – 30oC | Extended: -7 – 0oC & 30 – 35oC -7 to 35oC -10 to +45°C
Average speed [km/h]Urban: 15-40 km/h, Limitations for trip distance and
duration, and speed range coverageAs per normal use As per normal use
Trip composition 33% urban, 33% rural, 33% highway As per normal use As per normal use
v×apos [95th] [W/kg] Speed-based calculated maximum limitsA restriction is applied to the maximum power developed for the first e.g. 1 to 2
km and 1 to 2 min(The exact approach and values are
under investigation and testing)
As per normal use
Relative positive acceleration RPA m/s2 Speed-based calculated minimum limits As per normal use
Drive-off ― As per normal use
Positive elevation gain [m/100km]Total: <1200 [m/100km]
Urban: <1200 [m/100km]As per normal use
Max. altitude [m] Moderate: 0 – 700m | Extended: 700 – 1300m 1600 m 2200 m
Towing/aerodynamic modifications Not included Not included Allowed
Age/Mileage of Vehicle [km] ISC 100k | MaS 160k Up to 240k km or 10 years (1) Up to 240k km or 10 years (1)
Minimum mileage before testing 15000 km (ISC testing) 3000 km As per normal use
Trip distance [km] U/R/M >16 km each Any Any
Max. speed 145 [160] km/h Any <160 km/h All European conditions
(1) The durability of the emission control systems until the end of their lifetime will be dealt separately

Study on post-EURO 6/VI emission standards in Europe31
Vehicle kilometer distribution in the EU
Only a small fraction of about 0.1% in temperatures below -10°C.
Less than 0.1% of all veh-km are driven in altitudes above 800 m
Temperatures: www.weatherbase.com; Elevation: Eurostat; Population density: Eurostat; v-km: own database on vehicle fleets, compiled from data by many different sources such as ACEA, Eurostat, DG MOVE statistical pocketbook, etc.

Study on post-EURO 6/VI emission standards in Europe
Objectives and Methodology Pollutants for inclusion in Euro 7 Findings from Euro 6 LDV
Emission performance of current state-of-the-art technologies (reg/non-reg species) Identification of operating/testing conditions that are related with emission excursions
Testing conditions for Euro 7 – LDV Euro 7 limits and technologies – LDV
Technology packages Emission performance (simulations + demos) Emissions limits scenarios (for PO2)
Contents – LDV exhaust
Study on post-EURO 6/VI emission standards in Europe
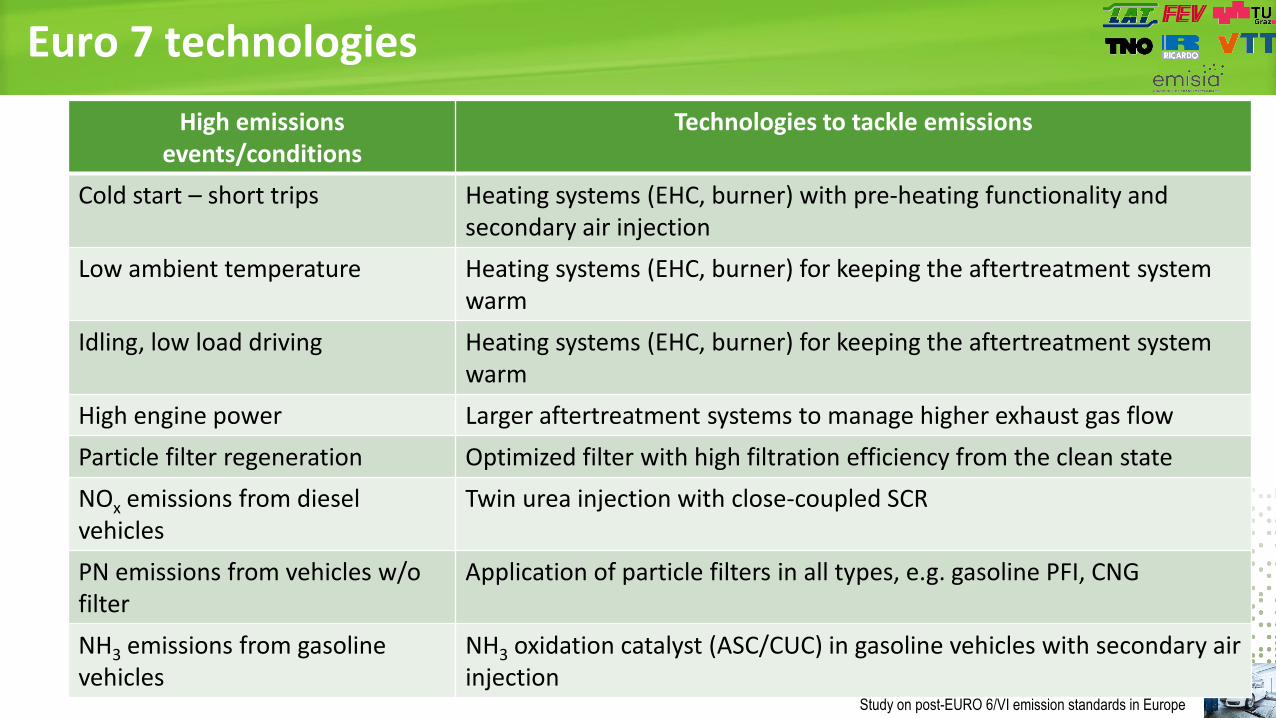
Euro 7 technologies High emissions
events/conditionsTechnologies to tackle emissions
Cold start – short trips Heating systems (EHC, burner) with pre-heating functionality and secondary air injection
Low ambient temperature Heating systems (EHC, burner) for keeping the aftertreatment system warm
Idling, low load driving Heating systems (EHC, burner) for keeping the aftertreatment system warm
High engine power Larger aftertreatment systems to manage higher exhaust gas flowParticle filter regeneration Optimized filter with high filtration efficiency from the clean stateNOx emissions from diesel vehicles
Twin urea injection with close-coupled SCR
PN emissions from vehicles w/o filter
Application of particle filters in all types, e.g. gasoline PFI, CNG
NH3 emissions from gasoline vehicles
NH3 oxidation catalyst (ASC/CUC) in gasoline vehicles with secondary air injection

Study on post-EURO 6/VI emission standards in Europe
Euro 7 technology packages – gasoline 1/2 Gasoline
Short name Technologies/components integrated
G1 – Base 2020 Base TWC, base GPF
G2 – Base 2025 opt Advanced calibration, larger TWC, improved GPF
G3 – MHEV Base 2020
Mild hybrid, base TWC, base GPF
G4 – MHEV 2025 optMild hybrid, advanced calibration, larger TWC, improved GPF
G5 – MHEV 2025 opt e-cat
Mild hybrid, advanced calibration, larger TWC, improved GPF, 4kW EHC
G6 – MHEV 2025 opt e-cat 10s
Mild hybrid, advanced calibration, larger TWC, improved GPF, 4kW EHC, 10s preheating, secondary air injection, CUC (NH3 catalyst)
G7 – MHEV 2025 opt burner 10s
Mild hybrid, advanced calibration, larger TWC, improved GPF, 15kW fuel burner, 10s preheating, secondary air injection, CUC (NH3 catalyst)
Main technologies

Study on post-EURO 6/VI emission standards in Europe
Euro 7 technology packages – gasoline 2/2 Gasoline
Short name Technologies/components integrated
G8 – PHEV Base 2020
Plugin hybrid, base TWC, base GPF
G9 – PHEV 2025 opt
Plugin hybrid, advanced calibration, larger TWC, improved GPF
G10 – PHEV 2025 opt e-cat
Plugin hybrid, advanced calibration, larger TWC, improved GPF, 4kW EHC
G11 – PHEV 2025 opt e-cat 60s
Plugin hybrid, advanced calibration, larger TWC, improved GPF, 4kW EHC, 60s preheating, secondary air injection, CUC (NH3 catalyst)
G12 – PHEV 2025 opt burner 30s
Plugin hybrid, advanced calibration, larger TWC, improved GPF, 15kW fuel burner, 30s preheating, secondary air injection, CUC (NH3 catalyst)
G13 – PHEV 2025 opt e-cat 60s 8kW
Plugin hybrid, advanced calibration, larger TWC, improved GPF, 8kW EHC, 60s preheating, secondary air injection, CUC (NH3 catalyst), passive SCR, LNT

Study on post-EURO 6/VI emission standards in Europe
Euro 7 technology packages – dieselDiesel
Short name Technologies integrated
D1 – MHEV P0 2025 opt
Mild hybrid, advanced heating calibration, larger EATS
D2 – MHEV P0 2025 opt e-cat
Mild hybrid, advanced heating calibration, larger EATS, EHC
D3 – MHEV P0 2025 opt e-cat preheating
Mild hybrid, advanced heating calibration, larger EATS, EHC, preheating, secondary air injection
D4 – PHEV P2 2025 opt
Plugin hybrid, advanced heating calibration, larger EATS
D5 – PHEV P2 2025 opt e-cat
Plugin hybrid, advanced heating calibration, larger EATS, EHC, turbine bypass
Turbine bypass
Main technologies

Study on post-EURO 6/VI emission standards in Europe37
Cycles used for the evaluations: Moderate and Worst-case RDE

Study on post-EURO 6/VI emission standards in Europe
Euro 7 emission performance – LDV gasoline, NOx
Normal conditions of use – moderate RDE Worst-case RDE*
*Worst-case RDE is used here as an example of extended conditions of use. Higher emission values can be observed in more extreme conditions e.g. -15oC, trailer towing, direct acceleration to max permissible speed.

Study on post-EURO 6/VI emission standards in Europe
Euro 7 emission performance – LDV gasoline, CO
Normal conditions of use – moderate RDE Worst-case RDE*
*Worst-case RDE is used here as an example of extended conditions of use. Higher emission values can be observed in more extreme conditions e.g. -15oC, trailer towing, direct acceleration to max permissible speed.

Study on post-EURO 6/VI emission standards in Europe
Euro 7 emission performance – LDV gasoline, HC
Normal conditions of use – moderate RDE Worst-case RDE*
*Worst-case RDE is used here as an example of extended conditions of use. Higher emission values can be observed in more extreme conditions e.g. -15oC, trailer towing, direct acceleration to max permissible speed.

Study on post-EURO 6/VI emission standards in Europe
Euro 7 emission performance – LDV gasoline, PN
Normal conditions of use – moderate RDE Worst-case RDE*
*Worst-case RDE is used here as an example of extended conditions of use. Higher emission values can be observed in more extreme conditions e.g. -15oC, trailer towing, direct acceleration to max permissible speed.

Study on post-EURO 6/VI emission standards in Europe
Euro 7 emission performance – LDV diesel, NOx
Normal conditions of use – moderate RDE Worst-case RDE*
*Worst-case RDE is used here as an example of extended conditions of use. Higher emission values can be observed in more extreme conditions e.g. -15oC, trailer towing, direct acceleration to max permissible speed.

Study on post-EURO 6/VI emission standards in Europe
Euro 7 emission performance – LDV diesel, CO
Normal conditions of use – moderate RDE Worst-case RDE*
*Worst-case RDE is used here as an example of extended conditions of use. Higher emission values can be observed in more extreme conditions e.g. -15oC, trailer towing, direct acceleration to max permissible speed.

Study on post-EURO 6/VI emission standards in Europe
Euro 7 emission performance – LDV diesel, HC
Normal conditions of use – moderate RDE Worst-case RDE*
*Worst-case RDE is used here as an example of extended conditions of use. Higher emission values can be observed in more extreme conditions e.g. -15oC, trailer towing, direct acceleration to max permissible speed.

Study on post-EURO 6/VI emission standards in Europe
CO and NOx over Worst Case RDE at -10oC

Study on post-EURO 6/VI emission standards in Europe
Tests including a DPF regeneration will be valid tests in Euro 7
Extra PN emissions due to DPF regeneration will be considered based on regeneration interval
Determination of average regeneration interval:derived by OBM system based on last ~10 regenerations. New vehicle start with a declared regeneration frequency from OEM.
OEM shows to the tester regeneration start and end, as well as estimated end and estimated mileage until next regeneration start
Proposed approach:2 tests: one including regeneration (full) and one without, >16 km each
Weighted average emissions:
46
Inclusion of filter regeneration
doi.org/10.3390/atmos11060645
DPF regen interval [km] – JRC study
DPF regeneration interval of Euro 6d-temp and 6d vehicles included in CLOVE
database: 145-440 km
𝑷𝑷𝑷𝑷𝒑𝒑𝒌𝒌𝒌𝒌 =
𝑷𝑷𝑷𝑷𝑟𝑟𝑟𝑟𝑟𝑟𝑟𝑟𝑟𝑟_𝑐𝑐𝑐𝑐𝑐𝑐𝑐𝑐𝑟𝑟𝒑𝒑𝒌𝒌𝒌𝒌 ∗ 𝑑𝑑𝑟𝑟𝑟𝑟𝑟𝑟𝑟𝑟𝑟𝑟_𝑐𝑐𝑐𝑐𝑐𝑐𝑐𝑐𝑟𝑟 𝒌𝒌𝒌𝒌 + 𝑷𝑷𝑷𝑷𝑤𝑤/𝑜𝑜_𝑟𝑟𝑟𝑟𝑟𝑟𝑟𝑟𝑟𝑟
𝒑𝒑𝒌𝒌𝒌𝒌 ∗ (𝑟𝑟𝑟𝑟𝑟𝑟𝑟𝑟𝑟𝑟_𝑖𝑖𝑟𝑟𝑖𝑖𝑟𝑟𝑟𝑟𝑖𝑖𝑖𝑖𝑖𝑖 − 𝑑𝑑𝑟𝑟𝑟𝑟𝑟𝑟𝑟𝑟𝑟𝑟_𝑐𝑐𝑐𝑐𝑐𝑐𝑐𝑐𝑟𝑟)[𝒌𝒌𝒌𝒌]
𝑟𝑟𝑟𝑟𝑟𝑟𝑟𝑟𝑟𝑟_𝑖𝑖𝑟𝑟𝑖𝑖𝑟𝑟𝑟𝑟𝑖𝑖𝑖𝑖𝑖𝑖 [𝒌𝒌𝒌𝒌]

Study on post-EURO 6/VI emission standards in Europe47
Effect of ash on PN emissions - GPF
Ash state PN emissions [p/km]
Clean ~4E+10
0.05g/l ~1.5E+10
0.2 g/l ~1.5E+09
Engine-out 1.6E+11
Ash state PN emissions [p/km]
Clean ~9.4E+10
0.05g/l ~3.6E+10
0.2 g/l ~8E+09
Engine-out 2.5E+11
Moderate RDE Worst-case RDE
Ash loading can significantly affect filtration efficiency
“Negative deterioration” of filtration efficiency is expected due to continuous ash loading
A minimum mileage of 3000km is proposed for Euro 7 valid testing
New filter technology or “ashed” filter
Ash accumulation over lifetime
New filter technology or “ashed” filter
Ash accumulation over lifetime
Study on post-EURO 6/VI emission standards in Europe48
Limit approach for LCVs
There should no longer be an artificial separation between N1 and M1. Many N1 vehicles have twins in M1, for example, taxi vans and campers.One exception is the low-powered LCV, which is unique in its GVW and power and therefore usage. This was recognized in RDE4 (EC/2018/1832), and testing was restricted for these vehicles. If such vehicles are tested in the same manner as all light duty vehicles, i.e., lifting boundary conditions, the emission limit should be appropriately higher, as this testing is more demanding for such vehicles.The sole criteria for this separate class of true LCVs (or “small HD”) is: TPMLM > 2500 kg and PWR < 35 kW/t (TPMLM based and continuous system power).

Study on post-EURO 6/VI emission standards in Europe49
Euro 7 emission limits scenarios – LDV in mg/km, #/km
Euro 7 scenarios NOx SPN10 CO CH4
(1) N2O (1) NH3
EURO 6 60/80 (PI/CI) 6×10¹¹ (SPN23) 1000/500 (PI/CI) - - -
A 30 1×10¹¹ 300 10 10 5
B 10 6×10¹⁰ 100 5 5 2
• One comprehensive limit with no conformity or other correction factor
• Limits fuel and technology agnostic
• The same limits also applicable to PCs and LCVs
• All limits applicable during particle filter regeneration
• Possible emission limits still being discussed for:o NO2
o THC and NMOG/NMHCo HCHO
(1) Suggested to limit weighted sum of CH4 and N2O instead of separate limits
Proposals from AGVES October 2020No longer under consideration

Study on post-EURO 6/VI emission standards in Europe
Emissions limits for cars/vans for normal conditions of use
Pollutant CO NMOG NOx PM PN10 NH3 CH4 N2O HCHO
Unit mg/km mg/km mg/km mg/km #/km mg/km mg/km mg/km mg/km
Scenario 1
Cars withand Vans
400 45 30 2 1×10¹¹ 10 10 10 5
Vans with TPMLM>2500 kg &
PWR<35 kW/t600 45 45 2 1×10¹¹ 10 10 10 5
Scenario 2
Carsand Vans
400 25 20 2 1×10¹¹ 10 10 10 5
Vans with TPMLM>2500 kg &
PWR<35 kW/t600 25 30 2 1×10¹¹ 10 10 10 5

Study on post-EURO 6/VI emission standards in Europe
On behalf of the CLOVE consortium: Thank you!
51

Study on post-EURO 6/VI emission standards in Europe
Backup slides
52

Study on post-EURO 6/VI emission standards in Europe
General objectives of “Part A Study”Propose limit values for each emissions species of interest
Need for more stringent emission limits in a more complex external environment with the required agility and flexibility to adapt to the most advanced clean technologies
Emission speciesAlready regulated (tightening the limits) Not currently regulated in EU (introducing limits)Exhaust and non-exhaust
More complete coverage of driving conditionsTechnology-based approach – assessing potential emissions performance and costs
Culmination of work from “Part A” study
Fuel and technology agnostic limit valuesInput to the Impact Assessment study of “Part B” study (marginal costs and benefits compared to Euro 6/VI)

Study on post-EURO 6/VI emission standards in Europe54
Vehicle kilometer distribution in Finland and Greece
Temperatures: www.weatherbase.com; Elevation: Eurostat; Population density: Eurostat; v-km: own database on vehicle fleets, compiled from data by many different sources such as ACEA, Eurostat, DG MOVE statistical pocketbook, etc.
Greece North Finland

Study on post-EURO 6/VI emission standards in Europe55
Limits approach for LCV The sole criteria for the separate class of true LCVs (or “small HD”) is: TPMLM > 2500 kg and PWR < 35 kW/t (TPMLM based and continuous system power).

Study on post-EURO 6/VI emission standards in Europe
Pollutant CO THC NMHC NOx THC+NOx PM SPN23 NH3 CH4
Category (mg/km) (mg/km) (mg/km) (mg/km) (mg/km) (mg/km) (km-1) (ppm) (mg/km)
Euro 6 Cars & Vans with RM≤1305 kg
PI 1000 100 68 60 - 4.5 (DI) 6×10¹¹ (DI)
- -
CI 500 - - 80 170 4.5 6×10¹¹
Euro 6 Vans with
1305<RM≤1760 kg
PI 1810 130 90 75 - 4.5 6×10¹¹ (DI)
CI 630 - - 105 195 4.5 6×10¹¹
Euro 6 Vans with
RM>1760 kg
PI 2270 160 108 82 - 4.5 6×10¹¹ (DI)
CI 740 - - 125 215 4.5 6×10¹¹
56
Euro 6 Emission Limits for LCVs
Euro 6 Emission Limit Ratios (CI engines) NOx CO PN THC
Class II/ Class I 105:80=1.31 630:500=1.26 = 1 (6×10¹¹)
Class III/Class I 125:80=1.56 740:500=1.48 = 1 (6×10¹¹) [90:90=1]