An Emission and Performance Comparison of the Natural … · Euro III European Heavy-duty Emission...
40
April 2003 • NREL/SR-540-32863 E.J. Lyford-Pike Cummins, Inc. Columbus, Indiana An Emission and Performance Comparison of the Natural Gas C-Gas Plus Engine in Heavy-Duty Trucks Final Report National Renewable Energy Laboratory 1617 Cole Boulevard Golden, Colorado 80401-3393 NREL is a U.S. Department of Energy Laboratory Operated by Midwest Research Institute • Battelle • Bechtel Contract No. DE-AC36-99-GO10337
Transcript of An Emission and Performance Comparison of the Natural … · Euro III European Heavy-duty Emission...

April 2003 • NREL/SR-540-32863
E.J. Lyford-Pike Cummins, Inc. Columbus, Indiana
An Emission and Performance Comparison of the Natural Gas C-Gas Plus Engine in Heavy-Duty Trucks Final Report
National Renewable Energy Laboratory 1617 Cole Boulevard Golden, Colorado 80401-3393 NREL is a U.S. Department of Energy Laboratory Operated by Midwest Research Institute • Battelle • Bechtel
Contract No. DE-AC36-99-GO10337
April 2003 • NREL/SR-540-32863
An Emission and Performance Comparison of the Natural Gas C-Gas Plus Engine in Heavy-Duty Trucks Final Report
E.J. Lyford-Pike Cummins, Inc. Columbus, Indiana
NREL Technical Monitor: M. Frailey Prepared under Subcontract No. ZCI-8-18055-02
National Renewable Energy Laboratory 1617 Cole Boulevard Golden, Colorado 80401-3393 NREL is a U.S. Department of Energy Laboratory Operated by Midwest Research Institute • Battelle • Bechtel
Contract No. DE-AC36-99-GO10337
NOTICE This report was prepared as an account of work sponsored by an agency of the United States government. Neither the United States government nor any agency thereof, nor any of their employees, makes any warranty, express or implied, or assumes any legal liability or responsibility for the accuracy, completeness, or usefulness of any information, apparatus, product, or process disclosed, or represents that its use would not infringe privately owned rights. Reference herein to any specific commercial product, process, or service by trade name, trademark, manufacturer, or otherwise does not necessarily constitute or imply its endorsement, recommendation, or favoring by the United States government or any agency thereof. The views and opinions of authors expressed herein do not necessarily state or reflect those of the United States government or any agency thereof.
Available electronically at http://www.osti.gov/bridge
Available for a processing fee to U.S. Department of Energy and its contractors, in paper, from:
U.S. Department of Energy Office of Scientific and Technical Information P.O. Box 62 Oak Ridge, TN 37831-0062 phone: 865.576.8401 fax: 865.576.5728 email: [email protected]
Available for sale to the public, in paper, from:
U.S. Department of Commerce National Technical Information Service 5285 Port Royal Road Springfield, VA 22161 phone: 800.553.6847 fax: 703.605.6900 email: [email protected] online ordering: http://www.ntis.gov/ordering.htm
Printed on paper containing at least 50% wastepaper, including 20% postconsumer waste

i
Table Of Contents List of Figures and Tables ……………………………………………………………………….. ii List of Acronyms …………………………………………………………………………………. iii 1.0 Executive Summary ……………………………………………………………………… 1 2.0 Introduction ………………………………………………………………………………. 2 2.1 Project Objectives …………………………………………………………………………. 3 2.2 Project Participants ………………………………………………………………………. 3 3.0 Laboratory Development of the C-Gas Plus Engine …………………………………….. 4 3.1 Control System …………………………………………………………………………… 4
3.2 Hardware and Software Modifications …………………………………………………… 5 3.3 Knock Sensing and Control …………………………………………………………….… 6 3.4 Mechanical Development Tests ………………………………………………………….. 7
4.0 Fleet Operations ………………………………………………………………………….. 8 4.1 Procurement and Installation of Prototype Engines …………………………………….... 8
4.2 Vehicle Retrofit …………………………………………………………………………... 11 4.3 Development of Prototype Engines in Service …………………………………………… 12
5.0 Emission Testing …………………………………………………………………………. 15 5.1 Chassis Dynamometer Emission Testing ………………………………………………… 15
5.2 Certification Testing ……………………………………………………………………… 17 6.0 Conclusions ………………………………………………………………………………. 19 Appendix A: Chassis Dynamometer Emission Testing ………………………………………….. 20 Appendix B: Composition of Natural Gas Used by Viking Test Fleet …………………………... 33
ii
List of Figures Figure 1: Cummins C-Gas Plus Engine ………………………………………………………….. 2 Figure 2: C-Gas Plus Control Architecture ………………………………………………………. 5 Figure 3: C-Gas Plus Power/Torque Curves …………………………………………………….. 5 Figure 4: CNG Fuel Quality by Region …………………………………………………………. 6 Figure 5: Knock Sensor Locations ………………………………………………………………. 7 Figure 6: C-Gas Plus ECM Mounting Bracket ………………………………………………….. 8 Figure 7: Cummins Transit Test Bus ……………………………………………………………. 8 Figure 8: Viking Freight Test Vehicle for In-Use Development of C-Gas Plus Engine ………… 9 Figure 9: Waste Management Test Vehicle for In-Use Development of C-Gas Plus Engine …… 9 Figure 10: SunLine Test Vehicle for In-Use Development of C-Gas Plus Engine ……………… 10 Figure 11: Viking Freight Test Truck ……………………………………………………………. 11 Figure 12: Vehicle Fuel Economy as a Function of Test Time ………………………………….. 14 Figure 13: Fuel Costs for Natural Gas and Diesel Trucks ………………………………………… 15 Figure 14: Speed/Time Trace for UDDS Cycle ………………………………………………….. 16 Figure 15: Speed/Time Trace for Viking Cycle ………………………………………………….. 16 Figure 16: UDDS Cycle Emissions ………………………………………………………………. 17 Figure 17: Viking Cycle Emissions ……………………………………………………………… 17 Figure A1: Vehicle Under Test in Position on Dynamometer Rollers …………………………… 20 Figure A2: Hub Adapter Connection to the Drive Axle …………………………………………. 21 Figure A3: Heavy-Duty UDDS Cycle …………………………………………………………… 22 Figure A4: Modified UDDS Cycle ………………………………………………………………. 23 Figure A5: Speed-Time Plot of the Viking Ad Hoc Cycle ………………………………………. 24 Figure A6: Modified Viking Cycle ………………………………………………………………. 25 Figure A7: CO Emissions ………………………………………………………………………… 27 Figure A8: NOx Emissions ……………………………………………………………………….. 28 Figure A9: Methane, NMHC, and THC Emissions ……………………………………………… 29 Figure A10: TPM Emissions …………………………………………………………………….. 30 Figure A11: CO2 Emissions and Fuel Economy …………………………………………………. 30 List of Tables Table 1: ECM Capabilities ……………………………………………………………………….. 4 Table 2: Test Vehicles and Locations ……………………………………………………………. 9 Table 3: Test Vehicle Specifications …………………………………………………………….. 11 Table 4: C-Gas Plus Certification Test Results …………………………………………………... 18 Table A1: Emissions Summary for the Modified UDDS Cycle …………………………………. 26 Table A2: Emissions Summary for the Modified Viking Cycle …………………………………. 26 Table A3: Fuel Properties ………………………………………………………………………… 32
iii
List of Acronyms bhp Brake horsepower Btu British thermal unit CARB California Air Resource Board CNG Compressed natural gas CO Carbon monoxide CO2 Carbon dioxide CVS Constant volume sampling CWI Cummins Westport Inc. DGE Diesel gallon equivalent ECM Engine control module EPA U.S. Environmental Protection Agency Euro III European Heavy-duty Emission Standard FMEA Failure mode and effects analysis FTP Federal Test Procedure GCVWR Gross combined vehicle weight rating GVWR Gross vehicle weight rating HC Hydrocarbon HCHO Formaldehyde HFID Heated flame ionization detector hp Horsepower mpeg Miles per energy equivalent gallon mpg Miles per gallon mph Miles per hour mpq Miles per quart NMHC Non-methane hydrocarbon NOx Oxides of nitrogen NREL National Renewable Energy Laboratory PM Particulate matter PM10 Particulate matter (less than 10 microns) RMS Root mean square RPM Revolutions per minute scf Standard cubic feet scfm Standard cubic feet per minute SET Supplemental emission test TBI Throttle body injection THC Total hydrocarbon TPM Total particulate matter UDDS Urban Dynamometer Driving Schedule ULEV Ultra-low emission vehicle WRFC Wide range fuel capability WVU West Virginia University
1
1.0 Executive Summary Natural gas is an abundant domestic fuel. The U.S. Department of Energy (DOE) supports natural gas vehicle (NGV) research and development to help the United States reach its goal of reducing dependence on imported petroleum, as outlined in the Energy Policy Act of 1992. Another benefit of NGVs is that they can reduce emissions of regulated pollutants compared with diesel vehicles. To advance NGV technology, DOE’s National Renewable Energy Laboratory (NREL) supported on-road prototype development of the Cummins Westport Inc. (CWI) C8.3G Plus (C-Gas Plus) compressed natural gas engine, beginning in November 2000. The goal of the project was to advance laboratory-developed technologies, on road and in service, for a natural gas truck and bus engine with significant improvements over the previous C8.3G natural gas engine. This report summarizes on-road prototype development of the C-Gas Plus engine. The C-Gas Plus was launched into production in July 2001. Compared with the earlier C8.3G engine, the C-Gas Plus has increased ratings for horsepower and torque and improved diagnostic capability. It has a full-authority engine controller, knock sensing, and wide tolerance to natural gas fuel (the minimum methane number is 65). Two Class 8 tractor-trailers from Viking Freight were equipped with the C-Gas Plus engine for a 1-year development and data collection program. Two similar tractor-trailers were operated with a Cummins C8.3 diesel engine for comparison purposes. The Viking fleet typically picks up and delivers packaged dry goods. Monthly mileage varied from 500 to 2,000 miles. The natural gas trucks’ fuel storage design consisted of nine CNG cylinders with total capacity of 49.8 DGE for a range of over 200 miles. Average cumulative fuel economy of the natural gas trucks was 5.17 mpeg, with the diesel trucks averaging 6.73 mpg. This represents a 23.2% fuel economy penalty for the natural gas trucks. Fuel costs of the natural gas trucks when fueled at Viking’s on-site station were 31% lower ($0.11/mi versus $0.16/mi) compared with the diesel trucks; they were 94% higher ($0.31/mi versus $0.16/mi) when fueled at a public station. The natural gas trucks drove and handled similar to their diesel counterparts. West Virginia University and CWI developed a custom drive cycle for the Viking trucks and performed chassis dynamometer emission testing on the trucks using this cycle as well as the heavy-duty Urban Dynamometer Driving Schedule (UDDS). The natural gas trucks significantly reduced NOx (24% and 45% for the UDDS and Viking cycles) and PM (greater than 90%) emissions relative to their conventional diesel counterparts. The C-Gas Plus engine was tested by CWI for emission certification protocols including the supplemental emission test (SET). EPA and CARB granted the following emission certifications for the C-Gas Plus engine:
• Automotive w/catalyst, EPA heavy-duty standards and CARB low NOx (2.0 g/bhp-h) • Urban bus w/catalyst, EPA heavy-duty, EPA ULEV, and CARB low NOx (2.0 g/bhp-h)

2
2.0 Introduction The C8.3G Plus (C-Gas Plus) compressed natural gas (CNG) engine (Figure 1) was launched into production in July 2001 after extensive laboratory development and field testing. It is an improvement on the earlier C8.3G engine in many ways. It has a new control module with increased memory, speed, and features. It eliminates a separate, non-engine-mounted governor control module. It has state-of-the-art electronic engine management with full control of air/fuel handling and drive-by-wire function.
Figure 1: Cummins C-Gas Plus Engine Performance enhancements for improved system response and control were also implemented. The following are key new features incorporated into the C-Gas Plus as a part of the new control system, sensors, and actuators: • Robust oxygen sensor • Engine backpressure compensation • Fuel supply pressure monitoring • Knock sensing and control • Intake manifold temperature monitoring and protection • Supply voltage monitoring Electronic service tools were developed to enable better field support of the engine’s advanced electronics. More than 55 new diagnostic and fault codes were added. Extensive mechanical validation testing was performed before launch, including 4,500 hours of laboratory endurance testing under various operating conditions such as overload, thermal cycles, and typical field duty cycles. More than 300,000 miles were accumulated in field testing with
3
different applications, including transit buses, refuse trucks, and the Viking Freight delivery trucks documented in this report. This report details some of the development of the C-Gas Plus engine. It discusses laboratory development of the engine, field testing with an emphasis on in-use testing by Viking Freight, and emission testing. Appendix A provides additional detail on chassis dynamometer emission testing of the Viking Freight tractor-trailers equipped with C-Gas Plus engines. 2.1 Project Objectives The objective of this project was to develop, on road and in service, a natural gas truck/bus engine (the C-Gas Plus) with higher horsepower, lower cost, and better performance and diagnostics than the previous C8.3G natural gas engine. The engine was to have an advanced engine management control system to enable implementation of proven technologies that improve engine performance and power density (hp/L). The C-Gas Plus engine was designed to meet the following objectives: • Higher engine ratings (280 hp and 850 ft-lb torque for the C-Gas Plus) than the C8.3G natural
gas engine • Lower capital cost than the C8.3G engine • Low emission standards: California Air Resources Board (CARB) low-NOx (oxides of nitrogen)
(2.0 g/bhp-h) and U.S. Environmental Protection Agency (EPA) Clean Fuel Fleet Program ultra-low emission vehicle (ULEV) emission certifications
2.2 Project Participants Project participants and their roles in the project are described below: U.S. Department of Energy/National Renewable Energy Laboratory (NREL) Managed on-road prototype development at Viking Freight. Cummins Inc. Acted as primary subcontractor for this project (Product Development, Advanced Engineering, Service and Application teams participated); managed project for NREL. Cummins Westport Inc. (CWI) Joint venture between Cummins and Westport Innovations to develop, manufacture, and market natural gas engines; will produce the C-Gas Plus engine in the future. Southern California Gas Company Coordinated vehicle retrofit activities and Viking Freight support; installed Viking’s in-house fueling station. Viking Freight Operated field test site for the two natural gas trucks and the two diesel control trucks. NGV Ecotrans Retrofitted natural gas vehicles used in study.
4
West Virginia University (WVU) Tested emissions with chassis dynamometer; developed Viking ad hoc cycle. Cummins Cal Pacific Inc. (Cummins Distributor) Supported on-site field test at Viking Freight. South Coast Air Quality Management District, California Energy Commission, Gas Technology Institute, SunLine Transit Supported the laboratory development, field test, and electronic tools development for the C-Gas Plus engine. 3.0 Laboratory Development of the C-Gas Plus Engine The C-Gas Plus control system, hardware and software, and knock sensing and control were enhanced during laboratory development. Mechanical development testing was performed to assess the durability of the engine.
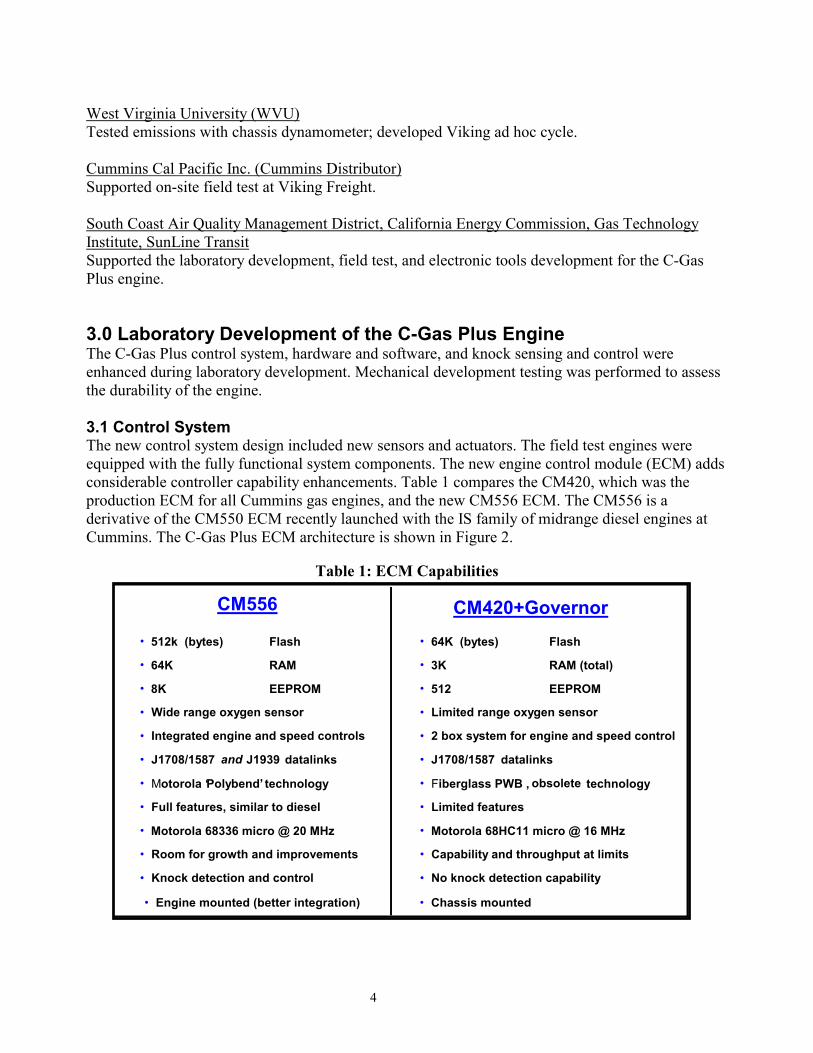
3.1 Control System The new control system design included new sensors and actuators. The field test engines were equipped with the fully functional system components. The new engine control module (ECM) adds considerable controller capability enhancements. Table 1 compares the CM420, which was the production ECM for all Cummins gas engines, and the new CM556 ECM. The CM556 is a derivative of the CM550 ECM recently launched with the IS family of midrange diesel engines at Cummins. The C-Gas Plus ECM architecture is shown in Figure 2.
Table 1: ECM Capabilities
CM556
• 512k (bytes) Flash
• 64K RAM
• 8K EEPROM
• Wide range oxygen sensor • Integrated engine and speed controls
• J1708/1587 and J1939 datalinks
• Motorola ‘ Polybend’ technology
• Full features, similar to diesel • Motorola 68336 micro @ 20 MHz
• Room for growth and improvements
• Knock detection and control
• 64K (bytes) Flash
• 3K RAM (total) • 512 EEPROM
• Limited range oxygen sensor • 2 box system for engine and speed control
• J1708/1587 datalinks
• Fiberglass PWB , obsolete technology • Limited features
• Motorola 68HC11 micro @ 16 MHz • Capability and throughput at limits • No knock detection capability
CM420+Governor
• Engine mounted (better integration) • Chassis mounted
5
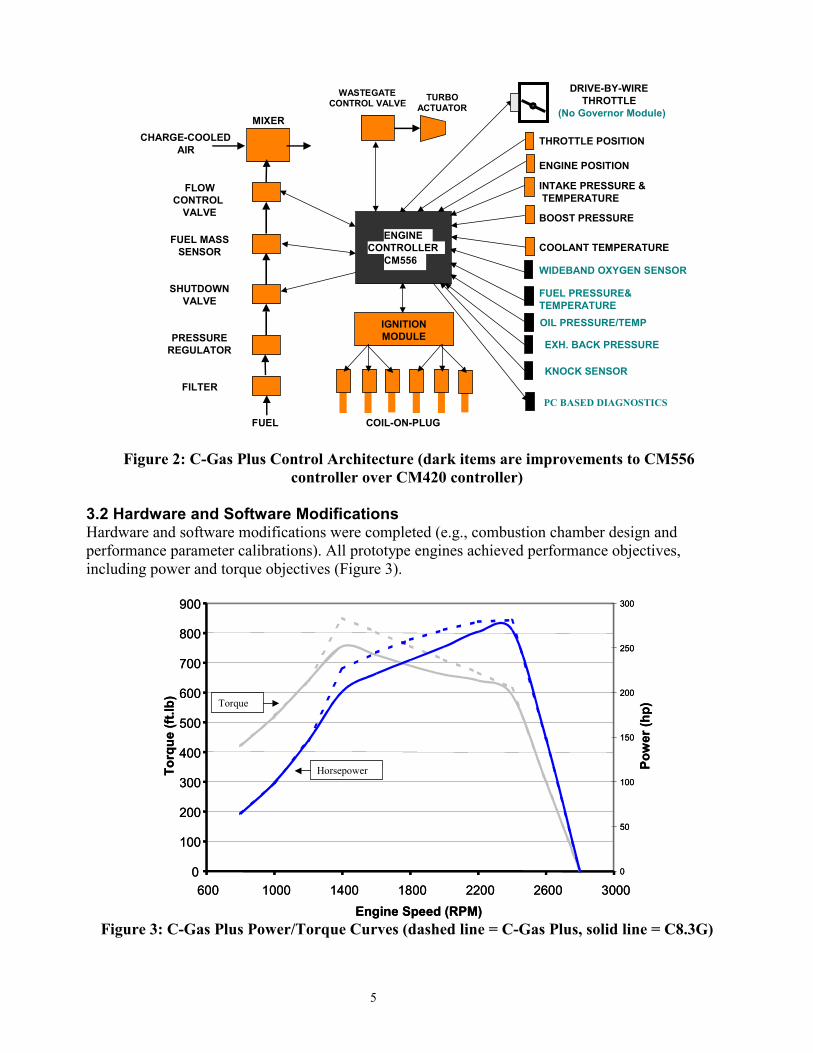
Figure 2: C-Gas Plus Control Architecture (dark items are improvements to CM556
controller over CM420 controller) 3.2 Hardware and Software Modifications Hardware and software modifications were completed (e.g., combustion chamber design and performance parameter calibrations). All prototype engines achieved performance objectives, including power and torque objectives (Figure 3).
Figure 3: C-Gas Plus Power/Torque Curves (dashed line = C-Gas Plus, solid line = C8.3G)
0
100
200
300
400
500
600
700
800
900
600 1000 1400 1800 2200 2600 3000Engine Speed (RPM)
Torq
ue (f
t.lb)
0
50
100
150
200
250
300
Pow
er (h
p)
Horsepower
Torque
0
100
200
300
400
500
600
700
800
900
600 1000 1400 1800 2200 2600 3000Engine Speed (RPM)
Torq
ue (f
t.lb)
0
50
100
150
200
250
300
Pow
er (h
p)
Horsepower
Torque
FLOW CONTROL
VALVE
FUEL MASS SENSOR
SHUTDOWN VALVE
PRESSURE REGULATOR
FILTER
ENGINECONTROLLER
CM556
IGNITIONMODULE
MIXER
WASTEGATECONTROL VALVE TURBO
ACTUATOR
CHARGE-COOLED AIR THROTTLE POSITION
ENGINE POSITION INTAKE PRESSURE & TEMPERATURE BOOST PRESSURE
COOLANT TEMPERATURE
WIDEBAND OXYGEN SENSOR
FUEL PRESSURE& TEMPERATURE
DRIVE-BY-WIRE THROTTLE
(No Governor Module)
FUEL COIL-ON-PLUG
PC BASED DIAGNOSTICS
OIL PRESSURE/TEMP EXH. BACK PRESSURE
KNOCK SENSOR

6
3.3 Knock Sensing and Control Knock sensing and control and the ability to operate on the wide range of natural gas fuel compositions encountered worldwide (with methane numbers as low as 65) are needed for improved system response and control. Methane number is an accepted measure of the propensity of the fuel to knock. It is determined in a similar fashion as octane number. A redesigned combustion bowl with a slightly lower compression ratio of 10:1 for the C-Gas Plus (versus 10.5:1 for the C8.3G) and advanced electronic control allow for the same knock margin at a lower methane number (65 for the C-Gas Plus versus 80 for the C8.3G). Figure 4 shows the methane number thresholds for the two engines and natural gas compositions from various parts of the world.
900
950
1000
1050
1100
1150
1200
1250
60 65 70 75 80 85 90 95 100 105 110
Methane Number
Hig
her H
eatin
g Va
lue
(Btu
/scf
)
AsiaNorth America
South AmericaEuropeAfrica
AustraliaC8.
3G M
inim
um
C G
as P
lus
Min
imum
Figure 4: CNG Fuel Quality by Region
To determine the optimal locations for knock sensors, special hardware and software were developed to induce the engine to knock in one of the six cylinders at a time. Knock sensors were placed in several locations (Figure 5). The capability of each sensor to detect knocking was evaluated with different knocking cylinders. Different knock intensities were also investigated. Two knock sensor locations were finally selected that provided good coverage for all cylinders. These locations and the control logic were developed and verified by engine testing in the lab and in the field.

7
Figure 5: Knock Sensor Locations
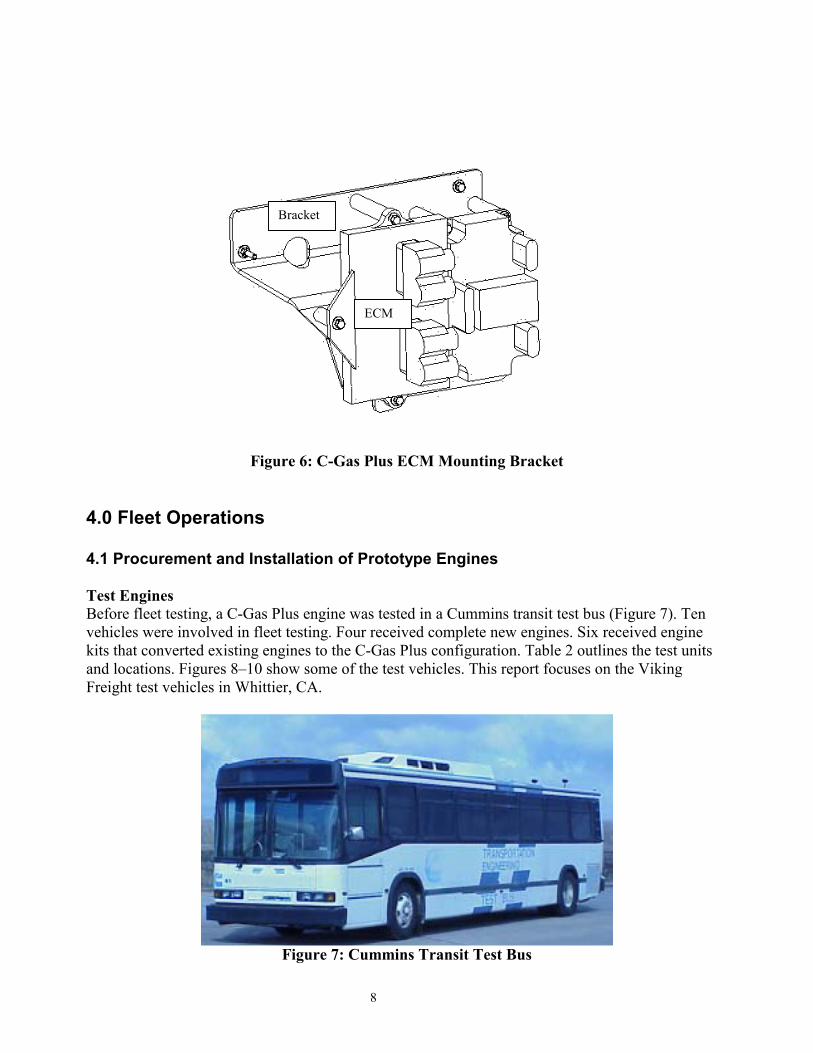
3.4 Mechanical Development Tests A total of 4,500 hrs of mechanical development tests was completed. This work primarily focused on the power cylinder qualification tests for the new piston design and the new piston ring designs. The new rings were developed to improve the engine oil consumption and break-in performance. The following dynamometer tests were completed: • Endurance tests at full load • Cycle tests simulating light-duty school bus duty cycle • Thermal cycle test (endurance test varying the intake air and engine coolant temperatures) • Overload test (endurance tests exceeding the maximum engine rating on fueling and load) Vibration profiles were obtained for the new critical components, including the ECM mounting bracket, gas housing, and sensor housing. These profiles were used to assess the durability of these parts. Bench qualification was completed for the ECM bracket (Figure 6) by conducting equivalent life tests on the bracket without failures to simulate the amount of stress the bracket would undergo in an engine lifetime.
Sensor locations (dashed lines are final locations)
8
Figure 6: C-Gas Plus ECM Mounting Bracket 4.0 Fleet Operations 4.1 Procurement and Installation of Prototype Engines Test Engines Before fleet testing, a C-Gas Plus engine was tested in a Cummins transit test bus (Figure 7). Ten vehicles were involved in fleet testing. Four received complete new engines. Six received engine kits that converted existing engines to the C-Gas Plus configuration. Table 2 outlines the test units and locations. Figures 8–10 show some of the test vehicles. This report focuses on the Viking Freight test vehicles in Whittier, CA.
Figure 7: Cummins Transit Test Bus
Bracket
ECM

9
Table 2: Test Vehicles and Locations
Customer Vehicle Location Number of Vehicles
SunLine Bus Thousand Palm, CA 1 Waste Management Truck Palm Springs, CA 1 Viking Freight Truck Whittier, CA 2 Pierce Transit Bus Seattle/Tacoma, WA 2 London Transit Bus London, Ontario, CAN 1 Phoenix Transit Bus Phoenix, AZ 2 Hamilton Street Bus Hamilton, Ontario, CAN 1
Figure 8: Viking Freight Test Vehicle for In-Use Development of C-Gas Plus Engine
Figure 9: Waste Management Test Vehicle for In-Use Development of C-Gas Plus Engine
10
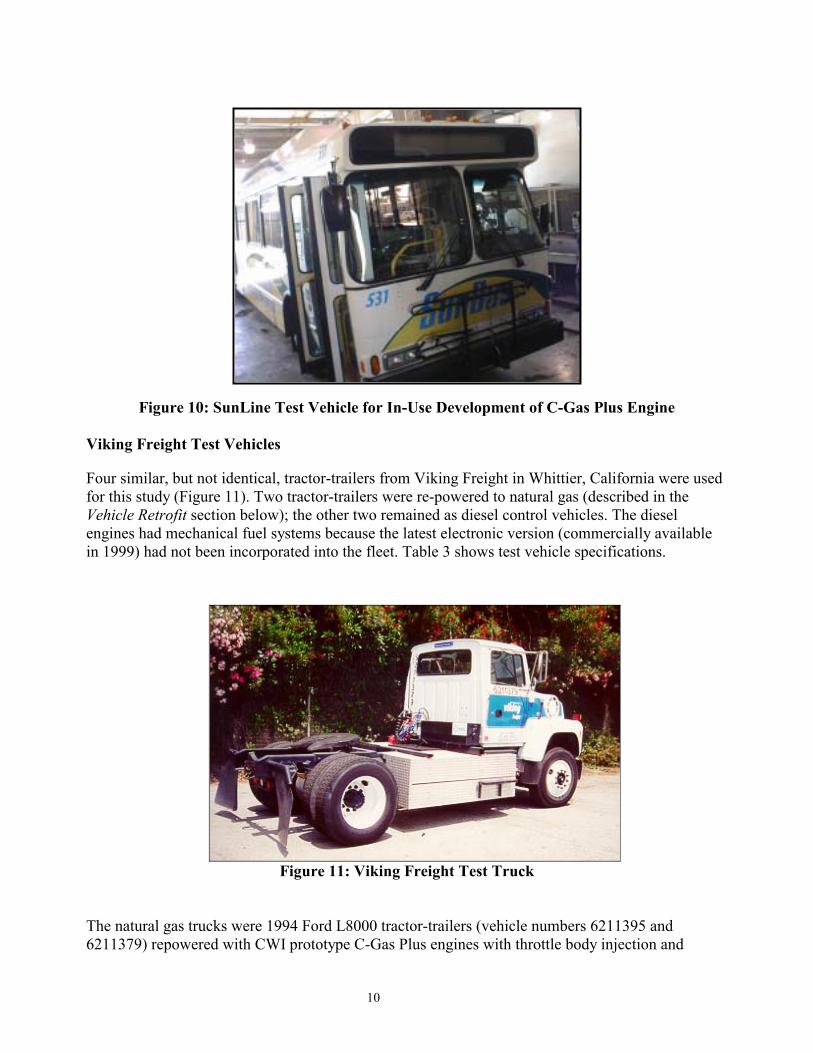
Figure 10: SunLine Test Vehicle for In-Use Development of C-Gas Plus Engine
Viking Freight Test Vehicles
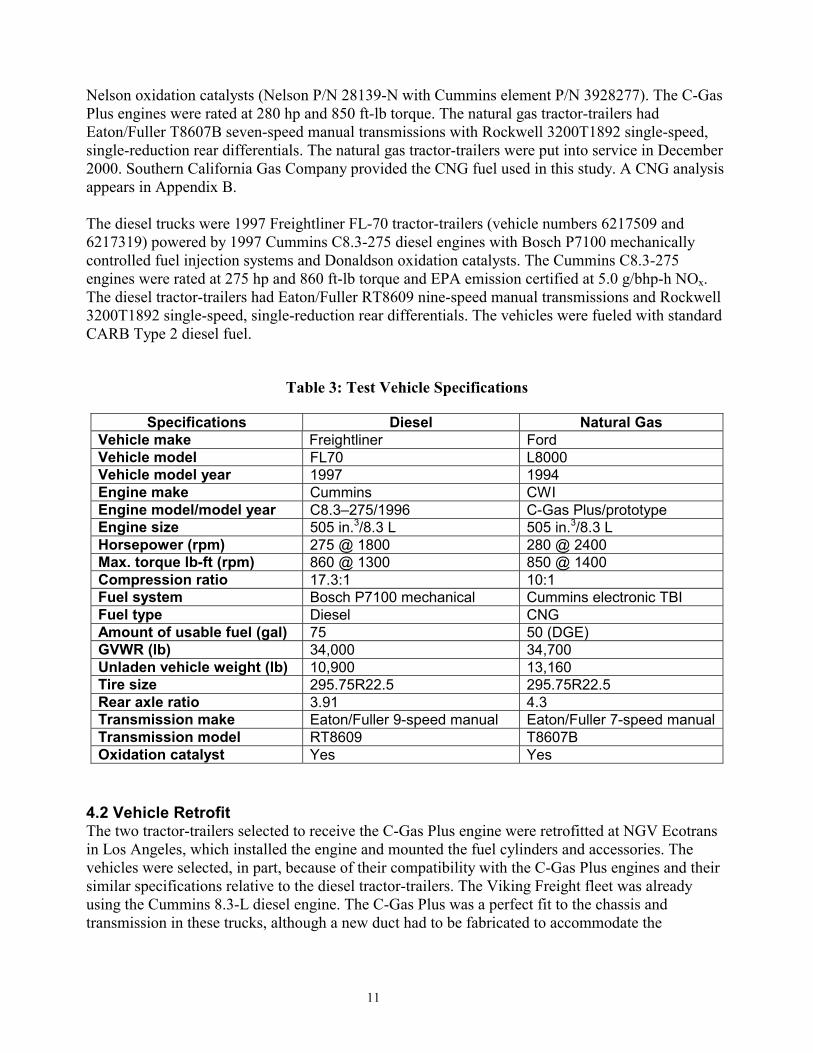
Four similar, but not identical, tractor-trailers from Viking Freight in Whittier, California were used for this study (Figure 11). Two tractor-trailers were re-powered to natural gas (described in the Vehicle Retrofit section below); the other two remained as diesel control vehicles. The diesel engines had mechanical fuel systems because the latest electronic version (commercially available in 1999) had not been incorporated into the fleet. Table 3 shows test vehicle specifications.
Figure 11: Viking Freight Test Truck The natural gas trucks were 1994 Ford L8000 tractor-trailers (vehicle numbers 6211395 and 6211379) repowered with CWI prototype C-Gas Plus engines with throttle body injection and
11
Nelson oxidation catalysts (Nelson P/N 28139-N with Cummins element P/N 3928277). The C-Gas Plus engines were rated at 280 hp and 850 ft-lb torque. The natural gas tractor-trailers had Eaton/Fuller T8607B seven-speed manual transmissions with Rockwell 3200T1892 single-speed, single-reduction rear differentials. The natural gas tractor-trailers were put into service in December 2000. Southern California Gas Company provided the CNG fuel used in this study. A CNG analysis appears in Appendix B. The diesel trucks were 1997 Freightliner FL-70 tractor-trailers (vehicle numbers 6217509 and 6217319) powered by 1997 Cummins C8.3-275 diesel engines with Bosch P7100 mechanically controlled fuel injection systems and Donaldson oxidation catalysts. The Cummins C8.3-275 engines were rated at 275 hp and 860 ft-lb torque and EPA emission certified at 5.0 g/bhp-h NOx. The diesel tractor-trailers had Eaton/Fuller RT8609 nine-speed manual transmissions and Rockwell 3200T1892 single-speed, single-reduction rear differentials. The vehicles were fueled with standard CARB Type 2 diesel fuel.
Table 3: Test Vehicle Specifications
Specifications Diesel Natural Gas
Vehicle make Freightliner Ford Vehicle model FL70 L8000 Vehicle model year 1997 1994 Engine make Cummins CWI Engine model/model year C8.3–275/1996 C-Gas Plus/prototype Engine size 505 in.3/8.3 L 505 in.3/8.3 L Horsepower (rpm) 275 @ 1800 280 @ 2400 Max. torque lb-ft (rpm) 860 @ 1300 850 @ 1400 Compression ratio 17.3:1 10:1 Fuel system Bosch P7100 mechanical Cummins electronic TBI Fuel type Diesel CNG Amount of usable fuel (gal) 75 50 (DGE) GVWR (lb) 34,000 34,700 Unladen vehicle weight (lb) 10,900 13,160 Tire size 295.75R22.5 295.75R22.5 Rear axle ratio 3.91 4.3 Transmission make Eaton/Fuller 9-speed manual Eaton/Fuller 7-speed manualTransmission model RT8609 T8607B Oxidation catalyst Yes Yes
4.2 Vehicle Retrofit The two tractor-trailers selected to receive the C-Gas Plus engine were retrofitted at NGV Ecotrans in Los Angeles, which installed the engine and mounted the fuel cylinders and accessories. The vehicles were selected, in part, because of their compatibility with the C-Gas Plus engines and their similar specifications relative to the diesel tractor-trailers. The Viking Freight fleet was already using the Cummins 8.3-L diesel engine. The C-Gas Plus was a perfect fit to the chassis and transmission in these trucks, although a new duct had to be fabricated to accommodate the
12
turbocharger location. The horsepower of the new natural gas engine was nearly identical to that of the diesel engines in use. The natural gas tank arrangement consisted of five cylinders on the left side and four on the right. The total capacity of the fuel system is 49.8 diesel gallons equivalents (DGE). This was specified to give a range of more than 200 miles. To mount these cylinders, the side diesel tanks were removed with all the brackets. The CNG cylinders were side mounted, but the weight was supported from the top of the frame by rectangular tube brackets. The cylinders were shielded with 1/8-in diamond plate aluminum on the top, bottom, and sides for appearance and protection from road debris. The batteries were moved to the rear of the cab, and a battery box was constructed to receive the three batteries in line for tractor-to-trailer clearance. Before the new box and battery arrangement was installed, a mock-up of the box was tested on the Viking tractor-trailer to check for interference. The trucks were fitted with two fill receptacles so they could be filled from either side. A pressure transducer enabled use of the original dashboard fuel gauge. A pressure gauge was also installed (on the CNG tanks) as a backup to the dashboard fuel gauge and to facilitate refueling. When these modifications were completed, the trucks drove and handled similar to their diesel counterparts. Because the CNG tanks were side-mounted, the wheelbase and fifth wheel distance remained constant. This meant that the natural gas trucks had the same turning radius and handling characteristics as their diesel counterparts. Careful consideration was given to the placement of the driver’s entry steps into the cab. Brackets were made to place these steps in the same position as on the diesel tractor-trailer. The ground and side clearances of the tractors also remained the same. The horsepower and torque of the natural gas trucks were very similar to those of the diesel trucks. Vehicle Operation The Viking Freight fleet typically operates in pickup and delivery service, transporting packaged dry goods. Monthly mileage varied from 500 to 2,000 miles. One natural gas truck was instrumented with a data logger to capture representative duty cycle information for a better understanding of the application and for chassis dynamometer testing. Results of the duty cycle analysis indicated that the trucks spent approximately 40% of their time idling and approximately 30% of their time under light load conditions. Section 5.0 and Appendix A discuss the Viking Freight duty cycle in detail. 4.3 Development of Prototype Engines in Service Fleet Fueling The diesel tractor-trailers were fueled on site. Viking Freight purchases diesel fuel in bulk and operates and maintains the fueling infrastructure. For the natural gas tractor-trailers, there was a 24-hour public access fuel station 12 miles away from Viking Freight. This site offered the following advantages:

13
• Seldom any waiting to fuel • Fuel cards issued for use of the public station network • Both 3,000 and 3,600 psi fill capabilities available with two fill hoses; the trucks, which were
fitted with two receptacles, could use both hoses simultaneously, which reduced fueling time by 50%; the drivers appreciated the faster fueling time and higher pressure
The next improvement in the fueling arrangement was installation of a private time-fill fueling station at Viking Freight. The station had a 50-scfm (standard cubic feet per minute) compressor and a 20-scfm compressor. The smaller compressor was used as a backup when the larger one was down for service or maintenance. The compressors could be used simultaneously or separately; the larger one could fill both trucks in less than six hours. On-site fueling was convenient and saved personnel time because the vehicles fueled and parked in the same place. They were simply parked next to the station, and the fill hoses were connected to the fill receptacle. This connection takes approximately 30 seconds. Fueling was then completed without supervision overnight. A gas meter with a digital readout display instead of the dial-type meter readout was installed at the on-site station. This made it easier for Viking personnel to take fuel readings for the trucks. The trucks could be filled simultaneously; however, they were filled sequentially so Viking could record the fuel dispensed for each truck. A reading was taken at the nearby meter, and the difference between the beginning and ending readings indicated the amount of fuel for that truck. Because the fuel for the on-site station was purchased directly from Southern California Gas Company and compressed on site, Viking saved considerable money fueling on site compared with fueling at the public station. For October, November, and December, the natural gas fuel cost averaged $0.62 for a DGE, compared with $1.06 at the public station. This was also cheaper than the bulk cost of diesel fuel, which was $1.03/gal for those months. Fleet Performance Data collection took place from January 2001 to December 2001. During that time, the two diesel trucks covered 18,390 and 16,620 miles; the two natural gas trucks covered 7,125 and 8,361 miles. The mileage difference between the diesel and natural gas trucks was mainly due to Viking’s slow ramp-up of natural gas truck use and a less convenient off-site natural gas refueling arrangement (from January through September). Starting from conservative expectations, the use and confidence in the natural gas vehicles increased concurrently, and by the end of the test all the trucks (diesel and natural gas) were running comparable monthly mileages. Except for a turbocharger wastegate actuator failure in one of the natural gas units early in the project, and calibration tuning work performed to optimize the knock sensing controls, no reliability issues were encountered in any of the four engines. Although oil consumption was higher for the natural gas trucks—which ended the test with a cumulative average of 300 mpq (miles per quart), versus minimal oil consumption for the diesel trucks—a steady improvement was observed throughout the evaluation period for the natural gas trucks. This indicates that stabilization had not been reached with the 7,000–8,000 miles accumulated. This is a function of the light load and high percentage of engine idle time
14
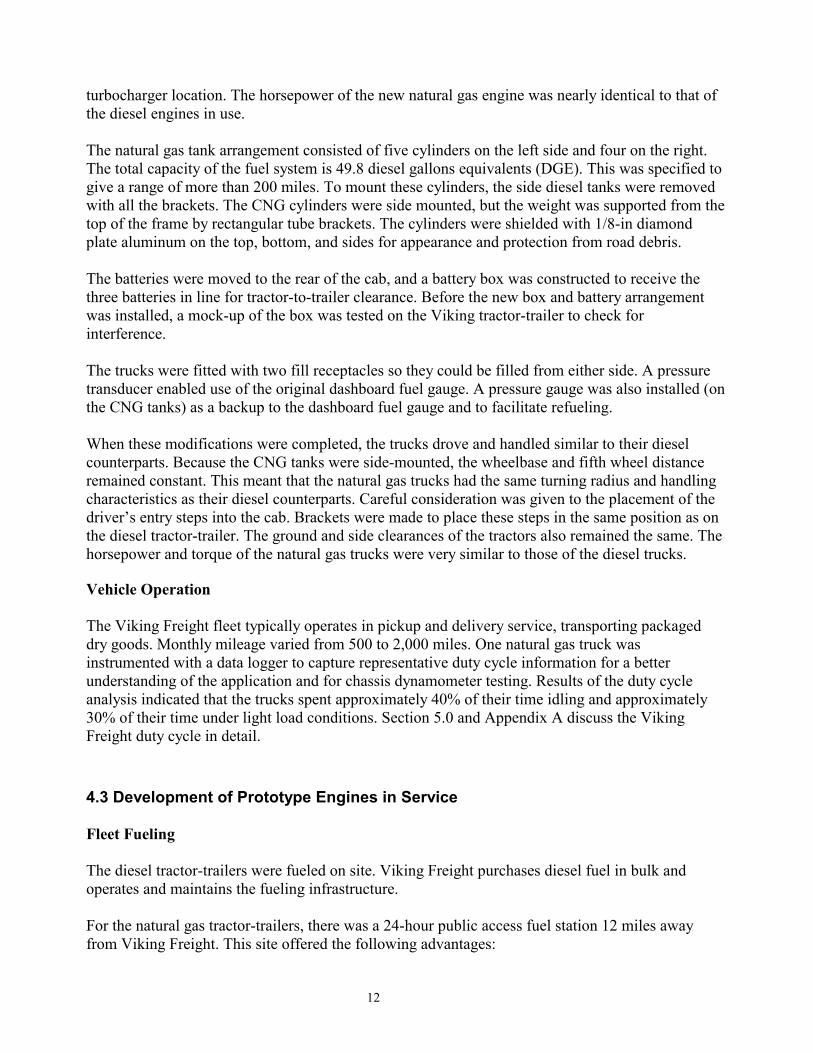
characteristic to this application (discussed further in the Chassis Dynamometer Emission Testing section). Oil consumption was above the 1000 mpq range in the other in-use test fleets mentioned in this paper (Table 2). Fuel Economy Cumulative fuel economy for all the test vehicles is shown in Figure 12. Average fuel economy was 5.17 mpeg (miles per energy equivalent gallon) for the natural gas trucks and 6.73 mpg for the diesel trucks. This represents a 23.2% fuel economy penalty for the natural gas trucks. This is not unexpected when comparing a throttled engine (C-Gas Plus) with a non-throttled engine (C8.3) in a light load and high idle application. It is possible to offset some of the fuel economy penalty caused by excessive idling with a control feature on the C-Gas Plus that limits idle duration by shutting the engine off after a set amount of idle time. This feature can be enabled and adjusted by the manufacturer at the request of the customer; however, the feature was not used in the Viking Freight evaluation.
0
1
2
3
4
5
6
7
8
Jan-0
1
Mar-01
May-01
Jul-0
1
Sep-01
Nov-01
mpg
/mpe
g NG1NG2DSL1DSL2
Figure 12: Vehicle Fuel Economy as a Function of Test Time (diesel vehicles in mpg, natural gas vehicles in mpeg)
Fuel Costs Two sets of fuel costs were derived from this testing. The first reflects the use of a public fueling facility 12 miles from Viking. The second reflects the use of a Viking in-house fueling station with substantially lower fuel costs (the productivity loss of approximately 1 hour due to traveling to and from the off-site refueling station is not accounted for in this analysis). In the first case, which covers January through September 2001, the fuel cost for operating the natural gas trucks was $0.31/mi versus $0.16/mi for the diesel trucks—94% higher. In the second case, for October through December 2001, the fuel cost for operating the natural gas trucks (including electrical cost of the natural gas compressor at $0.10/DGE) was $0.11/mi versus

15
$0.16/mi for the diesel trucks—31% lower. Fuel cost for the on-site and off-site fueling periods is shown in Figure 13. Although the 31% lower fuel cost corresponds to only three months of operation, the lower cost shows the potential economic benefits of operating natural gas trucks.
0
0.05
0.1
0.15
0.2
0.25
0.3
0.35
January-September, 2001 October-December, 2001
Fuel
cos
t per
mile
($)
DieselCNG
Natural gas trucks fueled off-site
Natural gas trucks fueled on-site
Figure 13: Fuel Costs for Natural Gas and Diesel Trucks 5.0 Emission Testing 5.1 Chassis Dynamometer Emission Testing West Virginia University characterized the emissions of the two natural gas and two diesel trucks used in the Viking fleet study. Regulated emissions were captured from each truck using the well-recognized heavy-duty Urban Dynamometer Driving Schedule (UDDS) (Figure 14) and an ad hoc test cycle derived from activity data collected from the Viking fleet trucks during normal operation (“Viking cycle,” Figure 15). The ad hoc Viking cycle was developed to more accurately represent the impact of replacing a Viking fleet diesel tractor-trailer with a natural gas tractor-trailer. A Cummins-designed data logger was installed in one of the two Viking natural gas trucks, and data was collected in January 2001 and June/July 2001. Typical average results for a 24-hour run time from the June/July time frame are shown below: • Average vehicle speed 23 mph • Time at low idle speed (600–800 rpm) 43.3 % • Time between low idle and peak torque speeds (700–1400 rpm) 9.6 % • Time between peak torque and rated speeds (1400–2400 rpm) 44.3 % • Time above rated speed 2.2 % • Average load factor 33 % • Time at motoring conditions 7.1 %
16
• Time below 30% load 62.2 % • Time above 90 % load 5.3 %
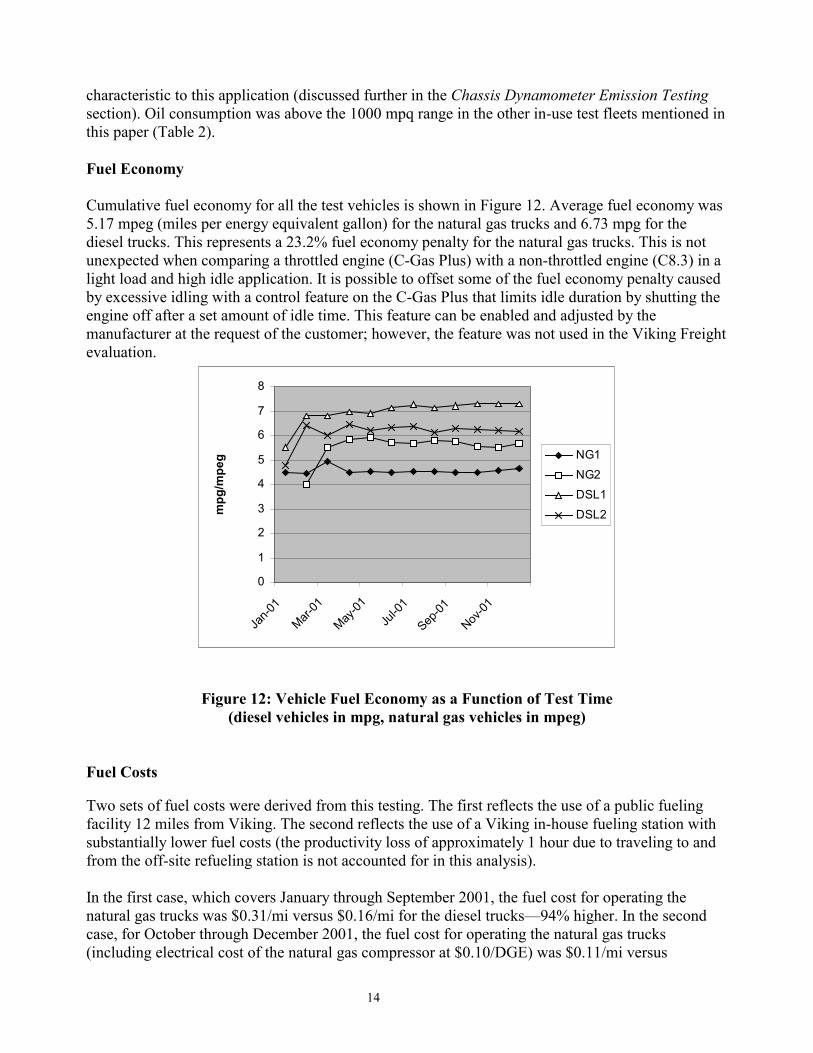
Definitions: Peak torque—maximum engine torque; rated speed—maximum engine speed (before governor cut-off); motoring condition—vehicle moving by impulse only (throttle closed); load factor—ratio of fuel used versus maximum fuel rating; low idle—engine idling speed. Twenty seconds of idle time at the beginning and end of the cycle were applied to allow for time-proper analyzer measurement during testing. The Viking cycle was also modified to provide a pre-heat period for the oxidation catalysts.
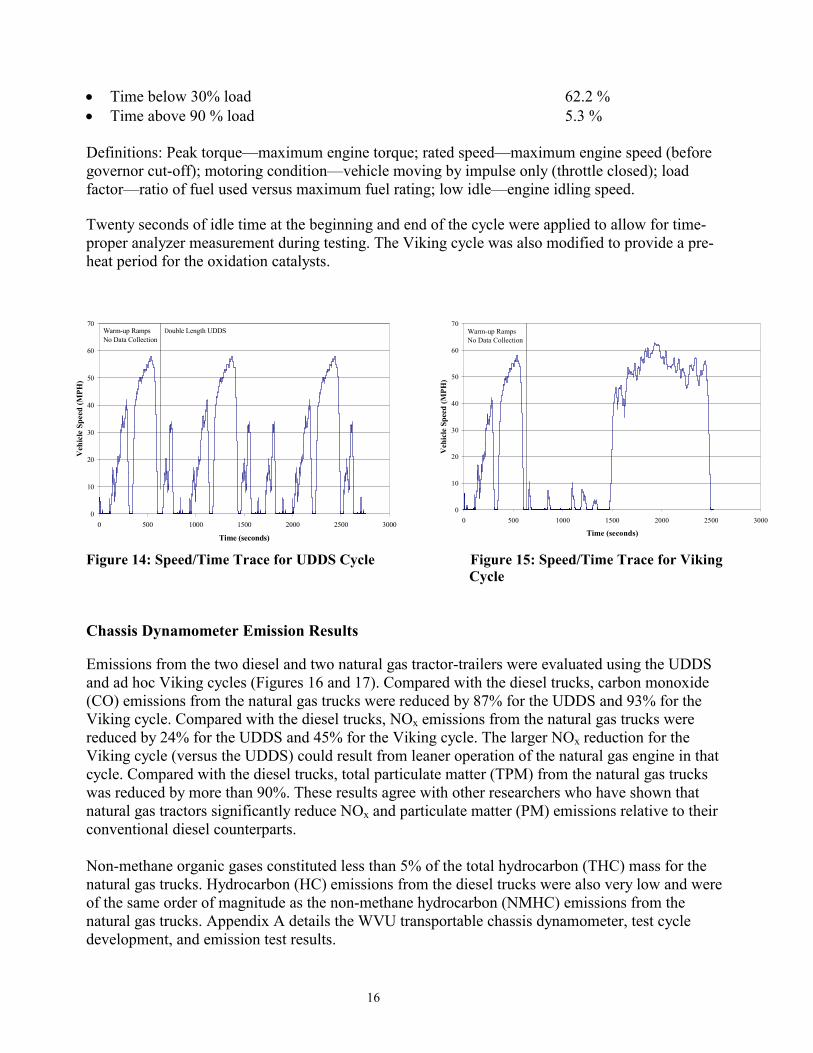
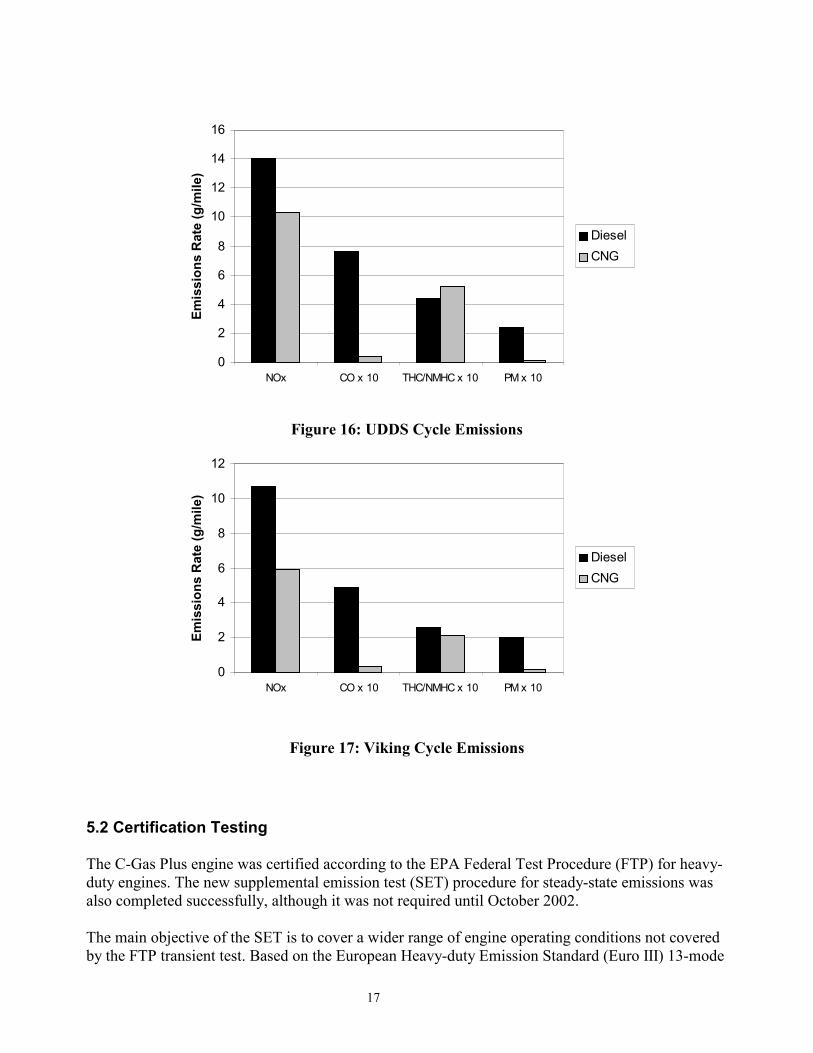
Figure 14: Speed/Time Trace for UDDS Cycle Figure 15: Speed/Time Trace for Viking Cycle Chassis Dynamometer Emission Results Emissions from the two diesel and two natural gas tractor-trailers were evaluated using the UDDS and ad hoc Viking cycles (Figures 16 and 17). Compared with the diesel trucks, carbon monoxide (CO) emissions from the natural gas trucks were reduced by 87% for the UDDS and 93% for the Viking cycle. Compared with the diesel trucks, NOx emissions from the natural gas trucks were reduced by 24% for the UDDS and 45% for the Viking cycle. The larger NOx reduction for the Viking cycle (versus the UDDS) could result from leaner operation of the natural gas engine in that cycle. Compared with the diesel trucks, total particulate matter (TPM) from the natural gas trucks was reduced by more than 90%. These results agree with other researchers who have shown that natural gas tractors significantly reduce NOx and particulate matter (PM) emissions relative to their conventional diesel counterparts. Non-methane organic gases constituted less than 5% of the total hydrocarbon (THC) mass for the natural gas trucks. Hydrocarbon (HC) emissions from the diesel trucks were also very low and were of the same order of magnitude as the non-methane hydrocarbon (NMHC) emissions from the natural gas trucks. Appendix A details the WVU transportable chassis dynamometer, test cycle development, and emission test results.
0
10
20
30
40
50
60
70
0 500 1000 1500 2000 2500 3000
Time (seconds)
Veh
icle
Spe
ed (M
PH)
Warm-up RampsNo Data Collection
0
10
20
30
40
50
60
70
0 500 1000 1500 2000 2500 3000
Time (seconds)
Veh
icle
Spe
ed (M
PH)
Warm-up RampsNo Data Collection
Double Length UDDS
17
0
2
4
6
8
10
12
14
16
NOx CO x 10 THC/NMHC x 10 PM x 10
Emis
sion
s R
ate
(g/m
ile)
Diesel CNG
Figure 16: UDDS Cycle Emissions
0
2
4
6
8
10
12
NOx CO x 10 THC/NMHC x 10 PM x 10
Emis
sion
s R
ate
(g/m
ile)
Diesel CNG
Figure 17: Viking Cycle Emissions
5.2 Certification Testing The C-Gas Plus engine was certified according to the EPA Federal Test Procedure (FTP) for heavy-duty engines. The new supplemental emission test (SET) procedure for steady-state emissions was also completed successfully, although it was not required until October 2002. The main objective of the SET is to cover a wider range of engine operating conditions not covered by the FTP transient test. Based on the European Heavy-duty Emission Standard (Euro III) 13-mode
18
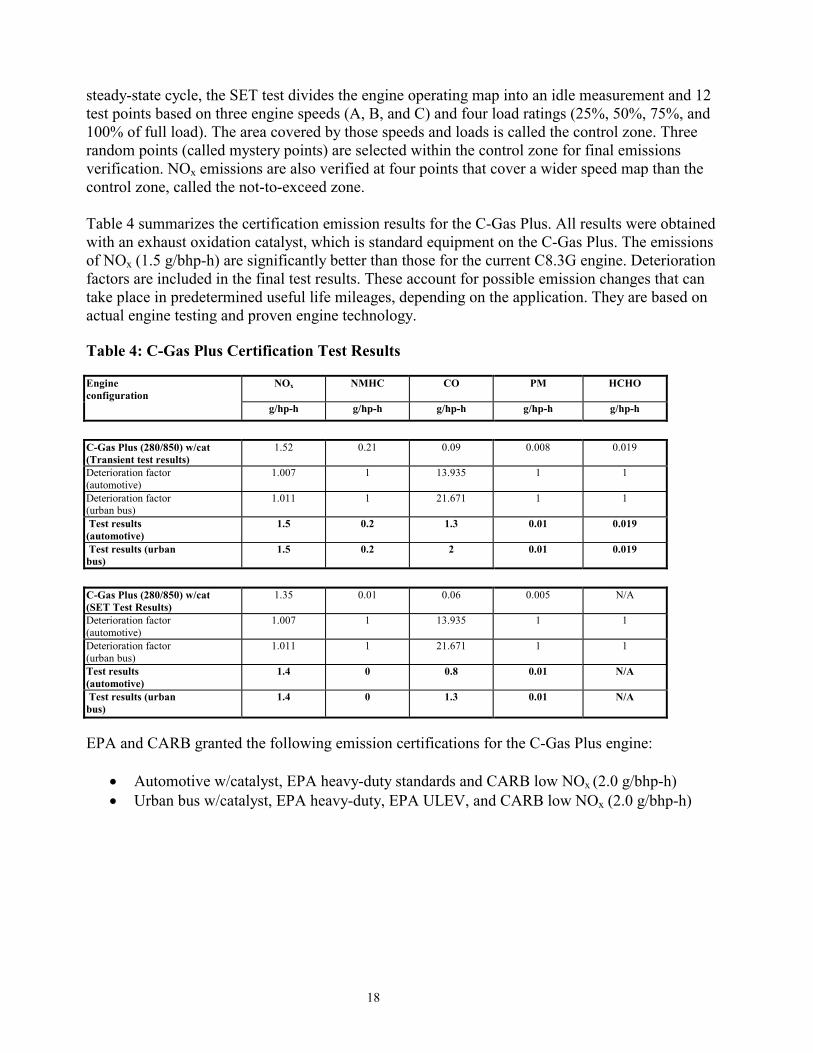
steady-state cycle, the SET test divides the engine operating map into an idle measurement and 12 test points based on three engine speeds (A, B, and C) and four load ratings (25%, 50%, 75%, and 100% of full load). The area covered by those speeds and loads is called the control zone. Three random points (called mystery points) are selected within the control zone for final emissions verification. NOx emissions are also verified at four points that cover a wider speed map than the control zone, called the not-to-exceed zone. Table 4 summarizes the certification emission results for the C-Gas Plus. All results were obtained with an exhaust oxidation catalyst, which is standard equipment on the C-Gas Plus. The emissions of NOx (1.5 g/bhp-h) are significantly better than those for the current C8.3G engine. Deterioration factors are included in the final test results. These account for possible emission changes that can take place in predetermined useful life mileages, depending on the application. They are based on actual engine testing and proven engine technology. Table 4: C-Gas Plus Certification Test Results Engine configuration
NOx NMHC CO PM HCHO
g/hp-h g/hp-h g/hp-h g/hp-h g/hp-h
C-Gas Plus (280/850) w/cat (Transient test results)
1.52 0.21 0.09 0.008 0.019
Deterioration factor (automotive)
1.007 1 13.935 1 1
Deterioration factor (urban bus)
1.011 1 21.671 1 1
Test results (automotive)
1.5 0.2 1.3 0.01 0.019
Test results (urban bus)
1.5 0.2 2 0.01 0.019
C-Gas Plus (280/850) w/cat (SET Test Results)
1.35 0.01 0.06 0.005 N/A
Deterioration factor (automotive)
1.007 1 13.935 1 1
Deterioration factor (urban bus)
1.011 1 21.671 1 1
Test results (automotive)
1.4 0 0.8 0.01 N/A
Test results (urban bus)
1.4 0 1.3 0.01 N/A
EPA and CARB granted the following emission certifications for the C-Gas Plus engine:
• Automotive w/catalyst, EPA heavy-duty standards and CARB low NOx (2.0 g/bhp-h) • Urban bus w/catalyst, EPA heavy-duty, EPA ULEV, and CARB low NOx (2.0 g/bhp-h)
19
6.0 Conclusions • Compared with the C8.3G engine, this engine has increased ratings for horsepower and torque, a
full-authority engine controller, wide tolerance to natural gas fuel, knock sensing, and improved diagnostic capability.
• Four tractor-trailers (two natural gas and two diesel) were selected from Viking Freight for a 1-year development and data collection program. This fleet typically picks up and delivers packaged dry goods. Monthly mileage varied from 500 to 2,000 miles.
• The natural gas trucks’ fuel storage design consisted of nine cylinders with total capacity of 49.8 DGE for a range of over 200 miles. When the trucks were completed, they drove and handled similar to their diesel counterparts.
• Average cumulative fuel economy of the natural gas trucks was 5.17 mpeg, with the diesel trucks averaging 6.73 mpg. This represents a 23.2% fuel economy penalty for the natural gas trucks.
• Fuel costs of the natural gas trucks when fueled at Viking’s on-site station were 31% lower ($0.11/mi versus $0.16/mi) compared with the diesel trucks; they were 94% higher ($0.31/mi versus $0.16/mi) when fueled at a public station.
• Chassis dynamometer emission testing showed that the natural gas trucks significantly reduced NOx (24% and 45% for UDDS and Viking cycles) and PM (greater than 90%) emissions relative to their conventional diesel counterparts.
• The C-Gas Plus engine has been tested for emission certification protocols including SET. • EPA and CARB granted the following emission certifications for the C-Gas Plus engine:
− Automotive w/catalyst, EPA heavy-duty standards and CARB low NOx (2.0 g/bhp-h) − Urban bus w/catalyst, EPA heavy-duty, EPA ULEV, and CARB low NOx (2.0 g/bhp-h)
20
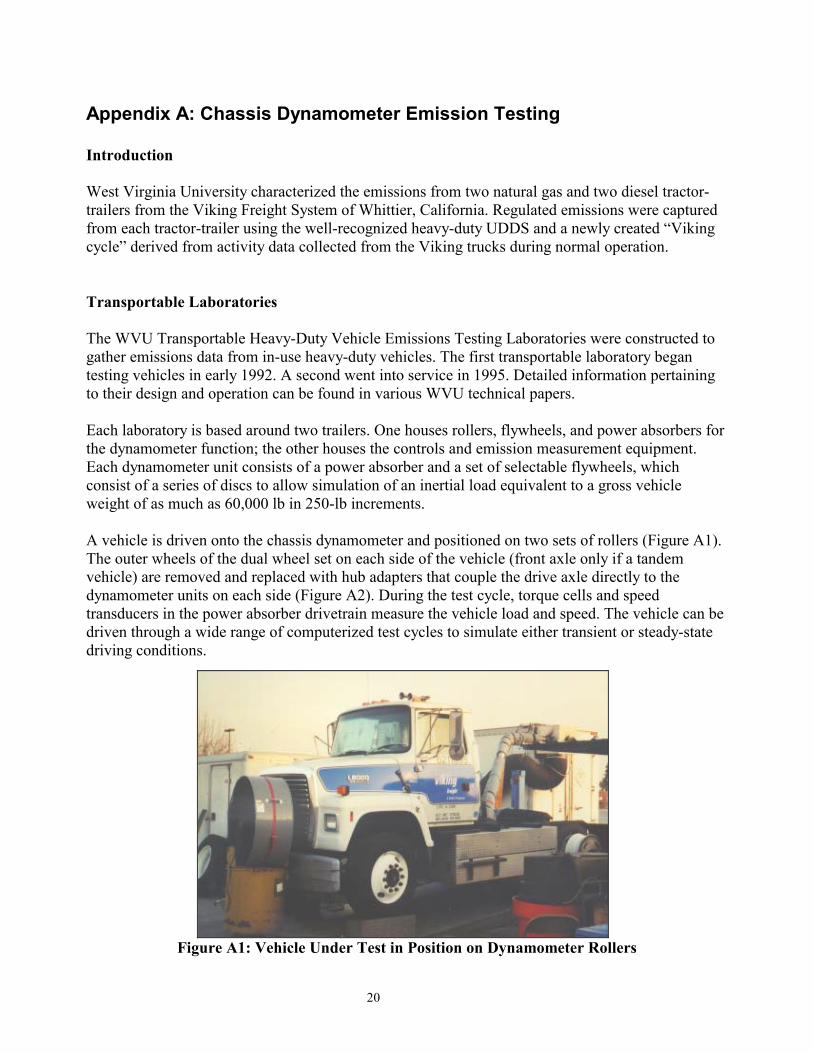
Appendix A: Chassis Dynamometer Emission Testing Introduction West Virginia University characterized the emissions from two natural gas and two diesel tractor-trailers from the Viking Freight System of Whittier, California. Regulated emissions were captured from each tractor-trailer using the well-recognized heavy-duty UDDS and a newly created “Viking cycle” derived from activity data collected from the Viking trucks during normal operation. Transportable Laboratories The WVU Transportable Heavy-Duty Vehicle Emissions Testing Laboratories were constructed to gather emissions data from in-use heavy-duty vehicles. The first transportable laboratory began testing vehicles in early 1992. A second went into service in 1995. Detailed information pertaining to their design and operation can be found in various WVU technical papers. Each laboratory is based around two trailers. One houses rollers, flywheels, and power absorbers for the dynamometer function; the other houses the controls and emission measurement equipment. Each dynamometer unit consists of a power absorber and a set of selectable flywheels, which consist of a series of discs to allow simulation of an inertial load equivalent to a gross vehicle weight of as much as 60,000 lb in 250-lb increments. A vehicle is driven onto the chassis dynamometer and positioned on two sets of rollers (Figure A1). The outer wheels of the dual wheel set on each side of the vehicle (front axle only if a tandem vehicle) are removed and replaced with hub adapters that couple the drive axle directly to the dynamometer units on each side (Figure A2). During the test cycle, torque cells and speed transducers in the power absorber drivetrain measure the vehicle load and speed. The vehicle can be driven through a wide range of computerized test cycles to simulate either transient or steady-state driving conditions.
Figure A1: Vehicle Under Test in Position on Dynamometer Rollers
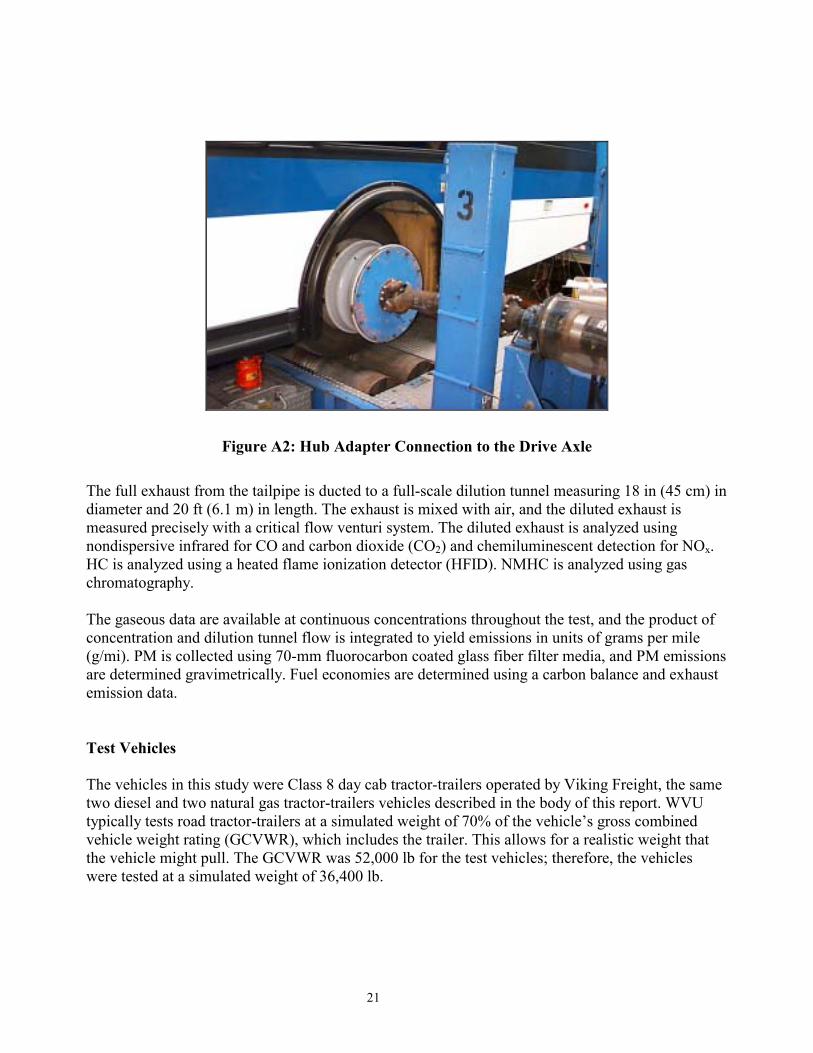
21
Figure A2: Hub Adapter Connection to the Drive Axle The full exhaust from the tailpipe is ducted to a full-scale dilution tunnel measuring 18 in (45 cm) in diameter and 20 ft (6.1 m) in length. The exhaust is mixed with air, and the diluted exhaust is measured precisely with a critical flow venturi system. The diluted exhaust is analyzed using nondispersive infrared for CO and carbon dioxide (CO2) and chemiluminescent detection for NOx. HC is analyzed using a heated flame ionization detector (HFID). NMHC is analyzed using gas chromatography. The gaseous data are available at continuous concentrations throughout the test, and the product of concentration and dilution tunnel flow is integrated to yield emissions in units of grams per mile (g/mi). PM is collected using 70-mm fluorocarbon coated glass fiber filter media, and PM emissions are determined gravimetrically. Fuel economies are determined using a carbon balance and exhaust emission data. Test Vehicles The vehicles in this study were Class 8 day cab tractor-trailers operated by Viking Freight, the same two diesel and two natural gas tractor-trailers vehicles described in the body of this report. WVU typically tests road tractor-trailers at a simulated weight of 70% of the vehicle’s gross combined vehicle weight rating (GCVWR), which includes the trailer. This allows for a realistic weight that the vehicle might pull. The GCVWR was 52,000 lb for the test vehicles; therefore, the vehicles were tested at a simulated weight of 36,400 lb.

22
Driving Cycles Emissions were measured while each vehicle was exercised through two different dynamometer driving schedules: the heavy-duty UDDS and the Viking Cycle. The Viking Cycle (described in detail in the following section) was developed specifically for the Viking Freight fleet using data logged from in-service vehicles. Urban Dynamometer Driving Schedule The EPA developed the heavy-duty UDDS (also referred to as “Test D”) to pre-condition vehicles for evaporative emission testing. It was not originally intended as an emission test cycle; however, heavy-duty vehicle testing laboratories in the United States commonly use it for this purpose. In a recent study, the Coordinating Research Council selected the UDDS as a means to compare emission measurements from different heavy-duty chassis laboratories. The UDDS was originally constructed using Monte Carlo simulation based on a statistically binned speed and acceleration matrix. This matrix was derived from a range of instrumented vehicles, which included 44 trucks and four buses in New York City and 44 trucks and three buses in Los Angeles. There was a mix of gasoline- and diesel-fueled vehicles, including two- and three-axle and tractor-trailer configurations. The subcycles (Monte Carlo simulations of New York non-freeway, Los Angeles freeway, and Los Angeles non-freeway driving) were combined to develop the complete cycle. The UDDS is shown in Figure A3.
Figure A3: Heavy-Duty UDDS Cycle
The UDDS may not represent a present-day fleet because it shows average vehicle characteristics. As a result, heavy-duty vehicles with low power-to-weight ratios and unsynchronized transmissions have difficulty following the trace; lighter automatic transmission vehicles follow the schedule easily. Vehicles that fall below the required speed must maintain full power until they reach the
0
10
20
30
40
50
60
70
0 200 400 600 800 1000 1200
Time (seconds)
Spee
d (M
PH)

23
required speed, but then a distance shorter than the scheduled one is covered and emissions, in mass/distance, are effectively based on a different schedule. For this study, WVU modified the UDDS from its original form in two ways (Figure A4). First, a 10-min warm-up period was added. Second, the cycle was repeated twice to increase the sample loading on the filter media when testing the natural gas tractor-trailers. For consistency, the diesel tractor-trailers were also tested over this cycle.
Figure A4: Modified UDDS Cycle
Ad Hoc Viking Fleet-Specific Cycle WVU developed an ad hoc dynamometer driving cycle specifically to represent the in-use operation of the Viking Freight test vehicles. Data were collected from the Viking fleet to characterize the diesel and natural gas trucks’ operation. The following statistics for the database of vehicle operation were determined: • Vehicle average speed (idle included) • Percent idle time • Vehicle average speed (without idle) • Standard deviation of vehicle speed (without idle) • Average weight-specific kinetic energy (without idle), used as (speed)2 The continuous data were parsed into “microtrips,” defined as vehicle operation (speed greater that 1 mph) from a starting point until the vehicle arrived at a destination (speed less than 1 mph). A total of 567 microtrips resulted. A random process was used to select and concatenate microtrips in a sequence string until at least 20 minutes of total time for the string of trips was met. This process was iterated until 60,000 candidate strings of trips were created. Each candidate string represented a possible basis for the creation of a cycle. Statistical measures of each string were compared to the overall statistical measures for that data set. The following four measures were used:
0
10
20
30
40
50
60
70
0 500 1000 1500 2000 2500 3000
Time (seconds)
Veh
icle
Spe
ed (M
PH)
Warm-up RampsNo Data Collection
Double Length UDDS
24
• Average speed (AS) (without idle) • Standard deviation of speed (SS) (without idle) • Average kinetic energy (KE) (without idle) • Percentage idle time (IT) A measure of the difference between a string and the whole data set is:
2222
−+
−+
−+
−=
set
setstring
set
setstring
set
setstring
set
setstring
KEKEKE
RMSIT
ITITSS
SSSSAS
ASAS
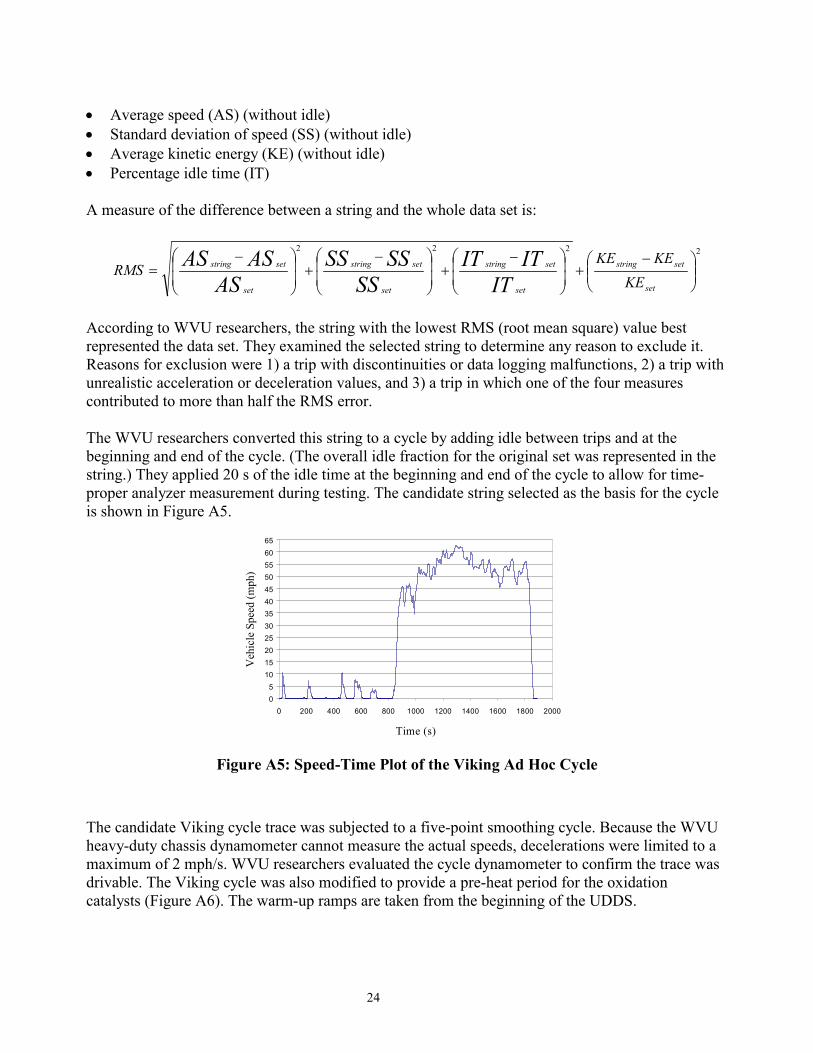
According to WVU researchers, the string with the lowest RMS (root mean square) value best represented the data set. They examined the selected string to determine any reason to exclude it. Reasons for exclusion were 1) a trip with discontinuities or data logging malfunctions, 2) a trip with unrealistic acceleration or deceleration values, and 3) a trip in which one of the four measures contributed to more than half the RMS error. The WVU researchers converted this string to a cycle by adding idle between trips and at the beginning and end of the cycle. (The overall idle fraction for the original set was represented in the string.) They applied 20 s of the idle time at the beginning and end of the cycle to allow for time-proper analyzer measurement during testing. The candidate string selected as the basis for the cycle is shown in Figure A5.
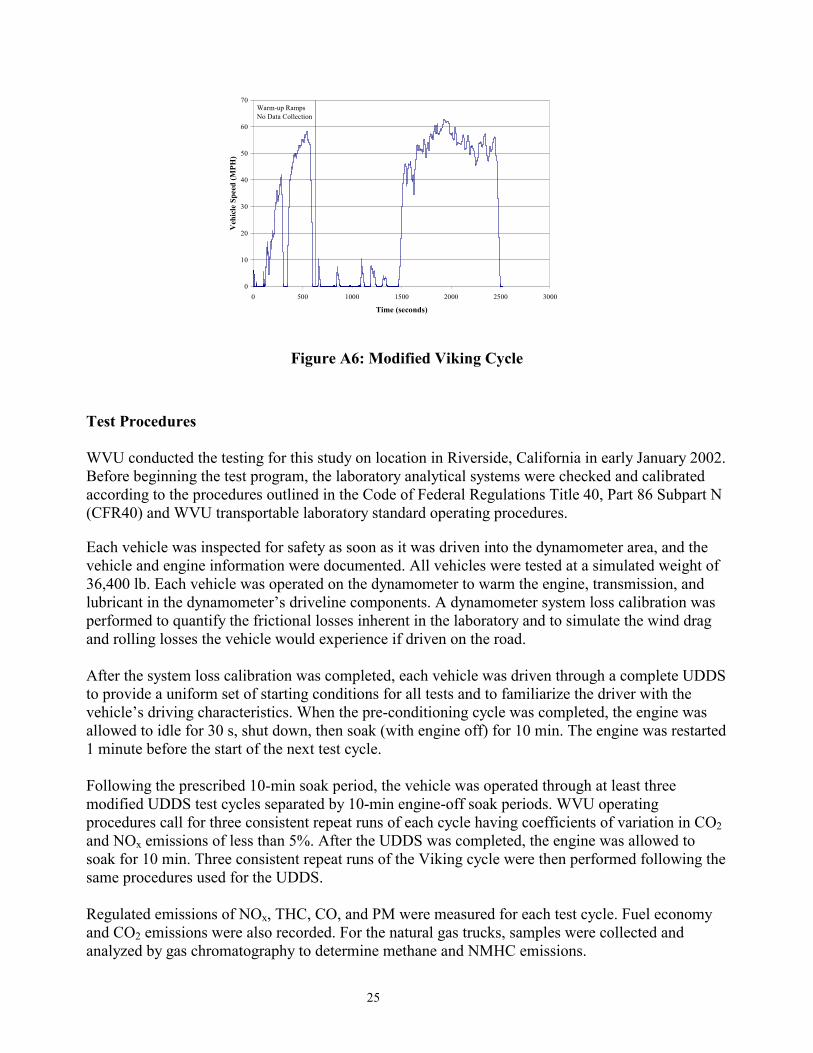
Figure A5: Speed-Time Plot of the Viking Ad Hoc Cycle The candidate Viking cycle trace was subjected to a five-point smoothing cycle. Because the WVU heavy-duty chassis dynamometer cannot measure the actual speeds, decelerations were limited to a maximum of 2 mph/s. WVU researchers evaluated the cycle dynamometer to confirm the trace was drivable. The Viking cycle was also modified to provide a pre-heat period for the oxidation catalysts (Figure A6). The warm-up ramps are taken from the beginning of the UDDS.
05
101520253035404550556065
0 200 400 600 800 1000 1200 1400 1600 1800 2000
Time (s)
Veh
icle
Spe
ed (m
ph)
25
Figure A6: Modified Viking Cycle
Test Procedures WVU conducted the testing for this study on location in Riverside, California in early January 2002. Before beginning the test program, the laboratory analytical systems were checked and calibrated according to the procedures outlined in the Code of Federal Regulations Title 40, Part 86 Subpart N (CFR40) and WVU transportable laboratory standard operating procedures.
Each vehicle was inspected for safety as soon as it was driven into the dynamometer area, and the vehicle and engine information were documented. All vehicles were tested at a simulated weight of 36,400 lb. Each vehicle was operated on the dynamometer to warm the engine, transmission, and lubricant in the dynamometer’s driveline components. A dynamometer system loss calibration was performed to quantify the frictional losses inherent in the laboratory and to simulate the wind drag and rolling losses the vehicle would experience if driven on the road. After the system loss calibration was completed, each vehicle was driven through a complete UDDS to provide a uniform set of starting conditions for all tests and to familiarize the driver with the vehicle’s driving characteristics. When the pre-conditioning cycle was completed, the engine was allowed to idle for 30 s, shut down, then soak (with engine off) for 10 min. The engine was restarted 1 minute before the start of the next test cycle. Following the prescribed 10-min soak period, the vehicle was operated through at least three modified UDDS test cycles separated by 10-min engine-off soak periods. WVU operating procedures call for three consistent repeat runs of each cycle having coefficients of variation in CO2 and NOx emissions of less than 5%. After the UDDS was completed, the engine was allowed to soak for 10 min. Three consistent repeat runs of the Viking cycle were then performed following the same procedures used for the UDDS. Regulated emissions of NOx, THC, CO, and PM were measured for each test cycle. Fuel economy and CO2 emissions were also recorded. For the natural gas trucks, samples were collected and analyzed by gas chromatography to determine methane and NMHC emissions.
0
10
20
30
40
50
60
70
0 500 1000 1500 2000 2500 3000
Time (seconds)
Veh
icle
Spe
ed (M
PH)
Warm-up RampsNo Data Collection
26
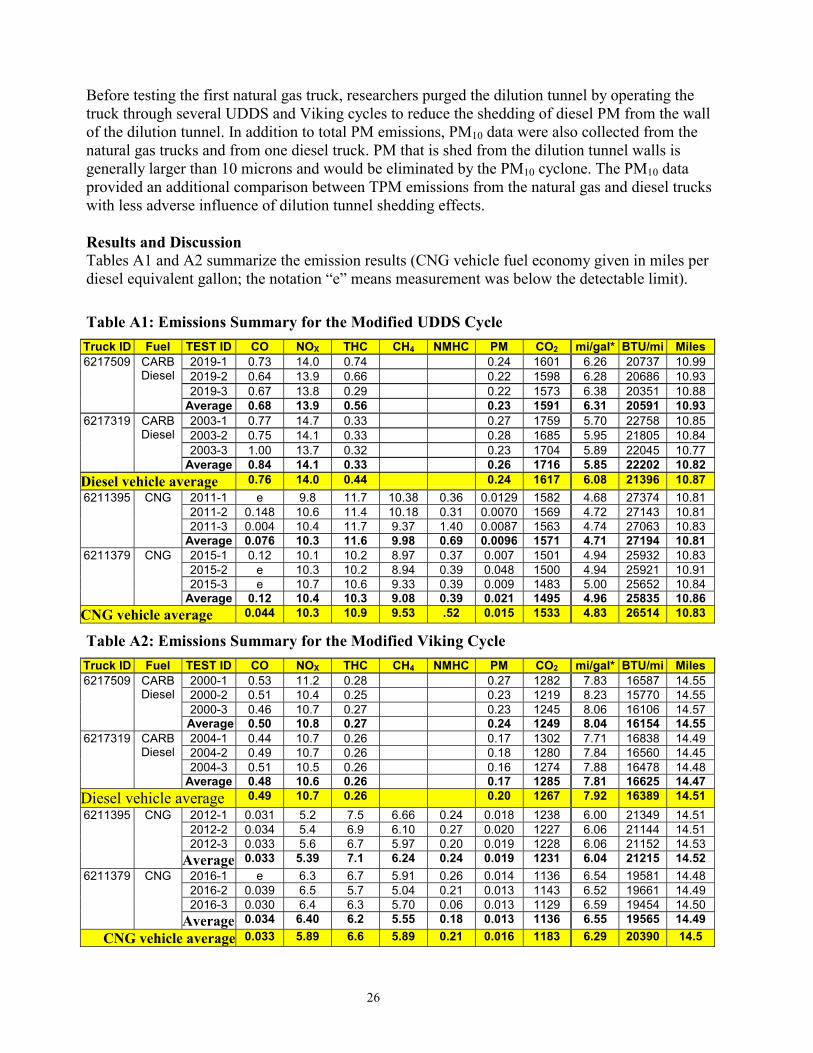
Before testing the first natural gas truck, researchers purged the dilution tunnel by operating the truck through several UDDS and Viking cycles to reduce the shedding of diesel PM from the wall of the dilution tunnel. In addition to total PM emissions, PM10 data were also collected from the natural gas trucks and from one diesel truck. PM that is shed from the dilution tunnel walls is generally larger than 10 microns and would be eliminated by the PM10 cyclone. The PM10 data provided an additional comparison between TPM emissions from the natural gas and diesel trucks with less adverse influence of dilution tunnel shedding effects. Results and Discussion Tables A1 and A2 summarize the emission results (CNG vehicle fuel economy given in miles per diesel equivalent gallon; the notation “e” means measurement was below the detectable limit).
Table A1: Emissions Summary for the Modified UDDS Cycle Truck ID Fuel TEST ID CO NOX THC CH4 NMHC PM CO2 mi/gal* BTU/mi Miles
2019-1 0.73 14.0 0.74 0.24 1601 6.26 20737 10.99 2019-2 0.64 13.9 0.66 0.22 1598 6.28 20686 10.93 2019-3 0.67 13.8 0.29 0.22 1573 6.38 20351 10.88
6217509 CARB Diesel
Average 0.68 13.9 0.56 0.23 1591 6.31 20591 10.93 2003-1 0.77 14.7 0.33 0.27 1759 5.70 22758 10.85 2003-2 0.75 14.1 0.33 0.28 1685 5.95 21805 10.84 2003-3 1.00 13.7 0.32 0.23 1704 5.89 22045 10.77
6217319 CARB Diesel
Average 0.84 14.1 0.33 0.26 1716 5.85 22202 10.82 Diesel vehicle average 0.76 14.0 0.44 0.24 1617 6.08 21396 10.87
2011-1 e 9.8 11.7 10.38 0.36 0.0129 1582 4.68 27374 10.81 2011-2 0.148 10.6 11.4 10.18 0.31 0.0070 1569 4.72 27143 10.81 2011-3 0.004 10.4 11.7 9.37 1.40 0.0087 1563 4.74 27063 10.83
6211395 CNG
Average 0.076 10.3 11.6 9.98 0.69 0.0096 1571 4.71 27194 10.81 2015-1 0.12 10.1 10.2 8.97 0.37 0.007 1501 4.94 25932 10.83 2015-2 e 10.3 10.2 8.94 0.39 0.048 1500 4.94 25921 10.91 2015-3 e 10.7 10.6 9.33 0.39 0.009 1483 5.00 25652 10.84
6211379 CNG
Average 0.12 10.4 10.3 9.08 0.39 0.021 1495 4.96 25835 10.86 CNG vehicle average 0.044 10.3 10.9 9.53 .52 0.015 1533 4.83 26514 10.83
Table A2: Emissions Summary for the Modified Viking Cycle Truck ID Fuel TEST ID CO NOX THC CH4 NMHC PM CO2 mi/gal* BTU/mi Miles
2000-1 0.53 11.2 0.28 0.27 1282 7.83 16587 14.55 2000-2 0.51 10.4 0.25 0.23 1219 8.23 15770 14.55 2000-3 0.46 10.7 0.27 0.23 1245 8.06 16106 14.57
6217509 CARB Diesel
Average 0.50 10.8 0.27 0.24 1249 8.04 16154 14.55 2004-1 0.44 10.7 0.26 0.17 1302 7.71 16838 14.49 2004-2 0.49 10.7 0.26 0.18 1280 7.84 16560 14.45 2004-3 0.51 10.5 0.26 0.16 1274 7.88 16478 14.48
6217319 CARB Diesel
Average 0.48 10.6 0.26 0.17 1285 7.81 16625 14.47 Diesel vehicle average 0.49 10.7 0.26 0.20 1267 7.92 16389 14.51
2012-1 0.031 5.2 7.5 6.66 0.24 0.018 1238 6.00 21349 14.51 2012-2 0.034 5.4 6.9 6.10 0.27 0.020 1227 6.06 21144 14.51 2012-3 0.033 5.6 6.7 5.97 0.20 0.019 1228 6.06 21152 14.53
6211395 CNG
Average 0.033 5.39 7.1 6.24 0.24 0.019 1231 6.04 21215 14.52 2016-1 e 6.3 6.7 5.91 0.26 0.014 1136 6.54 19581 14.48 2016-2 0.039 6.5 5.7 5.04 0.21 0.013 1143 6.52 19661 14.49 2016-3 0.030 6.4 6.3 5.70 0.06 0.013 1129 6.59 19454 14.50
6211379 CNG
Average 0.034 6.40 6.2 5.55 0.18 0.013 1136 6.55 19565 14.49 CNG vehicle average 0.033 5.89 6.6 5.89 0.21 0.016 1183 6.29 20390 14.5
27
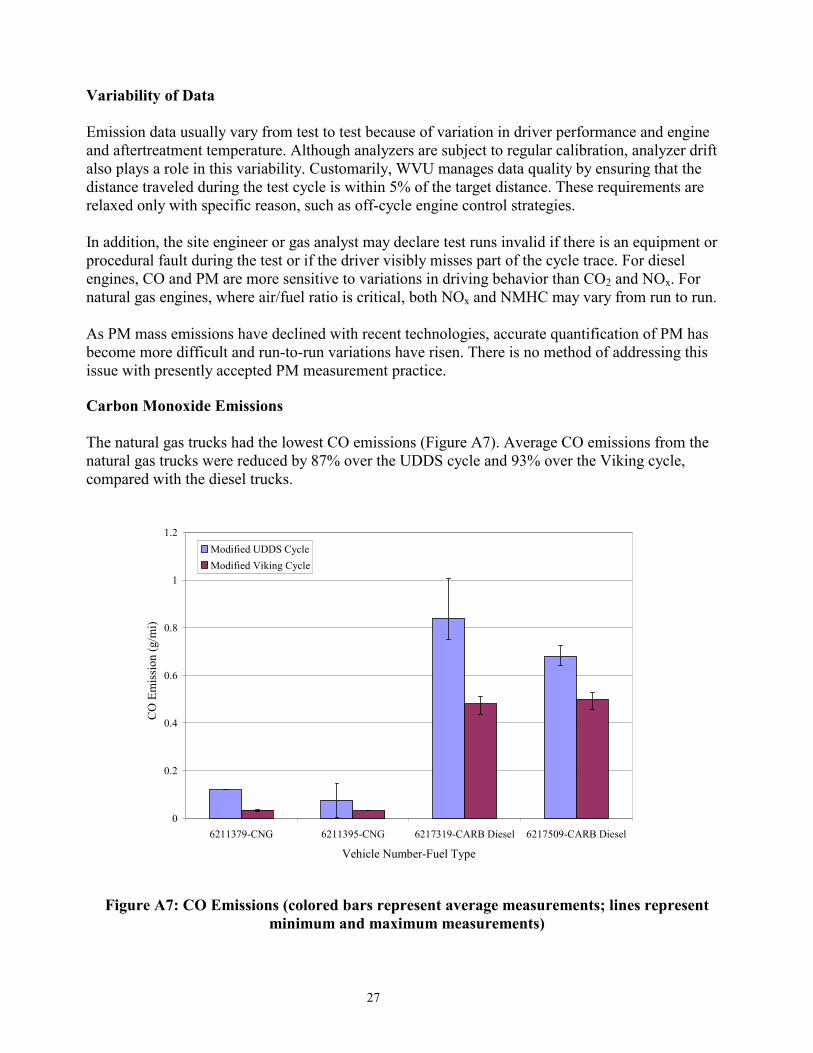
Variability of Data Emission data usually vary from test to test because of variation in driver performance and engine and aftertreatment temperature. Although analyzers are subject to regular calibration, analyzer drift also plays a role in this variability. Customarily, WVU manages data quality by ensuring that the distance traveled during the test cycle is within 5% of the target distance. These requirements are relaxed only with specific reason, such as off-cycle engine control strategies. In addition, the site engineer or gas analyst may declare test runs invalid if there is an equipment or procedural fault during the test or if the driver visibly misses part of the cycle trace. For diesel engines, CO and PM are more sensitive to variations in driving behavior than CO2 and NOx. For natural gas engines, where air/fuel ratio is critical, both NOx and NMHC may vary from run to run. As PM mass emissions have declined with recent technologies, accurate quantification of PM has become more difficult and run-to-run variations have risen. There is no method of addressing this issue with presently accepted PM measurement practice. Carbon Monoxide Emissions The natural gas trucks had the lowest CO emissions (Figure A7). Average CO emissions from the natural gas trucks were reduced by 87% over the UDDS cycle and 93% over the Viking cycle, compared with the diesel trucks.
Figure A7: CO Emissions (colored bars represent average measurements; lines represent minimum and maximum measurements)
0
0.2
0.4
0.6
0.8
1
1.2
6211379-CNG 6211395-CNG 6217319-CARB Diesel 6217509-CARB Diesel
Vehicle Number-Fuel Type
CO
Em
issi
on (g
/mi)
Modified UDDS CycleModified Viking Cycle
28
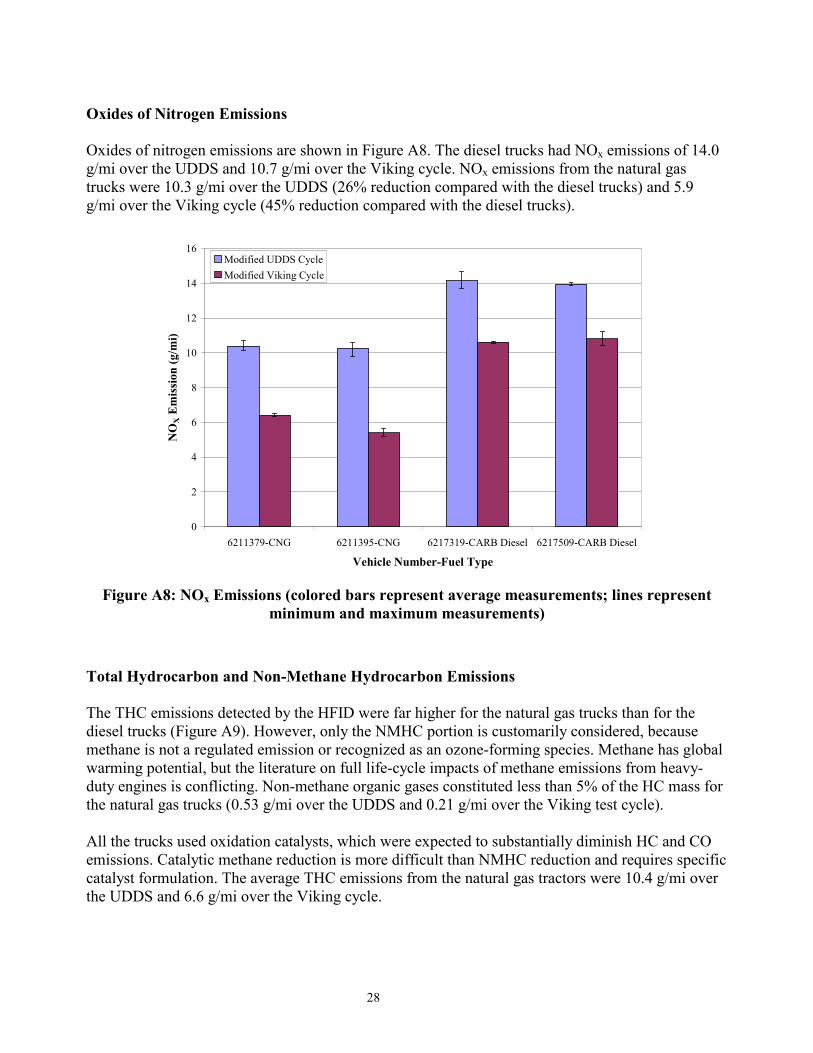
Oxides of Nitrogen Emissions Oxides of nitrogen emissions are shown in Figure A8. The diesel trucks had NOx emissions of 14.0 g/mi over the UDDS and 10.7 g/mi over the Viking cycle. NOx emissions from the natural gas trucks were 10.3 g/mi over the UDDS (26% reduction compared with the diesel trucks) and 5.9 g/mi over the Viking cycle (45% reduction compared with the diesel trucks).
Figure A8: NOx Emissions (colored bars represent average measurements; lines represent minimum and maximum measurements)
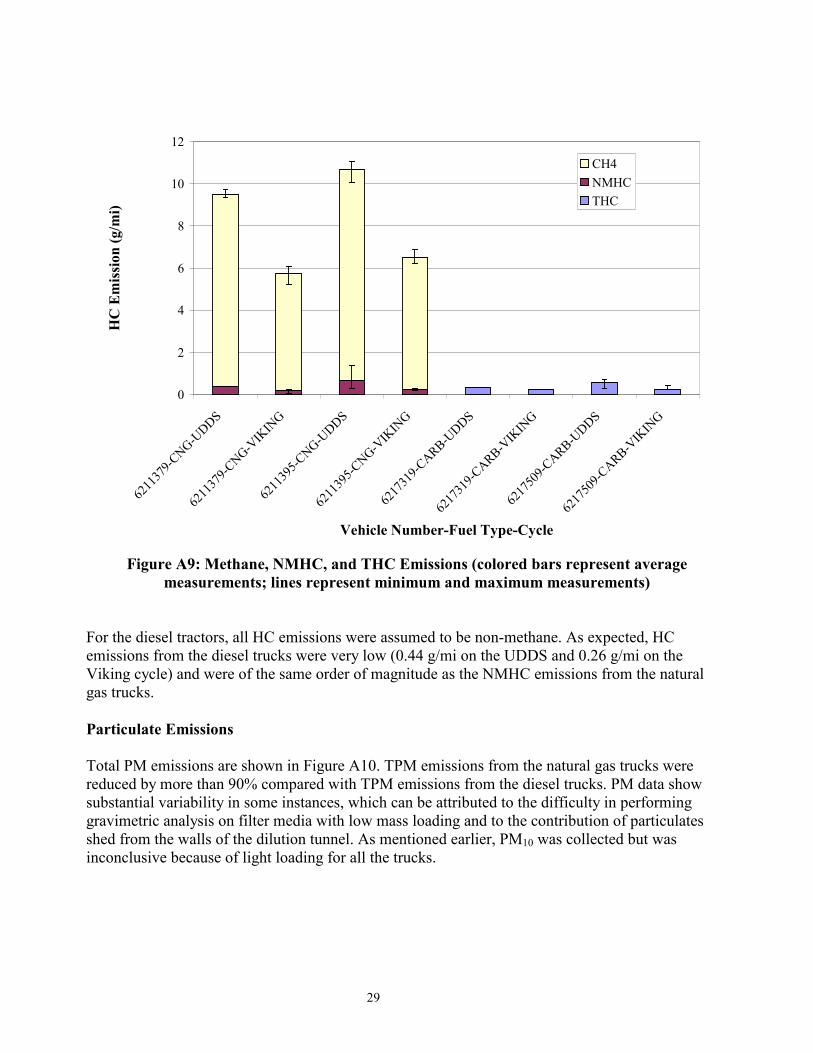
Total Hydrocarbon and Non-Methane Hydrocarbon Emissions The THC emissions detected by the HFID were far higher for the natural gas trucks than for the diesel trucks (Figure A9). However, only the NMHC portion is customarily considered, because methane is not a regulated emission or recognized as an ozone-forming species. Methane has global warming potential, but the literature on full life-cycle impacts of methane emissions from heavy-duty engines is conflicting. Non-methane organic gases constituted less than 5% of the HC mass for the natural gas trucks (0.53 g/mi over the UDDS and 0.21 g/mi over the Viking test cycle). All the trucks used oxidation catalysts, which were expected to substantially diminish HC and CO emissions. Catalytic methane reduction is more difficult than NMHC reduction and requires specific catalyst formulation. The average THC emissions from the natural gas tractors were 10.4 g/mi over the UDDS and 6.6 g/mi over the Viking cycle.
0
2
4
6
8
10
12
14
16
6211379-CNG 6211395-CNG 6217319-CARB Diesel 6217509-CARB Diesel
Vehicle Number-Fuel Type
NO
X E
mis
sion
(g/m
i)
Modified UDDS CycleModified Viking Cycle
29
Figure A9: Methane, NMHC, and THC Emissions (colored bars represent average measurements; lines represent minimum and maximum measurements)
For the diesel tractors, all HC emissions were assumed to be non-methane. As expected, HC emissions from the diesel trucks were very low (0.44 g/mi on the UDDS and 0.26 g/mi on the Viking cycle) and were of the same order of magnitude as the NMHC emissions from the natural gas trucks. Particulate Emissions Total PM emissions are shown in Figure A10. TPM emissions from the natural gas trucks were reduced by more than 90% compared with TPM emissions from the diesel trucks. PM data show substantial variability in some instances, which can be attributed to the difficulty in performing gravimetric analysis on filter media with low mass loading and to the contribution of particulates shed from the walls of the dilution tunnel. As mentioned earlier, PM10 was collected but was inconclusive because of light loading for all the trucks.
0
2
4
6
8
10
12
6211
379-C
NG-UDDS
6211
379-C
NG-VIK
ING
6211
395-C
NG-UDDS
6211
395-C
NG-VIK
ING
6217
319-C
ARB-UDDS
6217
319-C
ARB-VIK
ING
6217
509-C
ARB-UDDS
6217
509-C
ARB-VIK
ING
Vehicle Number-Fuel Type-Cycle
HC
Em
issi
on (g
/mi)
CH4NMHCTHC
30
0
200
400
600
800
1000
1200
1400
1600
1800
2000
6211379-CNG 6211395-CNG 6217319-CARB 6217509-CARB
Vehicle Number-Fuel Type
CO
2 Em
issi
on (g
/mi)
0
2
4
6
8
10
12
14
16
18
20
Fuel
Eco
nom
y (M
PG)
Modified UDDS Cycle CO2Modified Viking Cycle CO2Modified UDDS-Fuel EconomyModified Viking Cycle - Fuel Economy
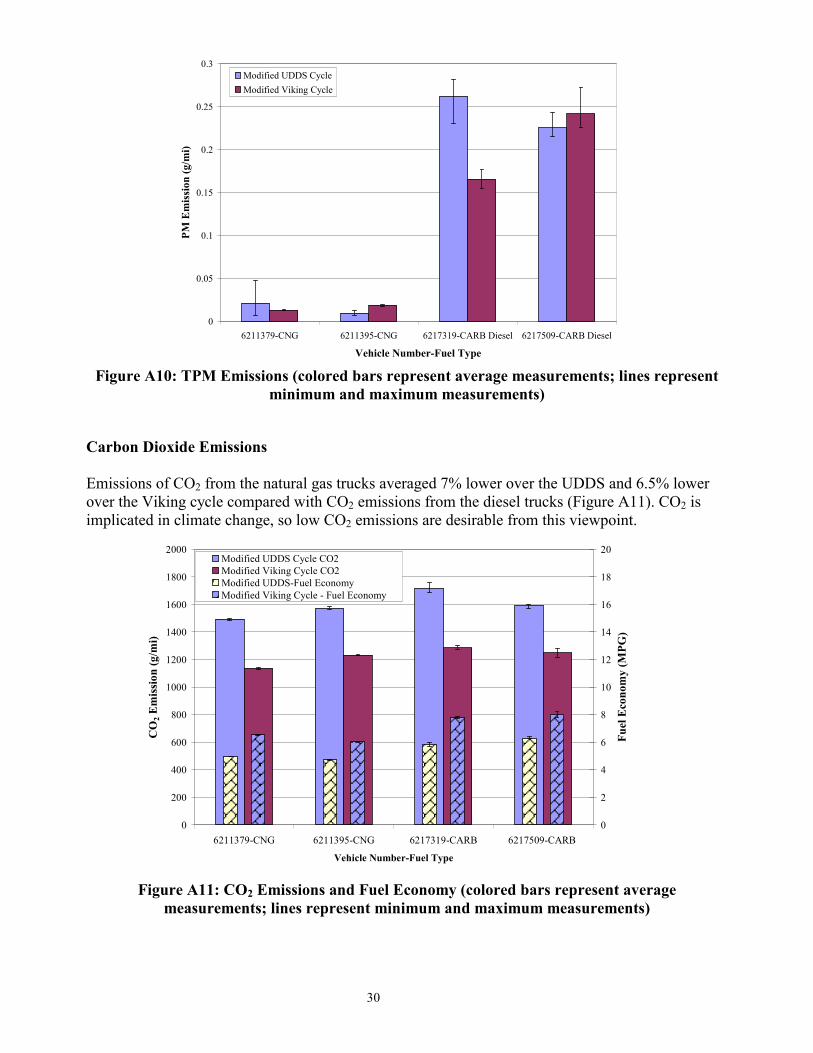
Figure A10: TPM Emissions (colored bars represent average measurements; lines represent minimum and maximum measurements)
Carbon Dioxide Emissions Emissions of CO2 from the natural gas trucks averaged 7% lower over the UDDS and 6.5% lower over the Viking cycle compared with CO2 emissions from the diesel trucks (Figure A11). CO2 is implicated in climate change, so low CO2 emissions are desirable from this viewpoint.
Figure A11: CO2 Emissions and Fuel Economy (colored bars represent average measurements; lines represent minimum and maximum measurements)
0
0.05
0.1
0.15
0.2
0.25
0.3
6211379-CNG 6211395-CNG 6217319-CARB Diesel 6217509-CARB Diesel
Vehicle Number-Fuel Type
PM E
mis
sion
(g/m
i)
Modified UDDS CycleModified Viking Cycle

31
Fuel Economy Southern California Gas Company performed a BTU content of natural gas by gas composition analysis on a sample taken from one of the test vehicles for the program. The analysis reported methane, ethane, propane, iso-butane, n-butane, iso-pentane, n-pentane, C6 plus, carbon dioxide, oxygen, and nitrogen on a mole percentage basis. A lower heating value (LHV) of 919.2 BTU/real cubic foot was determined for the gas and a specific gravity (relative to air) of 0.5828. Considering standard atmospheric conditions, the gas density was calculated to be 20.23 g/ft3, thus converting the gas LHV to 45.438 BTU/g. It was necessary to report the natural gas fuel economy on an equivalent mile per diesel gallon (mpg) because the baseline vehicles were diesel vehicles. The diesel for this study had a LHV of 18,503.972 BTU/lb. Therefore, one pound of diesel equaled 407.236 g of natural gas for this study. The diesel for this study had a density of 6.926 lb/gal. One gallon of diesel equaled 2,820.5 g of natural gas or 2061.5 gC/gal of fuel. Fuel economy was calculated by a carbon-balance method. The method assumes that the mass of carbon in a quantity of fuel is equal to the mass of carbon found in the exhaust produced when that fuel is combusted. In executing this method, contributions to exhaust carbon from lubricating oil and loss of fuel carbon by mass loss past the piston rings (blow-by) are neglected: both of these factors are minor. The mass of carbon measured in the exhaust is given by:
massmassmassS COCOHCRG 22 273.0429.0 ++= Where R2 is the carbon weight fraction of the fuel determined from analysis of the test fuel, HCmass is the mass of hydrocarbons emitted in the exhaust, COmass is the mass of carbon monoxide emitted in the exhaust, and CO2mass is the mass of carbon dioxide emitted in the exhaust. R2 refers to the carbon percentage of the fuel composition. Each hydrocarbon component’s molar percentage was multiplied by the number of carbon atoms in the molecule times the molecular weight and summed to a value represented by A. Then, all the components analyzed in the test fuel were considered. Each species’ molar percentage was multiplied by the number of atoms in the molecule times the molecular weight and summed to a value represented by B. R2 was then calculated by the formula:
BAR =2
Table A3 shows fuel property data used for the fuel economy calculation. The mass of carbon emitted in the exhaust was then converted to a fuel volume and further to a fuel economy by:
( )traveleddistance/
=
sGfuelofgalgC
MPG
32
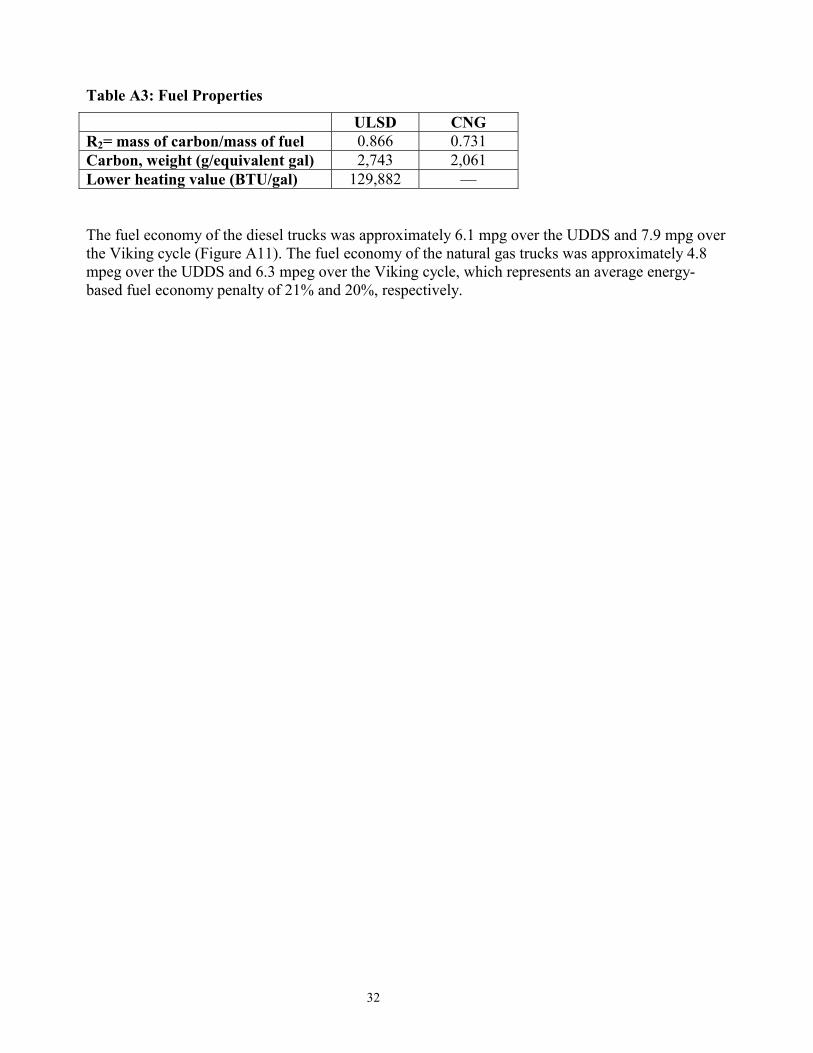
Table A3: Fuel Properties
ULSD CNG R2= mass of carbon/mass of fuel 0.866 0.731 Carbon, weight (g/equivalent gal) 2,743 2,061 Lower heating value (BTU/gal) 129,882 — The fuel economy of the diesel trucks was approximately 6.1 mpg over the UDDS and 7.9 mpg over the Viking cycle (Figure A11). The fuel economy of the natural gas trucks was approximately 4.8 mpeg over the UDDS and 6.3 mpeg over the Viking cycle, which represents an average energy-based fuel economy penalty of 21% and 20%, respectively.

33
Appendix B: Composition of Natural Gas Used by Viking Test Fleet
E N G I N E E R I N G A N A L Y S I S C E N T E R
BTU Content of Natural Gas by Gas Composition (Southern California Gas Company)
PROJECT NO: TS2002-C022 REPORTED BY: M. Mayeda REPORT DATE: 1/ 23/ 2002 TEST LOCATION: Viking Freight - Cummins 8.3 Engine SAMPLE DATE: 1/ 11/ 2002
Mole % (1) (2) (3) Xi*HHV Xi*LHV Xi*SG
Component Xi HHV LHV SG Btu/SCF Btu/SCF METHANE 95.92 1012.3 911.5 0.5539 971.07 874.4 0.5313 ETHANE 1.93 1773.8 1622.4 1.0382 34.15 31.2 0.0200 PROPANE 0.24 2522.0 2320.3 1.5226 5.95 5.5 0.0036 iso-BUTANE 0.03 3259.4 3007.3 2.0068 1.11 1.0 0.0007 n-BUTANE 0.05 3269.9 3017.8 2.0068 1.57 1.4 0.0010 iso-PENTANE 0.01 4010.2 3707.6 2.4910 0.56 0.5 0.0003 n-PENTANE 0.01 4018.0 3715.5 2.4910 0.44 0.4 0.0003 C6 plus 0.07 5194.6 4421.3 3.2522 3.38 2.9 0.0021 CARBON DIOXIDE
0.98 0.0 0 1.5196 0.00 0.0 0.0148
OXYGEN 0.02 0.0 0 1.1048 0.00 0.0 0.0002 NITROGEN 0.75 0.0 0 0.9672 0.00 0.0 0.0073 Totals -----> 100.00 1018.2 917.3 0.5816
(4) Compressiblity Factor (Z) for mixed gases Total Non-Hydrocarbons 1.7 H/C 3.9 A = (Total SG)(0.0101) 0.00587 MON 135.0
B = (Total Non-HC)(.0070) 0.00012 Methane # 100.2 Z = 1.00369 - A + B 0.99794
(5) Adjusted Values (14.73 psia, 60F, Gross, Dry, real volume basis) HHV 1020.3 BTU/ real cubic foot LHV 919.2 BTU/ real cubic foot Specific Gravity 0.5828 FOOTNOTES (1) Higher Heating Value per ideal cubic foot @ 14.73 psia Gas Processors Association (GPA) Standard 2145-00 (2) Lower Heating Value per ideal cubic foot @ 14.73 psia Gas Processors Suppliers Association (GPSA) Vol. II - Sec. 23 - Fig.23-2 (1987) (3) Specific Gravity Gas Processors Association (GPA) Standard 2145-00 (4) Empirical formula for compressibility factor American Gas Association's Transmission Report No. 5. (5) Values are adjusted to reflect real volumes rather than ideal volumes by d ivid ing by the compressibility factor. ex; (BTU/ Ideal Gas Volume)/ Z where Z=(Real Gas Volume/ Ideal Gas Volume)
REPORT DOCUMENTATION PAGE
Form Approved OMB NO. 0704-0188
Public reporting burden for this collection of information is estimated to average 1 hour per response, including the time for reviewing instructions, searching existing data sources, gathering and maintaining the data needed, and completing and reviewing the collection of information. Send comments regarding this burden estimate or any other aspect of this collection of information, including suggestions for reducing this burden, to Washington Headquarters Services, Directorate for Information Operations and Reports, 1215 Jefferson Davis Highway, Suite 1204, Arlington, VA 22202-4302, and to the Office of Management and Budget, Paperwork Reduction Project (0704-0188), Washington, DC 20503. 1. AGENCY USE ONLY (Leave blank)
2. REPORT DATE
April 2003
3. REPORT TYPE AND DATES COVERED
Subcontract Report
4. TITLE AND SUBTITLE An Emission and Performance Comparison of the Natural Gas C-Gas Plus Engine in Heavy-Duty Trucks
6. AUTHOR(S) E.J. Lyford-Pike
5. FUNDING NUMBERS
FC03.1010 ZCI-8-18055-02
7. PERFORMING ORGANIZATION NAME(S) AND ADDRESS(ES)
Cummins, Inc. Columbus, IN
8. PERFORMING ORGANIZATION
REPORT NUMBER
9. SPONSORING/MONITORING AGENCY NAME(S) AND ADDRESS(ES)
National Renewable Energy Laboratory 1617 Cole Blvd. Golden, CO 80401-3393
10. SPONSORING/MONITORING
AGENCY REPORT NUMBER NREL/SR-540-32863
11. SUPPLEMENTARY NOTES
NREL Technical Monitor: M. Frailey 12a. DISTRIBUTION/AVAILABILITY STATEMENT
National Technical Information Service U.S. Department of Commerce 5285 Port Royal Road
Springfield, VA 22161
12b. DISTRIBUTION CODE
13. ABSTRACT (Maximum 200 words) Subcontractor report details results of on-road development and emissions characteristics of C-Gas Plus natural gas engine in Viking Freight heavy-duty trucks.
15. NUMBER OF PAGES
14. SUBJECT TERMS
Viking; C-Gas Plus; C8.3g; CWI; Cummins Westport; natural gas; cng; heavy-duty; alternative; prototype development
16. PRICE CODE
17. SECURITY CLASSIFICATION
OF REPORT Unclassified
18. SECURITY CLASSIFICATION
OF THIS PAGE Unclassified
19. SECURITY CLASSIFICATION
OF ABSTRACT Unclassified
20. LIMITATION OF ABSTRACT
UL
NSN 7540-01-280-5500 Standard Form 298 (Rev. 2-89) Prescribed by ANSI Std. Z39-18 298-102