
PFMA 2011-12 Findings arising from audit of compliance ...€¦ · Findings arising from audit of...
36
CONSOLIDATED GENERAL REPORT on NATIONAL and PROVINCIAL audit outcomes PFMA 2011-12 Findings arising from audit of compliance with laws and regulations
Transcript of PFMA 2011-12 Findings arising from audit of compliance ...€¦ · Findings arising from audit of...

1
CONSOLIDATED GENERAL REPORT on NATIONAL and PROVINCIAL audit outcomes
PFMA 2011-12
Findings arising from audit of compliance with laws and regulations

Ourreputation promise/mission
The Auditor-General of South Africa (AGSA) has a constitutional mandate and, as the Supreme Audit Institution (SAI) of South Africa,
it exists to strengthen our country’s democracy by enabling oversight, accountability and governance in the
public sector through auditing, thereby building public confidence.

FOREWORD

CONSOLIDATED gENErAL rEpOrT ON NATIONAL AND prOVINCIAL AUDIT OUTCOmES Of 2011-12
4
5 risk areas
Key controls
Pervasive root causes
Slow progress towards clean audits with slightly more regressions than improvements
6% (31) 3% (16) 2% (12)
3% (17) 5% (24) 6% (27)
14% (74) 14% (72) 14% (66)
55% (297) 53% (279) 47% (226)
22% (117) 25% (132) 31% (152)
2011-12 (536) 2010-11 (523) 2009-10 (483)
Financially unqualified
with no findings
Financially unqualified
with findings
Qualified with findings
Adverse, disclaimer with
findings
Audits outstanding
Limited progress made in addressing five key risk areas and regression in overall status of key controls
IT controls
Unchanged
HR
Unchanged
Supply chain management
Minimal improvement
Material mistakes in AFS submitted
for audit
Unchanged
Predetermined objectives
Improvement
Leadership Financial and performance management Governance
16% 21%
12%
35%
38%
27%
49% 41%
61%
No significant control weaknesses Control weaknesses are being addressed Control weaknesses are not being addressed
Regression Unchanged
Vacancies in key positions, leadership instability and ineffective performance management
Internal controls not effective – checks and balances not performed
Not all role players are providing the level of assurance required

CONSOLIDATED gENErAL rEpOrT ON NATIONAL AND prOVINCIAL AUDIT OUTCOmES Of 2011-12
5
FOREWORD
It is a pleasure to present to Parliament my 2011-12 general report on audit outcomes of departments, legislatures, public entities and other entities in the national and provincial spheres of government.
In response to the 2010-11 audit outcomes, commitments were made by the executive and oversight bodies to intensify their efforts in bringing positive change within the administration.
Despite my expectation that these commitments would drive improvements towards clean audits, the audit outcomes for the year show a general stagnant trend, with less than a quarter of auditees obtaining clean audit opinions and 52 not able to sustain their prior year clean audit opinion. My report shows that many leaders did not own and drive these commitments, so the commitments are left to flounder until the next audit starts. In this regard, I single out two significant commitments made a year ago:
• The executive committed to meet with my office quarterly for at least an hour. About 78% of them have made time at least three times in the past year to meet and share the results of our assessment of the risks and controls and to consider the status of commitments made and make new commitments. Although the engagements were well received, only small movements in audit outcomes can be seen. This was due to frequent leadership changes resulting in disruption in the implementation of commitments, our message being ignored, or our conversation not being compelling and persuasive enough. We therefore undertake to continue with the quarterly engagements, but with greater emphasis on quality conversations leading to increased impact.
• Parliament and legislatures committed to improve the collaboration between their respective public accounts committees and portfolio committees. We have yet to see more concentrated efforts in this regard as an uncoordinated approach will continue to weaken the effectiveness of oversight.
Of special concern is the increase in auditees with material findings on non-compliance with legislation, bringing it to 74%. Even though I have stressed for the past three years the urgent need to address the quality of the financial statements submitted for audit and weaknesses in supply chain management, human resource management and information technology controls, there has been minimal improvement.
The usefulness and reliability of the annual performance reports continue to improve, which is gratifying. I am now able to make a clearer assessment of service delivery risks but not to the full extent necessary (as some key departments responsible for national outcomes, such as those in the health, education and human settlement sectors, continue to have material shortcomings). Based on the annual performance reports, about 42% of auditees achieved 80% or fewer of their planned service delivery targets, while some departments had significantly underspent their conditional grants and capital budgets. My report further highlights risks to the financial health of national and provincial government flowing from poor budget management, cash and debtors management of departments and the financial management of some public entities. These indicators reflect that the fiscus could be placed under further pressure if such risks are not addressed.
In this general report, I raise three areas that require corrective steps by those charged with governance to achieve improvements in the audit outcomes:
• Vacancies in key positions and instability in leadership positions affect the pace of sustainable improvements. Ineffective performance management is evident at some auditees, which means that officials who perform poorly are not dealt with decisively. A concerted effort is required to address the challenges in human resource capacity and productivity.

CONSOLIDATED gENErAL rEpOrT ON NATIONAL AND prOVINCIAL AUDIT OUTCOmES Of 2011-12
6
• Effective internal controls to prevent, detect and correct non-compliance with legislation and mistakes in the financial and performance reports are lacking. Overall the effectiveness of key controls has regressed, as they were not designed and implemented in a sustainable manner. Checks and balances for all key processes, monthly reporting and validation processes to ensure the credibility of all management information are basic controls which skilled professional should be able to implement.
• Government should be monitored in a thorough, diligent and collaborative manner. My office only provides independent assurance on the credibility of financial and performance information and compliance with selected legislation. We are not the only provider of assurance to the citizens that government is delivering services in a responsible and accountable manner. The monitoring functions vested in senior management, accounting officers, internal audit, audit committees and executive authorities should be better exercised so that audit outcomes and service delivery issues are dealt with through self-monitoring, while audit provides an external validation. The treasuries, offices of the premiers, public service administration and other coordinating/monitoring institutions should fulfil their role envisaged in legislation to guide, support, coordinate and monitor government. The legislatures and Parliament should be scrupulous and courageous in performing their oversight function in order to make an impact on clean administration. My assessment (detailed in this report) is that not all of these role players are providing the level of assurance required to create the momentum towards improve audit outcomes.
A common reaction to the audit outcomes is the question posed by many about the need for officials to be accountable, and for there to be consequences for poor performance, misappropriation of state resources and fraud. In response, we have highlighted in a separate booklet, the range of legislation at the government’s disposal that enables remedies to be applied where there has been transgression. These must be used where necessary to reverse the culture of “business-as-usual”. It is my assessment that the full power of the law is yet to be activated, leading to commentators asking “What can be done?” or saying “There are no consequences”. Highlighting these remedies provides a starting point for our responsible leaders
and the relevant legislatures and departments to take action. All parties have to play their part.
Although progress towards clean audits is slow, I am encouraged by examples of commitments by leaders and officials which translated into improved audit outcomes and I am confident similar results can be achieved by all auditees. In conjunction with various key role players, my office has provided input towards the development of solutions to the challenges highlighted in this report, and will in future share assessments of progress in joint sessions with the Head of Government Business and Parliament and through similar engagements in the provinces.
It is through all our efforts and the work of auditors that we will contribute towards strengthening our democracy through auditing.
Auditor-GeneralPretoriaMarch 2013

CONSOLIDATED gENErAL rEpOrT ON NATIONAL AND prOVINCIAL AUDIT OUTCOmES Of 2011-12
7
FINDINGS ARISING FROM ThE AuDIT OF COMPLIANCE WITh LAWS AND REGuLATIONS

CONSOLIDATED gENErAL rEpOrT ON NATIONAL AND prOVINCIAL AUDIT OUTCOmES Of 2011-12
8
2.4 FINDINGS ARISING FROM ThE AuDIT OF COMPLIANCE WITh LAWS AND REGuLATIONS
2.4.1 Overall outcomes from the audit of compliance with laws and regulations
40%
12%
14%
13%
7%
18%
46%
44%
49%
32%
15%
16%
18%
19%
20%
44%
45%
57%
Other areas of non-compliance
Revenue management
Internal audit
Asset and liability management
HR management
Expenditure management
Supply chain management
Unauthorised, irregular as well as fruitless and wasteful expenditure
Material misstatement/ limitations in submitted annual financial statements
Areas of findings on compliance
2012 2011
Decreased, still high
Remains high
Remains high
287
74
81
91
95
101
222
228
163
247
205
59
71
67
34
90
233
222
Regression
Regression
Improved44 (9%)
Unchanged with �ndings 308 (61%)
Regressed 58 and 9 new
auditees (13%)
Unchanged with no �ndings 83 and
3 new auditees (17%)
Overall increase of 2% over 2010-11
Movement in number of auditees with �ndings on compliance
National departments
Provincial departments
Leading departments
Major public entities and government
business enterprises
National and provincial public
entities
Constitutional institutions and trading entities
Other entities
89% 11% 97% 3% 66% 34% 77% 23% 65% 35% 85% 15% 56% 44%
Auditees with no compliance findings Auditees with compliance findings Decreased Less than 5% change Increased
CONSOLIDATED gENErAL rEpOrT ON NATIONAL AND prOVINCIAL AUDIT OUTCOmES Of 2011-12
9
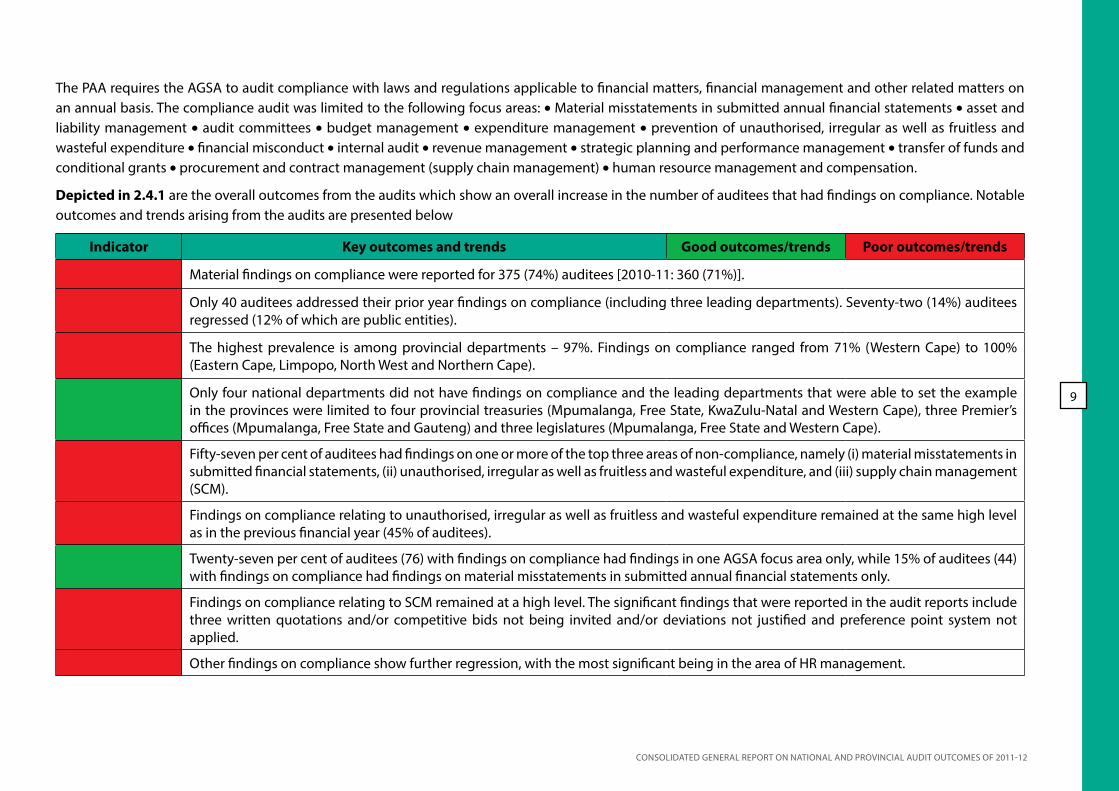
The PAA requires the AGSA to audit compliance with laws and regulations applicable to financial matters, financial management and other related matters on an annual basis. The compliance audit was limited to the following focus areas: • Material misstatements in submitted annual financial statements • asset and liability management • audit committees • budget management • expenditure management • prevention of unauthorised, irregular as well as fruitless and wasteful expenditure • financial misconduct • internal audit • revenue management • strategic planning and performance management • transfer of funds and conditional grants • procurement and contract management (supply chain management) • human resource management and compensation.
Depicted in 2.4.1 are the overall outcomes from the audits which show an overall increase in the number of auditees that had findings on compliance. Notable outcomes and trends arising from the audits are presented below
Indicator Key outcomes and trends Good outcomes/trends Poor outcomes/trends
Material findings on compliance were reported for 375 (74%) auditees [2010-11: 360 (71%)].
Only 40 auditees addressed their prior year findings on compliance (including three leading departments). Seventy-two (14%) auditees regressed (12% of which are public entities).
The highest prevalence is among provincial departments – 97%. Findings on compliance ranged from 71% (Western Cape) to 100% (Eastern Cape, Limpopo, North West and Northern Cape).
Only four national departments did not have findings on compliance and the leading departments that were able to set the example in the provinces were limited to four provincial treasuries (Mpumalanga, Free State, KwaZulu-Natal and Western Cape), three Premier’s offices (Mpumalanga, Free State and Gauteng) and three legislatures (Mpumalanga, Free State and Western Cape).
Fifty-seven per cent of auditees had findings on one or more of the top three areas of non-compliance, namely (i) material misstatements in submitted financial statements, (ii) unauthorised, irregular as well as fruitless and wasteful expenditure, and (iii) supply chain management (SCM).
Findings on compliance relating to unauthorised, irregular as well as fruitless and wasteful expenditure remained at the same high level as in the previous financial year (45% of auditees).
Twenty-seven per cent of auditees (76) with findings on compliance had findings in one AGSA focus area only, while 15% of auditees (44) with findings on compliance had findings on material misstatements in submitted annual financial statements only.
Findings on compliance relating to SCM remained at a high level. The significant findings that were reported in the audit reports include three written quotations and/or competitive bids not being invited and/or deviations not justified and preference point system not applied.
Other findings on compliance show further regression, with the most significant being in the area of hR management.

CONSOLIDATED gENErAL rEpOrT ON NATIONAL AND prOVINCIAL AUDIT OUTCOmES Of 2011-12
10
Indicator Key outcomes and trends Good outcomes/trends Poor outcomes/trends
For auditees whose financial statements were financially unqualified, other areas of findings on compliance include strategic planning and performance management - 52 auditees (12%) [2010-11: 114 (23%)]; budgets - 40 auditees (8%) [2010-11: 34 (7%)]; financial misconduct - 25 auditees (5%) [2010-11: 16 (3%)]; and transfers and conditional grants - 35 auditees (7%) [2010-11: 30 (6%)].
2.4.2 Findings on compliance with laws and regulations
Figure 18: Common areas of findings on compliance with laws and regulations

CONSOLIDATED gENErAL rEpOrT ON NATIONAL AND prOVINCIAL AUDIT OUTCOmES Of 2011-12
11
Figure 18 shows progress (or lack thereof ) made by auditees to address prior year findings on compliance.
The extent and impact of material misstatement/limitations in annual financial statements submitted for audit are analysed in section 2.2. Findings on procurement management are detailed in section 2.4.3 and the extent and nature of unauthorised, irregular, as well as fruitless and wasteful expenditure in section 2.4.4. hR management findings are analysed in section 3.2. Details on the nature of the most prevalent findings in other areas of non-compliance per type of auditee are provided below.
Table 11: Summarised findings in other areas of non-compliance
Nature of other areas of non-compliance per type of auditee
Expenditure management – 101 auditees (20%) 26%
8% 49%
18%
Asset and liability management – 91 auditees (18%)
48% 1%
41% 10%
• Payments to creditors not made within 30 days from receipt of an invoice [92 (18%) auditees]
• Ineffective system of internal control over expenditure [17 (3%) auditees]
• Expenditure incurred without approval by a delegated official [9 (2%) auditees]
• Proper control systems not implemented for safeguarding and maintenance of assets [71 (14%) auditees]
• Bank reconciliations not performed on a daily/weekly basis [27 (5%) auditees]
Internal audit – 81 auditees (16%)
63% 5%
26% 6% Revenue
management – 74 auditees (14%)
38%
7% 46%
9%
• No internal audit function in place [43 (9%) auditees] • No internal audit evaluation and/or recommendations on reliability and
integrity of financial and operational information [34 (7%) auditees] • No internal audit evaluation and/or recommendations on compliance
findings [26 (5%) auditees] • Internal audit findings are further analysed in section 3.4.
• Effective and appropriate steps not taken to timeously collect all revenue due [59 (12%) auditees]
• Appropriate processes not in place for identification, collection, recording, reconciliation and safeguarding of information about revenue [17 (3%) auditees]
• Interest on debts owed to the state is not charged at the rate determined by Minister of Finance [12 (2%) auditees].
Auditees with findings: National departments Provincial departments Leading departments Public entities

CONSOLIDATED gENErAL rEpOrT ON NATIONAL AND prOVINCIAL AUDIT OUTCOmES Of 2011-12
12
2.4.3 Findings arising from the audit of supply chain management
25%
13%
42%
4%
15%
5%
22%
10%
50%
8%
9%
7%
Internal control deficiencies
Inadequate contract management
Uncompetitive or unfair procurement processes
Awards to close family members of employees
Awards to employees
Limitation on planned scope of audit of awards
2011-12 2010-11
35
8
254
64
50
111
27
211
66
128
Findings:
Increase
31
20
38
11
11
1
Same level
Reduction
Same level
Summary of findings on supply chain management
Awards not in compliance with legislation: 2010-11 Awards not in compliance with legislation: 2011-12
Improvement 64 (13%)
Unchanged with findings 218 (43%)
Regression 63 and 6 new auditees
(14%)
Unchanged with no findings
146 and 8 new auditees (30%)
Movement in number of auditees with findings on SCM
Same level of findings as in 2010-11
National departments
Provincial departments
Leading departments
Major public entities and government
business enterprises
National and provincial public
entities
Constitutional institutions and trading entities
Other entities
55% 45% 85% 15% 38% 62% 23% 77% 36% 64% 35% 65% 10% 90%
Auditees with no SCM findings
Auditees with SCM findings
Decreased Less than 5% change Increased

CONSOLIDATED gENErAL rEpOrT ON NATIONAL AND prOVINCIAL AUDIT OUTCOmES Of 2011-12
13
The AGSA audits included an assessment of procurement processes, contract management and the related controls in place. To ensure a fair, equitable, transparent, competitive and cost-effective SCM system, the processes and controls need to comply with legislation and minimise the likelihood of fraud, corruption, favouritism as well as unfair and irregular practices. Contracts awarded and price quotations accepted (referred to as “awards” in the remaining sections of this report) to the value of R96 406 million were tested.
The previous figure presents the movements in the number of auditees with SCM findings, the prevalence of SCM findings across the different types of auditees and a summary of SCM findings, with a comparison to the audit results of the 2010-11 financial year.
Although the auditees in the categories of major public entities, government business enterprises and other entities appear to have the best SCM audit outcomes, it must be noted that they are not subject to the Treasury Regulations on SCM. A number of these auditees are also dormant and/or do limited procurement. Key outcomes and trends are provided in the table below, followed by further analysis of the SCM findings.
Indicator Key outcomes and trends Good outcomes/trends Poor outcomes/trends
Findings on SCM were reported in the management reports of 287 (57%) [2010-11: 282 (58%)] of the auditees, while at 222 (44%) [2010-11: 228 (47%)] auditees the findings were material enough to warrant reporting thereof in the auditor’s report. At an overall level there has been no improvement as the number of auditees that improved is the same as those that regressed.
Awards to the value of R4 862 million that were selected for audit could not be audited due to the required information or documentation not being made available by auditees. These limitations could further impact on the extent of identified irregularities and SCM weaknesses.
The 30% auditees that had no findings in the current or prior year included 11 departments and leading departments, four of the major public entities and government business enterprises, 107 smaller national and provincial public entities and 32 other entities.
The 64 auditees that improved their SCM audit outcomes comprise three national departments, four leading departments, eight provincial departments, five major public entities and government enterprises, 37 national and provincial public entities, five constitutional institutions and trading entities and two other entities.
Of the 154 auditees that again had no SCM findings, nine are provincial departments, two are national departments and 143 are national and provincial public entities. New auditees that had no SCM findings are included in the 154 auditees.
Findings on uncompetitive and unfair procurement processes remain the most prevalent and the number of auditees with these findings continues to increase. The other categories of findings remained largely at the same level.

CONSOLIDATED gENErAL rEpOrT ON NATIONAL AND prOVINCIAL AUDIT OUTCOmES Of 2011-12
14
Limitations on planned scope of the audit of awards
Limitations of R4 862 million were experienced at 35 (7%) auditees where sufficient appropriate audit evidence could not be obtained that awards selected for audit had been made in compliance with the requirements of SCM legislation. No alternative audit procedures could be performed to obtain reasonable assurance that the expenditure incurred in respect of these awards was not irregular. The main reason for these limitations is that supporting documentation is not made available for auditing. The figures below show the extent of limitations and the types of auditees where they are most prevalent.
Figure 19: Limitations experienced on planned scope of the audit of awards
National departments R325 million
Provincial departments
R3 597 million
Constitutional institutions and trading entities
R884 million
National and provincial public
entities R56 million
Value of contracts and quotations where scope limitations were experienced
5%
20%
9%
4%
National departments (25 instances)
Provincial departments (1158 instances)
Constitutional institutions and trading entities
(92 instances)
National and provincial public entities
(59 instances)
2
19
11
3
Number of auditees and instances

CONSOLIDATED gENErAL rEpOrT ON NATIONAL AND prOVINCIAL AUDIT OUTCOmES Of 2011-12
15
Key outcomes and trends are provided in the table below.
Indicator Key outcomes and trends Good outcomes/trends Poor outcomes/trends
The contract and quotation value of limitations experienced increased by R1,5 billion (44%) and limitations were encountered at three more auditees than was the case in the 2010-11 financial year.
The number of identified contracts and quotations decreased by 161 (11%) over 2010-11 from 1 495 to 1 334.
Limitations on planned scope of the audit of awards were experienced at 35 auditees (7%) compared to 27 auditees (6%) in the previous year. eight auditees (30%) regressed, with the most significant increases in this regard were recorded at provincial departments [(four auditees (27%)] and at other entities [five auditees (83%)].
Provincial departments account for 74% of the value of contracts and quotations that could not be audited, 54% of the auditees and 87% of the instances of limitations experienced.The value of the limitations experienced at provincial departments increased significantly by 92% (from R1 874 million to R3 597 million) over the 2010-11 financial year.The auditees where limitations were experienced at provincial departments increased from 15 to 19 (4%) while the instances decreased from 1 203 to 1 158 (4%) over the 2010-11 financial year.
Awards to employees and close family members
The AGSA audits included an assessment of the interest of employees of the auditee and their close family members in suppliers to the auditee. The next table shows the extent and nature of these awards and whether any non-compliance with legislation was identified.

CONSOLIDATED gENErAL rEpOrT ON NATIONAL AND prOVINCIAL AUDIT OUTCOmES Of 2011-12
16
Table 12: Awards to employees and close family members
Auditee type
Awards made to Non-compliance with regard to awards made
Employees Close family members of employees
Supplier did not declare interest
Employee did not declare interest
Other remunerative work not approved
Non-compliance/irregularity in
procurement process
Num
ber o
f ins
tanc
es
Num
ber o
f aud
itee
s
Am
ount
Posi
tion
s
Num
ber o
f ins
tanc
es
Num
ber o
f aud
itee
s
Am
ount
Num
ber o
f ins
tanc
es
Num
ber o
f aud
itee
s
Am
ount
Num
ber o
f ins
tanc
es
Num
ber o
f aud
itee
s
Am
ount
Num
ber o
f ins
tanc
es
Num
ber o
f aud
itee
s
Am
ount
Num
ber o
f ins
tanc
es
Num
ber o
f aud
itee
s
Am
ount
National departments 230 9 R218,0 million
SCM Official, Senior Managers, Other employees
40 5 R20,3 million 112 14 R17,5 million 118 16 R17,5 million 67 3 R12,9
million
Provincial departments 1268 26 R217,5 million Senior Manager,
Other employees 686 31 R119,9 million 1495 30 R307,2
million 1556 31 R37,8 million 728 13 R193,8 million 179 3 R4,8
million
Leading departments 2 2 R40 thousand Other employees 10 2 R0,1 million 4 3 R0,2 million 4 3
Major public entities and government business enterprises
8 2 R0,4 million Other employees 3 2 R0,6 million 7 4 13 5
Applicable to national and provincial departments only
National and provincial public entities
7 4 R1,0 million Senior Manager, Other employees 3 2 R0,5 million 15 4 R0,1 million 15 4 R0,1 million
Constitutional institutions and trading entities
16 3 R1,2 million Other employees 16 3 R1,1 million 16 3 R1,1 million
Total 2011-12 1531 46 R438,1million 742 42 R141,4 million 1649 58 R326,1
million 1722 62 R56,5 million 795 16 R206,7 million 179 3 R4,8
million
Total 2010-11 1890 75 R1 204,8million 223 21 R136,3
million 793 26 R946,3 million 852 39 R225,6 million 505 42 R147,1
million 119 7 R301,9 million
Regression

CONSOLIDATED gENErAL rEpOrT ON NATIONAL AND prOVINCIAL AUDIT OUTCOmES Of 2011-12
17
Legislation does not prohibit awards being made to suppliers in which employees and/or their close family members have an interest. however, there is legislation in place to ensure that conflicts of interest do not result in the unfair awarding of contracts or acceptance of unfavourable price quotations. Legislation also requires of employees at departments to obtain approval for performing remunerative work outside their employment.
Where interests were identified, compliance with SCM legislation of the auditee was tested. The awards identified were also tested with a view to identifying possible non-compliance or irregularities that could be an indication that decisions or recommendations were unlawfully and improperly influenced.
Key outcomes and trends are provided in the table below.
Indicator Key outcomes and trends Good outcomes/trends Poor outcomes/trends
Awards to the value of R 438 million identified at 46 auditees were made to suppliers in which employees of the auditee had an interest. At some auditees the employees included SCM officials and senior managers. This represents a significant decrease from the R 1 205 million identified in the previous year at 75 auditees.The awards to employees identified decreased by 39% - 14% at national departments (six), by 18% at provincial departments (17) and by 7% at leading departments (two).
Awards to the value of R141 million identified at 42 auditees were made to suppliers in which close family members of employees of the auditee had an interest. It represents an increase from the R136 million identified in the previous year at 21 auditees. The awards to close family members of employees identified increased by 100% - 21% at national departments (eight), by 7% at provincial departments (seven), by 14% at leading departments (four) and by 9% at major public entities and government business enterprises (two).
Where interest was identified, the suppliers did not declare the interest in 73% of the instances and the employee did not declare in 76% of instances. At 16 departments the employees doing business with the auditee did not obtain approval for the additional remunerative work.
Uncompetitive or unfair procurement processes
A further focus of AGSA audits was on whether procurement processes followed were fair and competitive in that they provided all suppliers equal opportunity to compete for public sector contracts and that the process did not unfairly favour some suppliers above others. The procurement processes of 8 282 contracts (R90 840 million) and 176 588 quotations (R5 566 billion) were tested at 157 departments and 268 public entities. The number of auditees with findings on uncompetitive or unfair procurement processes increased for all types of auditees, the most significant being by 14% at national departments (6), by 14% at leading departments (4), by 11% at constitutional institutions and trading entities (4) and by 20% at major public entities and government business enterprises (4). The most prevalent findings on non-compliance with SCM legislation that resulted in uncompetitive or unfair procurement processes are summarised in the following table. Similar findings were identified in the prior year.

CONSOLIDATED gENErAL rEpOrT ON NATIONAL AND prOVINCIAL AUDIT OUTCOmES Of 2011-12
18
Table 13: Summarised findings on uncompetitive or unfair procurement processesNature of other areas of non-compliance per type of auditee
Three written quotations not invited – no deviation approved/approved deviation not reasonable/justified – 183 (33%)
52% 5%
33% 9%
Competitive bids not invited – no deviation approved/approved deviation not reasonable/justifiable – 119 (21%)
44% 4%
43% 9%
A price quotation process is prescribed for procurement of goods and services valued at between R10 000 and R500 000. Three prices quotations were not in all instances obtainednfrom prospective providers and deviations were not approved by a properly delegated official or committee as required.
A competitive bidding process should be followed for the procuremnt of goods and services above R500 000. Competitive bids were not always invited and the deviations were not approves by a properly delegated official.
No declaration of interest submitted by provider – 69 (14%)
35% 7%
45% 13% Preference point
system not applied – 74 (14%)
50%
7% 34%
9%
Awards were made to suppliers that did not submit a completed declaration of interest (SBD4 form).
The preferences point system was not applied in all procurement of goods and services above R30 000, as required by Preferential Procurement Policy Framework Act.
Procurement from suppliers without SARS tax clearance – 89 (17%)
49% 9%
29% 12%
Other findings – 119 (24%)
46% 4%
34% 16%
Awards were made to suppliers without proof from South African Revenue Service that their tax matters were in order.
Other findings include: No declaration of past SCM practices, no certificate of independent bid determination and bids advertised for shorter period than prescribed.
Auditees with findings: National departments Provincial departments Leading departments Public entities

CONSOLIDATED gENErAL rEpOrT ON NATIONAL AND prOVINCIAL AUDIT OUTCOmES Of 2011-12
19
Inadequate contract management
Shortcomings in the manner in which contracts are managed result in delays, wastage and fruitless and wasteful expenditure, which in turn impact directly on service delivery. Inadequate contract management remained at the same level, with the most noteworthy improvements at national departments (2) and major public entities and government business enterprises (5). The most prevalent findings on inadequate contract management are summarised in the table below. Similar findings were identified in the prior year.
Inadequate SCM controls
Internal control deficiencies in the SCM environment are the highest at 57 (61%) provincial departments, with a further deterioration of six (12%) auditees. The most prevalent deficiencies identified during the audit on fundamental SCM controls are summarised in the table below. Similar findings were identified in the prior year
Key findings: Inadequate contract management Key findings: Inadequate internal controls
Goods and services were received and payments were made to suppliers without a written, signed contract being in place – 9 (2%) auditees.
The audit committee did not review the effectiveness of the internal control systems related to SCM - 17 (3%)
Contracts amended or extended without approval by a delegated official - 12 (2%) auditees.
Employees without interest in suppliers to the auditee - additional remunerative work not approved - 33 (7%) • Employees performed additional remunerative work without approval
Contracts extended or renewed to circumvent competitive bidding processes - 9 (2%)
Inadequate controls to ensure interest is declared - 26 (5%) • The controls were inadequate to ensure that officials declare to the
auditee whether they or their close family members, partners and associates have interests in suppliers and suppliers to the auditee fail to declare any connections to persons in service of the auditee
Inadequate contract performance measures and monitoring - 15 (3%) Internal audit did not evaluate SCM controls/processes and compliance - 19 (4%) • Some departments utilised a shared an insufficiently staffed internal
audit division within the provincial treasury, resulting in the internal audit responsibilities not being fulfilled
Contract not prepared in accordance with the general conditions of the contract as prescribed by National Treasury - 3 (1%).
Inadequate controls to ensure interest is declared - 26 (5%) • Some officials involved in the implementation of the SCM policy were not
adequatly trained to perform their duties effectively - 22 (4%)
Other findings include payments made in excess of approved contract price (with further approved extensions) and total payments under quotations exceeding the original quoted amount - 9 (2%).
Internal audit did not evaluate SCM controls/processes and compliance - 19 (4%) • Other control deficiencies included: Performance of the SCM unit is not
regularly analysed, risk assessment did not address SCM and where it did, no actions were taken to address SCM risks identified and no controls to monitor performance of contractors - 73 (14%)

CONSOLIDATED gENErAL rEpOrT ON NATIONAL AND prOVINCIAL AUDIT OUTCOmES Of 2011-12
20
2.4.4 unauthorised, irregular as well as fruitless and wasteful expenditure incurred
Irregular expenditure not
prevented 212 (42%)
[2010-11: 195
(38%)] Fruitless and
wasteful expenditure not
prevented 96 (19%)
[2010-11: 110
(22%)]
Disciplinary steps not taken against
officials who made or permitted
UIFW 42 (8%)
[2010-11: 7 (1%)]
Unauthorised expenditure not
prevented 15 (3%)
[2010-11: 23 (5%)]
Nature of compliance findings on unauthorised, irregular as well as fruitless and wasteful expenditure (UIFW)
Irregular expenditure only 107 (21%)
Fruitless and wasteful expenditure only
42 (8%)
Any two of unauthorised,
irregular or fruitless and wasteful expenditure 170 (34%)
All three of unauthorised,
irregular or fruitless and wasteful expenditure
19 (4%)
No unauthorised, irregular or fruitless
and wasteful expenditure 167 (33%)
Nature of auditees that incurred unauthorised, irregular, and/ or fruitless and wasteful expenditure
National departments
Provincial departments
Leading departments
Major public entities and government
business enterprises
National and provincial public
entities
Constitutional institutions and trading entities
Other entities
55% 45% 81% 19% 41% 59% 50% 50% 38% 62% 50% 50% 92% 8%
Auditees with no UIFW compliance findings Auditees with UIFW compliance findings

CONSOLIDATED gENErAL rEpOrT ON NATIONAL AND prOVINCIAL AUDIT OUTCOmES Of 2011-12
21
The PFMA requires accounting officers/authorities to take effective and appropriate steps to ensure that unauthorised, irregular as well as fruitless and wasteful expenditure (uIFW) is prevented. Although there is an expectation that no such expenditure should be incurred, it is not always possible for an accounting officer to prevent the occurrence thereof even if all reasonable steps had been taken. In instances where it does occur, the PFMA makes it compulsory for auditees to disclose such expenditure in their annual financial statements.
The extent of uIFW and the pervasiveness of the related non-compliance with legislation applicable to uIFW as depicted in the previous figure are indicative of a breakdown in auditees’ internal control environment. Key findings are summarised below.
Indicator Key outcomes and trends Good outcomes/trends Poor outcomes/trends
Two thirds of auditees incurred one or more types of uIFW.
Findings on compliance related to uIFW remain the second highest non-compliance area across all auditees (depicted in section 2.4.1). The prevalence of these findings remains unchanged from the 2010-11 financial year at 45% of auditees.
The most prevalent finding was accounting officers/authorities not taking effective steps to prevent irregular expenditure – 217 (43%) auditees, which is an regression from the 195(40%) of the previous year.
The number of auditees with findings on accounting officers not taking effective steps to prevent unauthorised expenditure decreased to only 18 (4%) from 23(5%). A similar improvement to 102 (20%) from 112 (22%) auditees was recorded for prevention of fruitless and wasteful expenditure.
The findings on compliance relating to failure to take disciplinary action against employees who made or permitted unauthorised, irregular or fruitless and wasteful expenditure increased by more than 300%.
Provincial departments (81%) and national departments (55%) had the most findings on compliance relating to uIFW.
CONSOLIDATED gENErAL rEpOrT ON NATIONAL AND prOVINCIAL AUDIT OUTCOmES Of 2011-12
22
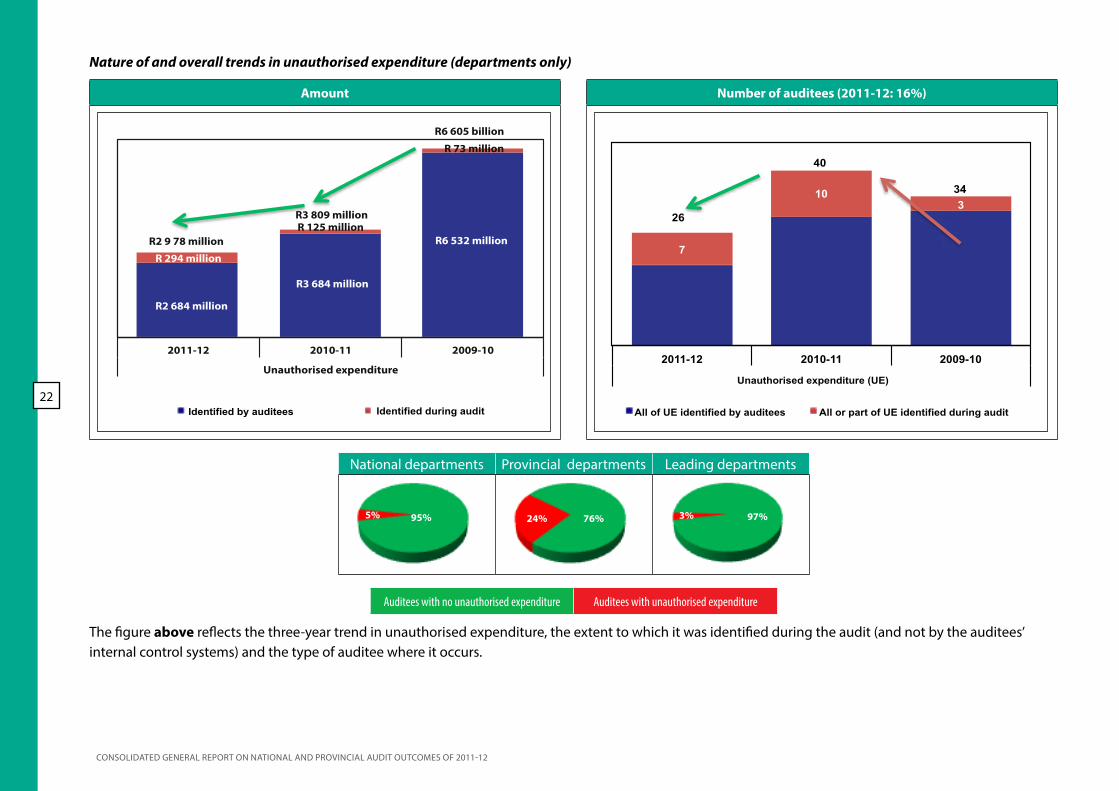
Nature of and overall trends in unauthorised expenditure (departments only)
Amount Number of auditees (2011-12: 16%)
R 294 million
R2 684 million
R3 684 million
R6 532 million R 125 million
R 73 million
2011-12 2010-11 2009-10
Unauthorised expenditure
R2 9 78 million
R3 809 million
R6 605 billion
Identified by auditees Identified during audit
7
10 3
2011-12 2010-11 2009-10
Unauthorised expenditure (UE)
All of UE identified by auditees All or part of UE identified during audit
26
40
34
National departments Provincial departments Leading departments
95% 5% 24% 76% 3% 97%
Auditees with no unauthorised expenditure Auditees with unauthorised expenditure
The figure above reflects the three-year trend in unauthorised expenditure, the extent to which it was identified during the audit (and not by the auditees’ internal control systems) and the type of auditee where it occurs.

CONSOLIDATED gENErAL rEpOrT ON NATIONAL AND prOVINCIAL AUDIT OUTCOmES Of 2011-12
23
The unauthorised expenditure incurred was as a result of overspending of the votes (budget) or main divisions within the votes.
unauthorised expenditure invariably means that money intended for other programmes was used, which affects service delivery in accordance with the performance objectives set for the year.
Key findings are summarised below.
Indicator Key outcomes and trends Good outcomes/trends Poor outcomes/trends
unauthorised expenditure decreased by 35% in number of auditees and by 22% in value.
The most significant decrease in unauthorised expenditure was at national departments where the number of auditees decreased by five and the value by R811 million.
Two national departments (Women, Children and Persons with Disabilities and Public Works) and 24 provincial departments incurred R50 million and R2 928 million, respectively. Provincial departments account for 98% of the total value of unauthorised expenditure.
Ten per cent of unauthorised expenditure was identified by the auditors, increasing from 3% in the 2010-11 financial year.

CONSOLIDATED gENErAL rEpOrT ON NATIONAL AND prOVINCIAL AUDIT OUTCOmES Of 2011-12
24
Nature of and overall trends in irregular expenditure
Amount Number of auditees
R12 118 million
R16 260 million
R13 288 million
R8 836 million
R1 079 million
R9 930 million
R4 862 million
R3 381 million
2011-12 2010-11 2009-10
Irregular expenditure
Limitation (awards not audited and excluded from the total) Identified during audit Identified by auditees
R28 378 million
R22 124 million
R11 009 million
59 56
174
235 206
13
2011-12 2010-11 2009-10
Irregular expenditure (IE)
All of IE identified by auditees All or part of IE identified during audit
262
294
187
National departments
Provincial departments
Leading departments
Major public entities and government
business enterprises
National and provincial public
entities
Constitutional institutions and trading entities
Other entities
92% 8% 87% 13% 69% 31% 41% 59% 48% 52% 38% 62% 79% 21%
Auditees with no irregular expenditure Auditees with irregular expenditure

CONSOLIDATED gENErAL rEpOrT ON NATIONAL AND prOVINCIAL AUDIT OUTCOmES Of 2011-12
25
The nature of and overall trends in irregular expenditure incurred by auditees are depicted earlier. Irregular expenditure does not necessarily mean that money had been wasted or that fraud had been perpetrated. however, it is a measure of an auditees’ ability to comply with laws and regulations as it relates to expenditure and procurement management. The nature of and current year movements in irregular expenditure are reflected in the table below.
Table 14: Nature of and current year movements in irregular expenditure
Nature Number of auditees
Movement in number of auditees
from 2010-11
Amount
Movement in amount
from 2010-11
SCM related 281 16% R24 270 million
50%
Compensation of employees related 59 20% R1 333
million 65%
Other non-compliance 60 7% R2 774
million35%
The following figure shows the extent of irregular expenditure which was disclosed in the current year but stemmed from non-compliance with legislation in prior years.
Figure 20: Irregular expenditure incurred in prior year
R15 881 million (3 123 instances)
R18 611 million
R3 646 million (6 990 instances) R2 566 million
R8 267 million (206 instances) R947 million
R584 million (71 instances)
2011-12 2010-11 2011-12 2010-11
Departments Public entities Identified in current year Incurred in prior years - identified in current year

CONSOLIDATED gENErAL rEpOrT ON NATIONAL AND prOVINCIAL AUDIT OUTCOmES Of 2011-12
26
Key findings are summarised below.
Indicator Key outcomes and trends Good outcomes/trends Poor outcomes/trends
A significant portion (43%) of irregular expenditure incurred by auditees was identified during the audit, indicating that the auditees’ internal controls failed to detect those deviations.
Irregular expenditure increased at 32 auditees (12%) and by R6 254 million (28%). The increase in the number of auditees incurring irregular expenditure is 6 (5%) and 26 (20%) for departments and public entities, respectively.
A notable trend at provincial departments is that the number of auditees remained virtually unchanged (1% increase), but the rand value increased by R3,5 billion (21%). Provincial departments account for 73% of the total irregular expenditure incurred.
Irregular expenditure at auditees that achieved an audit opinion in the category of financially unqualified with findings on PDO and/or compliance increased by 891 million (12%) and at those with qualifications by R6 639 million (89%).
R9 798 million of the irregular expenditure was incurred in prior years but was only identified and reported in the current year.

CONSOLIDATED gENErAL rEpOrT ON NATIONAL AND prOVINCIAL AUDIT OUTCOmES Of 2011-12
27
Nature of and overall trends in fruitless and wasteful expenditure
101
125
91
106
2011-12 2010-11 2009-10
Fruitless and wasteful expenditure (FWE)
Number of auditees (2011-12: 45%)
All of FWE identi ed by auditees All or part of FWE identi ed during audit
226
197
153
153
R958 million
R835 million R930 million R437 million
R 614 million
2011-12 2010-11 2009-10
Fruitless and wasteful expenditure
Amount
Identi ed by auditees Identi ed during audit
R1 793 million
R1 544 million
R437 million
National departments
Provincial departments
Leading departments
Major public entities and government
business enterprises
National and provincial public
entities
Constitutional institutions and trading entities
Other entities
66% 34% 71% 29% 48% 52% 50% 50% 35% 65% 56% 44% 90% 10%
Auditees with no fruitless and wasteful expenditure Auditees with fruitless and wasteful expenditure

CONSOLIDATED gENErAL rEpOrT ON NATIONAL AND prOVINCIAL AUDIT OUTCOmES Of 2011-12
28
The analysis of the nature of fruitless and wasteful expenditure this year reflects the amounts spent to prevent irregular expenditure, losses or further fruitless and wasteful expenditure. The movement indicated in the table below refers to the overall movement in the number of auditees and the movement in amount of fruitless and wasteful expenditure incurred by these auditees.
The actual fruitless and wasteful expenditure relates mostly to payments made to employees and interest incurred on late payments.
Table 25: Nature of and current year movements in fruitless and wasteful expenditure
Nature Number of auditeesMovement in number
of auditees from 2010-11
Amount Movement in amount from 2010-11
Incurred to prevent irregular/ loss/ further fruitless and wasteful expenditure 56 14% R669 million 16%
Actual fruitless and wasteful expenditure 170 R1 123 million
Key findings are summarised below.
Indicator Key outcomes and trends Good outcomes/trends Poor outcomes/trends
The number of auditees incurring fruitless and wasteful expenditure increased by 29 auditees (15%) and the value by R245 million (16%).
The most significant upward trend was at provincial departments where the number of auditees increased by 9 (16%) and the value by R290 million (42%). Provincial departments account for 55% of the total fruitless and wasteful expenditure incurred.
Fruitless and wasteful expenditure at auditees that achieved an audit opinion in the category of financially unqualified with findings on PDO and/or compliance increased in value by R118 million (24%) and at those obtaining disclaimed audit opinions by R193 million (61%).
The increase in number of auditees is eight (8%) and 21 (21%) for departments and public entities, respectively.

CONSOLIDATED gENErAL rEpOrT ON NATIONAL AND prOVINCIAL AUDIT OUTCOmES Of 2011-12
29
2.4.5 Root causes identified and good practice recommendations
Figure 21: Assessment of drivers of internal control – compliance with laws and regulations
Departments: Key drivers of internal control Assessment and movement Public entities: Key drivers of
internal control Assessment and movement
Leadership - Exercise oversight responsibility regarding financial and performance reporting and compliance and related internal controls
30%
20%
41%
45%
28%
35%
2010-11
2011-12 Leadership - Exercise oversight responsibility regarding financial and performance reporting and compliance and related internal controls
Leadership - Exercise oversight responsibility regarding financial and performance reporting and compliance and related internal controls
55%
40%
26%
34%
19%
26%
2010-11
2011-12 Leadership - Exercise oversight responsibility regarding financial and performance reporting and compliance and related internal controls
Leadership - Develop and monitor the implementation of action plans to address internal control deficiencies 42%
24%
45%
52%
13%
24%
2010-11
2011-12 Leadership - Develop and monitor the implementation of action plans to address internal control deficiencies
Financial and performance management - Prepare regular, accurate and complete financial and performance reports that are supported and evidenced by reliable information
65%
60%
22%
22%
13%
18%
2010-11
2011-12 Financial and performance management - Prepare regular, accurate and complete financial and performance reports that are supported and evidenced by reliable information
Financial and performance management - Review and monitor compliance with applicable laws and regulations
20%
11%
45%
39%
35%
50%
2010-11
2011-12 Financial and performance management - Review and monitor compliance with applicable laws and regulations
Financial and performance management - Review and monitor compliance with applicable laws and regulations
51%
36%
27%
36%
22%
28%
2010-11
2011-12 Financial and performance management - Review and monitor compliance with applicable laws and regulations
Good Causing concerns Intervention required Regression

CONSOLIDATED gENErAL rEpOrT ON NATIONAL AND prOVINCIAL AUDIT OUTCOmES Of 2011-12
30
Aspect Identified root causes and way forward recommendations
Leadership tone(continued)
Way forward: Prior year AGSA recommendations
• Leadership needs to enhance their oversight responsibilities to ensure that action is taken against transgressors and that action plans to improve known internal control weaknesses are implemented and monitored.
• Those charged with governance and oversight should ensure that accountability is enforced and appropriate consequences are implemented when officials intentionally do not comply with the requirements of applicable prescripts (especially with regard to SCM).
Way forward: Additional/new good practices recommended
• Action plans must address findings on compliance identified by any audit and must also include measures to prevent non-compliance.
• Leadership needs to enhance their oversight responsibilities to ensure that action is taken against transgressors and that internal control action plans are implemented and monitored.
• Policies and procedures that are aligned to legislation should be implemented.
• Leadership should set the correct tone in dealing with audit outcomes, ensuring compliance with laws and regulations, and should take responsibility for implementing actions to address the reported findings on compliance.
A complete assessment of other drivers of internal control is provided in section 3 of this general report.
The ability of auditees to enforce adherence to legislation and to discharge their statutory responsibilities is influenced by the existence of a sound system of internal control. The key drivers of these control are classified under the fundamental principles of (i) leadership; (ii) financial and performance management; and (iii) governance. More information on the specific drivers of internal control, together with recommendations, is provided in section 3 of this report.
Identified root causes which gave rise to this assessment and the recommended way forward (both prior and additional recommendations for the current year) are summarised as follows.
Table 16: Identified root causes and way forward (good practices)
Aspect Identified root causes and way forward recommendations
Leadership tone
Root causes
• At many departments and public entities, there is a lack of day-to-day monitoring and involvement by the leadership in the administration of the department. This includes taking ownership of compliance issues and addressing key control deficiencies.
• Accountability is not accepted for actions and/or audit outcomes in respect of procurement processes and the use of deviations and for not following a competitive bidding process as a result of poor planning.
• Leadership does not set the correct tone at the top. • Lack of adequate controls and procedures to
ensure compliance with applicable laws and regulations.

CONSOLIDATED gENErAL rEpOrT ON NATIONAL AND prOVINCIAL AUDIT OUTCOmES Of 2011-12
31
Aspect Identified root causes and way forward recommendations
Systems and processes
(continued)
Way forward: Prior year AGSA recommendations
• Appropriate record management and filing systems should be implemented to ensure that tender documentation is readily available. This could include maintaining electronic copies of documentation scanning.
• Monitoring on a monthly basis by designated staff members with a view to detecting and preventing non-compliance. The introduction of compliance checklists will provide auditee management some assurance that controls are achieving the required level of adherence.
• Way forward: Additional/new good practices recommended
• Continuous awareness and training on applicable laws and regulations to prevent non-compliance resulting from lack of awareness of new or amended legislation.
• Systems and processes should be implemented to ensure that breaches of the legislative prescripts are identified and appropriate corrective actions are taken. This includes developing and implementing appropriate compliance reporting policies and procedures, clearly defining roles and responsibilities for reporting on compliance, regularly reconciling reported compliance to supporting documentation, and reporting regularly on compliance.
• Some auditees should consider establishing a compliance unit to perform these compliance functions.
Aspect Identified root causes and way forward recommendations
Systems and processes
Root causes
• Lack of proper record keeping, specifically with regard to tenders, and failure to appropriately safeguard documentation to support tender procedures.
• Leadership did not take appropriate action with regard to a lack of controls in the finance and SCM directorates, resulting in findings on compliance and such non-compliance remaining undetected until the audit.
• Lack of communication of new or amended policies and procedures to affected officials of auditees.

CONSOLIDATED gENErAL rEpOrT ON NATIONAL AND prOVINCIAL AUDIT OUTCOmES Of 2011-12
32
Aspect Identified root causes and way forward recommendations
Oversight and monitoring(continued)
• An oversight system or process to monitor the commitments made by leadership and management to address internal control deficiencies should be established. In the process, this oversight must reside with and be coordinated by the Office of the Premier with quarterly reporting on progress made with regard to commitments.
Effective governance
measures
Root causes
• Audit committees did not use internal audit units effectively to report on the implementation of action plans as reported by management.
• The internal audit function of some auditees was not fully functional during the year, which can be attributed to vacancies within the unit.
• The audit committee did not function throughout the year. Audit committee members were only appointed late in the year, resulting in the committees not being able to fulfil their responsibilities
• Leadership did not regularly seek the findings and views of audit committees and internal audit on internal control and risk management nor did they monitor implementation of recommendations by the audit committee and internal audit with a view to remedial action.
• Risk assessments not performed (at least annually) or performed much too late in the year rendered the risks assessments outdated or irrelevant to the risk management process.
Aspect Identified root causes and way forward recommendations
Oversight and monitoring
Root causes
• The lack of continuous oversight and monitoring by the leadership is one of the main drivers of regression in compliance with laws and regulations. Findings on compliance are not dealt with in a proactive manner, resulting in recurring findings.
• Lack of proper planning for procurement which results in an abuse of provisions for deviations provided for in legislation.
• The lack of continuity in the leadership structures. This instability results in a lack of accountability by leadership and governance structures.
Way forward: Prior year AGSA recommendations
• Leadership should introduce a culture of discipline and should set the right tone. The involvement of the leadership in the day-to-day operations, including involvement in the audit process, should become a standard practice.
Way forward: Additional/new good practices recommended
• Leadership should ensure that internal audit units regularly monitor common and recurring areas of non-compliance and the effective implementation of checklists to ensure compliance before a transaction is entered into and not only after the transaction has been concluded and the payment made.
• The portfolio committees need to intensify their oversight role by holding those departments with recurrent findings on compliance accountable.
• Monthly reporting should include an assessment of compliance with applicable laws and regulations.

CONSOLIDATED gENErAL rEpOrT ON NATIONAL AND prOVINCIAL AUDIT OUTCOmES Of 2011-12
33
Aspect Identified root causes and way forward recommendations
Effective governance
measures(continued)
Way forward: Prior year AGSA recommendations
• Internal audit units should be adequately staffed to ensure that they can accommodate additional requests by the audit committees to confirm credibility of information reported to audit committees.
• Strengthened oversight by the executive leadership in ensuring that risk assessments take place regularly and that those risks are addressed or mitigated timeously.
• Internal audit should validate all irregular expenditure reports and progress made on addressing the root causes and implementation of controls. Progress should be reported to the audit committee, which in turn must provide feedback to the executive authority.
Way forward: Additional/new good practices recommended
• Intensify the focus on the review of compliance by internal audit and audit committee.
• Meetings between the audit committee and the various executive authorities must take place on a quarterly basis to discuss the progress made in addressing findings on internal control deficiencies.

CONSOLIDATED gENErAL rEpOrT ON NATIONAL AND prOVINCIAL AUDIT OUTCOmES Of 2011-12
34
over
view
of f
ull r
epor
t Message from the
Auditor-Gen-eral
Slow progress towards clean audits with more regressions than im-
provements (Part 1)
117 auditees achieved clean audits
(Part 1)
Some progress made towards
improving the reli-ability and useful-
ness of service
delivery reporting
(Part 1)
high levels of unauthorised, irreg-ular as well as fruitless and waste-
ful expenditure
(Part 1)
12
38
39
9169
Continuing high level of non-compli-
ance with laws
and regula-tions
(Part 1)
79

35
Audit outcomes of ministerial port-folios and commitments made for
improvement
(Part 2)
Audit outcomes and weaknesses in implemen-tation of key national programmes in health,
human Settlements, Education, Social Develop-ment and Public Works sectors
The audit outcomes of 3 provinces
regress
(Part 4)
Indications of finan-cial health issues at some departments and public entities
(Part 1)
hR and IT management needs further attention
(Part 1)
Executive leadership, coordinating insti-tutions and legislative oversight should
strengthen their contributions
(Part 1)
Auditees’ internal control sys-tems are not improving
(Part 1)106 168
178
428
470
115
138

36
– RP07/2013 – ISBN: 978-0-621-41523-0
– Visit our website, – www.agsa.co.za,
– to view the complete – Consolidated general report on the 2011-12 national and provincial audit outcomes.