OVERVIEW NROLLMENT - BoardDocs
94
Enrollment, Demographics, and Class Size Report October 2015 Page 1 of 94 OVERVIEW The Enrollment, Demographics, and Class Size Report is a combined report intended to serve as a single source for information related to counts and characteristics of students. The report includes current enrollment and future enrollment projections, demographic information (related to race/ethnicity, socioeconomic status, English language learners, home language, and special education), and class size information for both the elementary and secondary levels. Every attempt has been made to provide accurate information in this report. If you believe there is an error, or if you desire further clarification, please contact Matt Degner, Assistant Superintendent or Amy Kortemeyer, Assistant Superintendent. ENROLLMENT HEAD COUNTS VERSUS CERTIFIED ENROLLMENT VERSUS STUDENTS PROVIDED INSTRUCTION District students are counted for many different purposes, including staffing, class sizes, capacity, and funding, to name a few. Depending on the purpose of the count, a headcount may be used, or some sort of method to “weight” some students differently than others. For instance, for purposes of funding, traditional, full-time students who don’t require special services may provide the district with one level of funding, while those who require more or less services may be weighted such that the district receives more or less funding. Some of the categories for weighting include pre-school, dual-enrolled, home school assistance, and special education. The Department of Education determines a formula that all districts in the State of Iowa use to determine their enrollment for purposes of funding. This formula is based on the students present in each school district on October 1st and results in what is called the “certified enrollment.” The certified enrollment for the 2015-16 school year is 13,671.17. This number is a weighted value based on the way each student in the district is categorized. The district often uses headcounts when referring to enrollment. The K-12 enrollment headcount for the 2015-16 school year is 13,337. Some agencies, such as Grant Wood Area Education Agency, refer to an alternative form of weighted enrollment, often called “students provided instruction.” For the 2015-16 school year, this weighted enrollment is 13,321.97.
Transcript of OVERVIEW NROLLMENT - BoardDocs

Enrollment, Demographics, and Class Size Report October 2015
Page 1 of 94
OVERVIEW The Enrollment, Demographics, and Class Size Report is a combined report intended to serve as a single source for information related to counts and characteristics of students. The report includes current enrollment and future enrollment projections, demographic information (related to race/ethnicity, socioeconomic status, English language learners, home language, and special education), and class size information for both the elementary and secondary levels.
Every attempt has been made to provide accurate information in this report. If you believe there is an error, or if you desire further clarification, please contact Matt Degner, Assistant Superintendent or Amy Kortemeyer, Assistant Superintendent.
ENROLLMENT
HEAD COUNTS VERSUS CERTIFIED ENROLLMENT VERSUS STUDENTS PROVIDED INSTRUCTION
District students are counted for many different purposes, including staffing, class sizes, capacity, and funding, to name a few. Depending on the purpose of the count, a headcount may be used, or some sort of method to “weight” some students differently than others. For instance, for purposes of funding, traditional, full-time students who don’t require special services may provide the district with one level of funding, while those who require more or less services may be weighted such that the district receives more or less funding. Some of the categories for weighting include pre-school, dual-enrolled, home school assistance, and special education.
The Department of Education determines a formula that all districts in the State of Iowa use to determine their enrollment for purposes of funding. This formula is based on the students present in each school district on October 1st and results in what is called the “certified enrollment.” The certified enrollment for the 2015-16 school year is 13,671.17. This number is a weighted value based on the way each student in the district is categorized.
The district often uses headcounts when referring to enrollment. The K-12 enrollment headcount for the 2015-16 school year is 13,337.
Some agencies, such as Grant Wood Area Education Agency, refer to an alternative form of weighted enrollment, often called “students provided instruction.” For the 2015-16 school year, this weighted enrollment is 13,321.97.

Enrollment, Demographics, and Class Size Report October 2015
Page 2 of 94
The method used to calculate the three values, above, can be seen in Appendix 1 of this report. The table there represents the actual categories and counts that were submitted to the Iowa Department of Education for the 2015-16 school year. The blue-shaded cells combine to give the “headcount” of K-12 students (13,337); the purple-shaded cells add up to the “certified enrollment” (13,671.17) upon which District funding for the 2016-17 school year is based; and the orange-shaded cells add up to the value some call “students provided instruction” (13,321.98).
STUDENTS COUNTED IN ONE SCHOOL BUT ATTENDING
ANOTHER
Some students are counted in one school although they actually attend in another location. For instance, students served at Transitions or the Theodore Roosevelt Education Center (TREC) are reflected in the counts of the school to which they are assigned (such as City or West). For purposes of reporting enrollment to the Iowa Department of Education, these are programs, not schools. While Tate High School also draws students from throughout the District without regard to where the students live, much like Transitions and TREC, this is considered a school by the Department of Education, and therefore Tate enrollments are provided in this report.
ENROLLMENT DETAILS
Tables 1 through 4 and figure 1 present information on current and past enrollment. For the 2015-16 school year, the district has increased 287 students in grades K through 12, representing a 2.2% increase. Certified enrollment increased 343.17 or 2.6%, from 13,328.00 to 13,671.17.
Table 1. K-12 enrollment (headcount) change from 2014-15 to 2015-16.
School 2014-15 2015-16 Growth/
Reduction % Growth/ Reduction
Alexander ES 348 348
Borlaug ES 403 431 28 6.9%
Coralville Central ES 404 422 18 4.5%
Garner ES 581 609 28 4.8%
Hills ES 111 184 73 65.8%
Hoover ES 311 272 -39 -12.5%
Horn ES 493 500 7 1.4%
Kirkwood ES 363 314 -49 -13.5%
Lemme ES 407 395 -12 -2.9%
Lincoln ES 237 239 2 0.8%
Longfellow ES 329 338 9 2.7%
Lucas ES 405 442 37 9.1%
Mann ES 223 222 -1 -0.4%
Penn ES 530 552 22 4.2%
Shimek ES 210 212 2 1.0%
Twain ES 378 262 -116 -30.7%
Van Allen ES 507 524 17 3.4%
Weber ES 490 422 -68 -13.9%
Wickham ES 503 529 26 5.2%
Wood ES 511 360 -151 -29.5%
ES Total 7,396 7,577 181 2.4%
North Central JH 478 504 26 5.4%
Northwest JH 641 628 -13 -2.0%
South East JH 800 801 1 0.1%
JH Total 1,919 1,933 14 0.7%
City HS 1,599 1,668 69 4.3%
Tate HS 151 158 7 4.6%
West HS 1,985 2,001 16 0.8%
HS Total 3,735 3,827 92 2.5%
GRAND TOTAL 13,050 13,337 287 2.2%

Enrollment, Demographics, and Class Size Report October 2015
Page 3 of 94
Table 2. 2015-16 enrollment headcount by school by grade.
GRADE Total Total
School PK K 1 2 3 4 5 6 7 8 9 10 11 12 PK-12 K-12
Alexander ES 19 61 60 53 55 50 39 30 367 348
Borlaug ES 42 63 66 71 67 61 40 63 473 431
Coralville Central ES 21 67 59 57 62 62 60 55 443 422
Garner ES 116 95 102 87 79 78 52 609 609
Hills ES 16 31 24 31 33 34 16 15 200 184
Hoover ES 22 39 28 35 43 39 41 47 294 272
Horn ES 77 81 67 67 71 59 78 500 500
Kirkwood ES 22 45 44 59 35 44 36 51 336 314
Lemme ES 50 44 58 69 51 54 69 395 395
Lincoln ES 41 37 36 24 33 33 35 239 239
Longfellow ES 44 52 44 50 47 53 48 338 338
Lucas ES 61 50 76 64 71 55 65 442 442
Mann ES 11 42 29 36 34 23 27 31 233 222
Penn ES 25 83 80 82 70 83 73 81 577 552
Shimek ES 38 35 24 36 21 40 33 23 250 212
Twain ES 33 56 36 45 32 34 30 29 295 262
Van Allen ES 52 81 85 68 78 80 53 79 576 524
Weber ES 66 47 68 64 48 68 61 422 422
Wickham ES 65 70 70 80 76 81 87 529 529
Wood ES 36 55 60 49 43 50 52 51 396 360
ES Total 337 1,178 1,071 1,143 1,078 1,076 981 1,050 7,914 7,577
North Central JH 264 240 504 504
Northwest JH 313 315 628 628
South East JH 398 403 801 801
JH Total 975 958 1,933 1,933
City HS 449 407 410 402 1,668 1,668
Tate HS 10 29 50 69 158 158
West HS 526 521 472 482 2,001 2,001
HS Total 985 957 932 953 3,827 3,827
Offsite Preschools 112 112
GRAND TOTAL 449 1,178 1,071 1,143 1,078 1,076 981 1,050 975 958 985 957 932 953 13,786 13,337

Enrollment, Demographics, and Class Size Report October 2015
Page 4 of 94
Table 3. K-12 enrollment headcount 10-year trend by building.
YEAR
School 2006-07 2007-08 2008-09 2009-10 2010-11 2011-12 2012-13 2013-14 2014-15 2014-15
Alexander ES 348
Borlaug ES 326 373 403 431
Coralville Central ES 448 425 427 430 427 430 429 430 404 422
Garner ES 382 425 491 535 581 609
Hills ES 152 132 137 126 98 110 108 101 111 184
Hoover ES 306 308 306 362 373 372 361 328 311 272
Horn ES 294 292 279 331 362 363 461 466 493 500
Kirkwood ES 441 438 439 345 313 320 331 386 363 314
Lemme ES 283 289 296 332 333 338 372 403 407 395
Lincoln ES 256 260 253 263 244 237 246 239 237 239
Longfellow ES 284 317 305 311 317 345 334 322 329 338
Lucas ES 426 415 424 416 411 440 436 428 405 442
Mann ES 249 257 244 259 250 243 247 243 223 222
Penn ES 391 417 461 511 451 488 516 537 530 552
Roosevelt ES 298 340 365 309 295 279
Shimek ES 220 204 191 200 201 207 199 212 210 212
Twain ES 220 239 234 229 197 225 268 316 378 262
Van Allen ES 487 551 599 661 425 446 467 496 507 524
Weber ES 494 523 540 544 553 564 477 494 490 422
Wickham ES 452 491 493 492 487 476 481 483 503 529
Wood ES 486 524 510 492 472 517 530 525 511 360
ES Total 6,187 6,422 6,503 6,613 6,591 6,825 7,080 7,317 7,396 7,577
North Central JH 308 349 359 396 396 409 469 477 478 504
Northwest JH 620 610 622 615 628 634 650 684 641 628
South East JH 660 701 705 688 661 721 761 781 800 801
JH Total 1,588 1,660 1,686 1,699 1,685 1,764 1,880 1,942 1,919 1,933
City HS 1,359 1,507 1,383 1,371 1,393 1,393 1,414 1,545 1,599 1,668
Tate HS 119 118 110 120 118 162 149 139 151 158
West HS 1,838 1,764 1,754 1,770 1,853 1,910 1,956 1,951 1,985 2,001
HS Total 3,316 3,389 3,247 3,261 3,364 3,465 3,519 3,635 3,735 3,827
GRAND TOTAL 11,091 11,471 11,436 11,573 11,640 12,054 12,479 12,894 13,050 13,337
Enrollment, Demographics, and Class Size Report October 2015
Page 5 of 94
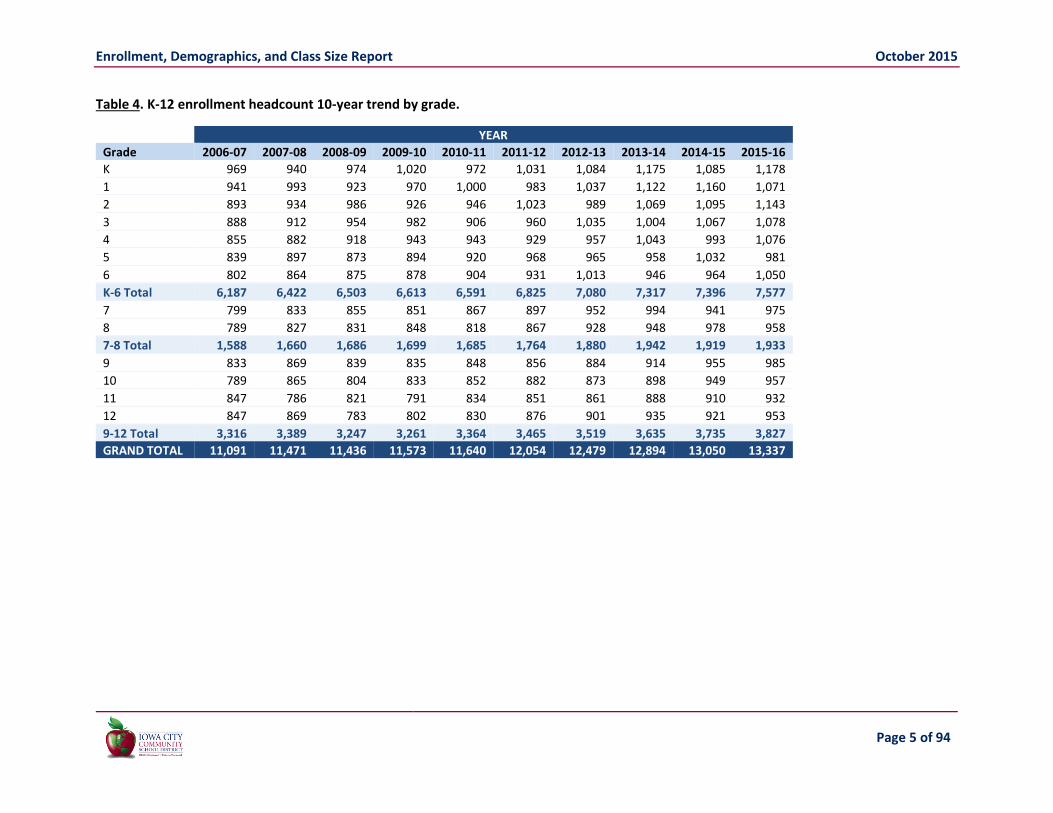
Table 4. K-12 enrollment headcount 10-year trend by grade.
YEAR
Grade 2006-07 2007-08 2008-09 2009-10 2010-11 2011-12 2012-13 2013-14 2014-15 2015-16
K 969 940 974 1,020 972 1,031 1,084 1,175 1,085 1,178
1 941 993 923 970 1,000 983 1,037 1,122 1,160 1,071
2 893 934 986 926 946 1,023 989 1,069 1,095 1,143
3 888 912 954 982 906 960 1,035 1,004 1,067 1,078
4 855 882 918 943 943 929 957 1,043 993 1,076
5 839 897 873 894 920 968 965 958 1,032 981
6 802 864 875 878 904 931 1,013 946 964 1,050
K-6 Total 6,187 6,422 6,503 6,613 6,591 6,825 7,080 7,317 7,396 7,577
7 799 833 855 851 867 897 952 994 941 975
8 789 827 831 848 818 867 928 948 978 958
7-8 Total 1,588 1,660 1,686 1,699 1,685 1,764 1,880 1,942 1,919 1,933
9 833 869 839 835 848 856 884 914 955 985
10 789 865 804 833 852 882 873 898 949 957
11 847 786 821 791 834 851 861 888 910 932
12 847 869 783 802 830 876 901 935 921 953
9-12 Total 3,316 3,389 3,247 3,261 3,364 3,465 3,519 3,635 3,735 3,827
GRAND TOTAL 11,091 11,471 11,436 11,573 11,640 12,054 12,479 12,894 13,050 13,337

Enrollment, Demographics, and Class Size Report October 2015
Page 6 of 94
Figure 1. K-12 enrollment headcount 10-year trend by grade range.
0
2,000
4,000
6,000
8,000
10,000
12,000
14,000
16,000
2006
-07
200
7-0
8
2008
-09
2009
-10
2010
-11
2011
-12
2012
-13
2013
-14
2014
-15
2015
-16
Enro
llmen
t (H
ead
cou
nt)
Year
K-6 Total 7-8 Total 9-12 Total GRAND TOTAL

Enrollment, Demographics, and Class Size Report October 2015
Page 7 of 94
OPEN ENROLLMENT
Iowa law allows a student to “open enroll” between districts. Students who open enroll are allowed to attend a district other than the district in which they reside, and the funding for that student goes with him/her to the new district. Tables 5 through 11 and figures 2 through 5 present information on open enrollment for the district. In 2015-16, 482 students open enrolled out of the district and 97 students open enrolled into the district, for a net loss of 385 students. This net loss of students due to open enrollment is 11.9% more than last year, when the net loss was 344 students. Over the last 10 years, net loss has increased 378.3%.
Students open enroll into and out of many different districts, usually in close proximity with the district in which they reside. There are 12 students who appear to open enroll out to districts far from Iowa City, however those students are actually enrolled in online programs offered by CAM and Clayton Ridge school districts. Mid-Prairie school district has a homeschool assistance program into which many families enroll.
Each year, the district mails a survey (see Appendix) to families of students who have open enrolled out of the district. This year the district mailed surveys to the 98 families with one or more students who open enrolled out of the district, and received 32 surveys back. The results of those surveys are presented in tables 10 and 11. The top two reasons for open enrolling out were: 1) “I feel class sizes are too large,” and, 2) “I feel that the schools are too large.” Eight families responded that they would consider staying in the district.
Table 5. Open enrollment comparison, 2014-15 to 2015-16.
2014-15 2015-16 % Growth/Reduction
Open Enrollment In 117.0 97.0 -17.1%
Open Enrollment Out -461.0 -482.0 4.6%
Net Open Enrollment -344.0 -385.0 11.9%
Table 6. Open enrollment into ICCSD by district by grade.
GRADE Total
District PK K 1 2 3 4 5 6 7 8 9 10 11 12 PK-12
Anamosa 1 1
Cedar Rapids 1 1 1 3
Clear Creek Amana 1 1 3 3 2 4 2 5 2 1 2 3 4 33
College 1 2 1 1 2 1 8
Highland 1 1 2 4
Lone Tree 1 1 3 1 1 7
Mid-Prairie 1 1 1 1 4
Muscatine 1 1
Solon 2 1 2 5
Washington 1 1
West Branch 3 1 3 2 2 1 3 4 3 2 24
West Liberty 1 1 1 1 4
Williamsburg 1 1 2
Total 0 2 5 9 5 7 10 8 11 3 9 8 8 12 97

Enrollment, Demographics, and Class Size Report October 2015
Page 8 of 94
Table 7. Open enrollment out of ICCSD by district by grade.
GRADE Total
District PK K 1 2 3 4 5 6 7 8 9 10 11 12 PK-12
CAM 1 1 3 2 2 9
Cedar Rapids 1 1 1 3
Clayton Ridge 1 1 1 3
Clear Creek Amana 10 8 14 9 13 8 13 15 12 12 17 24 26 181
College 1 1 2 1 1 6
Highland 4 4 5 3 4 4 3 5 6 1 3 6 7 55
Lone Tree 2 1 1 4
Mid-Prairie 14 14 10 9 8 7 6 9 3 7 5 7 5 104
Mount Vernon 1 1 2
Solon 5 9 6 4 11 11 6 13 5 9 4 6 4 93
Tipton 1 1
West Branch 3 3 2 1 2 2 2 15
West Liberty 2 1 2 1 6
GRAND TOTAL 0 37 40 40 25 37 32 32 43 31 33 37 49 46 482

Enrollment, Demographics, and Class Size Report October 2015
Page 9 of 94
Table 8. Net open enrollment (open enrollment in minus open enrollment out) by district by grade.
GRADE Total
District PK K 1 2 3 4 5 6 7 8 9 10 11 12 PK-12
CAM -1 -1 -3 -2 -2 -9
Cedar Rapids 1 1 -1 -1 -1 1 0
Clayton Ridge -1 -1 -1 -3
Clear Creek Amana -9 -7 -11 -6 -11 -4 -11 -10 -10 -11 -15 -21 -22 -148
College -1 2 -1 1 2 -1 2
Columbus 0
Highland -4 -3 -5 -3 -4 -4 -2 -5 -6 -1 -3 -6 -5 -51
Lone Tree -2 1 2 1 1 3
Mid-Prairie -14 -14 -9 -9 -8 -7 -6 -8 -3 -6 -5 -6 -5 -100
Mount Vernon -1 -1 -2
Muscatine 1 1
Solon -5 -9 -6 -4 -11 -9 -6 -13 -5 -9 -3 -6 -2 -88
Tipton -1 -1
Washington 1 1
West Branch -3 1 3 2 2 -1 2 2 1 9
West Liberty -2 -1 1 1 -1 -2
Williamsburg 1 1 2
GRAND TOTAL 0 -35 -36 -31 -20 -30 -22 -24 -32 -28 -24 -29 -41 -34 -386

Enrollment, Demographics, and Class Size Report October 2015
Page 10 of 94
Table 9. Open enrollment 10-year trend.
YEAR
2006-07 2007-08 2008-09 2009-10 2010-11 2011-12 2012-13 2013-14 2014-15 2015-16
Open Enrollment In 175.0 178.8 149.4 149.0 131.0 123.0 120.0 138.0 117.0 97.0
Open Enrollment Out -255.5 -282.2 -285.4 -364.0 -409.0 -418.0 -445.0 -454.0 -461.0 -482.0
Net Open Enrollment -80.5 -103.4 -136.0 -215.0 -278.0 -295.0 -325.0 -316.0 -344.0 -385.0
Figure 2. Open enrollment 10-year trend.
-600.0
-500.0
-400.0
-300.0
-200.0
-100.0
0.0
100.0
200.0
300.0
20
06
-07
20
07
-08
20
08
-09
20
09
-10
20
10
-11
20
11
-12
20
12
-13
20
13
-14
20
14
-15
20
15
-16
We
igh
ted
En
rollm
en
t
Open Enrollment In Open Enrollment Out Net Open Enrollment

Enrollment, Demographics, and Class Size Report October 2015
Page 11 of 94
Table 11. Survey of families open enrolling out, 2015-16, consider staying @ ICCSD?
Consider Staying @ ICCSD Count
No 1
Yes 8 Better Homeschool opportunities 4
ICCSD prefers to not work with 504 plans, any disability unless your child is flunking. Teachers at C Central are great, but their hands are tied as to what they can do. ICCSD all they are worried about are 4.0 students and the lower income. I don't think I we would stay either way. It is very sad.
1
If it was smaller and closer to North Liberty. 1
Outside school gives more one on one in the classroom. They have helpers in their classrooms.
1
Parents were trusted with APEX (had answers to kids daily work to better fill in gaps in learning and understanding) and could proctor their children's tests at home. Also if more variety of online courses were offered with APEX
1
The high school class sizes were smaller. 1
Table 10. Survey of families open enrolling out, 2015-16, reason for leaving.
Reason for Leaving ICCSD Count I feel class sizes are too large 10
I feel that the schools are too large 10
I want my child(ren) to enroll in the homeschool program in another district
9
Currently Attending (staying there) 8
Friends/Relatives in Other District 8
Other School Better 5
Work in Other Community 4
Child Care 3
Feel that the programs are better at another school district 2
Moving to new district 1
We've experienced a change in family status/circumstances.
1
No 3rd High School 0
Total Surveys Mailed to Families 98
Total Surveys Returned 32

Enrollment, Demographics, and Class Size Report October 2015
Page 12 of 94
LIVE-ENROLL
Students sometimes attend schools other than the school to which their home address is assigned. This may occur because the student is assigned to a special education or ELL program, is on a voluntary or SINA transfer, or open enrolls into the district. Tables 12 and 13, and figures 3 and 4, show counts of K-12 students disaggregated by where they live versus where they enroll.
Definitions:
ENROLL: Number of students enrolled in the school
LIVE: Number of students in the applicable grade levels living within the attendance boundary of the school
LIVE & ENROLL: Number of students living within the attendance boundary of the school who are also enrolled in the school
TRANSFER IN: Number of students enrolled in the school that live outside the attendance boundary of the school
TRANSFER OUT: Number of students that live within the attendance boundary of the school that are enrolled in a different school
Table 12. 2015-16 K-6 student live-enroll table.
01. 02. 03. 04. 05. 06. 07. 08. 09. 10. 11. 12. 13. 14. 15. 16. 17. 18. 19. 20. 26.
01. Alexander 333 1 4 4 3 2 4 5 2 5 1 3 1 16 384 51 13.3%02. Borlaug 387 2 4 1 1 6 1 2 404 17 4.2%
03. Coralville Central 13 390 2 5 20 3 2 2 3 7 13 460 70 15.2%04. Garner 586 1 4 27 15 3 29 665 79 11.9%05. Hills 166 2 1 1 1 171 5 2.9%06. Hoover 1 220 4 8 3 1 2 1 240 20 8.3%07. Horn 5 2 1 1 473 1 5 2 1 1 1 14 1 508 35 6.9%08. Kirkwood 14 22 8 282 13 3 1 1 2 3 2 17 1 369 87 23.6%09. Lemme 8 357 1 3 7 1 1 1 379 22 5.8%10. Lincoln 1 2 206 1 1 2 1 214 8 3.7%11. Longfellow 3 1 6 294 3 7 1 6 1 322 28 8.7%12. Lucas 1 1 4 10 4 401 8 4 4 11 448 47 10.5%13. Mann 2 2 1 2 4 4 195 5 3 2 220 25 11.4%14. Penn 1 1 10 1 506 1 13 10 1 544 38 7.0%15. Shimek 1 3 2 1 2 178 187 9 4.8%16. Twain 5 3 1 1 6 7 1 4 2 6 1 5 235 3 3 283 48 17.0%17. Van Allen 1 5 2 5 482 24 519 37 7.1%18. Weber 5 1 377 383 6 1.6%19. Wickham 2 2 2 4 4 1 428 443 15 3.4%20. Wood 7 19 7 1 4 9 2 4 10 2 320 385 65 16.9%26. Out of District 1 4 4 4 1 7 1 2 2 3 12 3 2 2 1 49 49 100.0%Enroll 348 431 422 609 184 272 500 314 395 239 338 442 222 552 212 262 524 422 529 360 - 7,577 761 10.0%Live & Enroll 333 387 390 586 166 220 473 282 357 206 294 401 195 506 178 235 482 377 428 320 - 6,816 Transfer In 15 44 32 23 18 52 27 32 38 33 44 41 27 46 34 27 42 45 101 40 - 761 Transfer (% of Enroll) 4.3% 10.2% 7.6% 3.8% 9.8% 19.1% 5.4% 10.2% 9.6% 13.8% 13.0% 9.3% 12.2% 8.3% 16.0% 10.3% 8.0% 10.7% 19.1% 11.1% 10.0%
ENROLL Live Transfer
Out
Transfer (%
of Live)

Enrollment, Demographics, and Class Size Report October 2015
Page 13 of 94
Table 13. 2015-16 7-12 student live-enroll table.
ENROLL Live
Live & Enroll
Transfer Out
Transfer (% of Live) 20. 21. 22. 23. 24. 25. 26.
LIV
E
20. NCJH 489 21 1 511 489 22 4.3%
21. NWJH 6 588 28 622 588 34 5.5%
22. SEJH 3 16 767 786 767 19 2.4%
23. CHS 1,602 78 76 1,756 1,602 154 8.8%
24. THS - - -
25. WHS 41 77 1,917 2,035 1,917 118 5.8%
26. Out of District 6 3 5 25 3 8 50 - 50 100.0%
Enroll 504 628 801 1,668 158 2,001 - 5,760 5,363 397 6.9% Live & Enroll 489 588 767 1,602 - 1,917 - 5,363
Transfer In 15 40 34 66 158 84 - 397 Transfer (% of Enroll) 3.0% 6.4% 4.2% 4.0% 100% 4.2% 6.9%

Enrollment, Demographics, and Class Size Report October 2015
Page 14 of 94
Figure 3. Percent of students enrolling or transferring out of the school boundary within which they live.
0%
10%
20%
30%
40%
50%
60%
70%
80%
90%
100%
Live
Live & Enroll Transfer Out

Enrollment, Demographics, and Class Size Report October 2015
Page 15 of 94
Figure 4. Percent of students living or transferring in to the school boundary within which they enroll.
0%
10%
20%
30%
40%
50%
60%
70%
80%
90%
100%
Enroll
Live & Enroll Transfer In

Enrollment, Demographics, and Class Size Report October 2015
Page 16 of 94
ENROLLMENT PROJECTIONS
PROJECTIONS BASED ON WHERE STUDENTS ATTEND In 2012-13, the district contracted with DeJONG-RICHTER to conduct an extensive 10-year enrollment projection study. The district again contracted with DeJONG-RICHTER in 2013-14 and 2014-15 to update the projections. Those studies are available on the district website. Tables 14 and 15 present the predicted 2015-16 enrollments along with the actual 2015-16 enrollment and calculate the accuracy of the predictions. While the predictions were only off on average by about 2% of the actual enrollment, all studies over-predicted the total number of students—by 302, 345, and 108 students, respectively.
Projections based on where students attend, disaggregated by grade and building, are presented in tables 15 & 16, and figure 8. Based on these projections, the district is projected to grow by 2,980 students or 22.3% by 2024-25.
Note that boundary changes have occurred following each projection cycle, which significantly impacts projections by building.
Table 14. 2015-16 K-12 enrollment headcount versus predicted enrollment by grade.
3/19/13 Projections 11/26/13 Projections 2/2/15 Projections Grade Actual Predicted Diff. % Diff. Predicted Diff. % Diff. Predicted Diff. % Diff.
K 1,178 1,211 -33 -2.8% 1,214 -36 -3.1% 1,186 -8 -0.7%
1 1,071 1,150 -79 -7.4% 1,168 -97 -9.1% 1,086 -15 -1.4%
2 1,143 1,156 -13 -1.1% 1,219 -76 -6.6% 1,172 -29 -2.5%
3 1,078 1,098 -20 -1.9% 1,161 -83 -7.7% 1,118 -40 -3.7%
4 1,076 1,045 31 2.9% 1,098 -22 -2.0% 1,072 4 0.4%
5 981 1,008 -27 -2.8% 1,033 -52 -5.3% 989 -8 -0.8%
6 1,050 1,069 -19 -1.8% 1,063 -13 -1.2% 1,037 13 1.2%
K-6 Total 7,577 7,737 -160 -2.1% 7,956 -379 -5.0% 7,660 -83 -1.1%
7 975 1,003 -28 -2.9% 954 21 2.2% 972 3 0.3%
8 958 995 -37 -3.9% 942 16 1.7% 931 27 2.8%
7-8 Total 1,933 1,998 -65 -3.4% 1,896 37 1.9% 1,903 30 1.6%
9 985 1,091 -106 -10.8% 1,005 -20 -2.0% 975 10 1.0%
10 957 989 -32 -3.3% 969 -12 -1.3% 981 -24 -2.5%
11 932 919 13 1.4% 918 14 1.5% 960 -28 -3.0%
12 953 905 48 5.0% 938 15 1.6% 966 -13 -1.4%
9-12 Total 3,827 3,904 -77 -2.0% 3,830 -3 -0.1% 3,882 -55 -1.4%
GRAND TOTAL 13,337 13,639 -302 -2.3% 13,682 -345 -2.6% 13,445 -108 -0.8%

Enrollment, Demographics, and Class Size Report October 2015
Page 17 of 94
Table 15. 2015-16 K-12 enrollment headcount versus predicted enrollment by building.
School Actual Predicted* Difference % Difference
Alexander ES 348 259 †
Borlaug ES 431 440 -9 -2.1%
Coralville Central ES 422 394 28 6.6%
Garner ES 609 616 -7 -1.1%
Hills ES 184 172 12 6.5% †
Hoover ES 272 284 -12 -4.4%
Horn ES 500 506 -6 -1.2%
Kirkwood ES 314 380 -66 -21.0%
Lemme ES 395 436 -41 -10.4%
Lincoln ES 239 244 -5 -2.1%
Longfellow ES 338 335 3 0.9%
Lucas ES 442 415 27 6.1%
Mann ES 222 232 -10 -4.5%
Penn ES 552 560 -8 -1.4%
Shimek ES 212 212 0 0.0%
Twain ES 262 304 -42 -16.0% †
Van Allen ES 524 534 -10 -1.9%
Weber ES 422 437 -15 -3.6% †
Wickham ES 529 518 11 2.1%
Wood ES 360 382 -22 -6.1% †
ES Total 7,577 7,660 -83 -1.1%
North Central JH 504 502 2 0.4%
Northwest JH 628 626 2 0.3%
South East JH 801 775 26 3.2%
JH Total 1,933 1,903 30 1.6%
City HS 1,668 1,727 -59 -3.5%
Tate HS 158 158 0 0.0%
West HS 2,001 1,997 4 0.2%
HS Total 3,827 3,882 -55 -1.4%
GRAND TOTAL 13,337 13,445 -108 -0.8%
* February 2, 2015, DeJONG-RICHTER Enrollment Projections
† Schools impacted by 2015-16 boundary changes

Enrollment, Demographics, and Class Size Report October 2015
Page 18 of 94
Table 16. 10-year enrollment projections by grade.
YEAR
Grade 2015-16 2016-17 2017-18 2018-19 2019-20 2020-21 2021-22 2022-23 2023-24 2024-25
K 1,186 1,217 1,230 1,251 1,231 1,235 1,234 1,237 1,235 1,235
1 1,086 1,192 1,223 1,236 1,255 1,239 1,242 1,245 1,242 1,240
2 1,172 1,096 1,196 1,237 1,249 1,265 1,246 1,250 1,251 1,252
3 1,118 1,196 1,121 1,224 1,264 1,275 1,296 1,274 1,280 1,280
4 1,072 1,125 1,201 1,128 1,229 1,277 1,286 1,303 1,284 1,287
5 989 1,069 1,120 1,194 1,123 1,225 1,268 1,277 1,296 1,280
6 1,037 993 1,072 1,127 1,204 1,131 1,230 1,277 1,288 1,306
K-6 Total 7,660 7,888 8,163 8,397 8,555 8,647 8,802 8,863 8,876 8,880
7 972 1,045 1,003 1,083 1,138 1,214 1,137 1,239 1,288 1,298
8 931 961 1,035 993 1,072 1,128 1,201 1,126 1,228 1,274
7-8 Total 1,903 2,006 2,038 2,076 2,210 2,342 2,338 2,365 2,516 2,572
9 975 929 959 1,036 994 1,074 1,127 1,198 1,117 1,225
10 981 1,003 954 985 1,064 1,021 1,103 1,158 1,230 1,146
11 960 992 1,018 968 998 1,077 1,032 1,119 1,173 1,245
12 966 1,023 1,054 1,084 1,031 1,061 1,145 1,100 1,191 1,249
9-12 Total 3,882 3,947 3,985 4,073 4,087 4,233 4,407 4,575 4,711 4,865
GRAND TOTAL 13,445 13,841 14,186 14,546 14,852 15,222 15,547 15,803 16,103 16,317

Enrollment, Demographics, and Class Size Report October 2015
Page 19 of 94
Figure 5. 10-year enrollment projections by grade range.
0
2,000
4,000
6,000
8,000
10,000
12,000
14,000
16,000
18,000
201
5-1
6
2016
-17
2017
-18
2018
-19
2019
-20
2020
-21
2021
-22
2022
-23
2023
-24
2024
-25
K-6 Total 7-8 Total 9-12 Total GRAND TOTAL

Enrollment, Demographics, and Class Size Report October 2015
Page 20 of 94
Table 17. 10-year enrollment projections by building. (2/2/15 projections)
YEAR School 2015-16 2016-17 2017-18 2018-19 2019-20 2020-21 2021-22 2022-23 2023-24 2024-25
Alexander ES 259 276 290 302 310 311 318 318 323 323
Borlaug ES 440 452 473 480 473 462 453 437 436 438
Coralville Central ES 394 409 419 420 427 433 439 445 446 440
Garner ES 616 672 706 747 769 776 795 807 808 810
Hills ES 172 177 178 175 173 165 164 168 164 166
Hoover ES 284 265 243 234 217 210 207 199 196 204
Horn ES 506 537 572 602 622 647 648 663 659 668
Kirkwood ES 380 371 369 380 391 379 381 371 378 378
Lemme ES 436 449 462 485 488 501 516 521 515 524
Lincoln ES 244 241 241 245 253 252 251 241 243 250
Longfellow ES 335 343 336 342 339 350 357 351 351 357
Lucas ES 415 410 434 433 437 433 453 456 464 456
Mann ES 232 223 225 229 231 229 238 235 239 237
Penn ES 560 571 617 632 668 695 711 717 724 706
Shimek ES 212 216 205 196 203 191 194 194 193 197
Twain ES 304 336 363 387 395 398 410 412 418 416
Van Allen ES 534 536 574 601 611 638 646 651 663 666
Weber ES 437 488 523 541 558 575 604 632 610 599
Wickham ES 518 531 538 562 578 585 596 619 618 616
Wood ES 382 385 395 404 412 417 421 426 428 429
ES Total 7,660 7,888 8,163 8,397 8,555 8,647 8,802 8,863 8,876 8,880
North Central JH 502 559 588 589 617 661 690 709 746 802
Northwest JH 626 637 626 634 682 741 757 760 820 840
South East JH 775 810 824 853 911 940 891 896 950 930
JH Total 1,903 2,006 2,038 2,076 2,210 2,342 2,338 2,365 2,516 2,572
City HS 1,727 1,796 1,810 1,868 1,854 1,925 2,009 2,074 2,092 2,130
Tate HS 158 165 168 171 168 174 180 183 194 202
West HS 1,997 1,986 2,007 2,034 2,065 2,134 2,218 2,318 2,425 2,533
HS Total 3,882 3,947 3,985 4,073 4,087 4,233 4,407 4,575 4,711 4,865
GRAND TOTAL 13,445 13,841 14,186 14,546 14,852 15,222 15,547 15,803 16,103 16,317

Enrollment, Demographics, and Class Size Report October 2015
Page 21 of 94
PROJECTIONS BASED ON WHERE STUDENTS LIVE The previous projections are based on where students attend school and are a common method for projections. Due to the extent to which students attend schools other than where they would be assigned due to the location of their home (i.e., they are on a voluntary transfer), in February 2015 the district also contracted with DeJONG-RICHTER to develop projections based on where students live. For the purposes of these projections, catchment areas were defined based on the 2015-16 elementary school boundaries. The projections were completed before the Board moved the Lake Ridge neighborhood back to Twain ES, so the Hills ES and Twain ES Catchment Area projections will not reflect that change.
It is important to note that these projections will only reflect students living in the district and attending a district school. Students who open enroll into the district are only reflected in the previous projections. Students who live within the district but attend a non-public school are also not reflected in these projections.
Those projections, disaggregated by grade and catchment area, are presented in tables 18 and 19, and figure 6. Based on these projections, the number of students living in and attending public schools within the district is projected to grow by 2,966 students or 23% in the next 10 years.
Table 18. 10-year enrollment projections by grade.
YEAR
Grade 2015-16 2016-17 2017-18 2018-19 2019-20 2020-21 2021-22 2022-23 2023-24 2024-25
K 1,107 1,135 1,158 1,166 1,153 1,153 1,156 1,156 1,156 1,156
1 1,085 1,146 1,172 1,196 1,206 1,189 1,195 1,196 1,196 1,194
2 1,138 1,086 1,145 1,176 1,197 1,210 1,192 1,196 1,198 1,195
3 1,106 1,165 1,113 1,169 1,205 1,228 1,239 1,221 1,226 1,227
4 1,049 1,105 1,161 1,107 1,162 1,197 1,219 1,230 1,213 1,219
5 983 1,050 1,111 1,162 1,114 1,166 1,200 1,223 1,235 1,220
6 1,027 989 1,055 1,115 1,176 1,118 1,173 1,209 1,229 1,242
K-6 Total 7,495 7,676 7,915 8,091 8,213 8,261 8,374 8,431 8,453 8,453
7 951 1,041 999 1,064 1,135 1,184 1,129 1,181 1,220 1,237
8 918 943 1,029 986 1,050 1,115 1,166 1,113 1,168 1,206
7-8 Total 1,869 1,984 2,028 2,050 2,185 2,299 2,295 2,294 2,388 2,443
9 968 918 949 1,032 998 1,062 1,124 1,180 1,123 1,181
10 971 1,001 954 984 1,064 1,036 1,096 1,161 1,218 1,157
11 954 995 1,024 973 1,008 1,086 1,060 1,122 1,196 1,257
12 958 1,026 1,067 1,095 1,042 1,079 1,169 1,135 1,211 1,284
9-12 Total 3,851 3,940 3,994 4,084 4,112 4,263 4,449 4,598 4,748 4,879
GRAND TOTAL 13,215 13,600 13,937 14,225 14,510 14,823 15,118 15,323 15,589 15,775

Enrollment, Demographics, and Class Size Report October 2015
Page 22 of 94
Figure 6. 10-year enrollment projections by grade range.
0
2,000
4,000
6,000
8,000
10,000
12,000
14,000
16,000
18,000
2015
-16
2016
-17
2017
-18
2018
-19
2019
-20
2020
-21
2021
-22
2022
-23
2023
-24
2024
-25
K-6 Total 7-8 Total 9-12 Total GRAND TOTAL

Enrollment, Demographics, and Class Size Report October 2015
Page 23 of 94
Table 19. 10-year enrollment projections by catchment area.
YEAR School 2015-16 2016-17 2017-18 2018-19 2019-20 2020-21 2021-22 2022-23 2023-24 2024-25
Alexander Catchment Area 659 692 718 772 816 857 912 945 998 1,030
Borlaug Catchment Area 651 651 660 663 671 684 689 686 697 693
Coralville Central Catchment Area 869 873 884 883 883 895 905 923 940 944
Garner Catchment Area 998 1,069 1,135 1,180 1,223 1,277 1,302 1,346 1,365 1,388
Hills Catchment Area 465 480 479 470 474 477 482 490 500 490
Hoover Catchment Area 472 472 464 469 461 466 441 432 426 422
Horn Catchment Area 858 882 906 930 962 972 998 1,017 1,037 1,051
Kirkwood Catchment Area 761 787 810 830 838 864 884 897 907 926
Lemme Catchment Area 656 674 690 700 722 742 761 757 748 759
Lincoln Catchment Area 383 365 349 348 343 342 340 334 335 329
Longfellow Catchment Area 587 599 609 628 623 626 629 639 634 641
Lucas Catchment Area 772 777 798 790 791 795 812 801 824 814
Mann Catchment Area 384 387 390 399 400 407 413 405 401 412
Penn Catchment Area 889 950 1,010 1,046 1,087 1,110 1,136 1,140 1,163 1,176
Shimek Catchment Area 323 335 343 352 361 374 385 398 406 404
Twain Catchment Area 320 330 337 339 342 354 360 371 378 379
Van Allen Catchment Area 817 848 859 891 931 957 984 1,003 1,038 1,049
Weber Catchment Area 738 796 855 873 899 936 967 1,007 1,043 1,083
Wickham Catchment Area 817 832 845 868 883 903 929 936 951 978
Wood Catchment Area 796 801 796 794 800 785 789 796 798 807
GRAND TOTAL 13,215 13,600 13,937 14,225 14,510 14,823 15,118 15,323 15,589 15,775
Enrollment, Demographics, and Class Size Report October 2015
Page 24 of 94
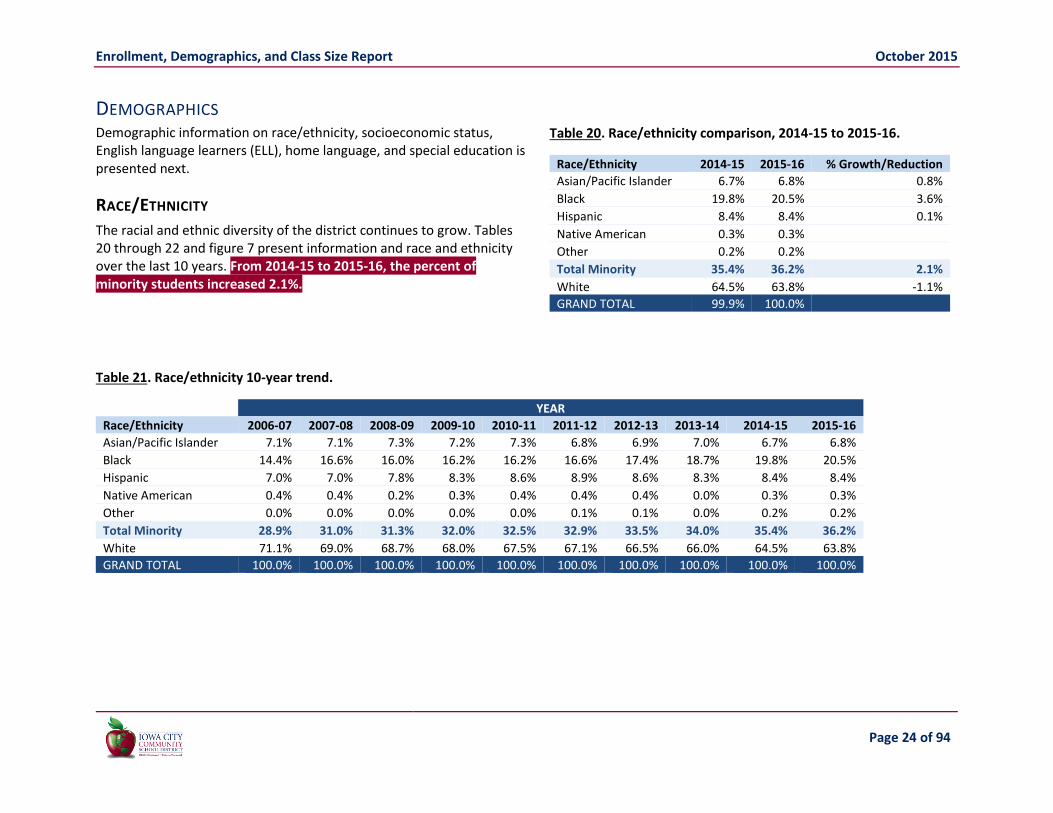
DEMOGRAPHICS Demographic information on race/ethnicity, socioeconomic status, English language learners (ELL), home language, and special education is presented next.
RACE/ETHNICITY
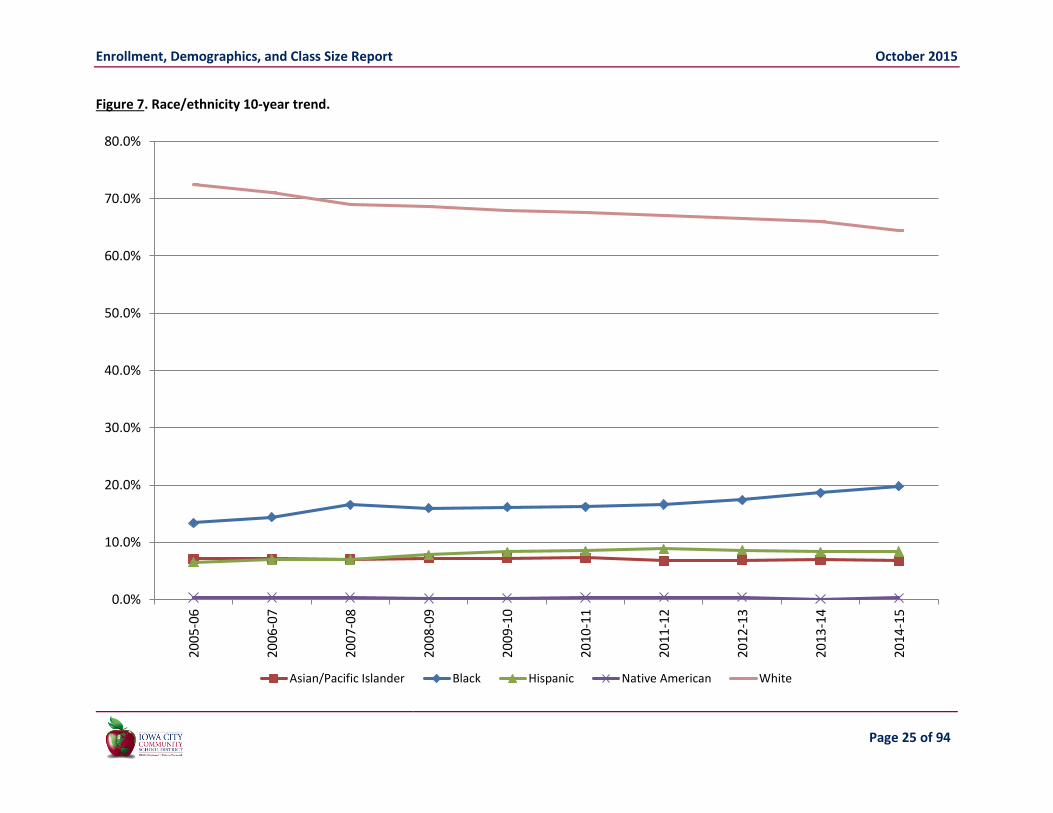
The racial and ethnic diversity of the district continues to grow. Tables 20 through 22 and figure 7 present information and race and ethnicity over the last 10 years. From 2014-15 to 2015-16, the percent of minority students increased 2.1%.
Table 21. Race/ethnicity 10-year trend.
YEAR
Race/Ethnicity 2006-07 2007-08 2008-09 2009-10 2010-11 2011-12 2012-13 2013-14 2014-15 2015-16
Asian/Pacific Islander 7.1% 7.1% 7.3% 7.2% 7.3% 6.8% 6.9% 7.0% 6.7% 6.8%
Black 14.4% 16.6% 16.0% 16.2% 16.2% 16.6% 17.4% 18.7% 19.8% 20.5%
Hispanic 7.0% 7.0% 7.8% 8.3% 8.6% 8.9% 8.6% 8.3% 8.4% 8.4%
Native American 0.4% 0.4% 0.2% 0.3% 0.4% 0.4% 0.4% 0.0% 0.3% 0.3%
Other 0.0% 0.0% 0.0% 0.0% 0.0% 0.1% 0.1% 0.0% 0.2% 0.2%
Total Minority 28.9% 31.0% 31.3% 32.0% 32.5% 32.9% 33.5% 34.0% 35.4% 36.2%
White 71.1% 69.0% 68.7% 68.0% 67.5% 67.1% 66.5% 66.0% 64.5% 63.8%
GRAND TOTAL 100.0% 100.0% 100.0% 100.0% 100.0% 100.0% 100.0% 100.0% 100.0% 100.0%
Table 20. Race/ethnicity comparison, 2014-15 to 2015-16.
Race/Ethnicity 2014-15 2015-16 % Growth/Reduction
Asian/Pacific Islander 6.7% 6.8% 0.8%
Black 19.8% 20.5% 3.6%
Hispanic 8.4% 8.4% 0.1%
Native American 0.3% 0.3%
Other 0.2% 0.2%
Total Minority 35.4% 36.2% 2.1%
White 64.5% 63.8% -1.1%
GRAND TOTAL 99.9% 100.0%
Enrollment, Demographics, and Class Size Report October 2015
Page 25 of 94
Figure 7. Race/ethnicity 10-year trend.
0.0%
10.0%
20.0%
30.0%
40.0%
50.0%
60.0%
70.0%
80.0%
200
5-0
6
200
6-0
7
200
7-0
8
200
8-0
9
200
9-1
0
201
0-1
1
201
1-1
2
201
2-1
3
201
3-1
4
201
4-1
5
Asian/Pacific Islander Black Hispanic Native American White

Enrollment, Demographics, and Class Size Report October 2015
Page 26 of 94
Table 22. Race/ethnicity by school.
RACE/ETHNICITY School Asian/Pacific Islander Black Hispanic Native American Other Total Minority White Grand Total
Borlaug ES 31.2% 16.8% 3.8% * 52.0%-53.8% 46.2%-48.0% 100%
Coralville Central ES 7.7% 26.8% 5.4% * 40.1%-42.0% 58.0%-59.9% 100%
Garner ES 2.6% 9.3% 4.0% * * 16.2%-18.9% 81.1%-83.8% 100%
Hills ES * 12.4% 17.1% * 31.0%-43.4% 56.6%-69.0% 100%
Hoover ES 4.2% 8.1% 6.6% * * 19.5%-24.3% 75.7%-80.5% 100%
Horn ES 14.0% 21.5% 4.7% * 40.4%-42.0% 58.0%-59.6% 100%
Kirkwood ES 2.6% 49.5% 11.1% * * 63.7%-67.9% 32.1%-36.3% 100%
Lemme ES 4.9% 7.9% 12.5% * * 25.8%-29.7% 70.3%-74.2% 100%
Lincoln ES 19.8% 8.9% * * 29.5%-36.3% 63.7%-70.5% 100%
Longfellow ES * 11.2% * * 12.2%-19.5% 80.5%-87.8% 100%
Lucas ES 2.5% 22.2% 15.6% * 40.5%-42.5% 57.5%-59.5% 100%
Mann ES * 14.5% 27.0% 41.9%-45.2% 54.8%-58.1% 100%
Penn ES * 13.4% 2.5% * * 16.4%-20.9% 79.1%-83.6% 100%
Shimek ES * 5.1% * * 6.3%-15.8% 84.2%-93.7% 100%
Twain ES * 35.5% 22.2% * * 58.4%-64.1% 35.9%-41.6% 100%
Van Allen ES 4.8% 6.8% 2.7% 14.3% 85.7% 100%
Weber ES 7.1% 28.2% 9.8% 45.1% 54.9% 100%
Wickham ES 11.9% 5.0% 4.8% * * 22.1%-25.2% 74.8%-77.9% 100%
Wood ES 4.5% 49.1% 17.1% * * 71.1%-74.0% 26.0%-28.9% 100%
Offsite 9.2% 26.2% * * 36.9%-49.2% 50.8%-63.1% 100%
ES Total 6.7%-7.3% 19.6% 8.2%-8.6% 0.2%-1.7% 0.1%-1.1% 34.7%-38.3% 61.7%-65.3% 100%
North Central JH 4.2% 11.3% 5.4% * 21.1%-22.8% 77.2%-78.9% 100%
Northwest JH 11.5% 22.8% 6.4% 40.7% 59.3% 100%
South East JH 3.8% 22.9% 13.0% * * 39.9%-41.9% 58.1%-60.1% 100%
JH Total 6.5% 20.0% 8.9% 0.1%-0.5% 0.1%-0.9% 35.5%-36.7% 63.3%-64.5% 100%
City HS 4.6% 20.2% 11.9% * * 36.9%-37.9% 62.1%-63.1% 100%
Tate HS * 43.7% 14.6% 58.9%-64.2% 35.8%-41.1% 100%
West HS 8.4% 18.3% 4.6% * * 31.4%-32.2% 67.8%-68.6% 100%
HS Total 6.5%-6.7% 20.1% 8.1% 0.1%-0.5% 0.1%-0.5% 34.9%-35.9% 64.1%-65.1% 100%
GRAND TOTAL 6.7% 19.8% 8.4% 0.3% 0.2% 35.4% 64.6% 100%
*cell sizes less than 10 have been suppressed

Enrollment, Demographics, and Class Size Report October 2015
Page 27 of 94
SOCIOECONOMIC STATUS
School districts use the number of students approved for free or reduced price lunch (FRL) as an indicator of socioeconomic status. At the elementary level, the building percent on FRL ranges from 7.2% at Lincoln ES to 78.9% at Twain ES. At the junior high level, the range is from 18.0% at North Central JH to 48.2% at South East JH. The two comprehensive high schools range from 23.4% at West HS to 37.5% at City HS, and Tate HS is at 63.9% FRL. Thirteen schools had FRL averages over the average for the grades they serve, and 13 schools had FRL averages over the overall district average.
Tables 23 through 25 and figure 8 present information on FRL over the last 10 years.
Table 23. 2015-16 Socioeconomic status by building
School K-12 Enrollment* FRL % FRL
Alexander ES 344 255 74.1% † ‡
Borlaug ES 428 137 32.0%
Coralville Central ES 418 200 47.8% † ‡
Garner ES 606 120 19.8%
Hills ES 184 139 75.5% † ‡
Hoover ES 267 48 18.0%
Horn ES 497 205 41.2% † ‡
Kirkwood ES 313 231 73.8% † ‡
Lemme ES 390 107 27.4%
Lincoln ES 236 17 7.2%
Longfellow ES 334 77 23.1%
Lucas ES 437 267 61.1% † ‡
Mann ES 221 107 48.4% † ‡
Penn ES 540 98 18.1%
Shimek ES 212 35 16.5%
Twain ES 256 202 78.9% † ‡
Van Allen ES 524 101 19.3%
Weber ES 422 136 32.2%
Wickham ES 523 80 15.3%
Wood ES 356 266 74.7% † ‡
ES Total 7,508 2,828 37.7% ‡
North Central JH 499 90 18.0%
Northwest JH 617 236 38.2% † ‡
South East JH 791 381 48.2% † ‡
JH Total 1,907 707 37.1% ‡
City HS 1,650 619 37.5% † ‡
Tate HS 158 101 63.9% † ‡
West HS 1,993 467 23.4%
HS Total 3,801 1,187 31.2%
GRAND TOTAL 13,216 4,722 35.7% * Due to federal rules for FRL, some students included in the district enrollment headcount are not included here, † Over K-6, 7-8, or 9-12 Average, ‡ Over District K-12 Average

Enrollment, Demographics, and Class Size Report October 2015
Page 28 of 94
Table 24. Socioeconomic status by building comparison, 2014-15 to 2015-16.
School 2014-15 2015-16 % Growth/Reduction
Alexander ES 74.1%
Borlaug ES 28.3% 32.0% 13.0%
Coralville Central ES 38.5% 47.8% 24.2%
Garner ES 18.6% 19.8% 6.4%
Hills ES 63.1% 75.5% 19.8%
Hoover ES 20.6% 18.0% -12.7%
Horn ES 37.6% 41.2% 9.8%
Kirkwood ES 72.8% 73.8% 1.4%
Lemme ES 26.3% 27.4% 4.5%
Lincoln ES 7.3% 7.2% -0.8%
Longfellow ES 20.2% 23.1% 14.2%
Lucas ES 57.6% 61.1% 6.1%
Mann ES 49.8% 48.4% -2.7%
Penn ES 19.2% 18.1% -5.4%
Shimek ES 14.4% 16.5% 14.5%
Twain ES 75.9% 78.9% 3.9%
Van Allen ES 16.8% 19.3% 14.7%
Weber ES 42.0% 32.2% -23.3%
Wickham ES 10.4% 15.3% 46.8%
Wood ES 74.0% 74.7% 1.0%
ES Total 35.7% 37.7% 5.6%
North Central JH 19.7% 18.0% -8.7%
Northwest JH 34.0% 38.2% 12.6%
South East JH 43.3% 48.2% 11.2%
JH Total 34.3% 37.1% 8.0%
City HS 36.9% 37.5% 1.6%
Tate HS 49.7% 63.9% 28.7%
West HS 22.3% 23.4% 5.1%
HS Total 29.6% 31.2% 5.3%
GRAND TOTAL 33.7% 35.7% 5.9%

Enrollment, Demographics, and Class Size Report October 2015
Page 29 of 94
Table 25. Socioeconomic status 10-year trend by building.
YEAR
School 2006-07 2007-08 2008-09 2009-10 2010-11 2011-12 2012-13 2013-14 2014-15 2015-16
Alexander ES 74.1%
Borlaug ES 26.3% 25.9% 28.3% 32.0%
Coralville Central ES 27.5% 28.9% 29.3% 28.4% 31.6% 26.8% 33.5% 42.0% 38.5% 47.8%
Garner ES 23.0% 21.2% 21.0% 20.6% 18.6% 19.8%
Hills ES 53.9% 71.2% 54.7% 56.3% 56.1% 59.1% 63.9% 67.3% 63.1% 75.5%
Hoover ES 11.8% 15.3% 15.0% 22.9% 24.4% 21.9% 25.7% 23.8% 20.6% 18.0%
Horn ES 13.3% 12.3% 12.9% 18.4% 19.9% 20.1% 28.6% 35.9% 37.6% 41.2%
Kirkwood ES 47.8% 50.9% 51.3% 59.1% 62.6% 60.7% 72.0% 73.9% 72.8% 73.8%
Lemme ES 17.3% 22.5% 22.3% 24.7% 26.7% 24.4% 25.5% 26.6% 26.3% 27.4%
Lincoln ES 1.6% 2.7% 2.8% 5.3% 4.9% 5.4% 5.9% 4.3% 7.3% 7.2%
Longfellow ES 10.9% 22.4% 23.3% 16.1% 17.7% 19.5% 19.7% 18.5% 20.2% 23.1%
Lucas ES 35.9% 32.5% 34.9% 37.7% 44.5% 46.5% 54.0% 54.4% 57.6% 61.1%
Mann ES 46.6% 51.4% 49.6% 51.4% 50.4% 53.9% 55.5% 56.1% 49.8% 48.4%
Penn ES 24.8% 25.4% 23.6% 27.4% 22.8% 21.7% 24.2% 22.2% 19.2% 18.1%
Shimek ES 6.8% 12.7% 7.3% 8.0% 9.5% 9.6% 13.1% 12.0% 14.4% 16.5%
Twain ES 66.8% 77.0% 65.4% 66.4% 80.2% 69.0% 78.6% 77.1% 75.9% 78.9%
Van Allen ES 20.5% 21.1% 21.2% 21.3% 19.1% 17.7% 19.9% 19.4% 16.8% 19.3%
Weber ES 10.1% 12.4% 12.8% 16.2% 14.8% 15.3% 35.1% 41.0% 42.0% 32.2%
Wickham ES 5.3% 5.3% 2.4% 2.8% 5.5% 5.7% 7.1% 10.8% 10.4% 15.3%
Wood ES 49.2% 56.5% 56.3% 64.8% 68.4% 62.7% 77.1% 78.8% 74.0% 74.7%
ES Total 26.7% 30.1% 29.0% 30.8% 31.7% 30.6% 35.0% 36.7% 35.7% 37.7%
North Central JH 14.3% 16.0% 17.5% 15.4% 16.0% 17.6% 20.0% 21.9% 19.7% 18.0%
Northwest JH 24.8% 26.2% 28.9% 32.7% 29.8% 26.5% 31.9% 35.5% 34.0% 38.2%
South East JH 28.6% 34.2% 35.0% 35.9% 35.5% 36.8% 43.8% 43.7% 43.3% 48.2%
JH Total 24.4% 27.5% 29.1% 30.0% 28.8% 28.7% 33.7% 35.5% 34.3% 37.1%
City HS 17.8% 24.9% 26.7% 27.5% 28.6% 31.5% 35.6% 38.6% 36.9% 37.5%
Tate HS 52.9% 66.1% 78.2% 69.2% 67.8% 56.2% 76.0% 80.6% 49.7% 63.9%
West HS 17.2% 17.0% 17.4% 20.1% 21.1% 22.0% 24.7% 24.6% 22.3% 23.4%
HS Total 18.7% 22.2% 23.4% 25.0% 25.8% 27.5% 31.2% 32.7% 29.6% 31.2%
GRAND TOTAL 24.0% 27.4% 27.4% 29.1% 29.6% 29.4% 33.8% 35.4% 33.7% 35.7%

Enrollment, Demographics, and Class Size Report October 2015
Page 30 of 94
Figure 8. Socioeconomic status 10-year trend by grand range.
0%
5%
10%
15%
20%
25%
30%
35%
40%
2006
-07
2007
-08
2008
-09
2009
-10
2010
-11
2011
-12
2012
-13
2013
-14
2014
-15
2j0
15-1
6
% F
RL
ES Total JH Total HS Total GRAND TOTAL

Enrollment, Demographics, and Class Size Report October 2015
Page 31 of 94
ENGLISH LANGUAGE LEARNERS (ELL)
English language learners (ELL) are students who speak a language other than English as their primary language. The number of students in ELL has increased dramatically over the last 10 years, including an increase of 222% from 2012-13 to present. Since 2006-07, the number of students in ELL has increased 200%. Tables 26 and 27 and figure 9 present information on ELL over the last 10 years.
Table 27. English Language Learners (ELL) 10-year trend.
YEAR
Year Funded in Program 2006-07 2007-08 2008-09 2009-10 2010-11 2011-12 2012-13 2013-14 2014-15 2015-16
First Year 156 189 176 120 121 131 201 454 370 352
Second Year 98 133 144 68 50 85 66 172 311 289
Third Year 55 88 89 20 26 23 45 84 122 248
Fourth Year 36 12 60 9 5 10 9 53 50 94
Fifth Year 6 43 52
TOTAL 345 422 469 217 202 249 321 763 896 1035
Table 26. English Language Learners (ELL) comparison, 2014-15 to 2015-16.
Year Funded in Program 2014-15 2015-16 % Growth/Reduction
First Year 370 352 -4.9%
Second Year 311 289 -7.1%
Third Year 122 248 103.3%
Fourth Year 50 94 88.0%
Fifth Year 43 52
TOTAL 853 1035 21.3%

Enrollment, Demographics, and Class Size Report October 2015
Page 32 of 94
Figure 9. English Language Learners (ELL) 10-year trend.
0
200
400
600
800
1000
1200
2006
-07
2007
-08
2008
-09
2009
-10
201
0-1
1
2011
-12
2012
-13
2013
-14
2014
-15
2015
-16
Enro
llmen
t (H
ead
cou
nt)
First Year Second Year Third Year Fourth Year Fifth Year TOTAL

Enrollment, Demographics, and Class Size Report October 2015
Page 33 of 94
HOME LANGUAGE
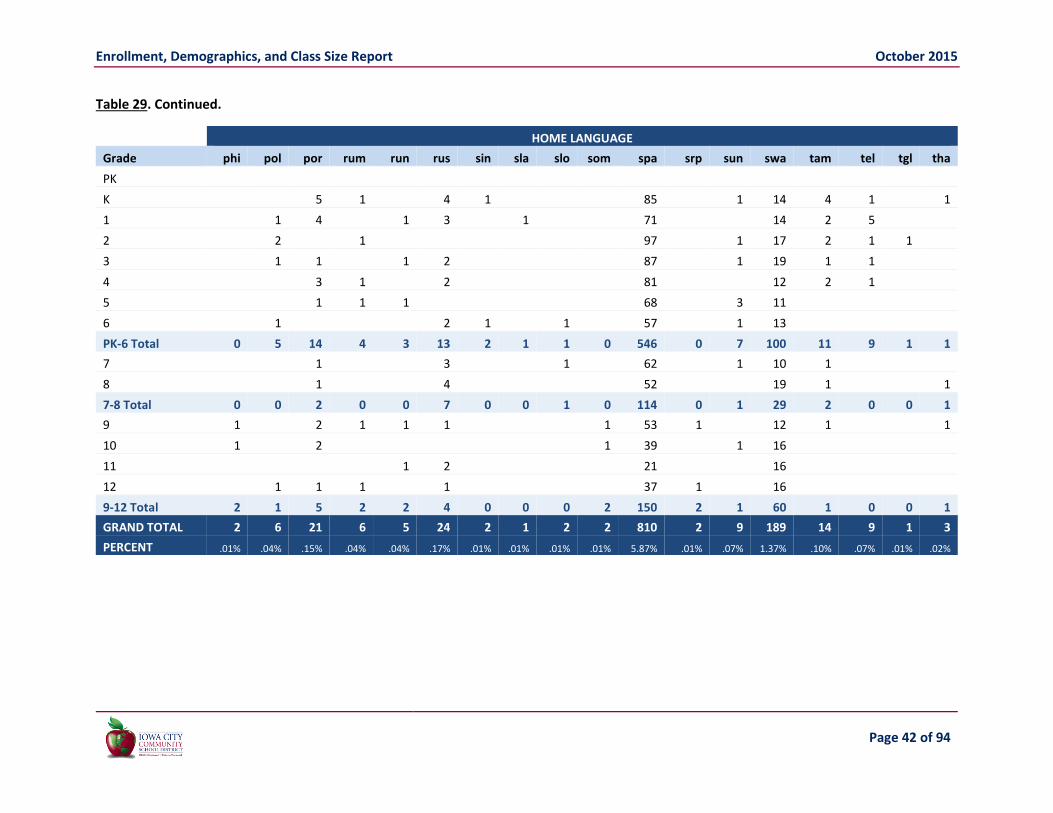
For many families, a language other than English is the primary language spoken at home. In 2015-16, district students spoke 78 different languages in their homes. The top five languages spoken were English (84%), Spanish (6%), Arabic (3%), Chinese (1%), and Swahili (1%). The other 73 languages were spoken by 4.7% of our students. See Appendix 3 for a list of language codes and associated languages.
Figure 10. Home languages
English84%
Spanish6%
Arabic3%
Chinese1%
Swahili1%
Other5%
Top 5 Home Languages
fre22%
kor10%
vie7%
ful4%
rus4%
jpn4%
por3%
urd3%
hin2%
tam2%
Other39%
Next 10 Top Languages
Remaining Home Languages

Enrollment, Demographics, and Class Size Report October 2015
Page 34 of 94
Table 28. Student home languages by building.
HOME LANGUAGE School aar abk afr alb amh ara aze bam ben bnt bos bul bur cha chi cpe cpf cus
Alexander ES 5 1 1 5
Borlaug ES 3 51 43
Coralville Central ES 1 14 2 4
Garner ES
Hills ES
Hoover ES 2
Horn ES 68 2 2 1 21
Kirkwood ES 1 14 1 3 1
Lemme ES 4 2
Lincoln ES 1 4 6
Longfellow ES 1 4 2
Lucas ES 1 2
Mann ES 8 1 2
Penn ES 1
Shimek ES 4
Twain ES 1 3 1 1
Van Allen ES 4 7
Weber ES 72 2 1 13 1
Wickham ES 13 1 18
Wood ES 1 14 2 1 2
ES Total 0 1 1 2 6 286 0 9 5 1 3 1 1 0 129 0 1 1 North Central JH 1 1 1 1 1
Northwest JH 41 2 13
South East JH 1 2 11 1 2 1 2 4 1
JH Total 1 0 1 1 2 53 1 1 2 2 1 0 0 2 18 1 0 0 City HS 1 10 3 1 7 1
Tate HS 1
West HS 5 1 76 1 1 35
HS Total 0 0 5 2 0 87 0 3 1 1 1 0 0 0 42 1 0 0 Offsite Preschools
GRAND TOTAL 1 1 7 5 8 426 1 13 8 4 5 1 1 2 189 2 1 1 PERCENT .01% .01% .05% .04% .06% 3.09% .01% .09% .06% .03% .04% .01% .01% .01% 1.37% .01% .01% .01%

Enrollment, Demographics, and Class Size Report October 2015
Page 35 of 94
Table 28. Continued
HOME LANGUAGE School cze dut dyu eng ewe fil fre ful geo ger gmh guj hat heb hin ind jpn kab
Alexander ES 235 1 30 7
Borlaug ES 2 305 1 2 2 6
Coralville Central ES 378 1 3
Garner ES 598
Hills ES 146
Hoover ES 286
Horn ES 1 2 332 5 1 11 1
Kirkwood ES 246 2 14 1 1
Lemme ES 330 1
Lincoln ES 1 206 1 1 1 1
Longfellow ES 326 3
Lucas ES 347 3 2
Mann ES 163 3
Penn ES 566 3
Shimek ES 246
Twain ES 194 3
Van Allen ES 544 1 1
Weber ES 299 2 5
Wickham ES 1 422 1 5 1 3 1
Wood ES 266 21 3 3
ES Total 1 4 2 6,435 8 1 89 14 1 4 0 1 3 5 10 2 19 1 North Central JH 483 1
Northwest JH 509 9 2 1 2 1 2 1
South East JH 636 12 2 1 1
JH Total 0 0 0 1,628 0 0 21 4 0 1 0 2 0 2 1 2 2 0 City HS 1,438 17 4
Tate HS 146
West HS 1 1,761 2 15 2 1 1 2 1 2 4 1 2
HS Total 0 1 0 3,345 2 0 32 6 1 0 1 2 1 2 4 1 2 0 Offsite Preschools 112
GRAND TOTAL 1 5 2 11,520 10 1 142 24 2 5 1 5 4 9 15 5 23 1 PERCENT .01% .04% .01% 83.56% .07% .01% ##### .17% .01% .04% .01% .04% .03% .07% .11% .04% .17% .01%

Enrollment, Demographics, and Class Size Report October 2015
Page 36 of 94
Table 28. Continued
HOME LANGUAGE School kan khm kik kin kor kpe lao lin lit mal man mar mdr mis nep orm paa per
Alexander ES 5
Borlaug ES 1 24 1 2 1
Coralville Central ES 1 8 2 3 2
Garner ES
Hills ES
Hoover ES
Horn ES 9 1 1 2 1
Kirkwood ES 2 1 2 1
Lemme ES 1 1
Lincoln ES 1
Longfellow ES
Lucas ES 2
Mann ES
Penn ES 1
Shimek ES
Twain ES 1
Van Allen ES
Weber ES 1 3
Wickham ES 7 1 3 1
Wood ES 1 2 1 1
ES Total 1 1 0 7 51 0 5 5 1 5 2 2 0 1 8 3 1 5 North Central JH
Northwest JH 2 4 1 2 1 1 1
South East JH 2 2
JH Total 2 2 0 0 4 0 2 0 0 0 0 1 2 0 1 1 0 1 City HS 3 1 4 1 1 1
Tate HS
West HS 2 11 2 2 1 1 1
HS Total 0 3 1 6 12 1 0 2 0 0 1 2 0 0 1 1 0 1 Offsite Preschools
GRAND TOTAL 3 6 1 13 67 1 7 7 1 5 3 5 2 1 10 5 1 7 PERCENT .02% .04% .01% .09% .49% .01% .05% .05% .01% .04% .02% .04% .01% .01% .07% .04% .01% .05%

Enrollment, Demographics, and Class Size Report October 2015
Page 37 of 94
Table 28. Continued
HOME LANGUAGE School phi pol por rum run rus sin sla slo som spa srp sun swa tam tel tgl tha
Alexander ES 49 22 1
Borlaug ES 3 2 1 1 6 1 5 2 1
Coralville Central ES 6 1 13 4
Garner ES 9 1 1
Hills ES 54
Hoover ES 6
Horn ES 4 3 1 2 16 1 1 2 2
Kirkwood ES 1 37 1 7
Lemme ES 1 1 47 5
Lincoln ES 2 5 2 3 3
Longfellow ES 2
Lucas ES 71 7
Mann ES 55 1
Penn ES 6
Shimek ES
Twain ES 1 78 12
Van Allen ES 1 9 2
Weber ES 1 8 2 9
Wickham ES 1 3 3 1 27 8 1 2
Wood ES 3 48 20
ES Total 0 5 14 4 3 13 2 1 1 0 546 0 7 100 11 9 1 1 North Central JH 1 1 10 1
Northwest JH 1 6 15 5 2 1
South East JH 1 89 1 23
JH Total 0 0 2 0 0 7 0 0 1 0 114 0 1 29 2 0 0 1 City HS 2 3 2 1 112 40
Tate HS 11
West HS 1 2 2 3 2 27 2 1 20 1 1
HS Total 2 1 5 2 2 4 0 0 0 2 150 2 1 60 1 0 0 1 Offsite Preschools
GRAND TOTAL 2 6 21 6 5 24 2 1 2 2 810 2 9 189 14 9 1 3 PERCENT .01% .04% .15% .04% .04% .17% .01% .01% .01% .01% 5.88% .01% .07% 1.37% .10% .07% .01% .02%

Enrollment, Demographics, and Class Size Report October 2015
Page 38 of 94
Table 28. Continued
HOME LANGUAGE Total School tir tur twi urd vie yor PK-12
Alexander ES 1 4 367
Borlaug ES 1 2 3 1 473
Coralville Central ES 443
Garner ES 609
Hills ES 200
Hoover ES 294
Horn ES 1 6 500
Kirkwood ES 336
Lemme ES 1 1 395
Lincoln ES 1 239
Longfellow ES 338
Lucas ES 7 442
Mann ES 233
Penn ES 577
Shimek ES 250
Twain ES 295
Van Allen ES 5 2 576
Weber ES 1 2 422
Wickham ES 1 3 1 529
Wood ES 2 5 396
ES Total 2 5 2 19 22 1 7,914 North Central JH 1 1 504
Northwest JH 2 1 628
South East JH 6 801
JH Total 0 3 0 2 6 0 1,933 City HS 15 1,668
Tate HS 158
West HS 1 2 2 2,001
HS Total 1 2 0 0 17 0 3,827 Offsite Preschools 112 GRAND TOTAL 3 10 2 21 45 1 13,786 PERCENT .02% .07% .01% .15% .33% .01%

Enrollment, Demographics, and Class Size Report October 2015
Page 39 of 94
Table 29. Student home languages by grade.
HOME LANGUAGE
Grade aar abk afr alb amh ara aze bam ben bnt bos bul bur cha chi cpe cpf cus
PK
K 1 47 1 30
1 1 1 2 51 2 1 28
2 51 2 1 17
3 1 37 16 1
4 1 39 2 1 23
5 1 1 30 1 2 1 5
6 1 31 4 1 1 10 1
PK-6 Total 0 1 1 2 6 286 0 9 5 1 3 1 1 0 129 0 1 1
7 1 1 1 27 1 1 1 10 1
8 1 1 26 1 1 1 1 2 8
7-8 Total 1 0 1 1 2 53 1 1 2 2 1 0 0 2 18 1 0 0
9 24 1 15
10 1 23 7
11 5 1 20 2 1 10 1
12 20 1 1 10
9-12 Total 0 0 5 2 0 87 0 3 1 1 1 0 0 0 42 1 0 0
GRAND TOTAL 1 1 7 5 8 426 1 13 8 4 5 1 1 2 189 2 1 1
PERCENT .01% .01% .05% .04% .06% 3.09% .01% .09% .06% .03% .04% .01% .01% .01% 1.37% .01% .01% .01%

Enrollment, Demographics, and Class Size Report October 2015
Page 40 of 94
Table 29. Continued.
HOME LANGUAGE
Grade cze dut dyu eng ewe fil fre ful geo ger gmh guj hat heb hin ind jpn kab
PK 449
K 920 21 1 2 1 1 3
1 2 823 4 17 2 2 2 1 4
2 1 1 900 1 16 1 1 3 1 2 1
3 864 9 4 1 1 2 2
4 872 2 1 9 2 1 1 1 2
5 1 823 11 2 1 1 4
6 1 1 896 1 6 3 1 1 2
PK-6 Total 1 4 2 6,547 8 1 89 14 1 4 0 1 3 5 10 2 19 1
7 821 11 1 1 1 1 1
8 807 10 3 1 1 1 2 1
7-8 Total 0 0 0 1,628 0 0 21 4 0 1 0 2 0 2 1 2 2 0
9 846 1 7 2 1 1 1 2 2 1
10 826 1 11 3 1 2 1
11 1 830 7 1 1
12 843 7 1
9-12 Total 0 1 0 3,345 2 0 32 6 1 0 1 2 1 2 4 1 2 0
GRAND TOTAL 1 5 2 11,520 10 1 142 24 2 5 1 5 4 9 15 5 23 1
PERCENT .01% .04% .01% 83.54% .07% .01% ##### .17% .01% .04% .01% .04% .03% .07% .11% .04% .17% .01%

Enrollment, Demographics, and Class Size Report October 2015
Page 41 of 94
Table 29. Continued.
HOME LANGUAGE
Grade kan khm kik kin kor kpe lao lin lit mal man mar mdr mis nep orm paa per
PK
K 2 6 1 4 2 3 1
1 1 8 1 1 1 1 3 2
2 1 10 2 1 1 1
3 1 11 1 1 1 1
4 1 8 1
5 2 3 2 3
6 1 5 1 1 1
PK-6 Total 1 1 0 7 51 0 5 5 1 5 2 2 0 1 8 3 1 5
7 1 2 2 2 1 1 1 1
8 1 2 2
7-8 Total 2 2 0 0 4 0 2 0 0 0 0 1 2 0 1 1 0 1
9 1 1
10 2 3 2 1 1 1
11 1 1 1 7 1 1
12 2 3 1 1
9-12 Total 0 3 1 6 12 1 0 2 0 0 1 2 0 0 1 1 0 1
GRAND TOTAL 3 6 1 13 67 1 7 7 1 5 3 5 2 1 10 5 1 7
PERCENT .02% .04% .01% .09% .49% .01% .05% .05% .01% .04% .02% .04% .01% .01% .07% .04% .01% .05%
Enrollment, Demographics, and Class Size Report October 2015
Page 42 of 94
Table 29. Continued.
HOME LANGUAGE
Grade phi pol por rum run rus sin sla slo som spa srp sun swa tam tel tgl tha
PK
K 5 1 4 1 85 1 14 4 1 1
1 1 4 1 3 1 71 14 2 5
2 2 1 97 1 17 2 1 1
3 1 1 1 2 87 1 19 1 1
4 3 1 2 81 12 2 1
5 1 1 1 68 3 11
6 1 2 1 1 57 1 13
PK-6 Total 0 5 14 4 3 13 2 1 1 0 546 0 7 100 11 9 1 1
7 1 3 1 62 1 10 1
8 1 4 52 19 1 1
7-8 Total 0 0 2 0 0 7 0 0 1 0 114 0 1 29 2 0 0 1
9 1 2 1 1 1 1 53 1 12 1 1
10 1 2 1 39 1 16
11 1 2 21 16
12 1 1 1 1 37 1 16
9-12 Total 2 1 5 2 2 4 0 0 0 2 150 2 1 60 1 0 0 1
GRAND TOTAL 2 6 21 6 5 24 2 1 2 2 810 2 9 189 14 9 1 3
PERCENT .01% .04% .15% .04% .04% .17% .01% .01% .01% .01% 5.87% .01% .07% 1.37% .10% .07% .01% .02%

Enrollment, Demographics, and Class Size Report October 2015
Page 43 of 94
Table 29. Continued.
HOME LANGUAGE Total
Grade tir tur twi urd vie yor yor PK-12
PK 449
K 1 2 6 4 1 1 1,179
1 4 4 1 1,072
2 1 4 1 1,143
3 1 1 1 7 1 1,079
4 2 3 2 1,076
5 2 981
6 2 2 1,050
PK-6 Total 2 5 2 19 22 1 3 8,029
7 2 1 1 975
8 1 1 5 958
7-8 Total 0 3 0 2 6 0 0 1,933
9 1 3 985
10 1 1 9 957
11 932
12 5 953
9-12 Total 1 2 0 0 17 0 0 3,827
GRAND TOTAL 3 10 2 21 45 1 3 13,789
PERCENT .02% .07% .01% .15% .33% .01% .02%

Enrollment, Demographics, and Class Size Report October 2015
Page 44 of 94
SPECIAL EDUCATION
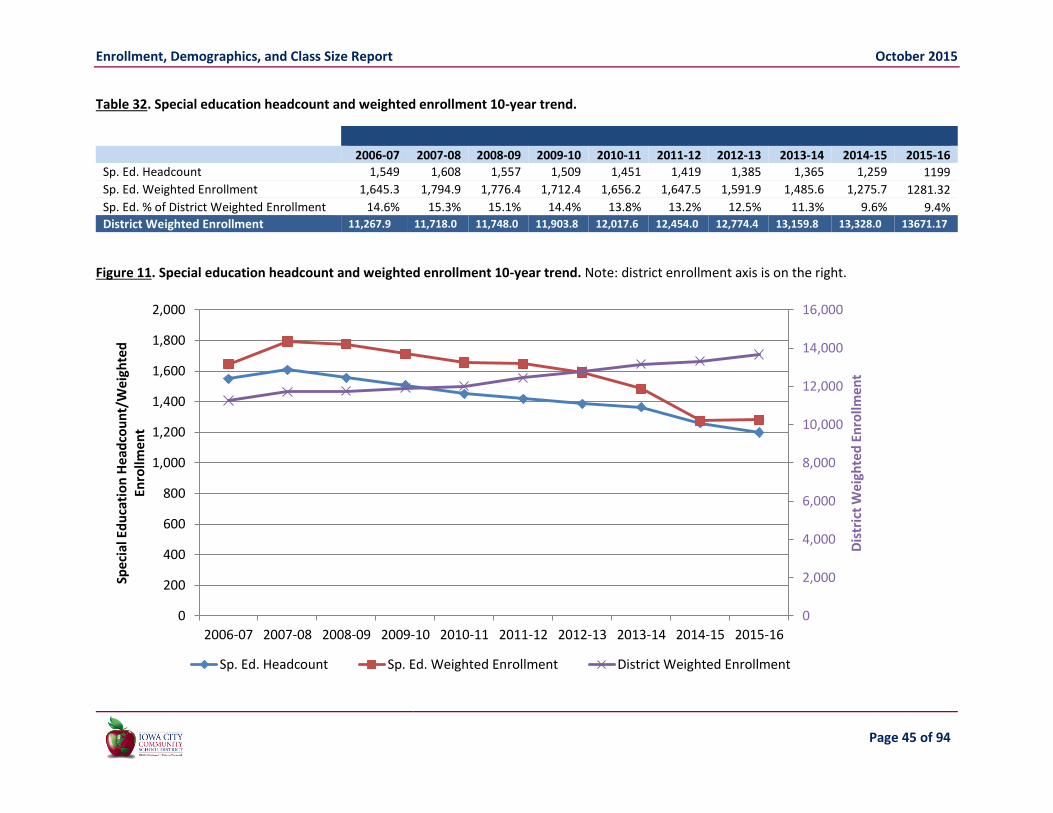
Depending on their needs, some students are provided additional services through the special education program. Tables 30 through 32 and figure 11 present information on special education students, including gender and race/ethnicity breakdowns, over the last 10 years. For purposes of funding, special education students are “weighted” based on a level system (1, 2, or 3). In the tables for special education, both headcounts and weighted enrollments are provided. In comparing special education weighted enrollment to district-wide K-12 weighted enrollment over the last 10 years, the percent of students served by special education services has decreased from a high of 15.3% in 2007-08 to a low of 9.4% this year.
Table 30. Special education headcount and weighted enrollment comparison, 2014-15 to 2015-16.
2014-15 2015-16 % Growth/Reduction
Special Education Headcount 1,259 1199 -4.8%
Special Education Weighted Enrollment 1,275.7 1281.32 4.4%
Special Education % of District Weighted Enrollment 9.6% 9.4% -2.1%
District Weighted Enrollment 13,328.0 13,671.17 1.0%
Table 31. Proportion of special education students versus all students, by race/ethnicity and by gender.
SP. ED. STUDENTS ALL STUDENTS
% of Row Male Female Total Male Female Total
Minority 67.4% 32.6% 100.0% 51.4% 48.6% 100.0%
White 67.6% 32.4% 100.0% 51.4% 48.6% 100.0%
Total 67.4% 32.6% 100.0% 51.1% 48.9% 100.0%
% of Column Male Female Total Male Female Total
Minority 51.4% 51.6% 50.3% 36.2% 36.1% 36.1%
White 48.6% 48.4% 49.7% 63.8% 63.9% 63.9%
Total 100.0% 100.0% 100.0% 100.0% 100.0% 100.0%
Enrollment, Demographics, and Class Size Report October 2015
Page 45 of 94
Table 32. Special education headcount and weighted enrollment 10-year trend.
2006-07 2007-08 2008-09 2009-10 2010-11 2011-12 2012-13 2013-14 2014-15 2015-16
Sp. Ed. Headcount 1,549 1,608 1,557 1,509 1,451 1,419 1,385 1,365 1,259 1199
Sp. Ed. Weighted Enrollment 1,645.3 1,794.9 1,776.4 1,712.4 1,656.2 1,647.5 1,591.9 1,485.6 1,275.7 1281.32
Sp. Ed. % of District Weighted Enrollment 14.6% 15.3% 15.1% 14.4% 13.8% 13.2% 12.5% 11.3% 9.6% 9.4%
District Weighted Enrollment 11,267.9 11,718.0 11,748.0 11,903.8 12,017.6 12,454.0 12,774.4 13,159.8 13,328.0 13671.17
Figure 11. Special education headcount and weighted enrollment 10-year trend. Note: district enrollment axis is on the right.
0
2,000
4,000
6,000
8,000
10,000
12,000
14,000
16,000
0
200
400
600
800
1,000
1,200
1,400
1,600
1,800
2,000
2006-07 2007-08 2008-09 2009-10 2010-11 2011-12 2012-13 2013-14 2014-15 2015-16
Dis
tric
t W
eigh
ted
En
rollm
ent
Spec
ial E
du
cati
on
Hea
dco
un
t/W
eigh
ted
En
rollm
en
t
Sp. Ed. Headcount Sp. Ed. Weighted Enrollment District Weighted Enrollment

Enrollment, Demographics, and Class Size Report October 2015
Page 46 of 94
CLASS SIZE The Board of Education’s Superintendent Directions include a policy on class size. That policy sets aspirational class size goals at no more than 24 students in classes grades K-2, 28 students in classes grades 3-6, 30 students in classes grades 7-8, and 32 students in classes grades 9-12. Since small class sizes can require corresponding large class sizes, these aspirational goals have been operationally defined as “goal posts” of 16-24, 20-28, 22-30, and 24-32, respectively. The related portions of the Superintendent Directions follow. As with the other portions of this report, class size information is based on a 10/1/15 snapshot.
BOARD POLICY
SUPERINTENDENT DIRECTIONS
[Portions of the Superintendent Directions not relevant to this report have been removed for brevity. The full policy is available at http://tinyurl.com/SuptDir]
In the section entitled Ends Policies we state the desired educational outcomes for the District. It is the role of the Superintendent to provide the means to these ends. The Board does not attempt to prescribe the methods or practices of the Superintendent in accomplishing the District goals. We believe that to tell the staff how to accomplish ends would impede creativity and innovation. However, we do believe that certain means may not be justified by the ends. Some means are not appropriate, even if they work! The following Superintendent Directions define those procedures and behaviors that are appropriate. Within these boundaries, the Superintendent is free to take whatever steps seem advisable to reach District goals without further authorization from the Board.
GLOBAL SUPERINTENDENT DIRECTIONS (LEVEL 1):
The Superintendent shall ensure that practices, activities, decisions, and organizational circumstances comply with (a) any applicable or relevant requirements of the U.S. or Iowa Constitutions, laws, court decisions, administrative regulations and requirements;(b) binding contracts; and, (c) commonly accepted standards of professional and business ethics and prudence.
LEARNING ENVIRONMENT (LEVEL 2j):
The Superintendent shall provide a process for continual review and improvement of the district’s learning environment and learning supports that is data‐driven and research based.
The Superintendent shall (LEVEL 3j):
6. Provide pupil teacher ratios that are educationally appropriate and fiscally sustainable. General education class size aspirational goals are no more than:
K-2: 24 3-6: 28 7-8: 30 9-12: 32

Enrollment, Demographics, and Class Size Report October 2015
Page 47 of 94
ELEMENTARY CLASS SIZE
The following tables present class sizes by grade, disaggregated by school. Elementary class sizes ranged from 14 students to 27 students at the K-2 level, and from 14 students to 33 students at the grades 3-6 level. In schools with shared grades, counts are represented in just one of the grades. Special education students who spend less than 50% of the day in general education or have para-educator support when in general education are not represented in the following counts. Tables 33 through 39 and figures 12 and 13 provide elementary class size data.
Questions about Elementary Class Size should be directed to the applicable building principal or Amy Kortemeyer, Assistant Superintendent.
KINDERGARTEN Kindergarten class sizes district-wide averaged 20.1 students, with a range from 15 students at Hills ES to 25 students at Lemme ES. Associated data by building are provided in table 33. Two kindergarten classes were outside the “goal posts” for the following reasons:
Lemme ES: Increasing from 2 sections to 3 sections would create class sizes of 16 and 17. Two paras were added to support both of these classrooms.
Table 33. Kindergarten enrollment, assigned teacher FTE, and class sizes disaggregated by school.
School Enrollment FTE Class Sizes Alexander ES 60 3 20 19 21 Borlaug ES 62 3 20 21 21 Coralville Central ES 67 3 22 23 22
Garner ES 116 6 20 19 19 19 20 19 Hills ES 31 2 15 16 Hoover ES 39 2 20 19 Horn ES 76 4 21 19 19 17 Kirkwood ES 45 2 23 22 Lemme ES 50 2 25 25 Lincoln ES 41 2 20 21 Longfellow ES 44 2 22 22 Lucas ES 60 3 22 18 20 Mann ES 42 2 21 21 Penn ES 79 4 20 21 19 19 Shimek ES 35 2 18 17 Twain ES 54 3 19 18 17 Van Allen ES 81 4 21 20 20 20 Weber ES 66 3 23 21 22 Wickham ES 60 3 21 20 19 Wood ES 55 3 18 19 18
Total 1163 58 Average 20.1

Enrollment, Demographics, and Class Size Report October 2015
Page 48 of 94
FIRST GRADE First grade class sizes district-wide averaged 21 students, with a range from 14 students at Mann ES to 27 students at Longfellow ES. Associated data by building are provided in table 34. Three first grade classes were outside the “goal posts” for the following reasons:
Garner ES: There is one section above the board aspiration benchmark for grades K-2. If we average the sections they are within the board aspiration benchmark.
Longfellow ES: There are two sections above the board aspiration benchmark for grades K-2. While above the aspirational benchmark for grades K-2, the decision was made to keep the grade at two sections. Splitting the class would have resulted in 3 sections of 17.
SECOND GRADE Second grade class sizes district-wide averaged 20.9 students, with a range from 16 students at Alexander ES to 26 students at Garner ES and Lucas ES. Associated data by building are provided in table 35. Six second grade classes were outside the “goal posts” for the following reasons:
Garner ES: While above the board aspiration benchmark for grades K-2, the decision was made to keep the grade at four sections. Splitting the class would have resulted in five sections of 20.
Lucas ES: While above board aspiration benchmark for grades K-2, the decision was made to keep the grade at three sections. Splitting the class would have resulted in four sections of 19.
Table 34. First grade enrollment, assigned teacher FTE, and class sizes disaggregated by school.
School Enrollment FTE Class Sizes
Alexander 59 3 20 20 19 0 0
Borlaug ES 65 3 22 22 21 0 0
Coralville Central ES 59 3 20 19 20 0 0
Garner ES 95 4 24 25 23 23 0
Hills ES 18 1 18 0 0 0 0
Hoover ES 24 1 24 0 0 0 0
Horn ES 81 4 21 21 21 18 0
Kirkwood ES 44 2 22 22 0 0 0
Lemme ES 44 2 21 23 0 0 0
Lincoln ES 38 2 19 19 0 0 0
Longfellow ES 52 2 27 25 0 0 0
Lucas ES 48 2 24 24 0 0 0
Mann ES 29 2 14 15 0 0 0
Penn ES 78 4 19 21 21 17 0
Shimek ES 24 1 24 0 0 0
Twain ES 36 2 18 18 0 0 0
Van Allen ES 85 4 21 21 22 21 0
Weber ES 47 2 24 23 0 0 0
Wickham ES 68 3 22 23 23 0 0
Wood ES 57 3 20 18 19 0 0
Total 1051 50 Average 21.0

Enrollment, Demographics, and Class Size Report October 2015
Page 49 of 94
Table 35. Second grade enrollment, assigned teacher FTE, and class sizes disaggregated by school.
School Enrollment FTE Class Sizes
Alexander ES 51 3 16 17 18
Borlaug ES 68 3 24 22 22
Coralville Central ES 57 3 19 19 19
Garner ES 101 4 24 26 25 26
Hills ES 36 2 18 18
Hoover ES 35 2 18 17
Horn ES 67 3 22 23 22
Kirkwood ES 59 3 20 18 21
Lemme ES 56 3 18 19 19
Lincoln ES 36 2 18 18
Longfellow ES 44 2 23 21
Lucas ES 76 3 25 26 25
Mann ES 37 2 18 19
Penn ES 79 4 19 21 20 19
Shimek ES 36 2 18 18
Twain ES 44 2 22 22
Van Allen ES 68 3 21 24 23
Weber ES 68 3 22 23 23
Wickham ES 66 3 21 22 23
Wood ES 46 2 22 24
Total 1130 54
Average 20.9
Table 36. Third grade enrollment, assigned teacher FTE, and class sizes disaggregated by school.
School Enrollment FTE Class Sizes
Alexander ES 54 2 28 26
Borlaug ES 67 3 23 21 23
Coralville Central ES 61 3 20 21 20
Garner ES 88 3 30 29 29
Hills ES 0 0
Hoover ES 43 2 22 21
Horn ES 67 3 22 23 22
Kirkwood ES 35 2 17 18
Lemme ES 69 3 24 22 23
Lincoln ES 57 2 29 28
Longfellow ES 49 2 23 26
Lucas ES 62 2 31 31
Mann ES 0 0
Penn ES 69 3 22 24 23
Shimek ES 21 1 21
Twain ES 31 2 16 15
Van Allen ES 78 3 26 26 26
Weber ES 64 3 20 22 22
Wickham ES 73 3 24 25 24
Wood ES 43 2 21 22
Total 1031 44
Average 23.4

Enrollment, Demographics, and Class Size Report October 2015
Page 50 of 94
THIRD GRADE Third grade class sizes district-wide averaged 23.4 students, with a range from 15 students at Twain ES to 31 students at Lucas ES. Associated data by building are provided in table 36. Six third grade classes were outside the “goal posts” for the following reasons:
Garner ES: While above the board aspiration benchmark for grades 3-6, the decision was made to keep the grade at three sections. Splitting the class would have resulted in four sections of 22.
Lincoln ES: While above the board aspiration benchmark for grades 3-6, the decision was made to keep the grade at two sections. Splitting the class would have resulted in three sections of 19.
Lucas ES: Since this time the decision was made to add a half time teacher.
FOURTH GRADE Fourth grade class sizes district-wide averaged 23.8 students, with a range from 16 students at Twain ES to 31 students at Coralville Central ES. Associated data by building are provided in table 37. Four fourth grade classes were outside the “goal posts” for the following reasons:
Borlaug ES: While above the board aspiration benchmark for grades 3-6. The decision was made to keep the grade at two sections. Splitting the class would have resulted in three sections of 20.
Coralville Central ES: 4th and 5th grades were above the board aspiration benchmark for grades 3-6, since this time the decision was made to add one teacher to support both grades.
Table 37. Fourth grade enrollment, assigned teacher FTE, and class sizes disaggregated by school.
School Enrollment FTE Class Sizes
Alexander ES 48 2 24 24 Borlaug ES 60 2 30 30 Coralville Central ES 61 2 30 31 Garner ES 78 3 26 25 27 Hills ES 64 3 22 20 22 Hoover ES 38 2 18 20 Horn ES 69 3 22 23 24 Kirkwood ES 44 2 22 22 Lemme ES 51 2 25 26 Lincoln ES 0 Longfellow ES 47 2 22 25 Lucas ES 70 3 22 25 23 Mann ES 56 2 28 28 Penn ES 80 3 27 26 27 Shimek ES 40 2 20 20 Twain ES 33 2 16 17 Van Allen ES 80 3 27 26 27 Weber ES 48 2 23 25 Wickham ES 69 3 22 24 23 Wood ES 48 2 25 23 Total 1084 45.5
Average 23.8
Enrollment, Demographics, and Class Size Report October 2015
Page 51 of 94
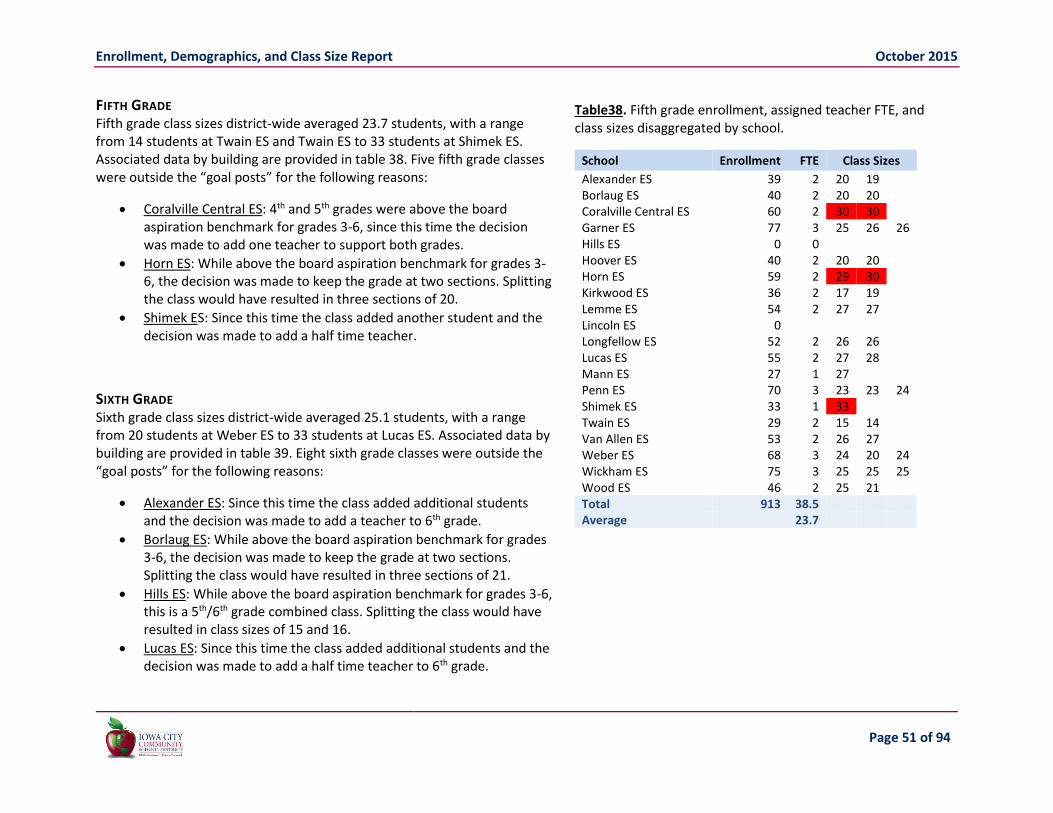
FIFTH GRADE Fifth grade class sizes district-wide averaged 23.7 students, with a range from 14 students at Twain ES and Twain ES to 33 students at Shimek ES. Associated data by building are provided in table 38. Five fifth grade classes were outside the “goal posts” for the following reasons:
Coralville Central ES: 4th and 5th grades were above the board aspiration benchmark for grades 3-6, since this time the decision was made to add one teacher to support both grades.
Horn ES: While above the board aspiration benchmark for grades 3-6, the decision was made to keep the grade at two sections. Splitting the class would have resulted in three sections of 20.
Shimek ES: Since this time the class added another student and the decision was made to add a half time teacher.
SIXTH GRADE Sixth grade class sizes district-wide averaged 25.1 students, with a range from 20 students at Weber ES to 33 students at Lucas ES. Associated data by building are provided in table 39. Eight sixth grade classes were outside the “goal posts” for the following reasons:
Alexander ES: Since this time the class added additional students and the decision was made to add a teacher to 6th grade.
Borlaug ES: While above the board aspiration benchmark for grades 3-6, the decision was made to keep the grade at two sections. Splitting the class would have resulted in three sections of 21.
Hills ES: While above the board aspiration benchmark for grades 3-6, this is a 5th/6th grade combined class. Splitting the class would have resulted in class sizes of 15 and 16.
Lucas ES: Since this time the class added additional students and the decision was made to add a half time teacher to 6th grade.
Table38. Fifth grade enrollment, assigned teacher FTE, and class sizes disaggregated by school.
School Enrollment FTE Class Sizes
Alexander ES 39 2 20 19 Borlaug ES 40 2 20 20 Coralville Central ES 60 2 30 30 Garner ES 77 3 25 26 26 Hills ES 0 0 Hoover ES 40 2 20 20 Horn ES 59 2 29 30 Kirkwood ES 36 2 17 19 Lemme ES 54 2 27 27 Lincoln ES 0 Longfellow ES 52 2 26 26 Lucas ES 55 2 27 28 Mann ES 27 1 27 Penn ES 70 3 23 23 24 Shimek ES 33 1 33 Twain ES 29 2 15 14 Van Allen ES 53 2 26 27 Weber ES 68 3 24 20 24 Wickham ES 75 3 25 25 25 Wood ES 46 2 25 21 Total 913 38.5 Average 23.7

Enrollment, Demographics, and Class Size Report October 2015
Page 52 of 94
Mann ES: While above the board aspiration benchmark for grades 3-6, the decision was made to keep the grades at one section. Splitting the class would have resulted in class sizes of 15 and 16.
Twain ES: While above the board aspiration benchmark for grades 3-6, the decision was made to keep the grade at one section. Splitting the class would have resulted in class sizes of 14 and 15.
Table 39. Sixth grade enrollment, assigned teacher FTE, and class sizes disaggregated by school.
School Enrollment FTE Class Sizes Alexander ES 30 1 30 Borlaug ES 62 2 31 31 Coralville Central ES 53 2 27 26 Garner ES 52 2 26 26 Hills ES 31 1 31 Hoover ES 46 2 23 23 Horn ES 78 3 26 26 26 Kirkwood ES 51 2 25 26 Lemme ES 67 3 23 22 22 Lincoln ES 67 3 21 24 22 Longfellow ES 47 2 24 23 Lucas ES 65 2 33 32 Mann ES 31 1 31 Penn ES 76 3 25 26 25 Shimek ES 23 1 23 Twain ES 29 1 29 Van Allen ES 79 3 26 27 26 Weber ES 62 3 21 21 20 Wickham ES 82 3 27 28 27 Wood ES 49 2 25 24 Total 1080 43 Average 25.1

Enrollment, Demographics, and Class Size Report October 2015
Page 53 of 94
Figure 12. Grades K-2 class size frequency count.
1 2 2
6
21
27
19
26
22
15
10
7
31
14 15 16 17 18 19 20 21 22 23 24 25 26 27
2015-16 Class Size Frequency CountsGrades K-2
Nu
mb
er o
f C
lass
roo
ms
Classroom Size
Enrollment, Demographics, and Class Size Report October 2015
Page 54 of 94
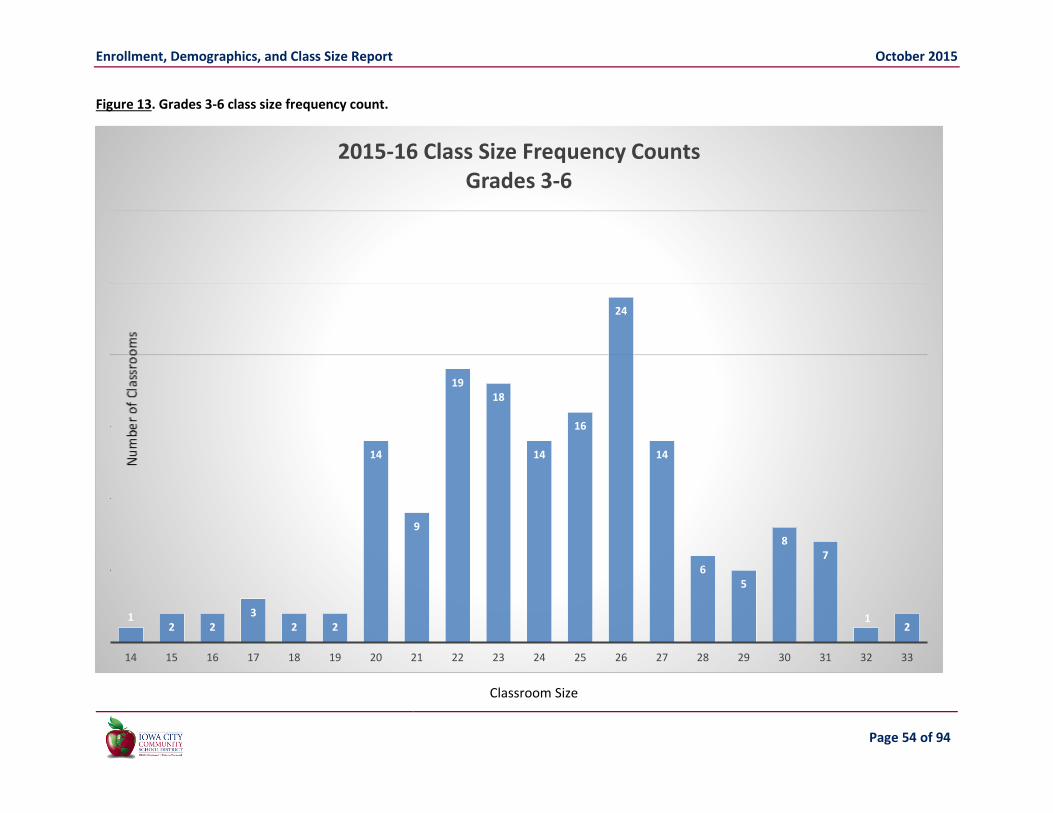
Figure 13. Grades 3-6 class size frequency count.
12 2
32 2
14
9
1918
14
16
24
14
65
87
12
14 15 16 17 18 19 20 21 22 23 24 25 26 27 28 29 30 31 32 33
2015-16 Class Size Frequency CountsGrades 3-6
Classroom Size

Enrollment, Demographics, and Class Size Report October 2015
Page 55 of 94
SECONDARY CLASS SIZE
The following tables and figures present information on class sizes for each junior high and high school. “Goal posts” for class size are 22-30 for junior high and 24-32 for high school. These are represented by gray-shaded areas in each figure. Reasons for the classes being above the “aspirational” size are provided below. Questions about any information provided for a particular school should be directed to the applicable principal. Potential Reasons for classes over aspirational size:
Single section course thus enrollment above goalpost. Section sizes vary due to scheduling.
Late enrollments caused higher than desired class sizes. Average size for performance music class or physical education class.
CITY HS At City HS, class sizes range from 6 students to 130 students with an average of 29 students per class.
Table 39. City HS class size statistics by department.
Department Largest class
size Smallest Class
Size Total
Students Number of
Sections Average Students per
Section
Art 28 23 238 9 26
Business 38 15 182 6 30
ELL 16 9 170 11 15
English 36 9 1,673 64 26
Family & Consumer Science 25 17 102 5 20
Health 34 20 105 4 26
Industrial Tech 0 0 0 0 0
Math 35 11 1,576 55 29
Music 130 6 581 10 58
PE 37 21 311 10 31
PLTW 30 27 142 5 28
Science 33 16 1,531 53 29

Enrollment, Demographics, and Class Size Report October 2015
Page 56 of 94
Social Studies 36 18 1,509 50 30
World Languages 38 13 1,085 37 29
Grand Total 130 6 9,205 319 29
Table 40. City HS World Language Department class size statistics by sub-department.
Sub-Department Largest class
size Smallest Class
Size Total
Students Number of
Sections Average Students per
Section
French 38 13 193 7 28
German 28 26 54 2 27
Spanish 36 20 838 28 30
Grand Total 36 13 1085 37 29
Table 41. City HS Music Department class size statistics by sub-department.
Sub-Department Largest class
size Smallest Class
Size Total
Students Number of
Sections Average Students per
Section
Band 130 67 197 2 99
Choir 66 26 238 5 48
Orchestra 71 69 140 2 70
Grand Total 130 26 575 9 64
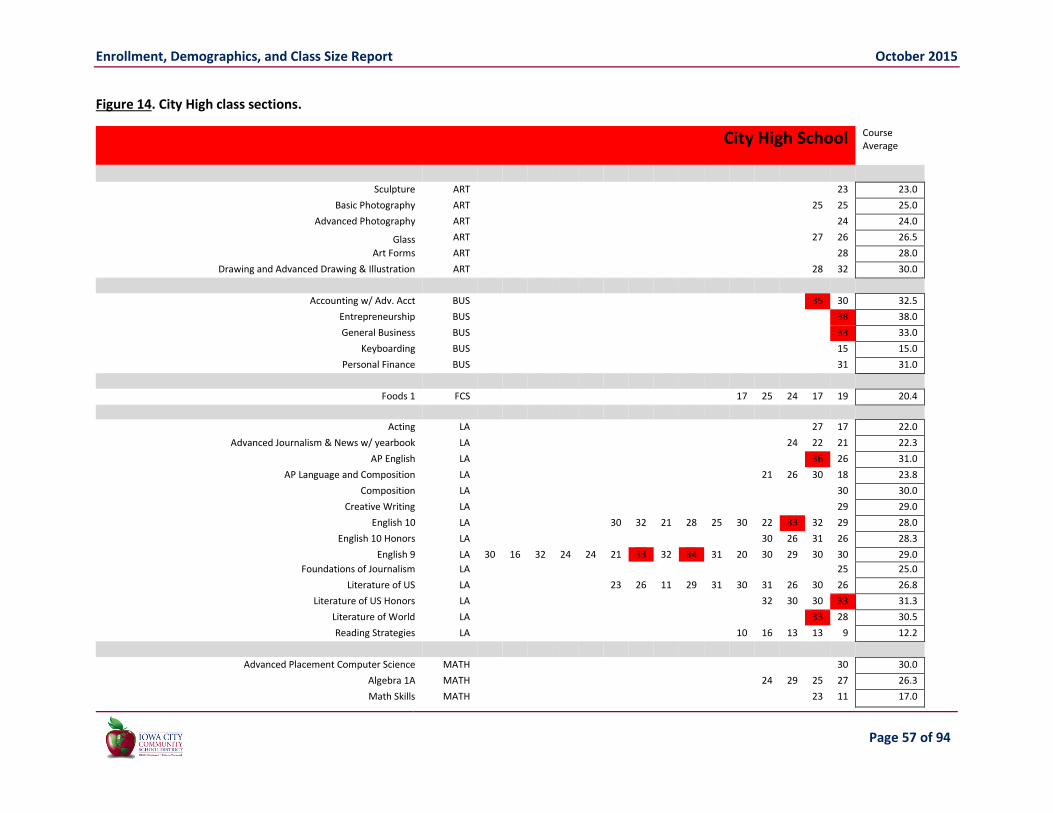
Enrollment, Demographics, and Class Size Report October 2015
Page 57 of 94
Figure 14. City High class sections.
City High School Course Average
Sculpture ART 23 23.0
Basic Photography ART 25 25 25.0
Advanced Photography ART 24 24.0
Glass ART 27 26 26.5
Art Forms ART 28 28.0
Drawing and Advanced Drawing & Illustration ART 28 32 30.0
Accounting w/ Adv. Acct BUS 35 30 32.5
Entrepreneurship BUS 38 38.0
General Business BUS 33 33.0
Keyboarding BUS 15 15.0
Personal Finance BUS 31 31.0
Foods 1 FCS 17 25 24 17 19 20.4
Acting LA 27 17 22.0
Advanced Journalism & News w/ yearbook LA 24 22 21 22.3
AP English LA 36 26 31.0
AP Language and Composition LA 21 26 30 18 23.8
Composition LA 30 30.0
Creative Writing LA 29 29.0
English 10 LA 30 32 21 28 25 30 22 33 32 29 28.0
English 10 Honors LA 30 26 31 26 28.3
English 9 LA 30 16 32 24 24 21 33 32 34 31 20 30 29 30 30 29.0
Foundations of Journalism LA 25 25.0
Literature of US LA 23 26 11 29 31 30 31 26 30 26 26.8
Literature of US Honors LA 32 30 30 33 31.3
Literature of World LA 33 28 30.5
Reading Strategies LA 10 16 13 13 9 12.2
Advanced Placement Computer Science MATH 30 30.0
Algebra 1A MATH 24 29 25 27 26.3
Math Skills MATH 23 11 17.0
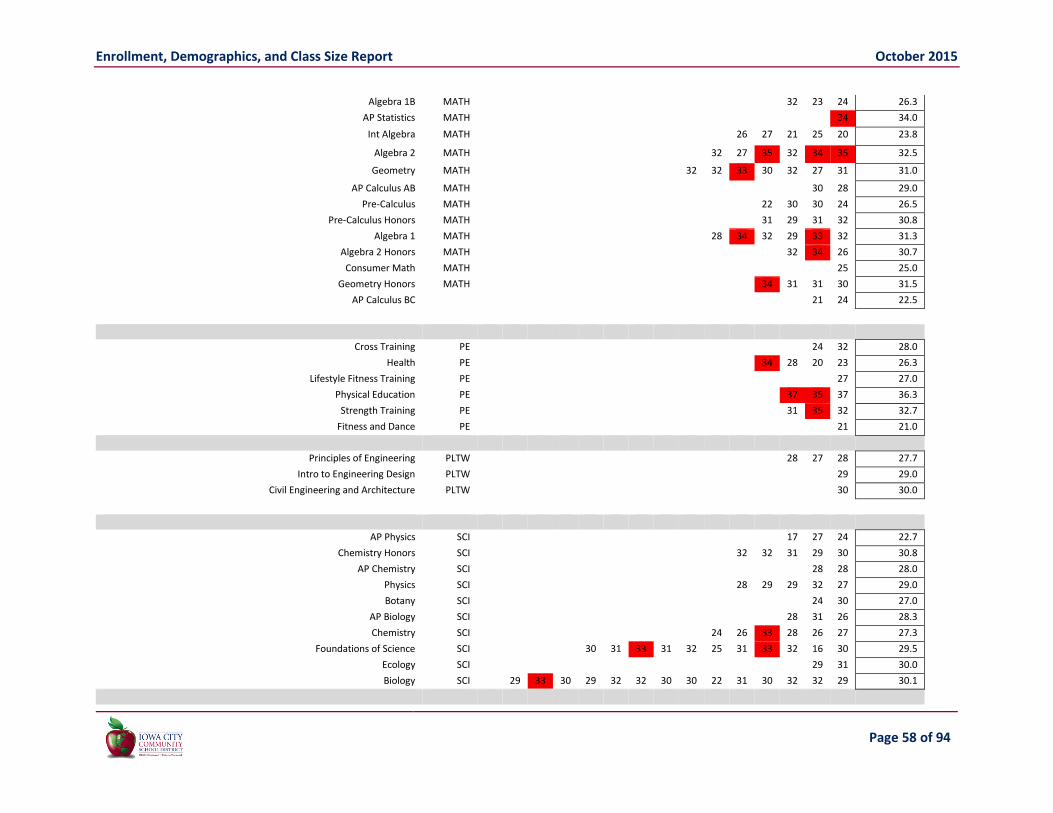
Enrollment, Demographics, and Class Size Report October 2015
Page 58 of 94
Algebra 1B MATH 32 23 24 26.3
AP Statistics MATH 34 34.0
Int Algebra MATH 26 27 21 25 20 23.8
Algebra 2 MATH 32 27 35 32 34 35 32.5
Geometry MATH 32 32 33 30 32 27 31 31.0
AP Calculus AB MATH 30 28 29.0
Pre-Calculus MATH 22 30 30 24 26.5
Pre-Calculus Honors MATH 31 29 31 32 30.8
Algebra 1 MATH 28 34 32 29 33 32 31.3
Algebra 2 Honors MATH 32 34 26 30.7
Consumer Math MATH 25 25.0
Geometry Honors MATH 34 31 31 30 31.5
AP Calculus BC 21 24 22.5
Cross Training PE 24 32 28.0
Health PE 34 28 20 23 26.3
Lifestyle Fitness Training PE 27 27.0
Physical Education PE 37 35 37 36.3
Strength Training PE 31 35 32 32.7
Fitness and Dance PE 21 21.0
Principles of Engineering PLTW 28 27 28 27.7
Intro to Engineering Design PLTW 29 29.0
Civil Engineering and Architecture PLTW 30 30.0
AP Physics SCI 17 27 24 22.7
Chemistry Honors SCI 32 32 31 29 30 30.8
AP Chemistry SCI 28 28 28.0
Physics SCI 28 29 29 32 27 29.0
Botany SCI 24 30 27.0
AP Biology SCI 28 31 26 28.3
Chemistry SCI 24 26 33 28 26 27 27.3
Foundations of Science SCI 30 31 33 31 32 25 31 33 32 16 30 29.5
Ecology SCI 29 31 30.0
Biology SCI 29 33 30 29 32 32 30 30 22 31 30 32 32 29 30.1
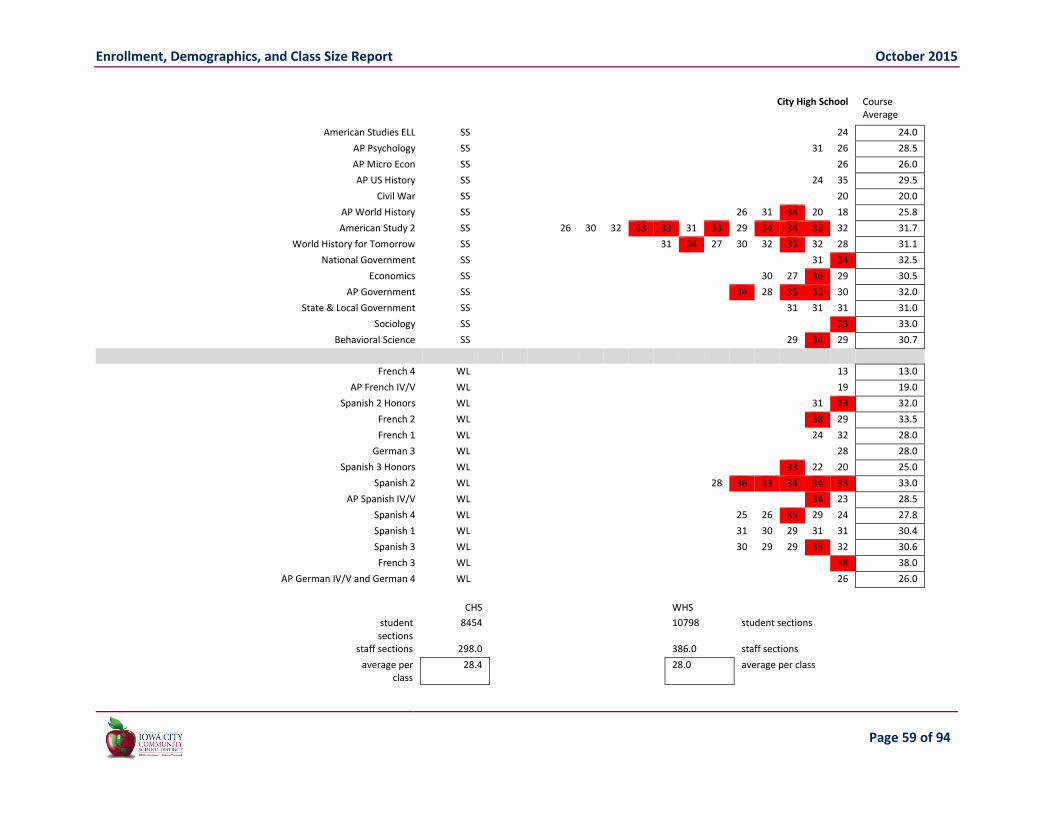
Enrollment, Demographics, and Class Size Report October 2015
Page 59 of 94
City High School Course Average
American Studies ELL SS 24 24.0
AP Psychology SS 31 26 28.5
AP Micro Econ SS 26 26.0
AP US History SS 24 35 29.5
Civil War SS 20 20.0
AP World History SS 26 31 34 20 18 25.8
American Study 2 SS 26 30 32 33 33 31 33 29 34 34 33 32 31.7
World History for Tomorrow SS 31 34 27 30 32 35 32 28 31.1
National Government SS 31 34 32.5
Economics SS 30 27 36 29 30.5
AP Government SS 34 28 35 33 30 32.0
State & Local Government SS 31 31 31 31.0
Sociology SS 33 33.0
Behavioral Science SS 29 34 29 30.7
French 4 WL 13 13.0
AP French IV/V WL 19 19.0
Spanish 2 Honors WL 31 33 32.0
French 2 WL 38 29 33.5
French 1 WL 24 32 28.0
German 3 WL 28 28.0
Spanish 3 Honors WL 33 22 20 25.0
Spanish 2 WL 28 36 33 34 34 33 33.0
AP Spanish IV/V WL 34 23 28.5
Spanish 4 WL 25 26 35 29 24 27.8
Spanish 1 WL 31 30 29 31 31 30.4
Spanish 3 WL 30 29 29 33 32 30.6
French 3 WL 38 38.0
AP German IV/V and German 4 WL 26 26.0
CHS WHS
student sections
8454 10798 student sections
staff sections 298.0 386.0 staff sections
average per class
28.4 28.0 average per class

Enrollment, Demographics, and Class Size Report October 2015
Page 60 of 94
Figure 15. City HS class sizes.
1 1 2 0 3 0 0 3 2 2 1
67
56
16
9
19
13
18
24
34
29
33
21
17
8
3 2 2
9 10 11 12 13 14 15 16 17 18 19 20 21 22 23 24 25 26 27 28 29 30 31 32 33 34 35 36 37 38
2015-16 Class Size Frequency CountsCity High School
Nu
mb
er o
f Se
ctio
ns
Classroom Size

Enrollment, Demographics, and Class Size Report October 2015
Page 61 of 94
TATE HS At Tate HS, class sizes range from 2 student to 21 students with an average of 12 students per class. There were 40 students enrolled in the Phoenix program the first trimester. As these counts represent first trimester counts, one should note that Tate HS typically adds several dozen students second trimester and several dozen more third trimester.
Table 42. Tate HS class size statistics by department.
Department Largest class
size Smallest Class
Size Total
Students Number of
Sections Average Students per
Section
Art 12 6 32 4 8
Business 8 7 15 2 8
English 20 7 186 14 13
Family & Consumer Science 11 2 24 3 8
Math 17 5 109 11 10
PE 5 5 5 1 5
Personal Development 14 14 14 1 14
Science 21 17 111 6 19
Social Studies 17 4 128 10 13
Grand Total 21 2 624 52 12

Enrollment, Demographics, and Class Size Report October 2015
Page 62 of 94
Figure 16. Tate HS class sizes.
1
0
1
2
3 3 3
2
4
7
3 3
4
2
3 3
5
1 1 1
2 3 4 5 6 7 8 9 10 11 12 13 14 15 16 17 18 19 20 21
2015-16 Class Size Frequency CountsTate High School
Classroom Size
Nu
mb
er o
f Se
ctio
ns
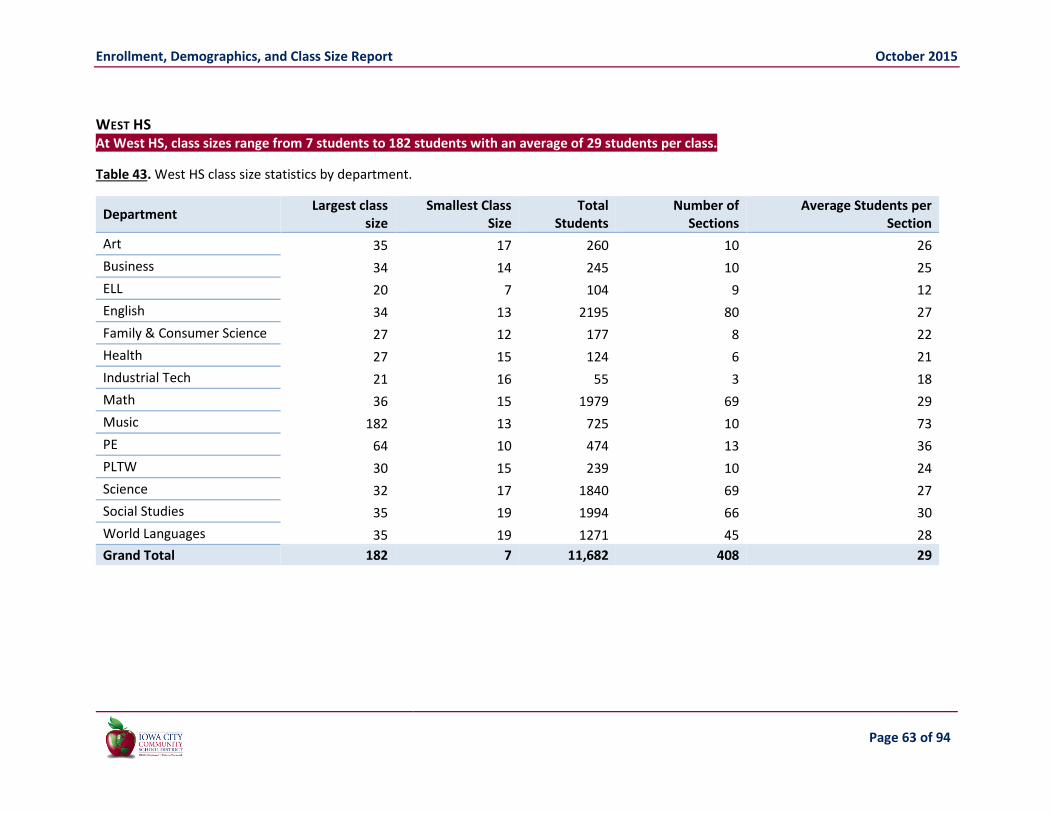
Enrollment, Demographics, and Class Size Report October 2015
Page 63 of 94
WEST HS At West HS, class sizes range from 7 students to 182 students with an average of 29 students per class.
Table 43. West HS class size statistics by department.
Department Largest class
size Smallest Class
Size Total
Students Number of
Sections Average Students per
Section
Art 35 17 260 10 26
Business 34 14 245 10 25
ELL 20 7 104 9 12
English 34 13 2195 80 27
Family & Consumer Science 27 12 177 8 22
Health 27 15 124 6 21
Industrial Tech 21 16 55 3 18
Math 36 15 1979 69 29
Music 182 13 725 10 73
PE 64 10 474 13 36
PLTW 30 15 239 10 24
Science 32 17 1840 69 27
Social Studies 35 19 1994 66 30
World Languages 35 19 1271 45 28
Grand Total 182 7 11,682 408 29

Enrollment, Demographics, and Class Size Report October 2015
Page 64 of 94
Table 44. West HS World Language Department class size statistics by sub-department.
Sub-Department Largest class
size Smallest Class
Size Total
Students Number of
Sections Average Students per
Section
French 33 19 211 8 26
German 25 25 25 1 25
Spanish 35 19 1035 36 29
Grand Total 35 19 1,271 45 28
Table 45. West HS Music Department class size statistics by sub-department.
Sub-Department Largest class
size Smallest Class
Size Total
Students Number of
Sections Average Students per
Section
Band 182 88 270 2 135
Choir 79 46 320 5 64
Orchestra 84 38 122 2 61
Grand Total 182 38 712 9 79

Enrollment, Demographics, and Class Size Report October 2015
Page 65 of 94
Figure 17. West High class sections
Course Average
West High School
28.0 28 ART AP Studio Art
19.0 18 20 ART Metal/Jewelry
25.5 22 29 ART Ceramics 1
17.0 17 ART Video Prod 1
34.0 34 35 33 ART B & W Draw
24.0 24 ART Sculpture
16.0 16 BUS Comp Bus Applications
20.7 19 25 18 BUS Futures
31.0 31 BUS Entrepreneurship
14.0 14 BUS Gen Bus
29.0 29 BUS Personal Fin
34.0 34 BUS Accounting
33.0 33 BUS Prof Pathways
26.0 26 BUS Web Design
19.0 19 FCS Creative Fab 1
17.0 22 12 FCS Child Dvlp 1
22.5 25 20 FCS Int Design 1
26.3 27 26 26 FCS Foods 1
9.0 9 LA Read- Strat-ELD
28.0 28 LA Am Lit 1 H
28.7 28 27 31 16 LA Int Journalism (N)
13.0 13 LA Journalism (Y)
27.3 28 24 30 LA AP English
24.0 24 LA Creative Writing
29.8 29 30 31 29 LA Am Lit 1
31.0 34 28 LA Journalism (N)
27.2 29 28 30 28 23 29 27 27 26 26 23 28 30 LA English 10
26.6 26 27 24 27 24 28 28 28 28 29 28 31 26 25 24 26 29 26 21 LA English 9

Enrollment, Demographics, and Class Size Report October 2015
Page 66 of 94
30.0 30 32 28 LA Brit Lit 1 H
13.0 13 LA Journalism (Y)
31.1 29 34 33 28 30 33 31 LA Am Hum
28.0 27 29 LA Essay Writ
29.0 30 28 LA World Literature
26.0 26 26 LA Public Speaking
32.0 32 LA Short Story
28.0 27 30 26 28 29 LA English 10 H
33.0 33 LA Cont Lit
27.0 27 LA Bib Lit
34.0 34 LA Intro Theatre
31.3 33 31 30 LA English Gram/Use
21.0 22 19 22 LA Reading Strategies
19.5 19 20 MA Math Skills
21.0 21 MA Inf Geometry
20.5 20 25 19 18 MA Algebra IA
32.0 31 33 MA AP Calculus BC
33.5 31 34 34 35 MA Geometry H
25.3 27 27 22 MA Pre-Calculus H
21.0 21 20 21 22 21 MA Int Algebra
17.7 15 18 20 MA Algebra IB
31.5 30 33 MA AP Comp Science
33.5 31 36 34 33 MA Algebra II H
17.0 16 18 MA Advanced Topics in Math
29.6 29 31 32 31 29 27 31 29 27 MA Geometry
30.4 34 30 27 28 32 32 33 34 24 MA Algebra II
32.5 33 33 34 32 32 33 32 31 MA Algebra I
34.0 34 32 36 32 35 35 MA Pre-Calculus
34.3 35 35 33 MA AP Calculus AB
35.0 35 MA AP Statistics
32.0 32 MA Visual Basics NET
20.7 15 27 23 19 18 22 PE Health
36.0 36 39 47 22 PE Performance PE 2
25.0 25 PE Ultimate Fitness
38.5 21 37 49 38 51 35 PE Physical Education
64.0 64 PE Performance PE I
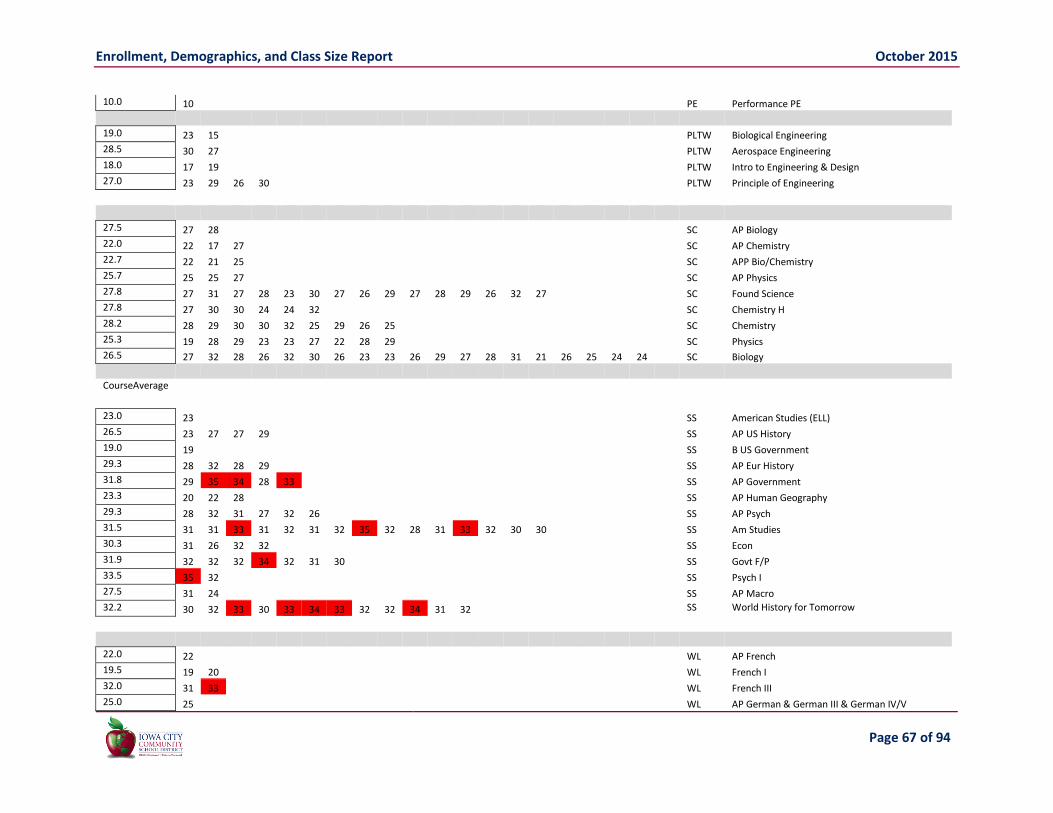
Enrollment, Demographics, and Class Size Report October 2015
Page 67 of 94
10.0 10 PE Performance PE
19.0 23 15 PLTW Biological Engineering
28.5 30 27 PLTW Aerospace Engineering
18.0 17 19 PLTW Intro to Engineering & Design
27.0 23 29 26 30 PLTW Principle of Engineering
27.5 27 28 SC AP Biology
22.0 22 17 27 SC AP Chemistry
22.7 22 21 25 SC APP Bio/Chemistry
25.7 25 25 27 SC AP Physics
27.8 27 31 27 28 23 30 27 26 29 27 28 29 26 32 27 SC Found Science
27.8 27 30 30 24 24 32 SC Chemistry H
28.2 28 29 30 30 32 25 29 26 25 SC Chemistry
25.3 19 28 29 23 23 27 22 28 29 SC Physics
26.5 27 32 28 26 32 30 26 23 23 26 29 27 28 31 21 26 25 24 24 SC Biology
CourseAverage
23.0 23 SS American Studies (ELL)
26.5 23 27 27 29 SS AP US History
19.0 19 SS B US Government
29.3 28 32 28 29 SS AP Eur History
31.8 29 35 34 28 33 SS AP Government
23.3 20 22 28 SS AP Human Geography
29.3 28 32 31 27 32 26 SS AP Psych
31.5 31 31 33 31 32 31 32 35 32 28 31 33 32 30 30 SS Am Studies
30.3 31 26 32 32 SS Econ
31.9 32 32 32 34 32 31 30 SS Govt F/P
33.5 35 32 SS Psych I
27.5 31 24 SS AP Macro
32.2 30 32 33 30 33 34 33 32 32 34 31 32 SS World History for Tomorrow
22.0 22 WL AP French
19.5 19 20 WL French I
32.0 31 33 WL French III
25.0 25 WL AP German & German III & German IV/V

Enrollment, Demographics, and Class Size Report October 2015
Page 68 of 94
26.0 25 31 22 WL AP Spanish and AP Spanish V
25.0 25 WL French IV
24.7 19 31 24 WL Spanish III H
29.3 29 30 30 26 32 31 24 32 WL Spanish II
28.8 31 29 29 31 27 26 WL Spanish III
29.3 25 30 30 32 WL Spanish II H
30.5 33 28 WL French II
31.8 30 30 33 33 33 WL Spanish I
28.6 31 30 21 24 31 35 28 WL Spanish IV
CHS WHS
student sections
8454 10798 student sections
staff sections 298.0 386.0 staff sections
average per class
28.4 28.0 average per class

Enrollment, Demographics, and Class Size Report October 2015
Page 69 of 94
Figure 18. West HS class sizes.
1 1 0 1 1 1 3 3 3
6
11
89
14
12
15 15
24
32
34
28
31
33
37
25
16
12
3 1 1 1 0 0 0 0 0 0 0 1 0 1 0 2
9 10 11 12 13 14 15 16 17 18 19 20 21 22 23 24 25 26 27 28 29 30 31 32 33 34 35 36 37 38 39 40 41 42 43 44 45 46 47 48 49 50 51+
2015-16 Class Size Frequency CountsWest High School
Classroom Size
Nu
mb
er o
f Se
ctio
ns

Enrollment, Demographics, and Class Size Report October 2015
Page 70 of 94
NORTH CENTRAL JH At North Central JH, class sizes range from 10 student to 78 students with an average of 31 students per class.
Table 46. North Central JH class size statistics by department.
Department Largest class
size Smallest Class
Size Total
Students Number of
Sections Average Students per
Section
Art 33 23 115 4 29
English 34 22 737 24 31
Family & Consumer Science 31 24 113 4 28
Industrial Tech 33 17 138 5 28
Computer Essentials 26 25 51 2 26
Math 34 10 490 18 27
Music 78 17 360 8 45
PE 42 23 498 14 36
Personal Development 33 25 147 5 29
Science 34 28 497 16 31
Social Studies 34 25 497 16 31
World Languages 33 30 190 6 32
Grand Total 78 10 3,833 122 31
Table 54. North Central JH World Language Department class size statistics by sub-department.
Sub-Department Largest class
size Smallest Class
Size Total
Students Number of
Sections Average Students per
Section
French 33 33 33 1 33
Spanish 33 30 157 5 31
Grand Total 33 30 190 6 32

Enrollment, Demographics, and Class Size Report October 2015
Page 71 of 94
Table 47. North Central JH Music Department class size statistics by sub-department.
Sub-Department Largest class
size Smallest Class
Size Total
Students Number of
Sections Average Students per
Section
Band 78 47 125 2 63
Choir 77 49 190 3 63
Orchestra 28 17 45 2 23
Grand Total 78 17 360 7 51

Enrollment, Demographics, and Class Size Report October 2015
Page 72 of 94
Figure 19. North Central JH class sizes.
1 0 0 0 1 0 0
2
0 0 0 0 1
2 2
9
1 1
8
11
13
16
15
14
8
0 1
2
4
1
2
0 1 0 0 0 0 1 0 1
3
10 11 12 13 14 15 16 17 18 19 20 21 22 23 24 25 26 27 28 29 30 31 32 33 34 35 36 37 38 39 40 41 42 43 44 45 46 47 48 49 50+
2015-16 Class Size Frequency CountsNorth Central Jr High
Nu
mb
er o
f C
lass
roo
ms
Size of Classroom

Enrollment, Demographics, and Class Size Report October 2015
Page 73 of 94
NORTHWEST JH At Northwest JH, class sizes range from 16 students to 106 students with an average of 30 students per class.
Table 48. Northwest JH class size statistics by department.
Department Largest class
size Smallest Class
Size Total
Students Number of
Sections Average Students per
Section
Art 29 24 135 5 27
English 31 17 895 32 28
Family & Consumer Science 28 24 132 5 26
Industrial Tech 29 21 150 6 25
Computer Essentials 22 16 74 4 19
Math 34 18 592 21 28
Music 106 18 541 9 60
PE 40 21 605 19 32
Personal Development 31 25 201 7 29
Science 31 28 601 20 30
Social Studies 31 26 575 20 29
World Languages 29 19 208 8 26
Grand Total 106 16 4,709 156 30
Table 49. Northwest JH World Language Department class size statistics by sub-department.
Sub-Department Largest class
size Smallest Class
Size Total
Students Number of
Sections Average Students per
Section
French 26 19 45 2 23
Spanish 29 24 163 6 27
Grand Total 29 19 208 8 26

Enrollment, Demographics, and Class Size Report October 2015
Page 74 of 94
Table 50. Northwest JH Music Department class size statistics by sub-department.
Sub-Department Largest class
size Smallest Class
Size Total
Students Number of
Sections Average Students per
Section
Band 100 64 164 2 82
Choir 106 70 249 3 83
Orchestra 48 34 82 2 41
Grand Total 106 34 495 7 71

Enrollment, Demographics, and Class Size Report October 2015
Page 75 of 94
Figure 20. Northwest JH class sizes.
1 1 0 0 0 0 13 3
4
1 23
2
76
1110
14
23
25
21
1
4
2 03
0
4
0 1 0 0 0 0 0 0 0 1 0
5
10 11 12 13 14 15 16 17 18 19 20 21 22 23 24 25 26 27 28 29 30 31 32 33 34 35 36 37 38 39 40 41 42 43 44 45 46 47 48 49 50+
2015-16 Class Size Frequency CountsNorthwest Jr High
Classroom Size
Nu
mb
er o
f C
lass
roo
ms

Enrollment, Demographics, and Class Size Report October 2015
Page 76 of 94
SOUTH EAST JH At South East JH, class sizes range from 17 students to 122 students with an average of 30 students per class.
Table 51. South East JH class size statistics by department.
Department Largest class
size Smallest Class
Size Total
Students Number of
Sections Average Students per
Section
Art 31 27 178 6 30
English 30 18 1085 39 28
Family & Consumer Science 28 22 187 7 27
Industrial Tech 30 18 186 7 27
Computer Essentials 25 20 89 4 22
Math 32 17 754 29 26
Music 122 17 591 9 66
PE 41 26 780 22 35
Personal Development 30 23 248 9 28
Science 28 23 754 28 27
Social Studies 30 20 760 27 28
World Languages 32 26 265 9 29
Grand Total 122 17 5,877 196 30
Table 52. South East JH World Language Department class size statistics by sub-department.
Sub-Department Largest class
size Smallest Class
Size Total
Students Number of
Sections Average Students per
Section
French 28 26 54 2 27
Spanish 32 26 211 7 30
Grand Total 32 26 265 9 29

Enrollment, Demographics, and Class Size Report October 2015
Page 77 of 94
Table 53. South East JH Music Department class size statistics by sub-department.
Sub-Department Largest class
size Smallest Class
Size Total
Students Number of
Sections Average Students per
Section
Band 122 94 216 2 108
Choir 111 67 249 3 83
Orchestra 45 38 83 2 42
Grand Total 122 38 548 7 78
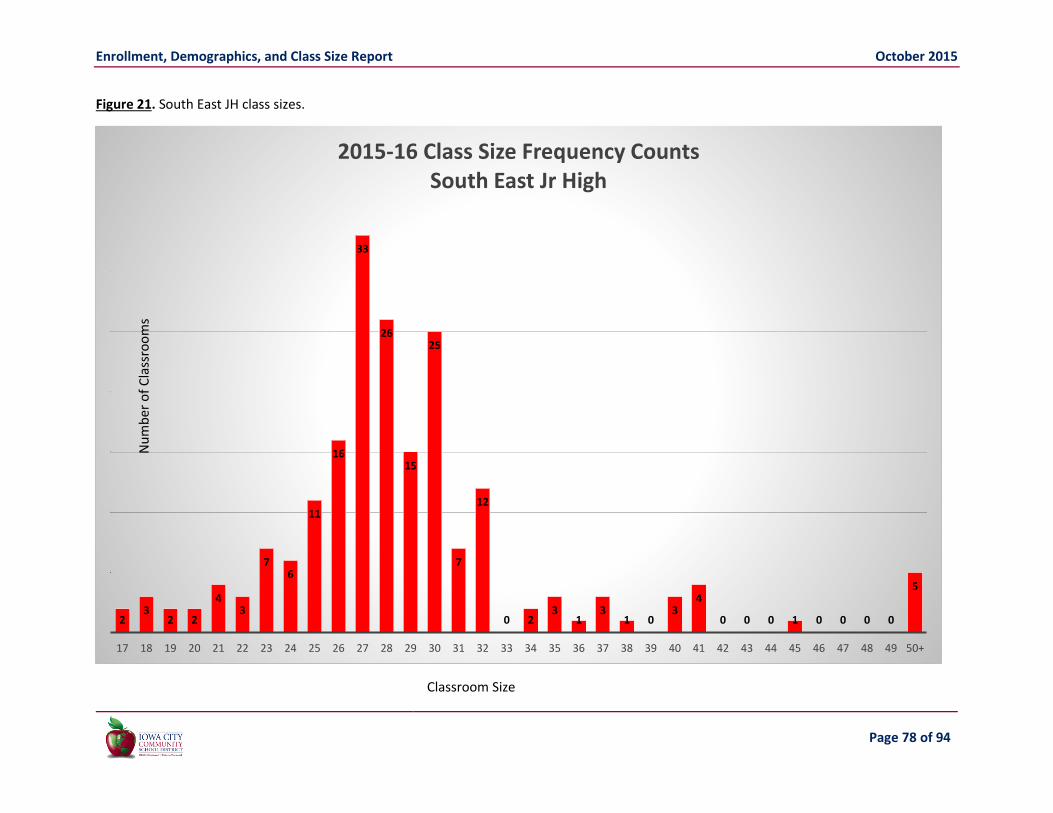
Enrollment, Demographics, and Class Size Report October 2015
Page 78 of 94
Figure 21. South East JH class sizes.
23
2 2
43
76
11
16
33
26
15
25
7
12
0 23
13
1 03
4
0 0 0 1 0 0 0 0
5
17 18 19 20 21 22 23 24 25 26 27 28 29 30 31 32 33 34 35 36 37 38 39 40 41 42 43 44 45 46 47 48 49 50+
2015-16 Class Size Frequency CountsSouth East Jr High
Nu
mb
er o
f C
lass
roo
ms
Classroom Size

Enrollment, Demographics, and Class Size Report October 2015
Page 79 of 94
Figure 22. Jr High class sections.
Northwest
D
ep
t A
vera
ge
North Central
D
ep
t A
vera
ge
South East
D
ep
t A
vera
ge
Course Name Enrollment Course Name Enrollment Course Name Enrollment
Alt Choir and Choir 7 106 Alt Choir and Choir 7 77 Choir 7 Girls 111
Alt Choir and Choir 7-8 Boys 70
Alt Choir and Choir 7-8 Boys
49
Alt Choir 7-8 Boys 67
Alt Choir and Choir 8 73 Alt Choir and Choir 8 64 Choir 8 Girls 71
Alt Concert Band and Concert Band 7
100 Alt Concert Band and Concert Band 7
78
Concert Band and Concert Band EOD 7
122
Alt Sympony Band and Sympony Band 8 64
Symphony Band 8 47
Symphony Band and Symphony Band EOD 8
94
Alt Concert Orchestra and Concert Orchestra 7
48 Alt Concert Orchestra and Concert Orchestra 7
28 Concert Orchestra and Concert Orchestra EOD 7
45
Alt Symphony Orchestra and Symphony Orchestra 8
34 Symphony Orchestra 8
17 Symphony Orchestra and Symphony Orchestra EOD 8
38
Dept Aver 71 Dept Aver 51 Dept Aver 78
American Studies 31 American Studies 31 American Studies 30
American Studies 27 American Studies 28 American Studies 30
American Studies 30 American Studies 28 American Studies 27
American Studies 30 American Studies 31 American Studies 30
American Studies 30 American Studies 31 American Studies 27
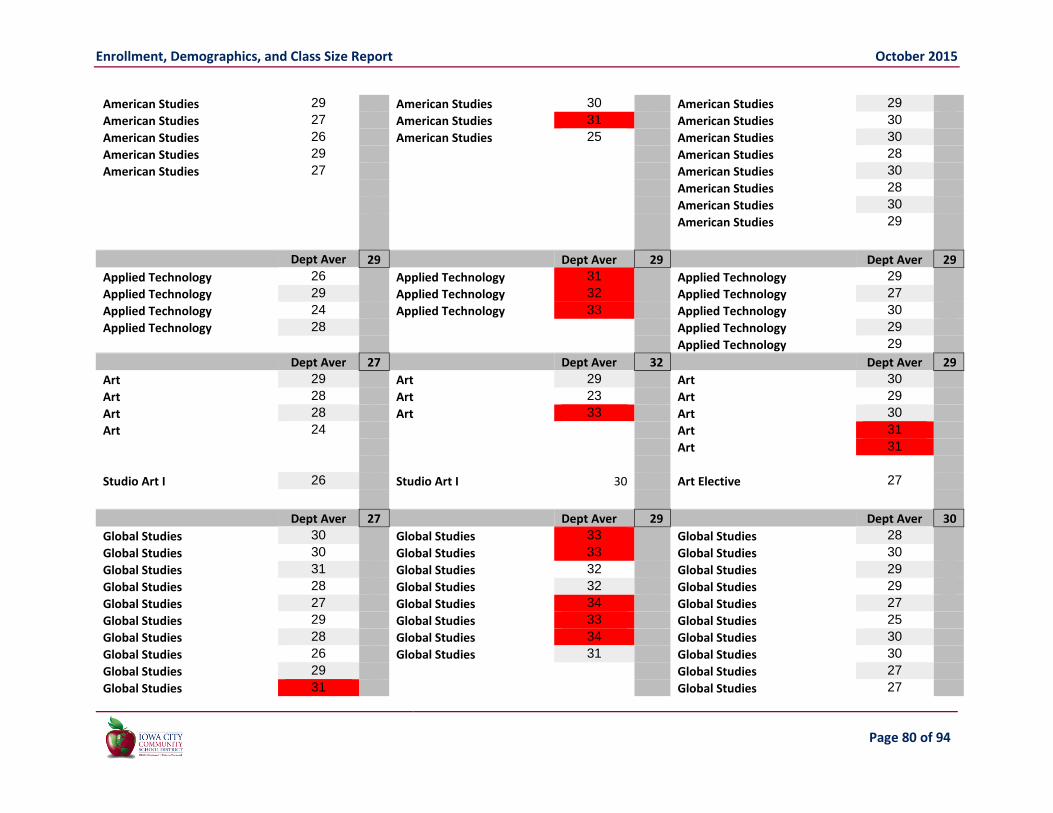
Enrollment, Demographics, and Class Size Report October 2015
Page 80 of 94
American Studies 29 American Studies 30 American Studies 29
American Studies 27 American Studies 31 American Studies 30
American Studies 26 American Studies 25 American Studies 30
American Studies 29 American Studies 28
American Studies 27 American Studies 30
American Studies 28
American Studies 30
American Studies 29
Dept Aver 29 Dept Aver 29 Dept Aver 29
Applied Technology 26 Applied Technology 31 Applied Technology 29
Applied Technology 29 Applied Technology 32 Applied Technology 27
Applied Technology 24 Applied Technology 33 Applied Technology 30
Applied Technology 28 Applied Technology 29
Applied Technology 29
Dept Aver 27 Dept Aver 32 Dept Aver 29
Art 29 Art 29 Art 30
Art 28 Art 23 Art 29
Art 28 Art 33 Art 30
Art 24 Art 31
Art 31
Studio Art I 26 Studio Art I 30 Art Elective 27
Dept Aver 27 Dept Aver 29 Dept Aver 30
Global Studies 30 Global Studies 33 Global Studies 28
Global Studies 30 Global Studies 33 Global Studies 30
Global Studies 31 Global Studies 32 Global Studies 29
Global Studies 28 Global Studies 32 Global Studies 29
Global Studies 27 Global Studies 34 Global Studies 27
Global Studies 29 Global Studies 33 Global Studies 25
Global Studies 28 Global Studies 34 Global Studies 30
Global Studies 26 Global Studies 31 Global Studies 30
Global Studies 29 Global Studies 27
Global Studies 31 Global Studies 27

Enrollment, Demographics, and Class Size Report October 2015
Page 81 of 94
Global Studies 24
Global Studies 29
Global Studies 27
World Events 20
Dept Aver 29 Dept Aver 33 Dept Aver 28
Personal Dev 7 30 Personal Dev 7 33 Personal Development 7 30
Personal Dev 7 31 Personal Dev 7 30 Personal Development 7 27
Personal Dev 7 26 Personal Dev 7 31 Personal Development 7 23
Personal Development 7 28
Personal Development 7 27
Personal Dev 8 30 Personal Dev 8 28 Personal Development 8 30
Personal Dev 8 28 Personal Dev 8 25 Personal Development 8 26
Personal Dev 8 31 Personal Development 8 27
Personal Dev 8 25 Personal Development 8 30
Dept Aver 29 Dept Aver 29 Dept Aver 28
Northwest
North Central South East
Course Name Enrollment Course Name Enrollment
Course Name Enrollment
Language Arts 7 30 Language Arts 7 32 Language Arts 7 30
Language Arts 7 29 Language Arts 7 31 Language Arts 7 26
Language Arts 7 29 Language Arts 7 31 Language Arts 7 29
Language Arts 7 31 Language Arts 7 31 Language Arts 7 26
Language Arts 7 29 Language Arts 7 33 Language Arts 7 27
Language Arts 7 30 Language Arts 7 32 Language Arts 7 30
Language Arts 7 28 Language Arts 7 32 Language Arts 7 26
Language Arts 7 31 Language Arts 7 34 Language Arts 7 30
Language Arts 7 31 Language Arts 7 30
Language Arts 7 25 Language Arts 7 30
Language Arts 7 23
Language Arts 7 26
Language Arts 7 28

Enrollment, Demographics, and Class Size Report October 2015
Page 82 of 94
Language Arts 8 25 Language Arts 8 31 Language Arts 8 29
Language Arts 8 29 Language Arts 8 30 Language Arts 8 25
Language Arts 8 31 Language Arts 8 29 Language Arts 8 26
Language Arts 8 30 Language Arts 8 22 Language Arts 8 25
Language Arts 8 30 Language Arts 8 30 Language Arts 8 30
Language Arts 8 30 Language Arts 8 30 Language Arts 8 28
Language Arts 8 31 Language Arts 8 30 Language Arts 8 28
Language Arts 8 29 Language Arts 8 30 Language Arts 8 26
Language Arts 8 28 Language Arts 8 30
Language Arts 8 30 Language Arts 8 25
Language Arts 8 29
Language Arts 8 30
Language Arts 8 25
Literacy & Literacy 7A 19 Literacy 7 29 Literacy 7 28
Literacy & Literacy 7A 26 Literacy 7 32 Literacy 7 28
Literacy & Literacy 7A 28 Literacy 7 29 Literacy 7 23
Literacy & Literacy 7A 24 Literacy 7 25 Literacy 7 21
Literacy & Literacy 7A 29 Literacy 7 34 Literacy 7 27
Literacy & Literacy 7A 23 Literacy 7 34 Literacy 7 27
Literacy 7 & Literacy 7A 26 Literacy 7 33 Literacy 7 28
Literacy 7 & Literacy 7A 27 Literacy 7 33 Literacy 7 19
Literacy 7 & Literacy 7A 24 Literacy 7 29
Literacy 7 & Literacy 7A 29 Literacy 7 18
Literacy 7 & Literacy 7A 17 Literacy 7 27
Literacy 7 & Literacy 7A 19 Literacy 7 27
Literacy 7 21
Dept Aver 27 Dept Aver 31 Dept Aver 27
Math 7 30 Math 7 30 Math 7 25
Math 7 28 Math 7 34 Math 7 24
Math 7 29 Math 7 32 Math 7 23
Math 7 22 Math 7 33 Math 7 22
Math 7 25 Math 7 25
Math 7 27 Math 7 17
Math 7 24

Enrollment, Demographics, and Class Size Report October 2015
Page 83 of 94
Math 7 24
Math 8A 24 Math 8A 14 Math 7 22
Math 8A 18 Math 7 25
Math 8A 20
Math 8A 25
Algebra 32 Algebra 24 Math 8A 24
Algebra 28 Algebra 28 Math 8A 23
Algebra 30 Algebra 30
Algebra 30 Algebra 29
Algebra 29
Algebra 27
Algebra 31
Algebra 27
Algebra 18
Pre Algebra 7 34 Pre Algebra 7 25
Pre Algebra 7 33 Pre Algebra 7 31 PreAlgebra 7 31
Pre Algebra 7 33 Pre Algebra 7 25 PreAlgebra 7 31
Pre Algebra 7 25 PreAlgebra 7 31
PreAlgebra 7 31
Pre Algebra 8 30 Pre Algebra 8 31 PreAlgebra 8 32
Pre Algebra 8 29 Pre Algebra 8 32 PreAlgebra 8 32
Pre Algebra 8 29 Pre Algebra 8 29 PreAlgebra 8 32
Pre Algebra 8 30 Pre Algebra 8 28 PreAlgebra 8 32
PreAlgebra 8 32
PreAlgebra 8 32
Geometry 31 Geometry 10 Geometry 17
Dept Aver 28 Dept Aver 27 Dept Aver 26
Northwest
North Central South East
Course Name Enrollment Course Name Enrollment Course Name Enrollment
Spanish 1 25 Spanish 1B 30 Spanish 1 32
Spanish 1 29 Spanish 1B 32 Spanish 1 28
Spanish 1 24 Spanish 1B 32 Spanish 1 32
Spanish 1 29 Spanish 1B 33 Spanish 1 26
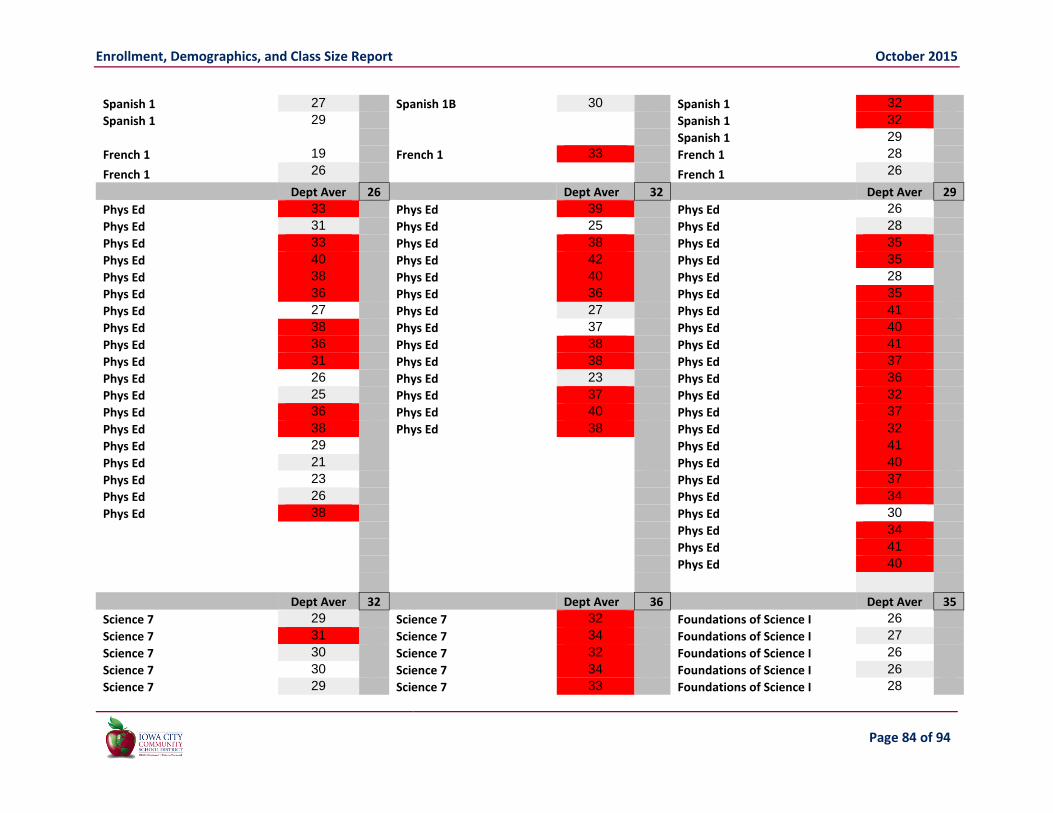
Enrollment, Demographics, and Class Size Report October 2015
Page 84 of 94
Spanish 1 27 Spanish 1B 30 Spanish 1 32
Spanish 1 29 Spanish 1 32
Spanish 1 29
French 1 19 French 1 33 French 1 28
French 1 26 French 1 26
Dept Aver 26 Dept Aver 32 Dept Aver 29
Phys Ed 33 Phys Ed 39 Phys Ed 26
Phys Ed 31 Phys Ed 25 Phys Ed 28
Phys Ed 33 Phys Ed 38 Phys Ed 35
Phys Ed 40 Phys Ed 42 Phys Ed 35
Phys Ed 38 Phys Ed 40 Phys Ed 28
Phys Ed 36 Phys Ed 36 Phys Ed 35
Phys Ed 27 Phys Ed 27 Phys Ed 41
Phys Ed 38 Phys Ed 37 Phys Ed 40
Phys Ed 36 Phys Ed 38 Phys Ed 41
Phys Ed 31 Phys Ed 38 Phys Ed 37
Phys Ed 26 Phys Ed 23 Phys Ed 36
Phys Ed 25 Phys Ed 37 Phys Ed 32
Phys Ed 36 Phys Ed 40 Phys Ed 37
Phys Ed 38 Phys Ed 38 Phys Ed 32
Phys Ed 29 Phys Ed 41
Phys Ed 21 Phys Ed 40
Phys Ed 23 Phys Ed 37
Phys Ed 26 Phys Ed 34
Phys Ed 38 Phys Ed 30
Phys Ed 34
Phys Ed 41
Phys Ed 40
Dept Aver 32 Dept Aver 36 Dept Aver 35
Science 7 29 Science 7 32 Foundations of Science I 26
Science 7 31 Science 7 34 Foundations of Science I 27
Science 7 30 Science 7 32 Foundations of Science I 26
Science 7 30 Science 7 34 Foundations of Science I 26
Science 7 29 Science 7 33 Foundations of Science I 28
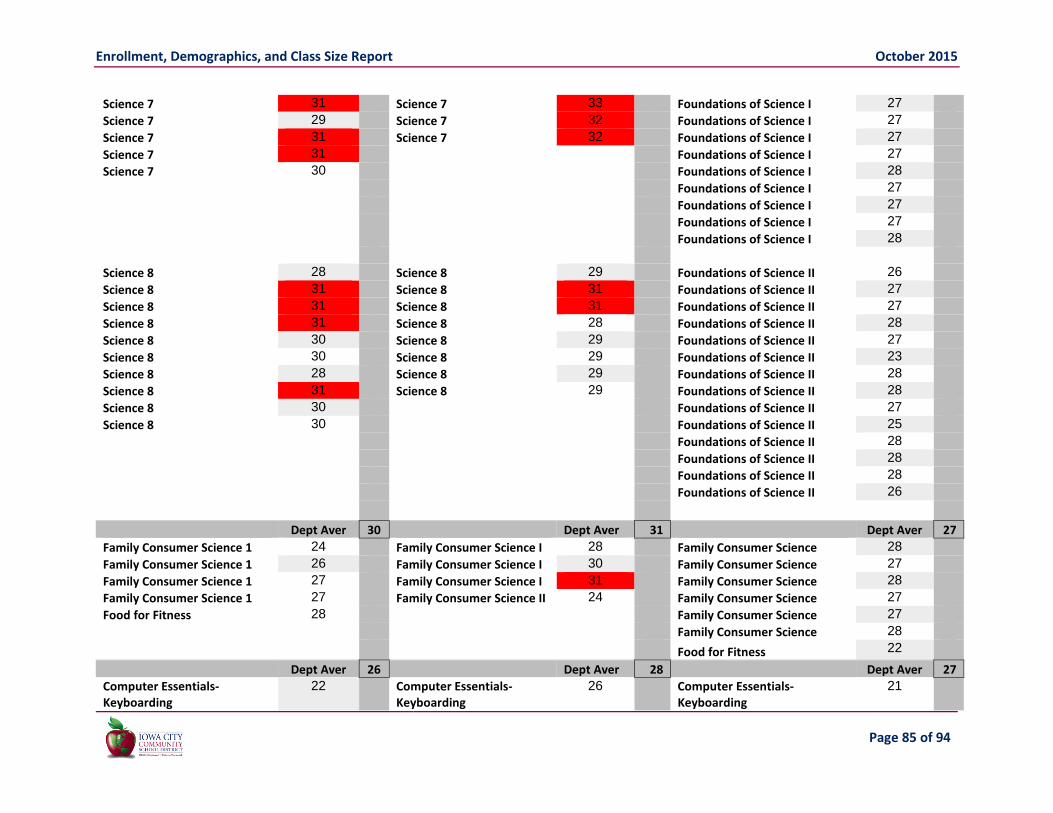
Enrollment, Demographics, and Class Size Report October 2015
Page 85 of 94
Science 7 31 Science 7 33 Foundations of Science I 27
Science 7 29 Science 7 32 Foundations of Science I 27
Science 7 31 Science 7 32 Foundations of Science I 27
Science 7 31 Foundations of Science I 27
Science 7 30 Foundations of Science I 28
Foundations of Science I 27
Foundations of Science I 27
Foundations of Science I 27
Foundations of Science I 28
Science 8 28 Science 8 29 Foundations of Science II 26
Science 8 31 Science 8 31 Foundations of Science II 27
Science 8 31 Science 8 31 Foundations of Science II 27
Science 8 31 Science 8 28 Foundations of Science II 28
Science 8 30 Science 8 29 Foundations of Science II 27
Science 8 30 Science 8 29 Foundations of Science II 23
Science 8 28 Science 8 29 Foundations of Science II 28
Science 8 31 Science 8 29 Foundations of Science II 28
Science 8 30 Foundations of Science II 27
Science 8 30 Foundations of Science II 25
Foundations of Science II 28
Foundations of Science II 28
Foundations of Science II 28
Foundations of Science II 26
Dept Aver 30 Dept Aver 31 Dept Aver 27
Family Consumer Science 1 24 Family Consumer Science I 28 Family Consumer Science 28
Family Consumer Science 1 26 Family Consumer Science I 30 Family Consumer Science 27
Family Consumer Science 1 27 Family Consumer Science I 31 Family Consumer Science 28
Family Consumer Science 1 27 Family Consumer Science II 24 Family Consumer Science 27
Food for Fitness 28 Family Consumer Science 27
Family Consumer Science 28
Food for Fitness 22
Dept Aver 26 Dept Aver 28 Dept Aver 27
Computer Essentials-Keyboarding
22
Computer Essentials-Keyboarding
26
Computer Essentials-Keyboarding
21

Enrollment, Demographics, and Class Size Report October 2015
Page 86 of 94
Computer Essentials-Keyboarding
16
Computer Essentials-Keyboarding
25
Computer Essentials-Keyboarding
23
Computer Essentials-Keyboarding
17
Computer Essentials-Keyboarding
25
Computer Essentials-Keyboarding
19
Computer Essentials-Keyboarding
20
Dept Aver 19 Dept Aver 26 Dept Aver 22
Drama Workshop 18 Computer Applications 17 Theater Workshop 26
Ind Tech Wkshop I 22 Ind Tech Wkshop I 25 Writer's Workshop 19
Ind Tech Wkshop I 21 Computer Applications 18
Leadership 17 Indust Tech Workshop 24
Leadership 18 Leadership 21
Video Production 10
Video Production 11
Dept Aver 17 Dept Aver 21 Dept Aver 28
student sections
staff sections Average per class
Northwest 4719 159.0 30
North Central 3833 121.0 32
South East 5869 197.0 30
Junior High Total 14421 477.0 30

Enrollment, Demographics, and Class Size Report October 2015
Page 87 of 94
APPENDIX 1 – HEADCOUNT VERSUS CERTIFIED ENROLLMENT As mentioned earlier in this report, there are several different ways to calculate enrollment, depending on the purpose of the information. Table 71 shows the actual data reported to the Department of Education from the October 1, 2015 “official count day.” The highlighted cells indicate the components used to calculate headcount, certified enrollment, and students provided instruction.
Table 54. Official enrollment counts submitted to Department of Education and associated calculations.
Residents Count Weight Weighted
Count Weighted
Count
Resident public students for whom your district provides all, or a major portion of, the instructional program within your district.
Full-time K-12 13111 1.000 13111.00 13111.00
Pre-K Special Education 63 1.000 63.00 63.00
Dual Enrolled K-8 or 9-12 Enrolled for Activity Program 35 0.100 3.50 3.50
Home School Assistance K-12 13 0.300 3.90 3.90
Dual Enrolled and Home School Assistance K-8 or 9-12 Enrolled for Activity Program
68 0.400 27.20 27.20
Students Leaving Count Weight Weighted
Count Weighted
Count
Open Enrolled Out
Full time K-12 391 1.000 391.00 391.00
Dual Enrolled K-8 or 9-12 Enrolled for Activity Program 5 0.100 0.50 0.50
Home School Assistance K-12 0 0.300 0.00 0.00
Dual Enrolled and Home School Assistance K-8 or 9-12 Enrolled for Activity Program 86 0.400 34.40 34.40
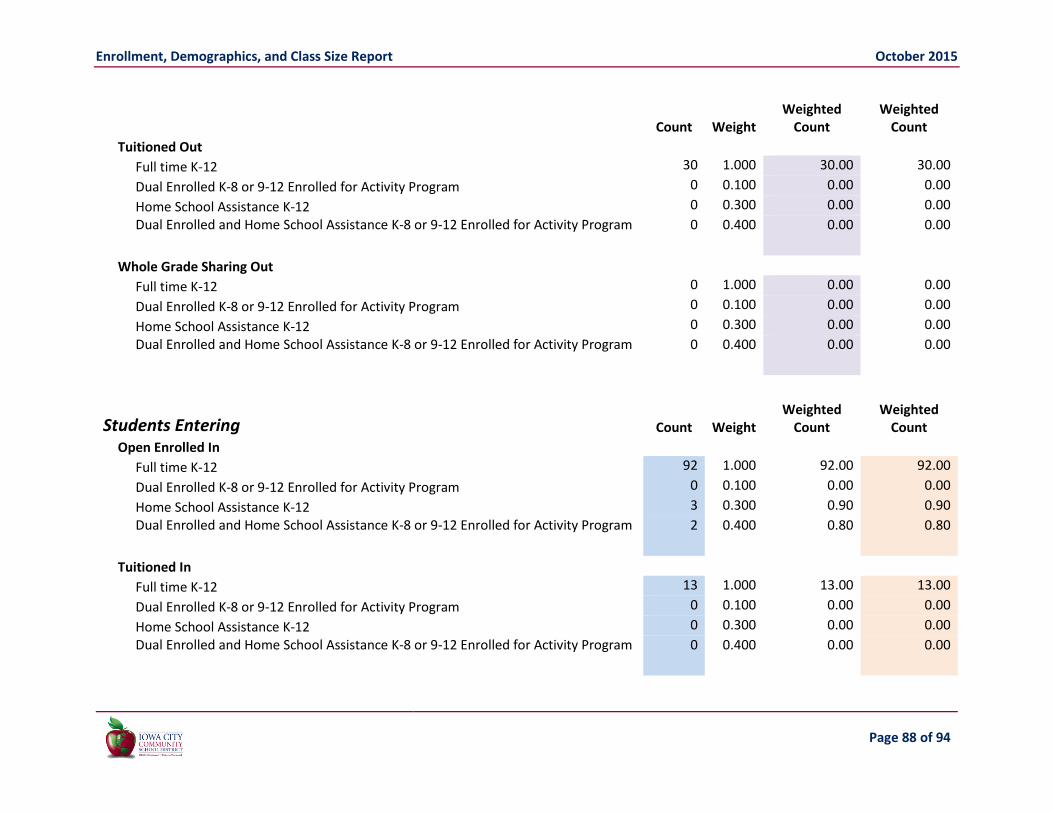
Enrollment, Demographics, and Class Size Report October 2015
Page 88 of 94
Count Weight Weighted
Count Weighted
Count
Tuitioned Out
Full time K-12 30 1.000 30.00 30.00
Dual Enrolled K-8 or 9-12 Enrolled for Activity Program 0 0.100 0.00 0.00
Home School Assistance K-12 0 0.300 0.00 0.00
Dual Enrolled and Home School Assistance K-8 or 9-12 Enrolled for Activity Program 0 0.400 0.00 0.00
Whole Grade Sharing Out
Full time K-12 0 1.000 0.00 0.00
Dual Enrolled K-8 or 9-12 Enrolled for Activity Program 0 0.100 0.00 0.00
Home School Assistance K-12 0 0.300 0.00 0.00
Dual Enrolled and Home School Assistance K-8 or 9-12 Enrolled for Activity Program 0 0.400 0.00 0.00
Students Entering Count Weight Weighted
Count Weighted
Count
Open Enrolled In
Full time K-12 92 1.000 92.00 92.00
Dual Enrolled K-8 or 9-12 Enrolled for Activity Program 0 0.100 0.00 0.00
Home School Assistance K-12 3 0.300 0.90 0.90
Dual Enrolled and Home School Assistance K-8 or 9-12 Enrolled for Activity Program 2 0.400 0.80 0.80
Tuitioned In
Full time K-12 13 1.000 13.00 13.00
Dual Enrolled K-8 or 9-12 Enrolled for Activity Program 0 0.100 0.00 0.00
Home School Assistance K-12 0 0.300 0.00 0.00
Dual Enrolled and Home School Assistance K-8 or 9-12 Enrolled for Activity Program 0 0.400 0.00 0.00

Enrollment, Demographics, and Class Size Report October 2015
Page 89 of 94
Count Weight Weighted
Count Weighted
Count
Whole Grade Sharing In
Full time K-12 0 1.000 0.00 0.00
Dual Enrolled K-8 or 9-12 Enrolled for Activity Program 0 0.100 0.00 0.00
Home School Assistance K-12 0 0.300 0.00 0.00
Dual Enrolled and Home School Assistance K-8 or 9-12 Enrolled for Activity Program 0 0.400 0.00 0.00
District Courses Count Weight Weighted
Count Weighted
Count
Non-Public Shared Time K-8 0 0.300 0.00 0.00
Non-Public Shared Time K-8 1 0.200 0.20 0.20
Non-Public Shared Time 9-12 8 0.200 1.60 1.60
Non-Public Shared Time 9-12 0 0.500 0.00 0.00
CPI Dual Enrolled/CPI Dual Enrolled and HSAP (9-12)
Resident 6 0.000 0.00 0.00
Resident 0 0.100 0.00 0.00
Resident 5 0.200 1.00 1.00
Resident 8 0.300 2.40 2.40
Resident 1 0.500 0.50 0.50
Open Enrolled In 1 0.500 0.50 0.50
Tuitioned In 0 0.00 0.00
Whole Grade Sharing In 0 0.00 0.00
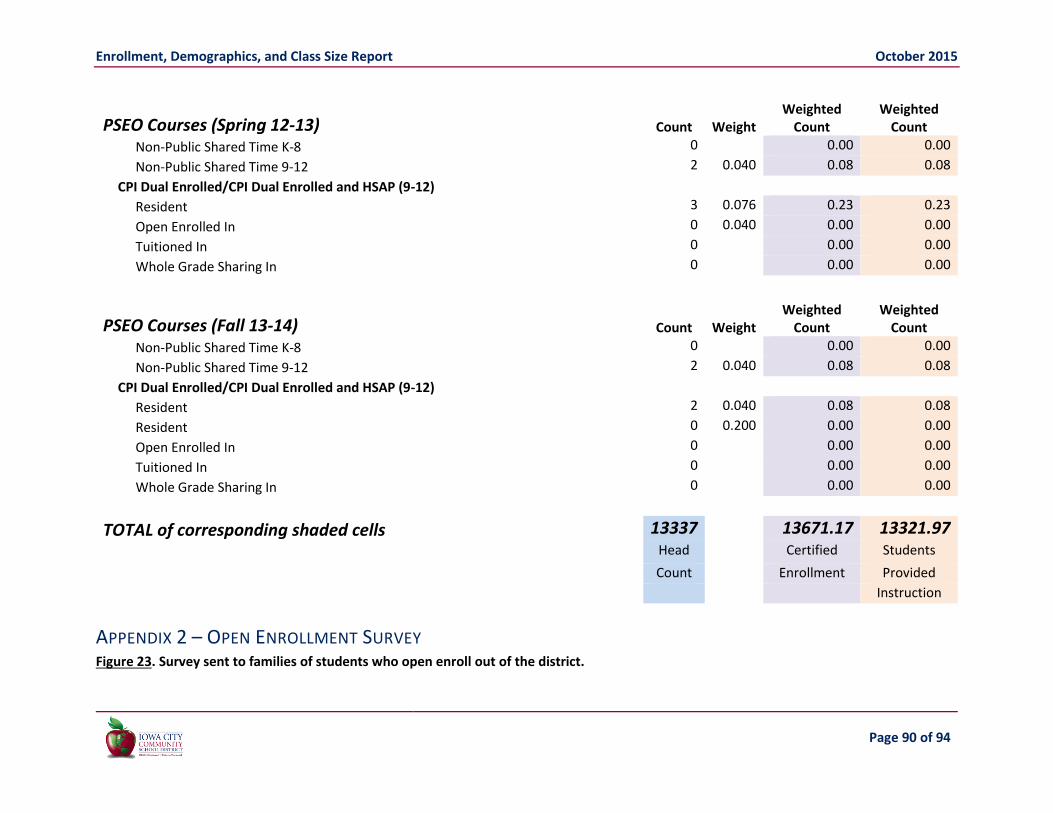
Enrollment, Demographics, and Class Size Report October 2015
Page 90 of 94
PSEO Courses (Spring 12-13) Count Weight Weighted
Count Weighted
Count
Non-Public Shared Time K-8 0 0.00 0.00
Non-Public Shared Time 9-12 2 0.040 0.08 0.08
CPI Dual Enrolled/CPI Dual Enrolled and HSAP (9-12)
Resident 3 0.076 0.23 0.23
Open Enrolled In 0 0.040 0.00 0.00
Tuitioned In 0 0.00 0.00
Whole Grade Sharing In 0 0.00 0.00
PSEO Courses (Fall 13-14) Count Weight Weighted
Count Weighted
Count
Non-Public Shared Time K-8 0 0.00 0.00
Non-Public Shared Time 9-12 2 0.040 0.08 0.08
CPI Dual Enrolled/CPI Dual Enrolled and HSAP (9-12)
Resident 2 0.040 0.08 0.08
Resident 0 0.200 0.00 0.00
Open Enrolled In 0 0.00 0.00
Tuitioned In 0 0.00 0.00
Whole Grade Sharing In 0 0.00 0.00
TOTAL of corresponding shaded cells 13337 13671.17 13321.97
Head Certified Students
Count Enrollment Provided
Instruction
APPENDIX 2 – OPEN ENROLLMENT SURVEY Figure 23. Survey sent to families of students who open enroll out of the district.

Enrollment, Demographics, and Class Size Report October 2015
Page 91 of 94
APPENDIX 3 – HOME LANGUAGE CODES

Enrollment, Demographics, and Class Size Report October 2015
Page 92 of 94
Table 55. Home language codes provided by the Iowa Department of Education.
Code Language aar Afar abk Abkhazian ace Achinese ach Acoli ada Adangme ady Adyghe; Adygei afa Afro-Asiatic (Other) afh Afrihili afr Afrikaans ain Ainu aka Akan akk Akkadian alb Albanian ale Aleut alg Algonquian languages alt Southern Altai amh Amharic ang English, Old (ca.450-1100) anp Angika apa Apache languages ara Arabic arc Official Aramaic (700-300
BCE);Imperial Aramaic (700-300 BCE)
arg Aragonese arm Armenian arn Mapudungun; Mapuche arp Arapaho art Artificial (Other) arw Arawak asm Assamese ast Asturian; Bable; Leonese;
Asturleonese ath Athapascan languages aus Australian languages ava Avaric ave Avestan awa Awadhi aym Aymara
Code Language aze Azerbaijani bad Banda languages bai Bamileke languages bak Bashkir bal Baluchi bam Bambara ban Balinese baq Basque bas Basa bat Baltic (Other) bej Beja;Bedawiyet bel Belarusian bem Bemba ben Bengali ber Berber (Other) bho Bhojpuri bih Bihari bik Bikol bin Bini; Edo bis Bislama bla Siksika bnt Bantu (Other) bos Bosnian bra Braj bre Breton btk Batak languages bua Buriat bug Buginese bul Bulgarian bur Burmese byn Blin; Bilin cad Caddo cai Central American Indian
(Other) car Galibi Carib cat Catalan; Valencian cau Caucasian (Other) ceb Ceduano cel Celtic (Other)
Code Language cha Chamorro chb Chibcha che Chechen chg Chagatai chi Chinese chk Chuukese chm Mari chn Chinook jargon cho Choctaw chp Chipewyan; Dene Suline chr Cherokee chu Church Slavic; Old
Slavonic; Church Slavonic; Old Bulgarian; Old Church
chv Chuvash chy Cheyenne cmc Chamic languages cop Coptic cor Cornish cos Corsican cpe Creoles and pidgins,
English based (Other) cpf Creoles and pidgins,
French- based (Other) cpp Creoles and pidgins,
Portuguese-based (Other) cre Cree crh Crimean Tatar; Crimean
Turkish crp Creoles and pidgins
(Other) csb Kashubian cus Cushitic (Other) cze Czech dak Dakota dar Danish dar Dargwa day Land Dayak languages del Delaware
Code Language den Slave (Athapascan) dgr Dogrib din Dinka div Divehi; Dhivehi; Maldivian doi Dogri dra Dravidian (Other) dsb Lower Sorbian dua Duala dum Dutch, Middle (ca.1050-
1350) dut Dutch; Flemish dyu Dyula dzo Dzongkha efi Efik egy Egyptian (Ancient) eka Ekajuk elx Elamite eng English enm English, Middle (1100-
1500) epo Esperanto est Estonian ewe Ewe ewo Ewondo fan Fang fao Faroese fat Fanti fij Fijian fil Filipino; Pilipino fin Finnish fiu Finno-Ugrian (Other) fon Fon fre French frm French, Middle (ca.1400-
1600) fro French, Old (842-ca.1400) frr Northern Frisian frs Eastern Frisian fry Western Frisian
Code Language ful Fulah fur Friulian gaa Ga gay Gayo gba Gbaya gem Germanic (Other) geo Georgian ger German gez Geez gil Gilbertese gla Gaelic; Scottish Gaelic gle Irish glg Galician glv Manx gmh German, Middle High
(ca.1050-1500) goh German, Old High (ca.750-
1050) gon Gondi gor Gorontalo got Gothic grb Grebo grc Greek, Ancient (to 1453) gre Greek,Modern (1453-) grn Guarani gsw Swiss German; Alemannic;
Alsatian guj Gujarati gwi Gwich'in hai Haida hat Haitian; Haitian Creole hau Hausa haw Hawaiian heb Hebrew her Herero hil Hiligaynon him Himachali hin Hindi hit Hittite

Enrollment, Demographics, and Class Size Report October 2015
Page 93 of 94
Code Language hmn Hmong hmo Hiri Motu hrv Croatian hsb Upper Sorbian hun Hungarian hup Hupa iba Iban ibo Igbo ice Icelandic ido Ido iii Sichuan Yi; Nuosu ijo Ijo languages iku Inukitut ile Interlingue; Occidental ilo Iloko ina Interlingua (International
Auxiliary Language Association)
inc Indic (Other) ind Indonesian ine Indo-European (Other) inh Ingush ipk Inupiaq ira Iranian (Other) iro Iroquoian languages ita Italian jav Javanese job Lojban jpn Japanese jpr Judeo-Persian jrb Judeo-Arabic kaa Kara-Kalpak kab Kabyle kac Kachin; Jingpho kal Kalaallisut; Greenlandic kam Kamba kan Kannadu kar Karen languages kas Kashmiri kau Kanuri kaw Kawi
Code Language kaz Kazakh kbd Kabardian khi Khoisan (Other) khm Central Khmer kho Khotanese kik Kikuyu; Gikuyu kin Kinyarwanda kir Kirghiz; Kyrgyz kmb Kimbundu kok Konkani kom Komi kon Kongo kor Korean kos Kosraean kpe Kpelle krc Karachay-Balkar krl Karelian kro Kru languages kru Kurukh kua Kuanyama; Kwanyama kum Kumyk kur Kurdish kut Kutenai lad Ladino lah Lahnda lam Lamba lao Lao lat Latin lav Latvian lez Lezghian lim Limburgan; Limburger;
Limburgish lin Lingala lit Lithuanian lol Mongo loz Lozi ltz Luxembourgish;
Letzeburgesch lua Luba-Lulua lub Luba-Katanga lug Ganda
Code Language lui Luiseno lun Lunda luo Luo (Kenya and Tanzania) lus Lushai mac Macedonian mad Madurese mag Magahi mah Marshallese mai Maithili mak Makasar mal Malayalam man Mandingo mao Maori map Austronesian (Other) mar Marathi mas Masai may Malay mdf Moksha mdr Mandar men Mende mga Irish, Middle (900-1200) mic Mi'kmaq; Micmac min Minangkabau mis Uncoded languages mkh Mon-Khmer (Other) mlg Malagasy mlt Maltese mnc Manchu mni Manipuri mno Manobo languages moh Mohawk mol Moldavian; Moldovan mon Mongolian mos Mossi mul Multiple languages mun Munda languages mus Creek mwl Mirandese mwr Marwari myn Mayan languages myv Erzya
Code Language nah Nahuatl languages nai North American Indian nap Neapolitan nau Nauru nav Navajo; Navaho nbl Ndebele, South; South
Ndebele nde Ndebele, North; North
Ndebele ndo Ndonga nds Low German; Low Saxon;
German, Low; Saxon, Low nep Napali new Nepal Bhasa; Newari nia Nias nic Niger-Kordofanian (Other) niu Niuean nno Norwegian Nynorsk;
Nynorsk, Norwegian nob Bokmål, Norwegian;
Norwegian Bokmal nog Nogai non Norse, Old nor Norwegian nqo N'Ko nso Pedi; Sepedi; Northern
Sotho nub Nubian languages nwc Classical Newari; Old
Newari; Classical Nepal Bhasa
nya Chichewa; Chewa; Nyanja nym Nyamwezi nyn Nyankole nyo Nyoro nzi Nzima oci Occitan (post 1500) oji Ojibwa ori Oriya orm Oromo osa Osage
Code Language oss Ossetian; Ossetic ota Turkish, Ottoman (1500-
1928) oto Otomian languages paa Papuan (Other) pag Pangasinan pal Pahlavi pam Pampanga; Kapampangan pan Panjabi; Punjabi pap Papiamento pau Palauan peo Persian, Old (ca.600-400
B.C.) per Persian phi Philippine (Other) phn Phoenician pli Pali pol Polish pon Pohnpeian por Portuguese pra Prakrit languages pro Provençal, Old (to 1500);
Occitan, Old (to 1500) pus Pushto; Pashto que
Quechua qaa Other - Reserved for local
use que Quechua raj Rajasthani rap Rapanui rar Rarotongan; Cook Islands
Maori roa Romance (Other) roh Romansh rom Romany rum Romanian run Rundi rup Aromanian; Arumanian;
Macedo-Romanian rus Russian sad Sandawe

Enrollment, Demographics, and Class Size Report October 2015
Page 94 of 94
Code Language sag Sango sah Yukut sai South American Indian
(Other) sal Salishan languages sam Samaritan Aramaic san Sanskrit sas Sasak sat Santali scn Sicilian sco Scots sel Selkup sem Semitic (Other) sga Irish, Old (to 900) sgn Sign Languages shn Shan sid Sidamo sin Sinhala; Sinhalese sio Siouan languages sit Sino-Tibetan (Other) sla Slavic (Other) slo Slovak slv Slovenian sma Southern Sami sme Northern Sami smi Sami languages (Other)
Code Language smj Lule Sami smn Inari Sami smo Samoan sms Skolt Sami sna Shona snd Sindhi snk Soninke sog Sogdian som Somali son Songhai languages sot Sotho,Southern spa Spanish;Castilian srd Sardinian srn Sranan Tongo srp Serbian srr Serer ssa Nilo-Saharan (Other) ssw Swati suk Sukuma sun Sundanese sus Susu sux Sumerian swa Swahili swe Swedish syc Classical Syriac syr Syriac
Code Language tah Tahitian tai Tai (Other) tam Tamil tat Tatar tel Telugu tem Time ter Tereno tet Tetum tgk Tajik tgl Tagalog tha Thai tib Tibetan tig Tigre tir Tigrinya tiv Tiv tkl Tokelau tlh Klingon; tlhIngan-Hol tli Tlingit tmh Tamashek tog Tonga (Nyasa) ton Tonga (Tonga Islands) tpi Tok Pisin tsi Tsimshian tsn Tswana tso Tsonga tuk Turkmen
Code Language tum Tumbuka tup Tupi languages tur Turkish tut Altaic (Other) tvl Tuvalu twi Twi tyv Tuvinian udm Udmurt uga Ugaritic uig Uighur; Uyghur ukr Ukrainian umb Umbundu und Undetermined urd Urdu uzb Uzbek vai Vai ven Venda vie Vietnamese vol Volapuk vot Votic wak Wakashan languages wal Wolaitta; Wolaytta war Waray was Washo wel Welsh wen Sorbian languages
Code Language wln Walloon wol Wolof xal Kalmyk; Oriat xho Xhosa yao Yao yap Yapese yid Yiddish yor Yoruba ypk Yupik languages zap Zapotec zbl Blissymbols;
Blissymbolics; Bliss zen Zenaga zha Zhuang; Chuang znd Zande languages zul Zulu zun Zuni zxx No linguistic content; Not
applicable zza Zaza; Dimili; Dimli; Kirdki;
Kirmanjki; Zazaki