Enrollment Discussion - BoardDocs
16
Enrollment Discussion October 2018 2018 Enrollment with 2016 Demographic Study Forecast
Transcript of Enrollment Discussion - BoardDocs

Enrollment Discussion October 2018
2018 Enrollment with 2016 Demographic Study Forecast

McKibben Demographics
Downers Grove Grade School District #58: Total District Enrollment
15
2012-13 2013-14 2014-15 2015-16 2016-17 2017-18 2018-19 2019-20 2020-21 2021-22 2022-23 2023-24 2024-25 2025-26 2026-27
PK 165 173 165 182 171 170 170 170 170 170 170 170 170 170 170 K 476 478 455 472 475 478 476 476 484 478 471 464 458 451 460 1 479 532 520 498 548 541 529 528 528 521 514 506 499 493 485 2 559 500 556 521 515 558 549 538 545 545 538 531 522 515 509 3 563 566 523 549 528 520 563 555 551 558 558 552 545 536 529 4 572 591 535 510 555 524 515 559 559 555 562 563 557 549 540 5 554 582 585 537 518 557 526 517 569 569 564 571 572 567 559 6 514 552 597 594 531 514 552 522 521 572 573 568 575 576 571
Biliteracy - - 20 36 47 58 69 80 83 82 82 82 82 82 82 Special 22 24 27 30 41 47 52 52 52 52 52 52 52 52 52
Total: K-6 3,904 3,998 3,983 3,929 3,929 3,967 4,001 3,997 4,062 4,102 4,084 4,059 4,032 3,991 3,957
7 572 539 554 598 595 535 503 544 524 516 570 572 567 573 573 8 556 570 544 549 598 595 536 504 548 528 520 574 576 571 577
Total: 7-8 1128 1109 1098 1147 1193 1130 1039 1048 1072 1044 1090 1146 1143 1144 1150
Total: PK-8 5032 5107 5081 5076 5122 5097 5040 5045 5134 5146 5174 5205 5175 5135 5107
Total: PK-8 5032 5107 5081 5076 5122 5097 5040 5045 5134 5146 5174 5205 5175 5135 5107
Change 75 -26 -5 46 -25 -57 5 89 12 28 31 -30 -40 -28%-Change 1.5% -0.5% -0.1% 0.9% -0.5% -1.1% 0.1% 1.8% 0.2% 0.5% 0.6% -0.6% -0.8% -0.5%
Total: PK-6 3904 3998 3983 3929 3929 3967 4001 3997 4062 4102 4084 4059 4032 3991 3957
Change 94 -15 -54 0 38 34 -4 65 40 -18 -25 -27 -41 -34%-Change 2.4% -0.4% -1.4% 0.0% 1.0% 0.9% -0.1% 1.6% 1.0% -0.4% -0.6% -0.7% -1.0% -0.9%
Total: 7-8 1128 1109 1098 1147 1193 1130 1039 1048 1072 1044 1090 1146 1143 1144 1150
Change -19 -11 49 46 -63 -91 9 24 -28 46 56 -3 1 6%-Change -1.7% -1.0% 4.5% 4.0% -5.3% -8.1% 0.9% 2.3% -2.6% 4.4% 5.1% -0.3% 0.1% 0.5%
Forecasts Developed October 2016Green Cells (2016-17 and earlier) are historical dataBlue Cells (2017-18 and later) are forcasted years
2016 Demographic Study

2018 Enrollment BA ES FA HG HL HP IT KG LE PD WH Enrollment
K 22 22K 19 27 28 25 22 20 22 21 19 24K 19 27 27 28 25 22 20 22 21 20 24 526
K-OKEEP 30 20 41 48 45 41 33 54 53 37 38 440K-AM only 8 7 13 8 5 3 7 12 11 2 10 86
526
1 16 28 22 25 23 22 22 26 26 24 23 5131 18 21 25 24 22 20 27 25 24 24
1 26
1/2
2 20 16 20 20 25 20 17 26 22 23 19 493
2 20 14 19 22 25 19 16 25 22 22 182 21 22
2/3
3 20 28 26 28 21 23 24 18 28 24 21 5583 19 28 28 21 22 24 19 27 25 193 20 19 26
3/4
4 26 18 24 27 21 24 19 24 25 24 25 5164 18 24 27 21 24 20 24 26 24 25
4 26
4/55 16 23 25 26 20 18 21 27 23 25 27 5255 17 25 24 20 18 24 27 24 26 265 19 24
5/6
6 26 19 25 21 30 22 23 24 28 29 22 5616 19 26 21 31 22 24 22 28 28 226 21 28
Grades 1-6 198 183 285 336 321 256 254 308 456 298 271Grades K-6 236 210 339 392 371 300 294 374 520 337 319
48 Biliteracy16 11 13 Spec. Ed.
93 74 Preschool
387 393 404 435School Enrollment
with Special Programs
10 9 12 14 14 12 12 13 18 12 12 AverageGr. 1-6 Class Size 19.8 20.3 23.8 24.0 22.9 21.3 21.2 23.7 25.3 24.8 22.6 22.9
12 10 14 16 16 14 14 16 21 14 14 AverageGr. K-6 Class Size 19.7 21.0 24.2 24.5 23.2 21.4 21.0 23.4 24.8 24.1 22.8 22.9
*Lester OKEEP enrollment corrected 9/18/18
2018-19 Enrollment (as of August 31, 2018)

2016 Demographic Study
McKibben Demographics
Table 5: Elementary Enrollment, 2016, 2021, 2026
16
2016 20212016-2021
Change2026
2021-2026Change
2016-2026Change
Belle Aire ES 238 284 19.3% 289 1.8% 21.4%El Sierra ES 267 210 -21.3% 230 9.5% -13.9%Fairmount ES 339 348 2.7% 342 -1.7% 0.9%Henry Puffer ES 289 314 8.7% 301 -4.1% 4.2%Highland ES 364 446 22.5% 425 -4.7% 16.8%Hillcrest ES 383 402 5.0% 378 -6.0% -1.3%Indian Trail ES 331 350 5.7% 333 -4.9% 0.6%Kingsley ES 395 472 19.5% 449 -4.9% 13.7%Lester ES 496 472 -4.8% 445 -5.7% -10.3%Pierce Downer ES 354 334 -5.6% 311 -6.9% -12.1%Whittier ES 302 300 -0.7% 284 -5.3% -6.0%District Total 3929 4102 4.4% 3957 -3.5% 0.7%

Grade Level Comparison
Comparison of 2018 ADM Enrollment With 2016 Series forecastsDowner'sGroveGradeSchoolDistrict#58:
McKibbenDemographicReseach
2016-2018 2016-2018
Grade2015
Enrollment2016
Enrollment2017
EnrollmentForecastof2017
2018Enrollment
Forecastof2018
Forecastof2019
Forecastof2020
Forecastof2021
Difference %Difference
PK 182 171 160 170 167 170 170 170 170 3 1.8%K 472 475 506 478 526 476 476 484 478 -50 -9.5%1 498 548 495 541 513 529 528 528 521 16 3.1%2 521 515 562 558 493 549 538 545 545 56 11.4%3 549 528 517 520 558 563 555 551 558 5 0.9%4 510 555 536 524 516 515 559 559 555 -1 -0.2%5 537 518 566 557 525 526 517 569 569 1 0.2%6 594 531 544 514 561 552 522 521 572 -9 -1.6%7 598 595 544 535 563 503 544 524 516 -60 -10.7%8 549 598 603 595 549 536 504 548 528 -13 -2.4%
Elem.Biliteracy 36 47 45 58 48 69 80 83 82 21 43.8%Elem.Special 30 41 47 47 40 52 52 52 52 12 30.0%DistrictTotal 5076 5122 5125 5097 5059 5040 5045 5134 5146 -19 -0.4%
Actualvs.Forecast
Noteworthy
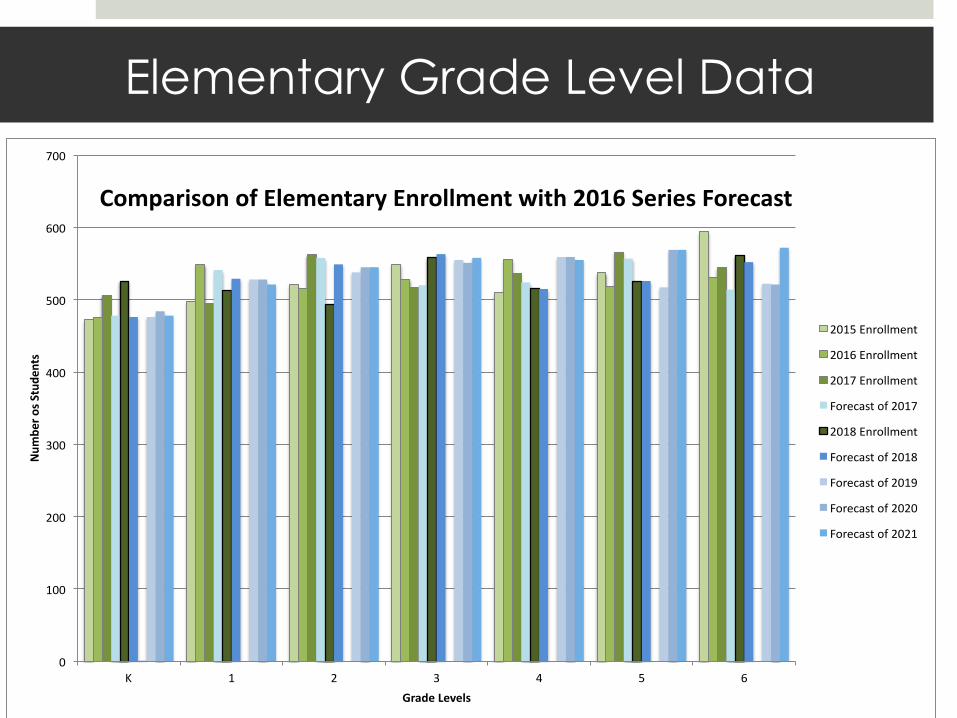
Elementary Grade Level Data
0
100
200
300
400
500
600
700
K 1 2 3 4 5 6
Num
bero
sStud
ents
GradeLevels
ComparisonofElementaryEnrollmentwith2016SeriesForecast
2015Enrollment
2016Enrollment
2017Enrollment
Forecastof2017
2018Enrollment
Forecastof2018
Forecastof2019
Forecastof2020
Forecastof2021

Middle School Grade Level Data
598
549
595 598
544
603
535
595
563549
503
536544
504524
548
516528
0
100
200
300
400
500
600
700
7 8
Num
berosStude
nts
GradeLevels
ComparisonofMiddleSchoolEnrollmentwith2016SeriesForecasts
2015Enrollment
2016Enrollment
2017Enrollment
Forecastof2017
2018Enrollment
Forecastof2018
Forecastof2019
Forecastof2020
Forecastof2021
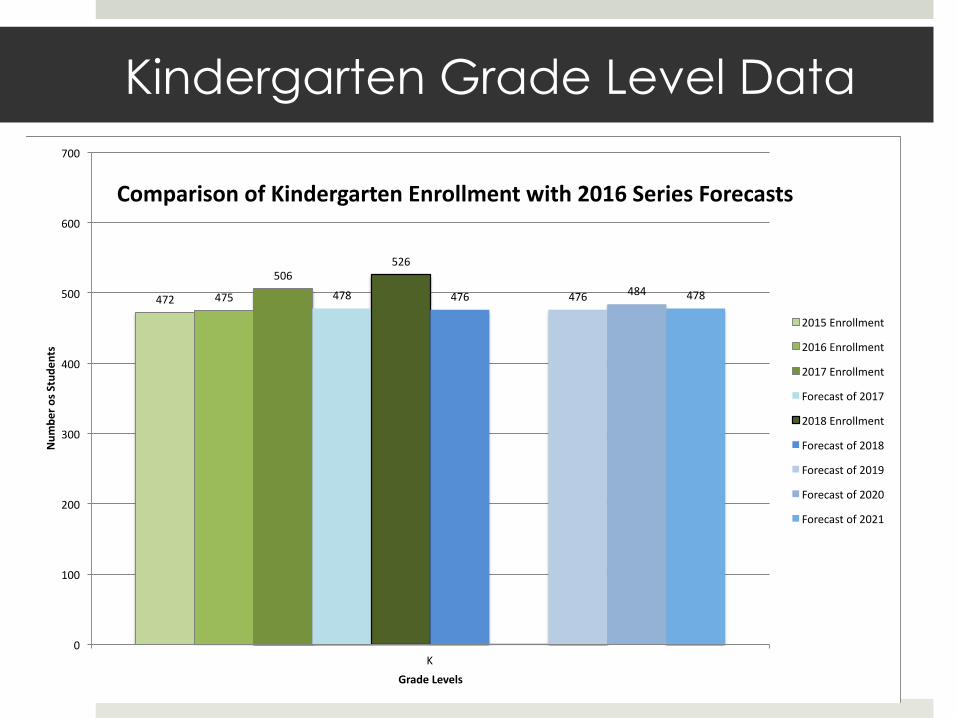
Kindergarten Grade Level Data
472 475
506
478
526
476 476 484 478
0
100
200
300
400
500
600
700
K
Num
berosStude
nts
GradeLevels
ComparisonofKindergartenEnrollmentwith2016SeriesForecasts
2015Enrollment
2016Enrollment
2017Enrollment
Forecastof2017
2018Enrollment
Forecastof2018
Forecastof2019
Forecastof2020
Forecastof2021
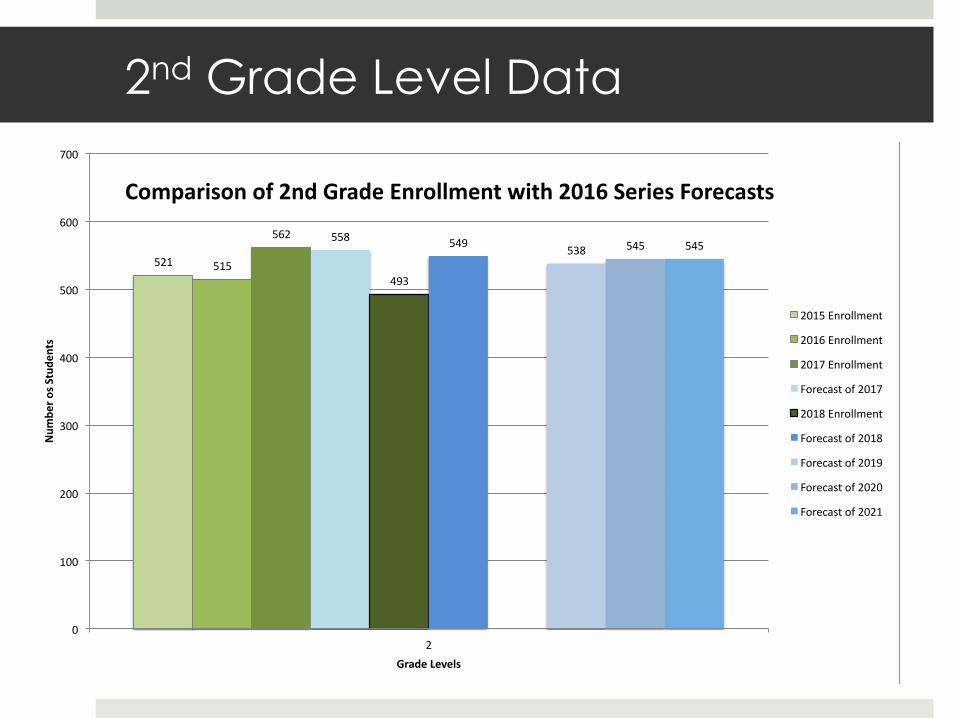
2nd Grade Level Data
521 515
562 558
493
549538 545 545
0
100
200
300
400
500
600
700
2
Num
berosStude
nts
GradeLevels
Comparisonof2ndGradeEnrollmentwith2016SeriesForecasts
2015Enrollment
2016Enrollment
2017Enrollment
Forecastof2017
2018Enrollment
Forecastof2018
Forecastof2019
Forecastof2020
Forecastof2021

School Level Data Comparison of 2018 ADM Enrollment With 2016 Series forecastsDowner'sGroveGradeSchoolDistrict#58:
McKibben Demographic Reseach
K-6 Enrollment
2018 Enrollment
Forecast of 2018
Enrollment Difference Difference
Preschool & Special Programs Enrollment
BelleAire 236 * 237 1 0.4%ElSierra 210 232 22 10.5%Fairmount 339 345 6 1.8%HenryPuffer 300 302 2 0.7% 93Highland 392 * 402 10 2.6%Hillcrest 371 381 10 2.7% 16IndianTrail 294 313 19 6.5% 85Kingsley 374 355 -19 -5.1% 61Lester 520 494 -26 -5.0%PierceDowner 337 338 1 0.3%Whittier 319 311 -8 -2.5%
K-6Total 3692 3710 18 0.5% 255
* Note: There are 11 kindergarten students, one 1st grader and one 3rd grader transferred from Highland to Belle Aire due to grade level enrollment caps. HG resident enrollment would be 405, including 13 administratively transferred students; and BA's enrollment would be 223, excluding those same 13 transferred students.

School Level Data
0
100
200
300
400
500
600
Numbe
rofS
tude
nts
School
ElementaryEnrollmentwithForecast
2018Enrollment
Forecastof2018Enrollment

School Level Data
7-8 Enrollment
2018 Enrollment
Forecast of 2018
Enrollment Difference DifferenceO'NeillMS 458 445 -13 -2.8%HerrickMS 654 594 -60 -9.2%
MSTotal 1112 1039 -73 -6.6%
District Enrollment
2018 Enrollment
Forecast of 2018
Enrollment Difference DifferenceDISTRICT TOTAL 4,804 4,749 -55 -1.1%
Including Elem. Special Programs 5,059 5,040 -19 -0.4%

School Level Data
0
100
200
300
400
500
600
700
445 594
458 654
O'NeillMS HerrickMS
Numbe
rofS
tude
nts
School
MiddleSchoolEnrollmentwithForecast
2018Enrollment
Forecastof2018Enrollment
HerrickMiddleSchoolO'NeillMiddleSchool

Next Steps
! Improve Kindergarten Registration Procedures for Highland
! Consider Intra-District Transfer Policy
! Examine Enrollment and Forecasts in Conjunction with Facility Planning and Capacity Analysis
! Resources Review Council Work
! Other Needs?

Questions, Comments, Feedback and Suggestions
Thank you