
Origin Enterprises plc · About Origin Enterprises plc Origin Enterprises plc is a focused...
37
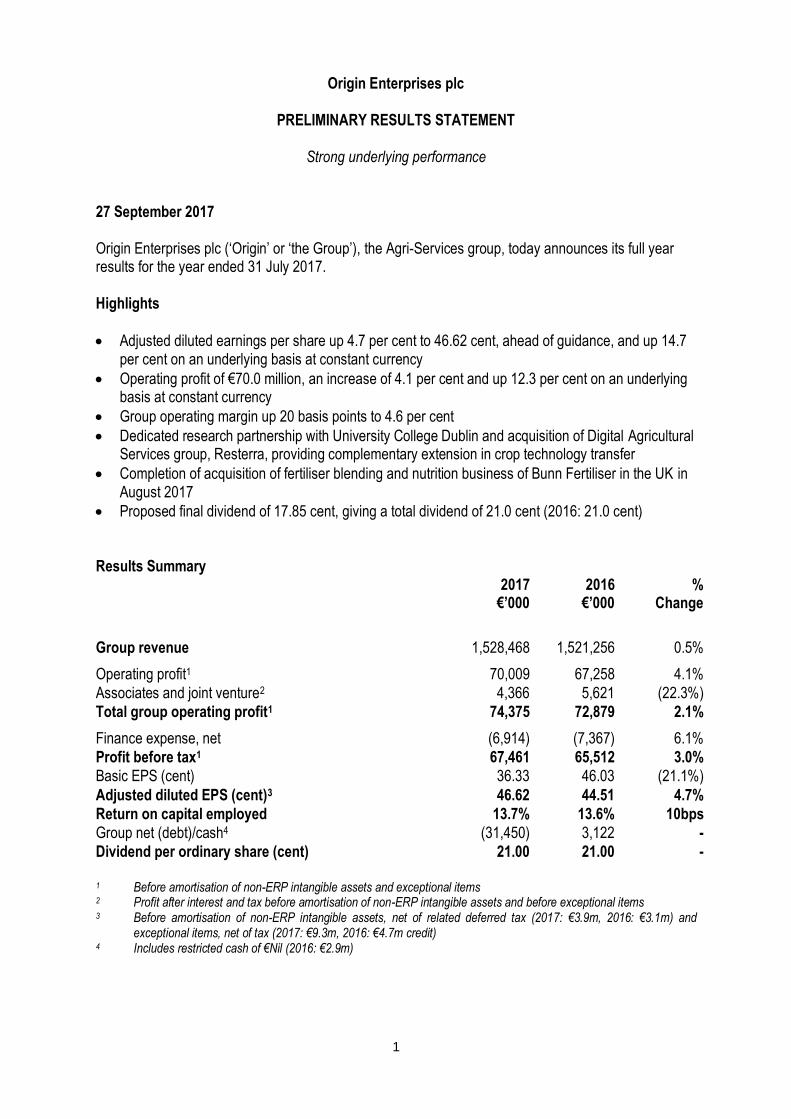
1 Origin Enterprises plc PRELIMINARY RESULTS STATEMENT Strong underlying performance 27 September 2017 Origin Enterprises plc (‘Origin’ or ‘the Group’), the Agri-Services group, today announces its full year results for the year ended 31 July 2017. Highlights Adjusted diluted earnings per share up 4.7 per cent to 46.62 cent, ahead of guidance, and up 14.7 per cent on an underlying basis at constant currency Operating profit of €70.0 million, an increase of 4.1 per cent and up 12.3 per cent on an underlying basis at constant currency Group operating margin up 20 basis points to 4.6 per cent Dedicated research partnership with University College Dublin and acquisition of Digital Agricultural Services group, Resterra, providing complementary extension in crop technology transfer Completion of acquisition of fertiliser blending and nutrition business of Bunn Fertiliser in the UK in August 2017 Proposed final dividend of 17.85 cent, giving a total dividend of 21.0 cent (2016: 21.0 cent) Results Summary 2017 €’000 2016 €’000 % Change Group revenue 1,528,468 1,521,256 0.5% Operating profit 1 70,009 67,258 4.1% Associates and joint venture 2 4,366 5,621 (22.3%) Total group operating profit 1 74,375 72,879 2.1% Finance expense, net (6,914) (7,367) 6.1% Profit before tax 1 67,461 65,512 3.0% Basic EPS (cent) 36.33 46.03 (21.1%) Adjusted diluted EPS (cent) 3 46.62 44.51 4.7% Return on capital employed 13.7% 13.6% 10bps Group net (debt)/cash 4 (31,450) 3,122 - Dividend per ordinary share (cent) 21.00 21.00 - 1 Before amortisation of non-ERP intangible assets and exceptional items 2 Profit after interest and tax before amortisation of non-ERP intangible assets and before exceptional items 3 Before amortisation of non-ERP intangible assets, net of related deferred tax (2017: €3.9m, 2016: €3.1m) and exceptional items, net of tax (2017: €9.3m, 2016: €4.7m credit) 4 Includes restricted cash of €Nil (2016: €2.9m)
Transcript of Origin Enterprises plc · About Origin Enterprises plc Origin Enterprises plc is a focused...
1
Origin Enterprises plc
PRELIMINARY RESULTS STATEMENT
Strong underlying performance
27 September 2017 Origin Enterprises plc (‘Origin’ or ‘the Group’), the Agri-Services group, today announces its full year results for the year ended 31 July 2017. Highlights
Adjusted diluted earnings per share up 4.7 per cent to 46.62 cent, ahead of guidance, and up 14.7 per cent on an underlying basis at constant currency
Operating profit of €70.0 million, an increase of 4.1 per cent and up 12.3 per cent on an underlying basis at constant currency
Group operating margin up 20 basis points to 4.6 per cent
Dedicated research partnership with University College Dublin and acquisition of Digital Agricultural Services group, Resterra, providing complementary extension in crop technology transfer
Completion of acquisition of fertiliser blending and nutrition business of Bunn Fertiliser in the UK in August 2017
Proposed final dividend of 17.85 cent, giving a total dividend of 21.0 cent (2016: 21.0 cent)
Results Summary 2017
€’000 2016
€’000 %
Change
Group revenue 1,528,468 1,521,256 0.5%
Operating profit1 70,009 67,258 4.1%
Associates and joint venture2 4,366 5,621 (22.3%)
Total group operating profit1 74,375 72,879 2.1%
Finance expense, net (6,914) (7,367) 6.1%
Profit before tax1 67,461 65,512 3.0%
Basic EPS (cent) 36.33 46.03 (21.1%)
Adjusted diluted EPS (cent)3 46.62 44.51 4.7%
Return on capital employed 13.7% 13.6% 10bps
Group net (debt)/cash4 (31,450) 3,122 -
Dividend per ordinary share (cent) 21.00 21.00 -
1 Before amortisation of non-ERP intangible assets and exceptional items 2 Profit after interest and tax before amortisation of non-ERP intangible assets and before exceptional items 3 Before amortisation of non-ERP intangible assets, net of related deferred tax (2017: €3.9m, 2016: €3.1m) and
exceptional items, net of tax (2017: €9.3m, 2016: €4.7m credit) 4 Includes restricted cash of €Nil (2016: €2.9m)
2
Commenting on the results, Origin’s Chief Executive Officer, Tom O’Mahony said:
“Origin has delivered a solid financial result in 2017, recording a 4.7 per cent increase in adjusted diluted earnings per share. While market conditions were highly competitive, a combination of sustained volume growth and higher margins underpinned a strong underlying business performance which more than offset the adverse currency translation impact of sterling depreciation.
Demand for agronomy services and inputs was positively influenced by a more stable near term planning environment for primary producers together with the benefit of generally settled weather leading to good crop planting and growing conditions.
We continue to prioritise growth opportunity in Agri-Services while also focusing on operational and commercial effectiveness. The acquisition development and innovation investments made during the year will broaden the Group’s service offer and capabilities in systemised crop technology transfer.
The Group is well positioned to capitalise on its scalable business platforms, development opportunities and strong balance sheet.”
ENDS
The preliminary results statement is available on the company website www.originenterprises.com. There will be a live conference call at 8.30am (GMT) today. To listen to this conference call, please dial the number below. Participants are requested to dial in 5 to 10 minutes prior to the scheduled start time. Confirmation Code: 1203818 Participant access number: Dublin: Tel: +353 (0)1 486 0921 UK/International: Tel: +44 (0)20 3427 1903 Replay: A replay of this call will be available for seven days. Replay Access Code: 1203818 Replay Access Numbers: Dublin: Tel: +353 (0)1 533 9810 UK/International: Tel: +44 (0)20 7984 7568
3
Enquiries: Origin Enterprises plc Imelda Hurley Chief Financial Officer Tel: +353 (0)1 563 4959 Andrew Mills Investor Relations Officer Tel: +353 (0)1 563 4900 Goodbody (ESM Adviser) Siobhan Wall Tel: +353 (0)1 641 6019 Davy (Nominated Adviser) Anthony Farrell Tel: +353 (0)1 614 9993 Powerscourt Jack Hickey (Ireland) Tel: +353 (0)83 448 8339 Rob Greening (UK) Tel: +44 (0)207 250 1446 About Origin Enterprises plc Origin Enterprises plc is a focused Agri-Services group providing specialist On-Farm Agronomy Services, Digital Agricultural Services and the supply of crop technologies and inputs. The Group has leading market positions in Ireland, the United Kingdom, Poland, Romania and Ukraine. Origin is listed on the ESM and AIM markets of the Irish and London Stock Exchanges. ESM ticker symbol: OIZ AIM ticker symbol: OGN Website: www.originenterprises.com
4
Financial Review - Summary
2017
€’000 2016
€’000
Group revenue 1,528,468 1,521,256 Operating profit1 70,009 67,258
Associates and joint venture, net2 4,366 5,621 Group operating profit1 74,375 72,879
Finance costs, net (6,914) (7,367) Pre-tax profits 67,461 65,512 Income tax (8,636) (9,393)
Adjusted net profit 58,825 56,119 Adjusted diluted EPS (cent)3 46.62 44.51
Operating margin1 Return on capital employed
4.6% 13.7%
4.4% 13.6%
Adjusted net profit reconciliation Reported net profit 45,620 57,801 Amortisation of non-ERP intangible assets 4,837 4,294
Tax on amortisation of non-ERP related intangible assets (934) (1,242) Exceptional items (net of tax) 9,302 (4,734)
Adjusted net profit 58,825 56,119 Adjusted diluted EPS (cent)3 46.62 44.51
Origin delivered a 4.7 per cent increase in adjusted diluted earnings per share3 for the year ending 31 July 2017 to 46.62 cent. On a like-for-like basis (adjusted for the impact of currency movements and acquisitions) there was an underlying increase in adjusted diluted earnings per share of 14.7 per cent. Group revenue Group revenue comprises the totality of revenue from the Group’s wholly owned operations which are based in Ireland, the United Kingdom, Poland, Romania and Ukraine. These businesses provide Integrated Agronomy and On-Farm Services, Business-to-Business Agri-Inputs and Digital Agricultural Services. Group revenue increased to €1,528.5 million from €1,521.3 million in the prior year, an increase of 0.5 per cent. On an underlying basis at constant currency, revenue increased by €51.6 million (3.4 per cent), with this movement principally reflecting increased service revenue and input volumes. Underlying volume growth in agronomy services and inputs (excluding crop marketing volumes) was 5.11 per cent for the year.
5
Operating profit1 Operating profit1 amounted to €70.0 million compared to €67.3 million in the previous year, an increase of 4.1 per cent. On an underlying basis at constant currency, operating profit1 increased by €8.3 million (12.3 per cent). This increase was primarily driven by higher volumes in agronomy services and inputs together with improved year-on-year margins. The Group operating margin has increased from 4.4 per cent to 4.6 per cent. Associates and joint venture2 Origin’s share of the profit after interest and taxation from associates and joint venture amounted to €4.4 million in the period. Finance costs and net debt Net finance costs amounted to €6.9 million, a decrease of €0.5 million (6.1 per cent) on the prior year level. Average net debt amounted to €217.0 million compared to €190.0 million last year. Actual net debt at 31 July 2017 was €31.5 million4 compared to actual net cash of €3.1 million4 at the end of the previous year. The year-on-year movement in average net debt is driven largely by the timing of the 2016 acquisitions in Continental Europe. The year-on-year movement in year end net debt is driven primarily by the current year acquisition spend of €25.5 million and the timing of working capital movements. Origin’s financial position remains strong. At year end the Group had unsecured committed banking facilities of €430 million (2016: €430 million), of which €400m million will expire in May 2022 and €30 million will expire in September 2018. At year end our key banking covenants are as follows: Banking
Covenant 2017
Times 2016
Times
Net debt to EBITDA Maximum 3.5 0.49 -5
EBITDA to net interest Minimum 3.0 11.45 11.06
Working capital For the year ended 31 July 2017, there was working capital outflow of €26.0 million. Investment in working capital remains a key area of focus for the Group given the associated funding costs. The year end represents the low point in the working capital cycle for the Group reflecting the seasonality of the business.
6
Adjusted diluted earnings per share (‘EPS’)3 EPS3 amounted to 46.62 cent per share, an increase of 4.7 per cent from 2016. This movement was driven by an increase in like-for-like underlying profits of 14.7 per cent, along with the positive impact of acquisitions of 1.4 per cent. This was partly offset by an 11.4 per cent reduction in EPS as a result of foreign currency translation, most notably the translation of sterling earnings into euro. Return on capital employed 2017 2016
Return on capital employed 13.7% 13.6%
Return on capital employed is a key performance indicator for the Group and represents Group earnings before interest, tax and amortisation of non-ERP related intangible assets from continuing operations (“EBITA”) taken as a percentage of the Group Net Assets. For the purposes of this calculation : (i) EBITA includes the net profit contribution from associates and joint venture (after interest and tax)
and excludes the impact of exceptional and non-recurring items. (ii) Group Net Assets means total assets less total liabilities as shown in the annual report excluding
net debt, derivative financial instruments, put option liabilities, accumulated amortisation of non-ERP related intangible assets and taxation related balances. Net Assets are also adjusted to reflect the average level of acquisition investment spend and the average level of working capital for the accounting period.
Exceptional items Exceptional items net of tax amounted to €9.3 million in the year. These principally relate to restructuring costs in the UK, along with acquisition and integration costs and are summarised in the table below:
2017 €’m
Rationalisation costs, net 8.3 Net transaction and other related costs 2.1
Organisation design costs 1.6 Fair value adjustment on put option liability (2.7)
Total exceptional items, net of tax 9.3
7
New reporting segments In recognition of the increased size of the Group’s operations in Continental Europe, a series of changes have been made to internal reporting structures to reflect better how performance is managed, and the Group will now have two separate reporting segments as set out below. Ireland and the United Kingdom This segment includes the Group’s wholly owned Irish and UK based Business-to-Business Agri-Input operations, Integrated Agronomy and On-Farm Service operations and Digital Agricultural Services business. In addition, this segment includes the Group’s associates and joint venture undertakings. Continental Europe This segment includes the Group’s operations in Poland, Romania and Ukraine. Dividend The Board recommends a final dividend of 17.85 cent per ordinary share which, when combined with the interim dividend of 3.15 cent per ordinary share, brings the total dividend for the year to 21.0 cent per ordinary share (2016: 21.0 cent). Subject to shareholder approval at the Annual General Meeting, this final dividend will be paid on 15 December 2017 to shareholders on the register on 1 December 2017. Brexit It is too early to assess the longer term implications of Brexit following the UK referendum vote in 2016 to leave the European Union. The Group recognises the period of uncertainty that currently exists until greater clarity on the final outcomes of the Brexit negotiations emerge, notably in relation to the implications for UK domestic agricultural policy, regulation and the future trading relationship between the UK and the European Union. The Group is planning a variety of scenarios which will be updated as Brexit outcomes become clearer. We continue to progress a number of strategic initiatives aimed at providing long term sustainable benefits to the Group. We are confident that our business model is well placed to address the challenges and opportunities that may arise. Investor relations The Group continues to focus on effective communications with shareholders. Contact with institutional shareholders is the responsibility of the Chief Executive Officer, Chief Financial Officer and Investor Relations Officer. During the year there were 165 meetings / conference calls with institutional investors across nine financial centres. A visit to Throws Farm Technology Centre in the UK took place, focusing on Origin’s direct farm crop research and knowledge transfer capabilities, together with an overview of the Group’s Business-to-Business Agri-Inputs business. This visit built on the Group’s first Capital Markets Day in 2016. Following a selection process the Group announces today the appointment of Numis as our London-based Broker.
8
Annual General Meeting (AGM) The AGM will be held on 24 November 2017 at 11.00 a.m. in the Westbury Hotel, Grafton Street, Dublin 2. 1 Before amortisation of non-ERP intangible assets and exceptional items 2 Profit after interest and tax before amortisation of non-ERP intangible assets and before exceptional items 3 Before amortisation of non-ERP intangible assets, net of related deferred tax (2017: €3.9m, 2016: €3.1m) and
exceptional items, net of tax (2017: €9.3m, 2016: €4.7m credit) 4 Includes restricted cash of €Nil (2016: €2.9m) 5 The Group was in a net cash position in 2016
9
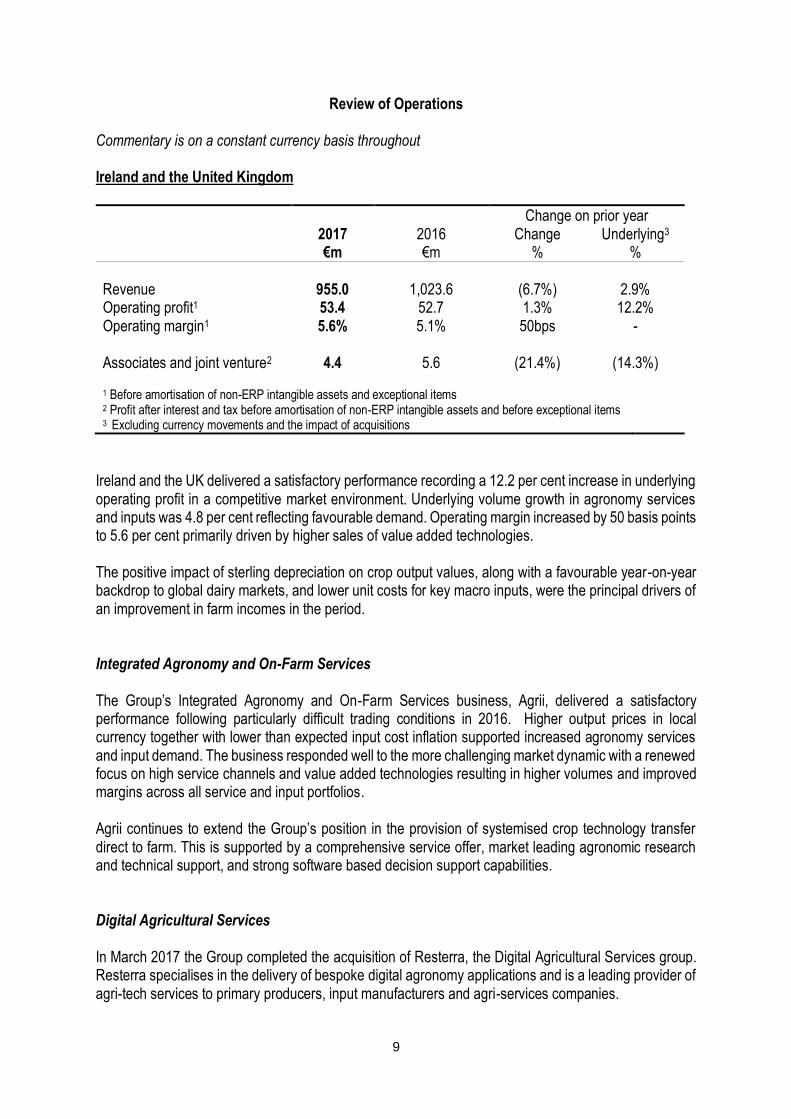
Review of Operations Commentary is on a constant currency basis throughout Ireland and the United Kingdom
Change on prior year 2017
€m 2016 €m
Change %
Underlying3 %
Revenue 955.0 1,023.6 (6.7%) 2.9% Operating profit1 53.4 52.7 1.3% 12.2% Operating margin1 5.6% 5.1% 50bps - Associates and joint venture2 4.4 5.6 (21.4%) (14.3%) 1 Before amortisation of non-ERP intangible assets and exceptional items 2 Profit after interest and tax before amortisation of non-ERP intangible assets and before exceptional items 3 Excluding currency movements and the impact of acquisitions
Ireland and the UK delivered a satisfactory performance recording a 12.2 per cent increase in underlying operating profit in a competitive market environment. Underlying volume growth in agronomy services and inputs was 4.8 per cent reflecting favourable demand. Operating margin increased by 50 basis points to 5.6 per cent primarily driven by higher sales of value added technologies. The positive impact of sterling depreciation on crop output values, along with a favourable year-on-year backdrop to global dairy markets, and lower unit costs for key macro inputs, were the principal drivers of an improvement in farm incomes in the period. Integrated Agronomy and On-Farm Services The Group’s Integrated Agronomy and On-Farm Services business, Agrii, delivered a satisfactory performance following particularly difficult trading conditions in 2016. Higher output prices in local currency together with lower than expected input cost inflation supported increased agronomy services and input demand. The business responded well to the more challenging market dynamic with a renewed focus on high service channels and value added technologies resulting in higher volumes and improved margins across all service and input portfolios. Agrii continues to extend the Group’s position in the provision of systemised crop technology transfer direct to farm. This is supported by a comprehensive service offer, market leading agronomic research and technical support, and strong software based decision support capabilities. Digital Agricultural Services In March 2017 the Group completed the acquisition of Resterra, the Digital Agricultural Services group. Resterra specialises in the delivery of bespoke digital agronomy applications and is a leading provider of agri-tech services to primary producers, input manufacturers and agri-services companies.
10
Strong progress on integration in the period has complemented a very satisfactory financial performance from Digital Agricultural Services. Priority focus areas since the acquisition of Resterra have included the development of new agronomy applications, organisational design and the launch of precision farming services across Origin’s Continental European footprint. Business-to-Business Agri-Inputs Business-to-Business Agri-Inputs delivered good growth in operating profits in the period with performance principally supported by higher volumes and margins in fertiliser. Fertiliser Strong early season demand drove higher volumes for the year as a whole as primary producers benefitted from greater certainty in raw material pricing and more favourable farm economics. Speciality nutrition applications maintained solid development momentum and underpinned improved margins in the period. The business is focused on addressing the evolving requirements of primary producers for balanced nutrition planning to restore soil health and optimise crop productivity. Our branded presence on-farm continues to be enhanced, for example, through technologies that facilitate the effective delivery of essential trace elements to animals and arable crops using prescription fertiliser applications. Amenity Origin Amenity, which incorporates a market leading portfolio of brands focused on the provision of management and maintenance solutions to the professional sports turf, landscaping, general amenity and niche grassland sectors in the UK, achieved a very satisfactory performance in the year reflecting good underlying volume growth across all business channels. New customer development continues to be supported through the formation of industry leading partnerships together with comprehensive product development and formulation capabilities, enabling the business to meet the requirements for new and innovative integrated turf improvement programmes. The integration of Headland Amenity, acquired in 2016, was successfully completed in the period. In July 2017 the Group acquired Linemark in the UK. Linemark is an innovative market leader in advanced sports and amenity marking solutions. The acquisition enhances the existing service offer as well as providing new customer extension opportunity.
Feed Ingredients
Feed Ingredients achieved a satisfactory performance underpinned by good volume growth in competitive trading conditions. Volume improvement largely reflects a more favourable demand backdrop resulting from a combination of higher dairy cow numbers and improved returns for grassland farm enterprises that are seeking to maximise milk production following the abolition of production quotas in 2015.
11
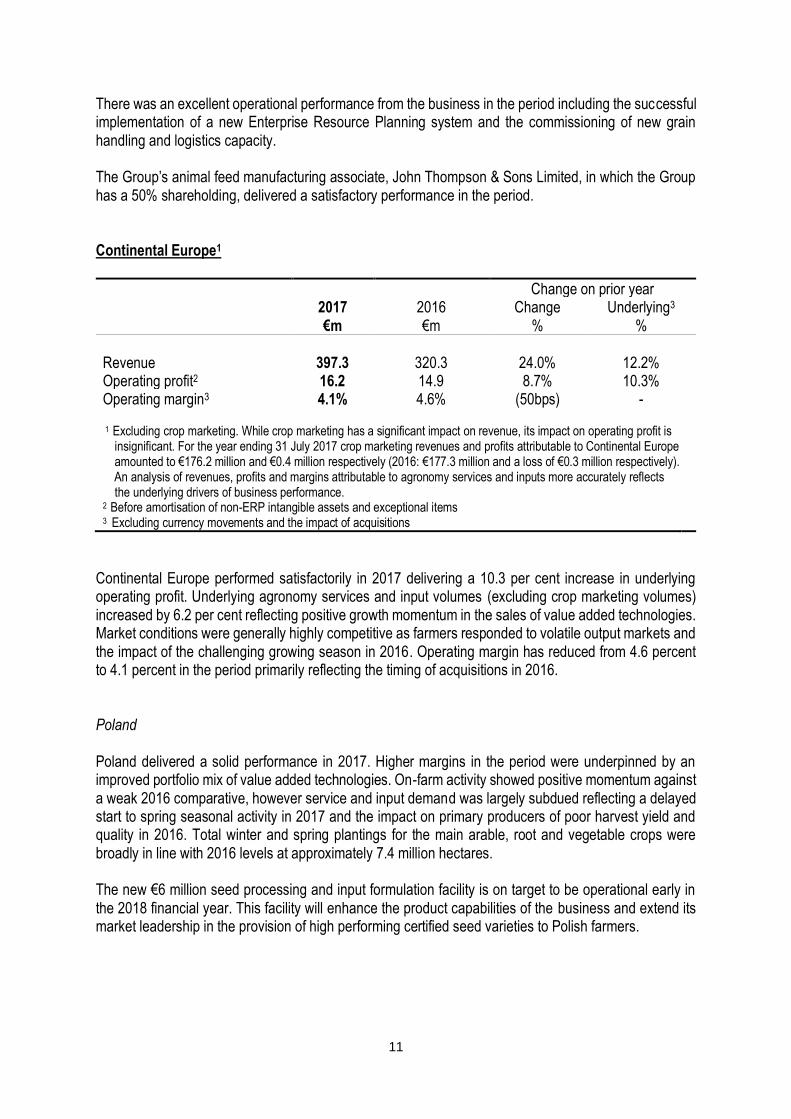
There was an excellent operational performance from the business in the period including the successful implementation of a new Enterprise Resource Planning system and the commissioning of new grain handling and logistics capacity. The Group’s animal feed manufacturing associate, John Thompson & Sons Limited, in which the Group has a 50% shareholding, delivered a satisfactory performance in the period. Continental Europe1
Change on prior year 2017
€m 2016 €m
Change %
Underlying3 %
Revenue 397.3 320.3 24.0% 12.2% Operating profit2 16.2 14.9 8.7% 10.3% Operating margin3 4.1% 4.6% (50bps) - 1 Excluding crop marketing. While crop marketing has a significant impact on revenue, its impact on operating profit is
insignificant. For the year ending 31 July 2017 crop marketing revenues and profits attributable to Continental Europe amounted to €176.2 million and €0.4 million respectively (2016: €177.3 million and a loss of €0.3 million respectively).
An analysis of revenues, profits and margins attributable to agronomy services and inputs more accurately reflects the underlying drivers of business performance.
2 Before amortisation of non-ERP intangible assets and exceptional items 3 Excluding currency movements and the impact of acquisitions
Continental Europe performed satisfactorily in 2017 delivering a 10.3 per cent increase in underlying operating profit. Underlying agronomy services and input volumes (excluding crop marketing volumes) increased by 6.2 per cent reflecting positive growth momentum in the sales of value added technologies. Market conditions were generally highly competitive as farmers responded to volatile output markets and the impact of the challenging growing season in 2016. Operating margin has reduced from 4.6 percent to 4.1 percent in the period primarily reflecting the timing of acquisitions in 2016. Poland Poland delivered a solid performance in 2017. Higher margins in the period were underpinned by an improved portfolio mix of value added technologies. On-farm activity showed positive momentum against a weak 2016 comparative, however service and input demand was largely subdued reflecting a delayed start to spring seasonal activity in 2017 and the impact on primary producers of poor harvest yield and quality in 2016. Total winter and spring plantings for the main arable, root and vegetable crops were broadly in line with 2016 levels at approximately 7.4 million hectares. The new €6 million seed processing and input formulation facility is on target to be operational early in the 2018 financial year. This facility will enhance the product capabilities of the business and extend its market leadership in the provision of high performing certified seed varieties to Polish farmers.
12
Romania Romania delivered a strong performance in the period with good growth achieved across the principal sales channels. Demand was resilient in the case of the main cropping enterprises underpinned by a 2 per cent increase in the total arable, root and vegetable cropping area to approximately 6.6 million hectares. Crop development was satisfactory, notwithstanding the impact of intermittent unseasonal weather patterns in the third quarter. Nutrition portfolios performed strongly in 2017 reflecting the focus on meeting demand from primary producers for improved ranges and speciality applications. Good progress was achieved in business integration with the continued development of trial demonstration farms and knowledge transfer infrastructure supporting the delivery of enhanced technical support on-farm. Ukraine Ukraine delivered a good performance in the period, achieving higher revenues and margins underpinned by a favourable portfolio mix of services and input technologies.
An improved macro-economic backdrop contributed to a more favourable financing environment for primary producers. Total winter and spring plantings for the main arable, root and vegetable crops were broadly in line with 2016 levels at approximately 22.0 million hectares.
Soil fertility and seed technology applications maintained good growth momentum with new customer gains supported through an expansion of the agronomy sales force together with an extension of the regional distribution footprint of the business. Solid progress has been made during the year leveraging the Group’s supply chain partnerships to secure access to high specification techno logies.
Other Developments During the year, Origin continued its investments in innovation with the appointment of Professor Jimmy Burke as Head of Research and Knowledge Transfer. The Group also announced the establishment of a dedicated digital, precision agriculture and crop science collaborative research partnership with University College Dublin, supported by Science Foundation Ireland (‘SFI’). This five year development programme underpinning the research partnership is being financed by a €17.6 million investment which is co-funded by Origin and SFI. Origin announced in March that it had reached agreement to acquire the fertiliser blending and nutrition business of Bunn Fertiliser in the UK. Bunn is a leading provider of prescription fertiliser blends and nutrition management systems servicing arable, grassland and horticultural enterprises. In August 2017, Origin announced the completion of this transaction following the acceptance by the Competition and Markets Authority of a number of undertakings provided by Origin, including the disposal of one Bunn fertiliser blending facility.
13
Outlook While we anticipate a stable operating environment for primary producers in 2018, farm sentiment is expected to remain cautious reflecting general volatility in output markets. Origin remains focused on capturing growth opportunity in systemised crop technology transfer and is well positioned to capitalise on its scalable business platforms, development opportunities and strong balance sheet.
ENDS
14
Origin Enterprises plc
Consolidated Income Statement For the financial year ended 31 July 2017
Pre- Pre-
exceptional Exceptional Total exceptional Exceptional Total
2017 2017 2017 2016 2016 2016
€’000 €'000 €'000 €’000 €'000 €'000
Notes (Note 3) (Note 3)
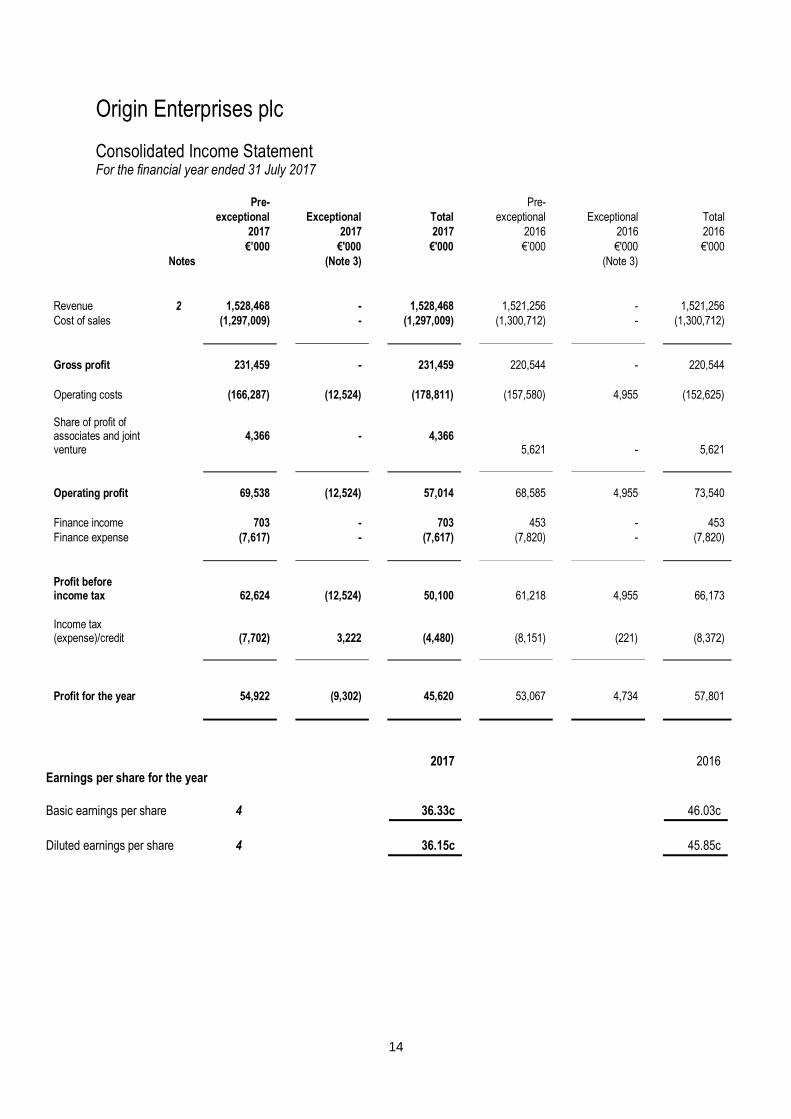
Revenue 2 1,528,468 - 1,528,468 1,521,256 - 1,521,256
Cost of sales (1,297,009) - (1,297,009) (1,300,712) - (1,300,712)
Gross profit 231,459 - 231,459 220,544 - 220,544
Operating costs
(166,287) (12,524) (178,811) (157,580) 4,955 (152,625)
Share of profit of associates and joint venture
4,366
-
4,366
5,621
-
5,621
Operating profit 69,538 (12,524) 57,014 68,585 4,955 73,540
Finance income 703 - 703 453 - 453
Finance expense (7,617) - (7,617) (7,820) - (7,820)
Profit before income tax
62,624
(12,524)
50,100
61,218
4,955
66,173
Income tax (expense)/credit
(7,702)
3,222
(4,480)
(8,151)
(221)
(8,372)
Profit for the year
54,922
(9,302)
45,620
53,067
4,734
57,801
2017 2016
Earnings per share for the year
Basic earnings per share 4 36.33c 46.03c
Diluted earnings per share 4 36.15c 45.85c
15
Origin Enterprises plc
Consolidated Statement of Comprehensive Income For the financial year ended 31 July 2017
2017 2016
€'000 €'000
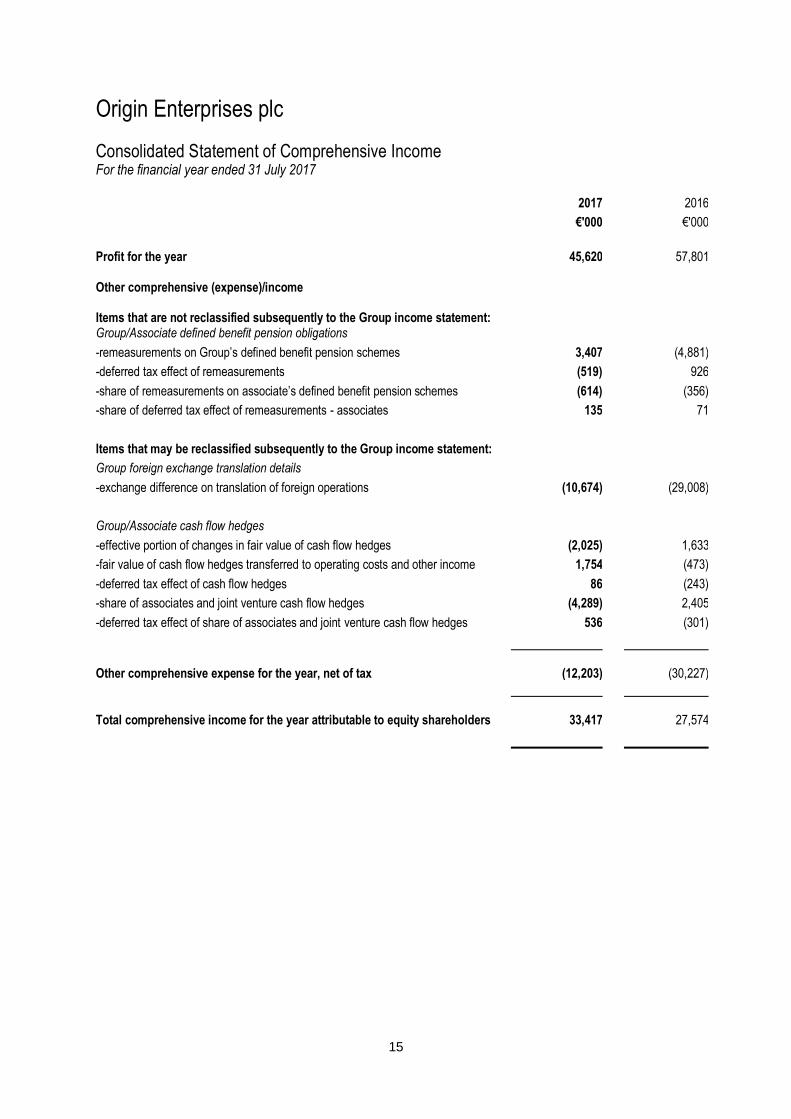
Profit for the year 45,620 57,801 Other comprehensive (expense)/income Items that are not reclassified subsequently to the Group income statement: Group/Associate defined benefit pension obligations
-remeasurements on Group’s defined benefit pension schemes 3,407 (4,881)
-deferred tax effect of remeasurements (519) 926
-share of remeasurements on associate’s defined benefit pension schemes (614) (356)
-share of deferred tax effect of remeasurements - associates 135 71
Items that may be reclassified subsequently to the Group income statement:
Group foreign exchange translation details
-exchange difference on translation of foreign operations (10,674) (29,008)
Group/Associate cash flow hedges
-effective portion of changes in fair value of cash flow hedges (2,025) 1,633
-fair value of cash flow hedges transferred to operating costs and other income 1,754 (473)
-deferred tax effect of cash flow hedges 86 (243)
-share of associates and joint venture cash flow hedges (4,289) 2,405
-deferred tax effect of share of associates and joint venture cash flow hedges 536 (301)
Other comprehensive expense for the year, net of tax (12,203) (30,227)
Total comprehensive income for the year attributable to equity shareholders 33,417 27,574
16
Origin Enterprises plc
Consolidated Statement of Financial Position As at 31 July 2017
2017 2016
Notes €'000 €'000
ASSETS
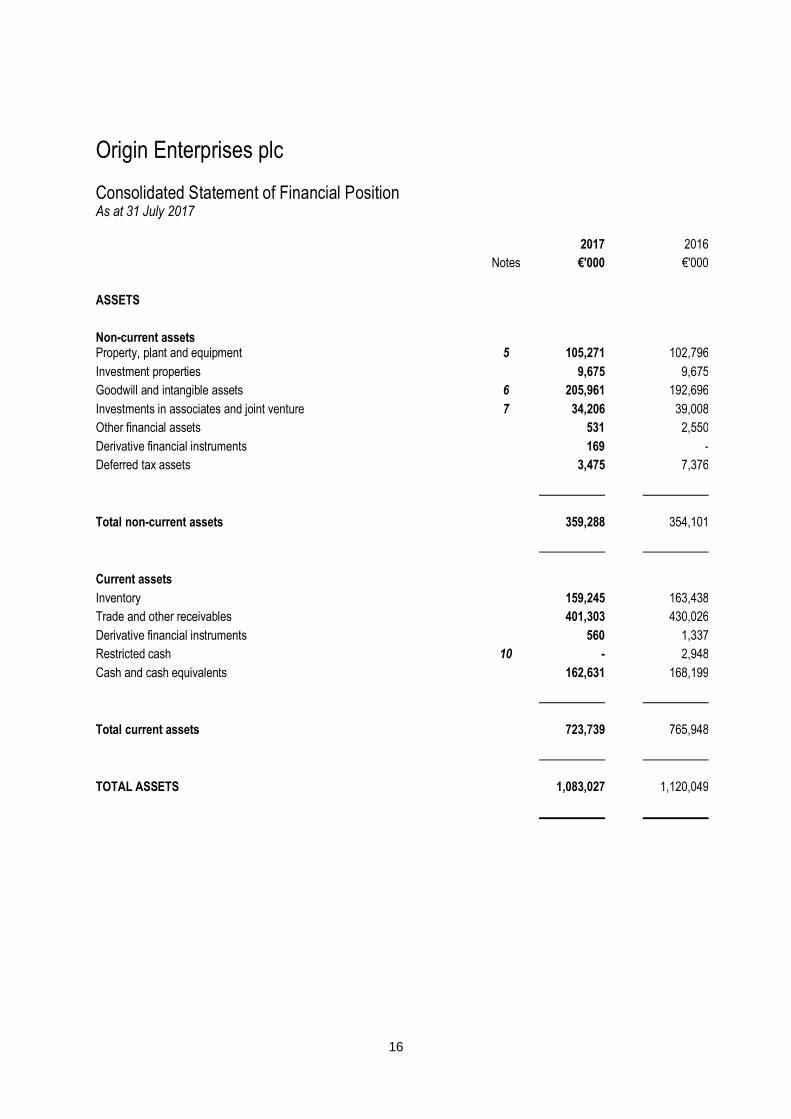
Non-current assets Property, plant and equipment 5 105,271 102,796
Investment properties 9,675 9,675
Goodwill and intangible assets 6 205,961 192,696
Investments in associates and joint venture 7 34,206 39,008
Other financial assets 531 2,550
Derivative financial instruments 169 -
Deferred tax assets 3,475 7,376
Total non-current assets 359,288 354,101
Current assets
Inventory 159,245 163,438
Trade and other receivables 401,303 430,026
Derivative financial instruments 560 1,337
Restricted cash 10 - 2,948
Cash and cash equivalents 162,631 168,199
Total current assets 723,739 765,948
TOTAL ASSETS 1,083,027 1,120,049
17
Origin Enterprises plc
Consolidated Statement of Financial Position (continued) As at 31 July 2017
2017 2016
Notes €'000 €'000
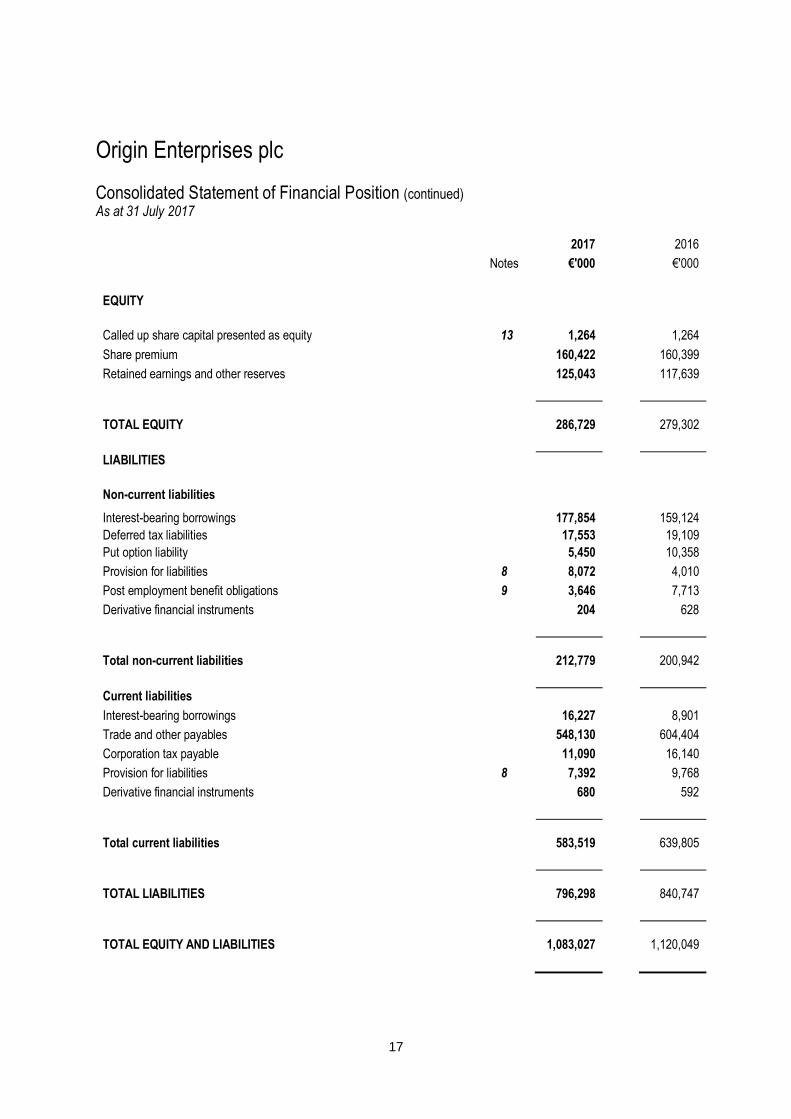
EQUITY
Called up share capital presented as equity 13 1,264 1,264
Share premium 160,422 160,399
Retained earnings and other reserves 125,043 117,639
TOTAL EQUITY 286,729 279,302
LIABILITIES
Non-current liabilities
Interest-bearing borrowings 177,854 159,124
Deferred tax liabilities 17,553 19,109
Put option liability 5,450 10,358
Provision for liabilities 8 8,072 4,010
Post employment benefit obligations 9 3,646 7,713
Derivative financial instruments 204 628
Total non-current liabilities 212,779 200,942
Current liabilities
Interest-bearing borrowings 16,227 8,901
Trade and other payables 548,130 604,404
Corporation tax payable 11,090 16,140
Provision for liabilities 8 7,392 9,768
Derivative financial instruments 680 592
Total current liabilities 583,519 639,805
TOTAL LIABILITIES 796,298 840,747
TOTAL EQUITY AND LIABILITIES 1,083,027 1,120,049
18
Origin Enterprises plc
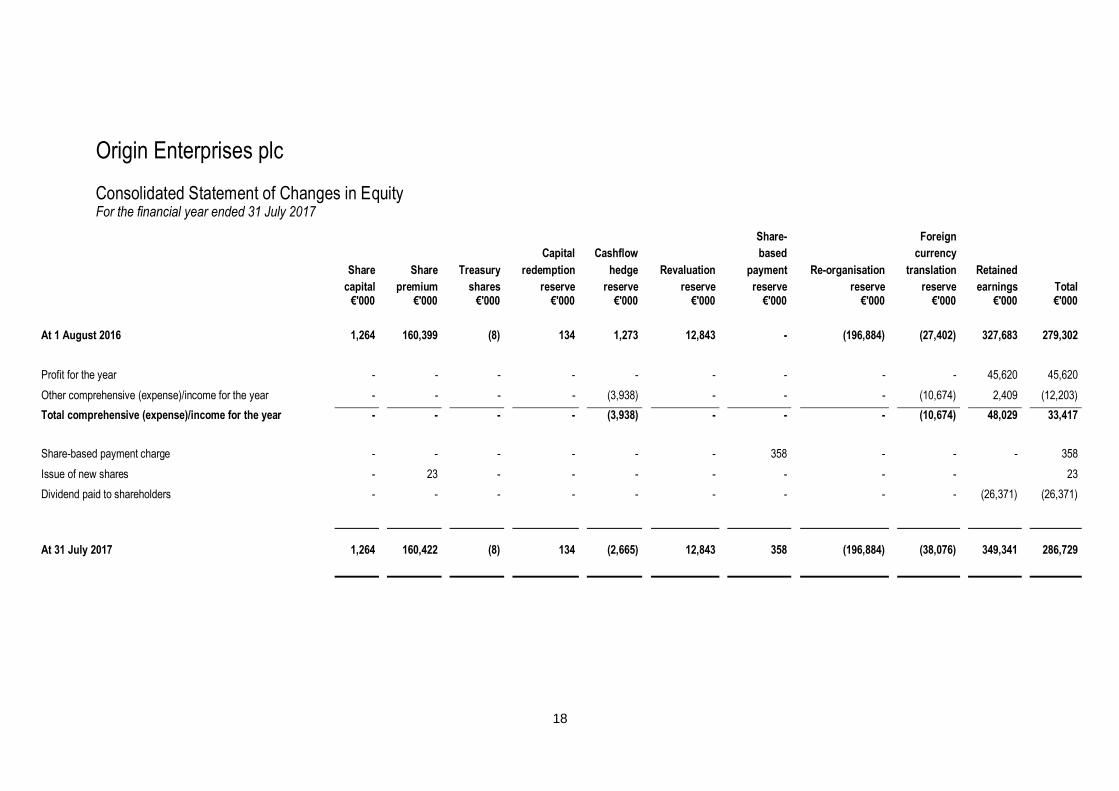
Consolidated Statement of Changes in Equity For the financial year ended 31 July 2017
Share- Foreign Capital Cashflow based currency Share Share Treasury redemption hedge Revaluation payment Re-organisation translation Retained capital premium shares reserve reserve reserve reserve reserve reserve earnings Total €'000 €'000 €'000 €'000 €'000 €'000 €'000 €'000 €'000 €'000 €'000
At 1 August 2016 1,264 160,399 (8) 134 1,273 12,843 - (196,884) (27,402) 327,683 279,302
Profit for the year - - - - - - - - - 45,620 45,620
Other comprehensive (expense)/income for the year - - - - (3,938) - - - (10,674) 2,409 (12,203)
Total comprehensive (expense)/income for the year - - - - (3,938) - - - (10,674) 48,029 33,417
Share-based payment charge - - - - - - 358 - - - 358
Issue of new shares - 23 - - - - - - - 23
Dividend paid to shareholders - - - - - - - - - (26,371) (26,371)
At 31 July 2017 1,264 160,422 (8) 134 (2,665) 12,843 358 (196,884) (38,076) 349,341 286,729
19
Origin Enterprises plc
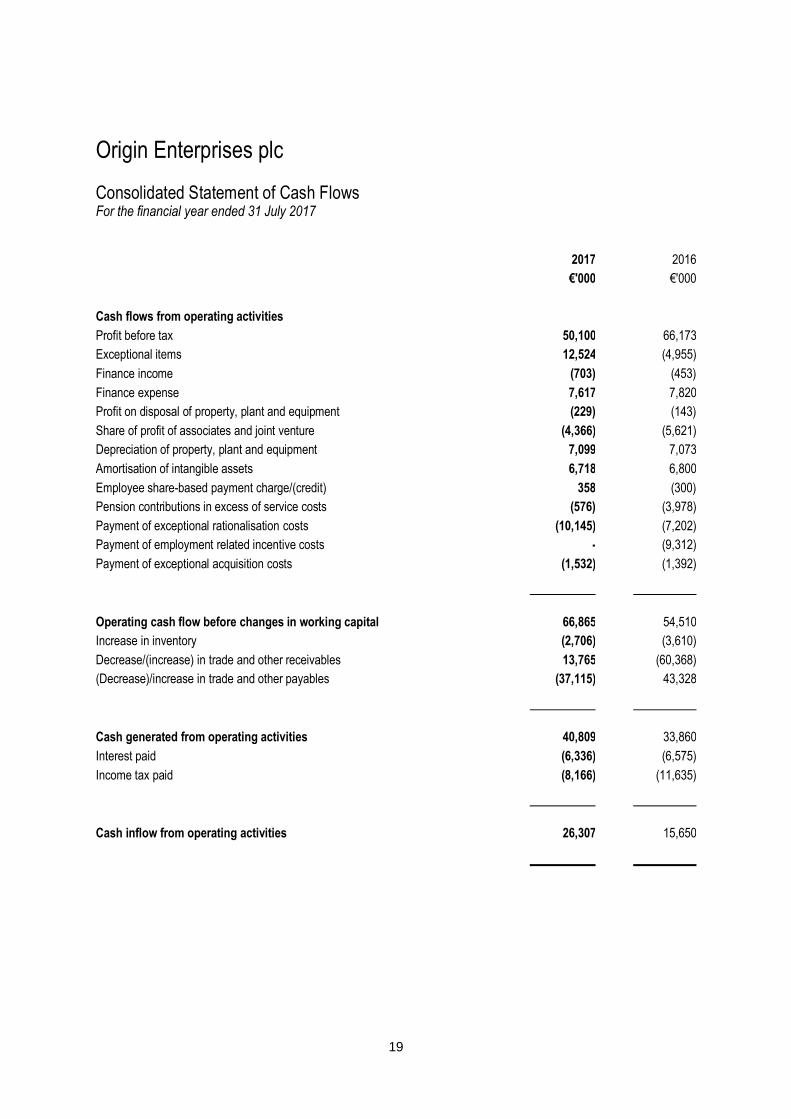
Consolidated Statement of Cash Flows For the financial year ended 31 July 2017
2017 2016
€'000 €'000
Cash flows from operating activities
Profit before tax 50,100 66,173
Exceptional items 12,524 (4,955)
Finance income (703) (453)
Finance expense 7,617 7,820
Profit on disposal of property, plant and equipment (229) (143)
Share of profit of associates and joint venture (4,366) (5,621)
Depreciation of property, plant and equipment 7,099 7,073
Amortisation of intangible assets 6,718 6,800
Employee share-based payment charge/(credit) 358 (300)
Pension contributions in excess of service costs (576) (3,978)
Payment of exceptional rationalisation costs (10,145) (7,202)
Payment of employment related incentive costs - (9,312)
Payment of exceptional acquisition costs (1,532) (1,392)
Operating cash flow before changes in working capital 66,865 54,510
Increase in inventory (2,706) (3,610)
Decrease/(increase) in trade and other receivables 13,765 (60,368)
(Decrease)/increase in trade and other payables (37,115) 43,328
Cash generated from operating activities 40,809 33,860
Interest paid (6,336) (6,575)
Income tax paid (8,166) (11,635)
Cash inflow from operating activities 26,307 15,650
20
Origin Enterprises plc
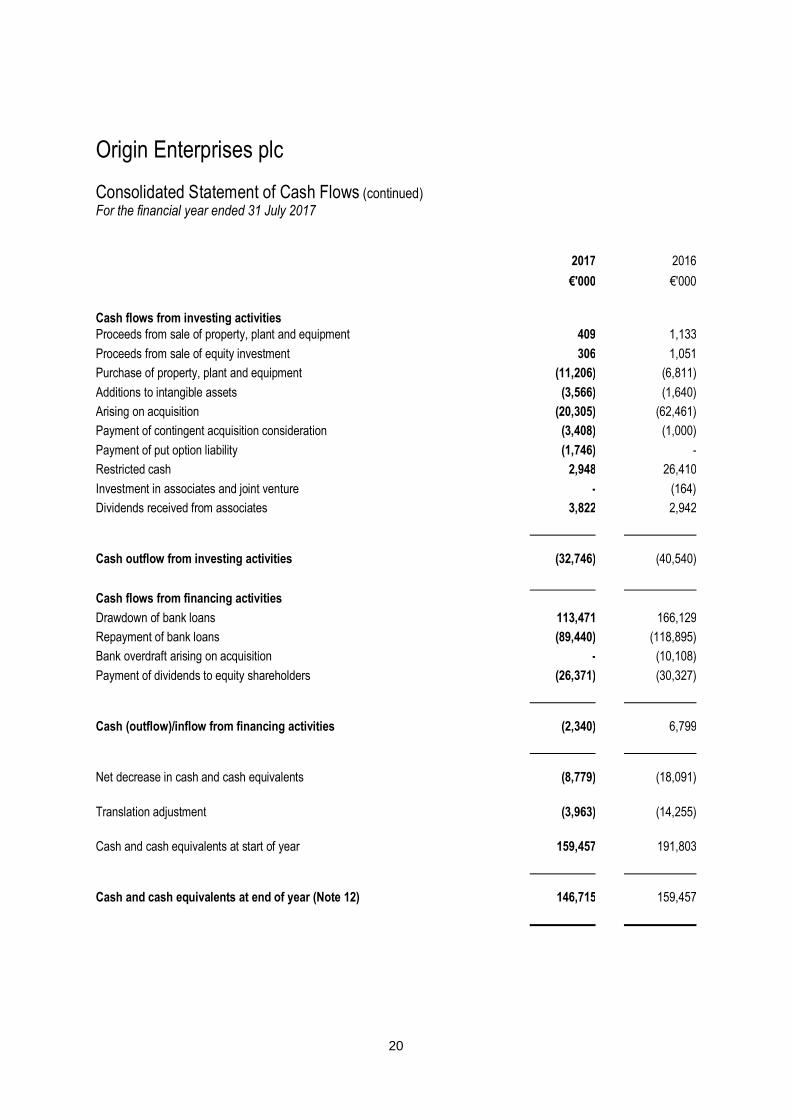
Consolidated Statement of Cash Flows (continued) For the financial year ended 31 July 2017
2017 2016
€'000 €'000
Cash flows from investing activities
Proceeds from sale of property, plant and equipment 409 1,133
Proceeds from sale of equity investment 306 1,051
Purchase of property, plant and equipment (11,206) (6,811)
Additions to intangible assets (3,566) (1,640)
Arising on acquisition (20,305) (62,461)
Payment of contingent acquisition consideration (3,408) (1,000)
Payment of put option liability (1,746) -
Restricted cash 2,948 26,410
Investment in associates and joint venture - (164)
Dividends received from associates 3,822 2,942
Cash outflow from investing activities (32,746) (40,540)
Cash flows from financing activities
Drawdown of bank loans 113,471 166,129
Repayment of bank loans (89,440) (118,895)
Bank overdraft arising on acquisition - (10,108)
Payment of dividends to equity shareholders (26,371) (30,327)
Cash (outflow)/inflow from financing activities (2,340) 6,799
Net decrease in cash and cash equivalents (8,779) (18,091)
Translation adjustment (3,963) (14,255)
Cash and cash equivalents at start of year 159,457 191,803
Cash and cash equivalents at end of year (Note 12) 146,715 159,457
21
Origin Enterprises plc
Notes to the preliminary results statement For the financial year ended 31 July 2017
1 Basis of preparation
The financial information included on pages 14 to 37 of this preliminary results statement has been extracted from the Group financial statements for the year ended 31 July 2017 on which the auditor has issued an unqualified audit opinion.
The financial information has been prepared in accordance with the accounting policies set out in the Group’s consolidated financial statements for the year ended 31 July 2017, which were prepared in accordance with International Financial Reporting Standards as adopted by the EU.
The consolidated financial information is presented in euro, rounded to the nearest thousand which is the functional currency of the parent.
2 Segment information
IFRS 8, ‘Operating Segments’ requires operating segments to be identified on the basis of internal reports that are regularly reviewed by the Chief Operating Decision Maker (‘CODM’) in order to allocate resources to the segments and to assess their performance. Following the acquisition of three businesses in Continental Europe during 2016 and subsequent restructuring of the Group’s business, the basis of segmentation was amended during the current financial year to reflect the new business model. The revised basis of segmentation is outlined in the paragraphs below but in all instances the changes were deemed necessary to better enable the CODM to evaluate the results of the business in the context of the economic environment in which the business operates, to make appropriate strategic decisions and to more accurately reflect the business model under which the Group now operates in each of these geographical regions. All comparative amounts have been restated to reflect the new basis of segmentation. The reclassification has no impact on revenue or operating profit reported by the Group.
Ireland and the United Kingdom
This segment includes the Group’s wholly owned Irish and UK based Business-to-Business Agri-Inputs operations, Integrated Agronomy and On-Farm Services operations and Digital Agricultural Services business. In addition, this segment includes the Group’s Associates and joint venture undertakings.
Continental Europe
This segment includes the Group’s Business-to-Business Agri-Inputs operations, Integrated Agronomy and On-Farm Services operations in Poland, Romania and the Ukraine. Information regarding the results of each reportable segment is included below. Performance is measured based on segment operating profit as included in the internal management reports that are reviewed by the Group’s CODM, being the Origin Executive Directors. Segment operating profit is used to measure performance, as this information is the most relevant in evaluating the results of the Group’s segments. Segment results include all items directly attributable to a segment.
22
Origin Enterprises plc
Notes to the preliminary results statement (continued) For the financial year ended 31 July 2017
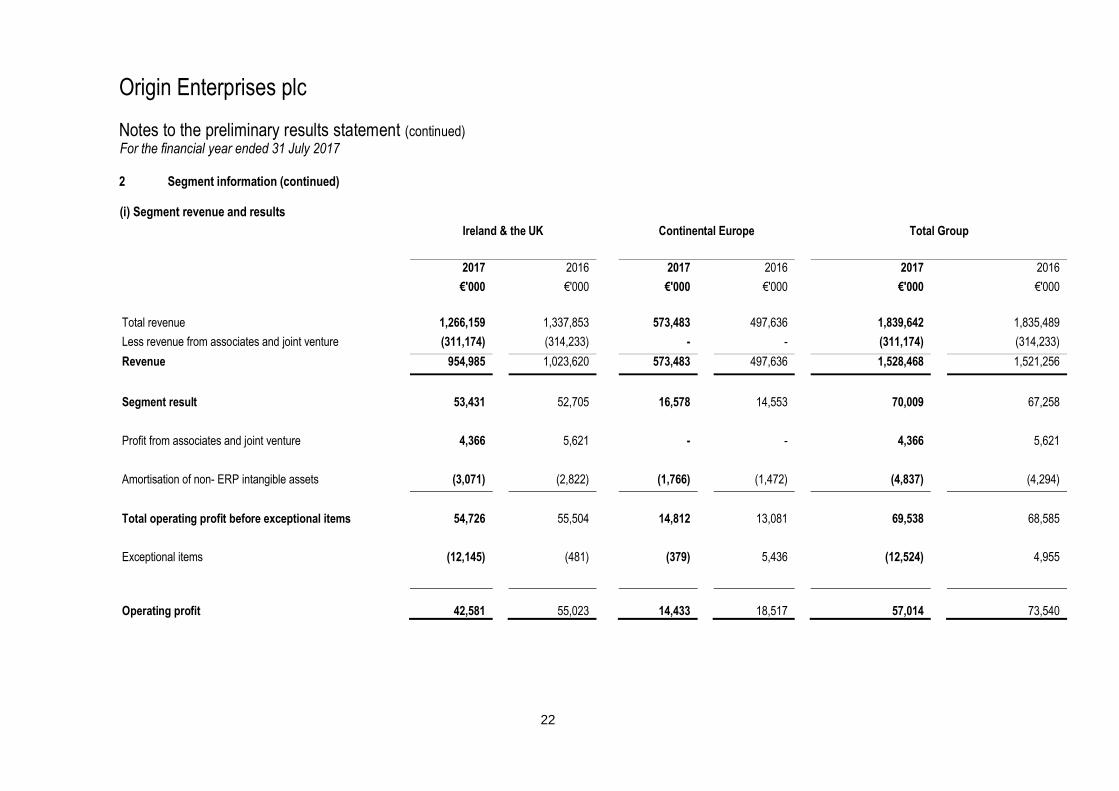
2 Segment information (continued) (i) Segment revenue and results
Ireland & the UK
Continental Europe Total Group
2017 2016 2017 2016 2017 2016
€'000 €'000 €'000 €'000 €'000 €'000
Total revenue 1,266,159 1,337,853 573,483 497,636 1,839,642 1,835,489
Less revenue from associates and joint venture (311,174) (314,233) - - (311,174) (314,233)
Revenue 954,985 1,023,620 573,483 497,636 1,528,468 1,521,256
Segment result 53,431 52,705 16,578 14,553 70,009 67,258
Profit from associates and joint venture 4,366 5,621 - - 4,366 5,621
Amortisation of non- ERP intangible assets (3,071) (2,822) (1,766) (1,472) (4,837) (4,294)
Total operating profit before exceptional items 54,726 55,504 14,812 13,081 69,538 68,585
Exceptional items (12,145) (481) (379) 5,436 (12,524) 4,955
Operating profit 42,581 55,023 14,433 18,517 57,014 73,540
23
Origin Enterprises plc
Notes to the preliminary results statement (continued) For the financial year ended 31 July 2017 2 Segment information (continued)
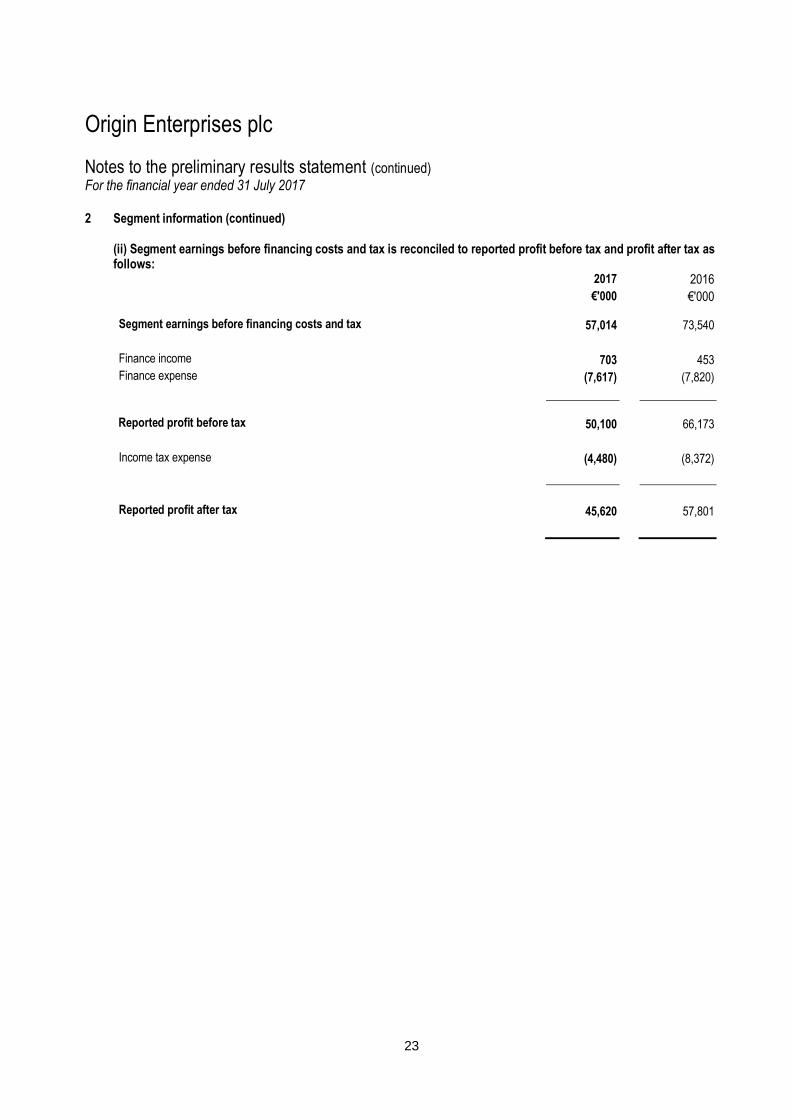
(ii) Segment earnings before financing costs and tax is reconciled to reported profit before tax and profit after tax as follows:
2017 2016
€'000 €'000
Segment earnings before financing costs and tax 57,014 73,540
Finance income 703 453
Finance expense (7,617) (7,820)
Reported profit before tax 50,100 66,173
Income tax expense (4,480) (8,372)
Reported profit after tax 45,620 57,801
24
Origin Enterprises plc
Notes to the preliminary results statement (continued)
For the financial year ended 31 July 2017
3 Exceptional items
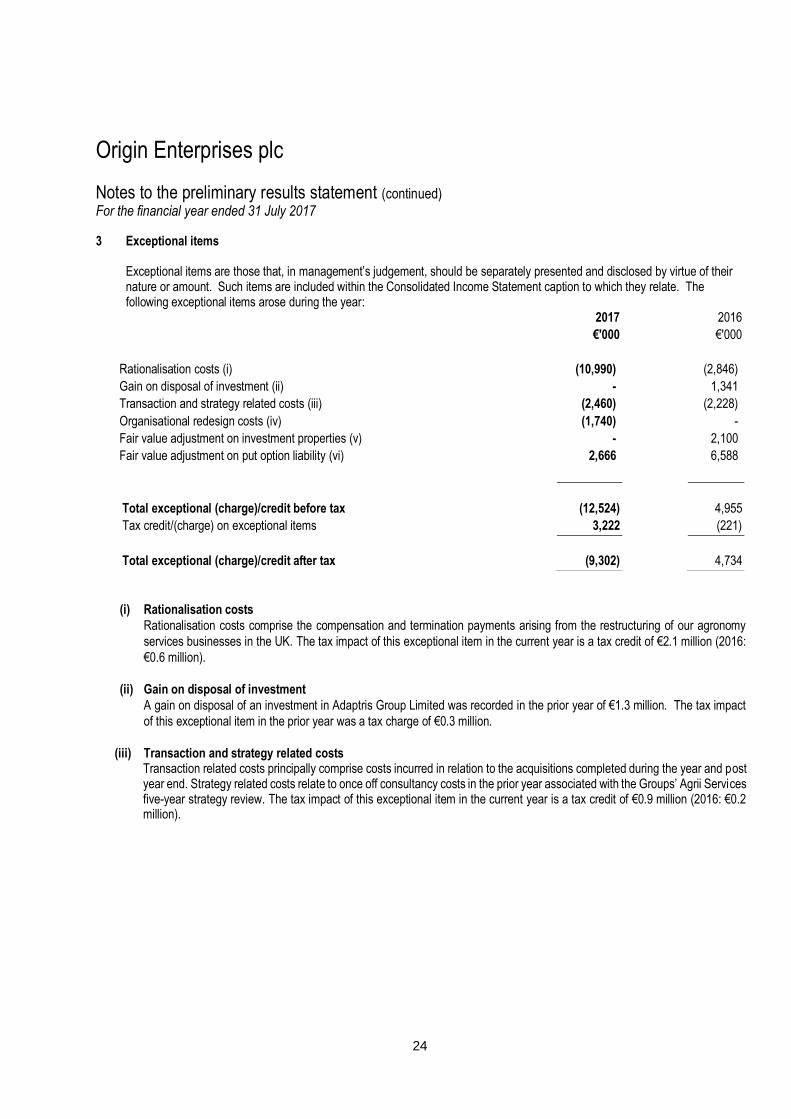
Exceptional items are those that, in management’s judgement, should be separately presented and disclosed by virtue of their nature or amount. Such items are included within the Consolidated Income Statement caption to which they relate. The following exceptional items arose during the year:
2017 2016
€'000 €'000
Rationalisation costs (i) (10,990) (2,846)
Gain on disposal of investment (ii) - 1,341
Transaction and strategy related costs (iii) (2,460) (2,228)
Organisational redesign costs (iv) (1,740) -
Fair value adjustment on investment properties (v) - 2,100
Fair value adjustment on put option liability (vi) 2,666 6,588
Total exceptional (charge)/credit before tax (12,524) 4,955
Tax credit/(charge) on exceptional items 3,222 (221)
Total exceptional (charge)/credit after tax (9,302) 4,734
(i) Rationalisation costs
Rationalisation costs comprise the compensation and termination payments arising from the restructuring of our agronomy
services businesses in the UK. The tax impact of this exceptional item in the current year is a tax credit of €2.1 million (2016:
€0.6 million).
(ii) Gain on disposal of investment
A gain on disposal of an investment in Adaptris Group Limited was recorded in the prior year of €1.3 million. The tax impact
of this exceptional item in the prior year was a tax charge of €0.3 million.
(iii) Transaction and strategy related costs Transaction related costs principally comprise costs incurred in relation to the acquisitions completed during the year and post year end. Strategy related costs relate to once off consultancy costs in the prior year associated with the Groups’ Agrii Services five-year strategy review. The tax impact of this exceptional item in the current year is a tax credit of €0.9 million (2016: €0.2 million).
25
Origin Enterprises plc
Notes to the preliminary results statement (continued) For the financial year ended 31 July 2017
3 Exceptional items (continued)
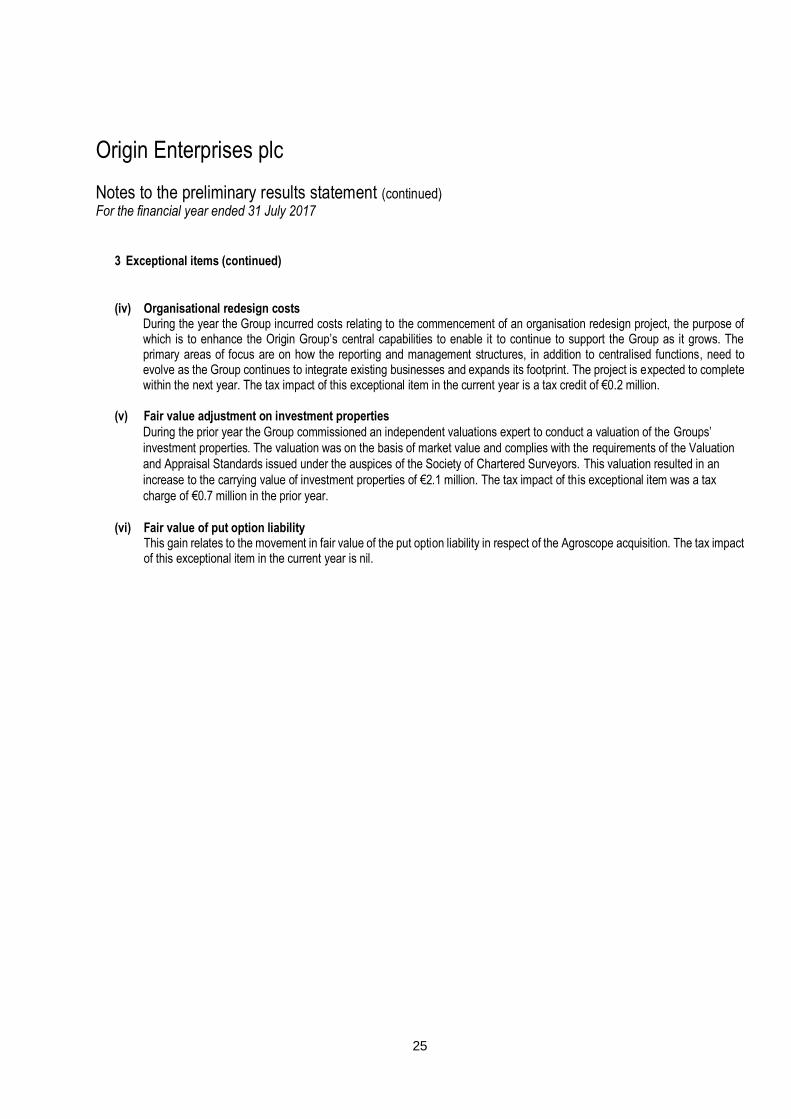
(iv) Organisational redesign costs During the year the Group incurred costs relating to the commencement of an organisation redesign project, the purpose of which is to enhance the Origin Group’s central capabilities to enable it to continue to support the Group as it grows. The primary areas of focus are on how the reporting and management structures, in addition to centralised functions, need to evolve as the Group continues to integrate existing businesses and expands its footprint. The project is expected to complete within the next year. The tax impact of this exceptional item in the current year is a tax credit of €0.2 million.
(v) Fair value adjustment on investment properties
During the prior year the Group commissioned an independent valuations expert to conduct a valuation of the Groups’
investment properties. The valuation was on the basis of market value and complies with the requirements of the Valuation
and Appraisal Standards issued under the auspices of the Society of Chartered Surveyors. This valuation resulted in an
increase to the carrying value of investment properties of €2.1 million. The tax impact of this exceptional item was a tax
charge of €0.7 million in the prior year.
(vi) Fair value of put option liability This gain relates to the movement in fair value of the put option liability in respect of the Agroscope acquisition. The tax impact of this exceptional item in the current year is nil.
26
Origin Enterprises plc
Notes to the preliminary results statement (continued) For the financial year ended 31 July 2017
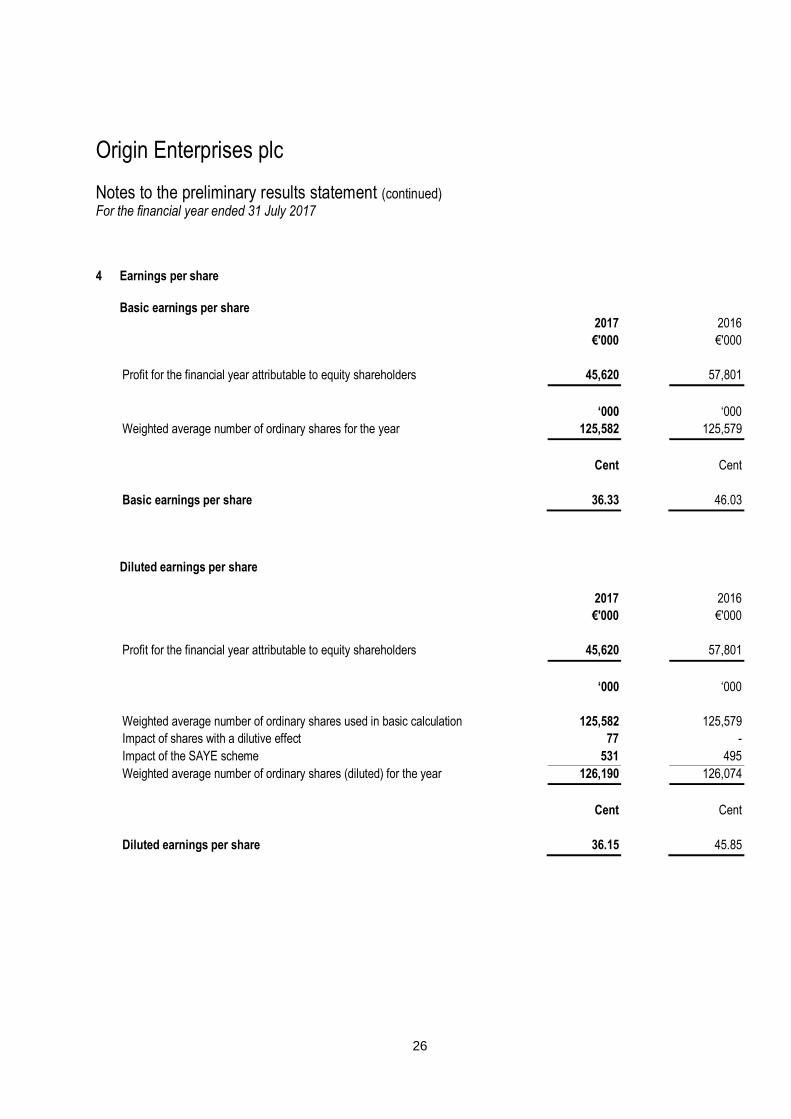
4 Earnings per share
Basic earnings per share 2017 2016
€'000 €'000
Profit for the financial year attributable to equity shareholders 45,620 57,801
‘000 ‘000
Weighted average number of ordinary shares for the year 125,582 125,579
Cent Cent
Basic earnings per share 36.33 46.03
Diluted earnings per share
2017 2016
€'000 €'000
Profit for the financial year attributable to equity shareholders 45,620 57,801
‘000 ‘000
Weighted average number of ordinary shares used in basic calculation 125,582 125,579
Impact of shares with a dilutive effect 77 -
Impact of the SAYE scheme 531 495
Weighted average number of ordinary shares (diluted) for the year 126,190 126,074
Cent Cent
Diluted earnings per share 36.15 45.85
27
Origin Enterprises plc
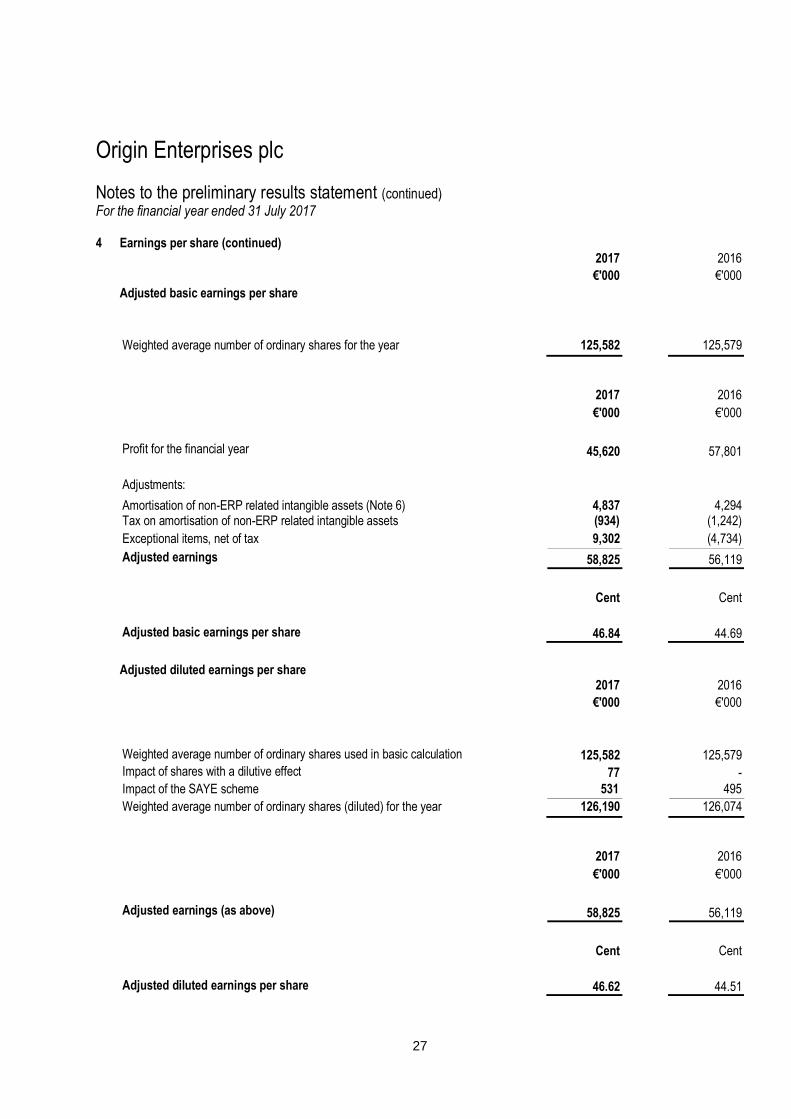
Notes to the preliminary results statement (continued) For the financial year ended 31 July 2017 4 Earnings per share (continued) 2017 2016
€'000 €'000
Adjusted basic earnings per share
Weighted average number of ordinary shares for the year 125,582 125,579
2017 2016
€'000 €'000
Profit for the financial year 45,620 57,801
Adjustments:
Amortisation of non-ERP related intangible assets (Note 6) 4,837 4,294 Tax on amortisation of non-ERP related intangible assets (934) (1,242)
Exceptional items, net of tax 9,302 (4,734)
Adjusted earnings 58,825 56,119
Cent Cent
Adjusted basic earnings per share 46.84 44.69
Adjusted diluted earnings per share 2017 2016
€'000 €'000
Weighted average number of ordinary shares used in basic calculation 125,582 125,579
Impact of shares with a dilutive effect 77 -
Impact of the SAYE scheme 531 495
Weighted average number of ordinary shares (diluted) for the year 126,190 126,074
2017 2016
€'000 €'000
Adjusted earnings (as above) 58,825 56,119
Cent Cent
Adjusted diluted earnings per share 46.62 44.51
28
Origin Enterprises plc
Notes to the preliminary results statement (continued) For the financial year ended 31 July 2017
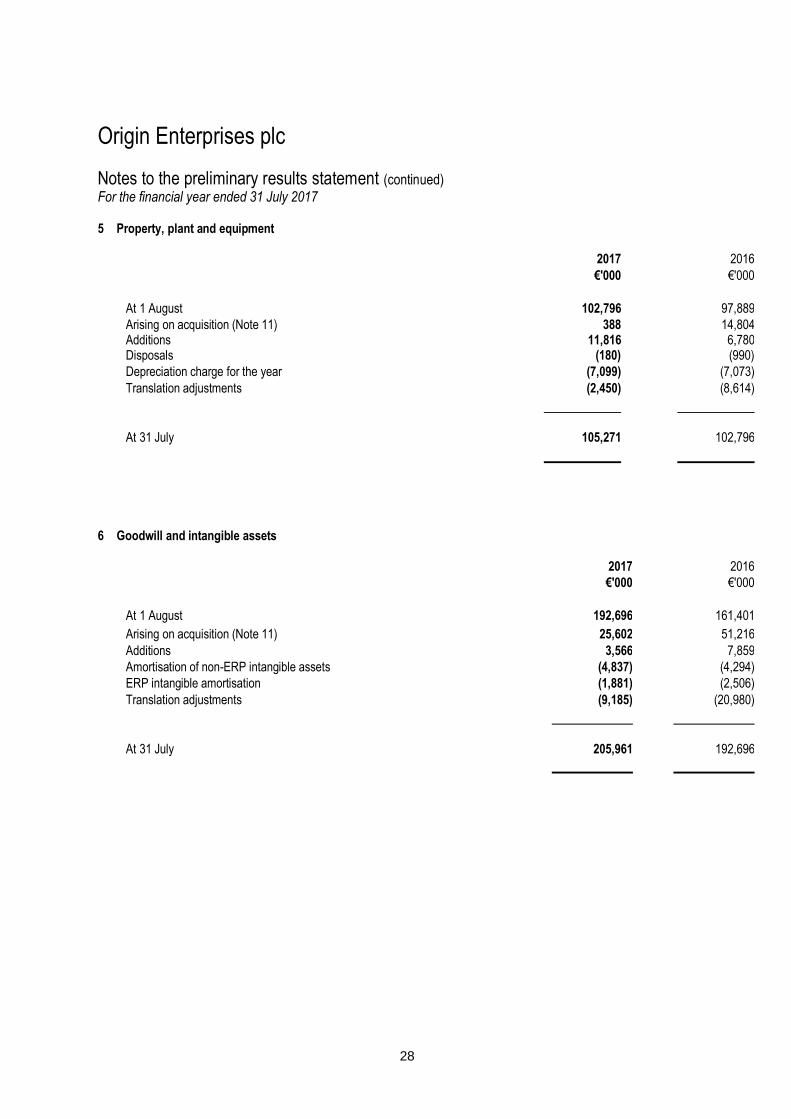
5 Property, plant and equipment
2017 2016
€'000 €'000
At 1 August 102,796 97,889
Arising on acquisition (Note 11) 388 14,804 Additions 11,816 6,780 Disposals (180) (990)
Depreciation charge for the year (7,099) (7,073)
Translation adjustments (2,450) (8,614)
At 31 July 105,271 102,796
6 Goodwill and intangible assets
2017 2016
€'000 €'000
At 1 August 192,696 161,401
Arising on acquisition (Note 11) 25,602 51,216
Additions 3,566 7,859
Amortisation of non-ERP intangible assets (4,837) (4,294)
ERP intangible amortisation (1,881) (2,506)
Translation adjustments (9,185) (20,980)
At 31 July 205,961 192,696
29
Origin Enterprises plc
Notes to the preliminary results statement (continued) For the financial year ended 31 July 2017
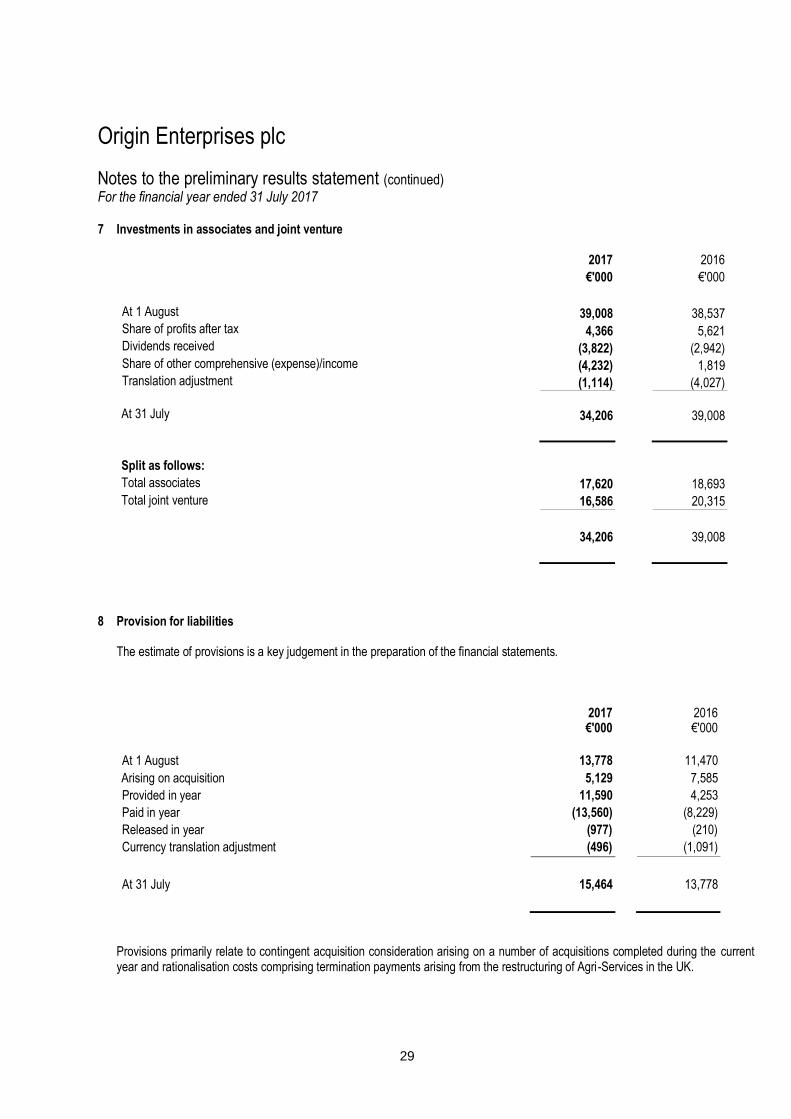
7 Investments in associates and joint venture
2017 2016
€'000 €'000
At 1 August 39,008 38,537 Share of profits after tax 4,366 5,621 Dividends received (3,822) (2,942) Share of other comprehensive (expense)/income (4,232) 1,819 Translation adjustment (1,114) (4,027)
At 31 July 34,206 39,008
Split as follows:
Total associates 17,620 18,693
Total joint venture 16,586 20,315
34,206 39,008
8 Provision for liabilities The estimate of provisions is a key judgement in the preparation of the financial statements.
2017
€'000
2016 €'000
At 1 August 13,778 11,470
Arising on acquisition 5,129 7,585
Provided in year 11,590 4,253
Paid in year (13,560) (8,229)
Released in year (977) (210)
Currency translation adjustment (496) (1,091)
At 31 July 15,464 13,778
Provisions primarily relate to contingent acquisition consideration arising on a number of acquisitions completed during the current year and rationalisation costs comprising termination payments arising from the restructuring of Agri-Services in the UK.
30
Origin Enterprises plc
Notes to the preliminary results statement (continued)
For the financial year ended 31 July 2017
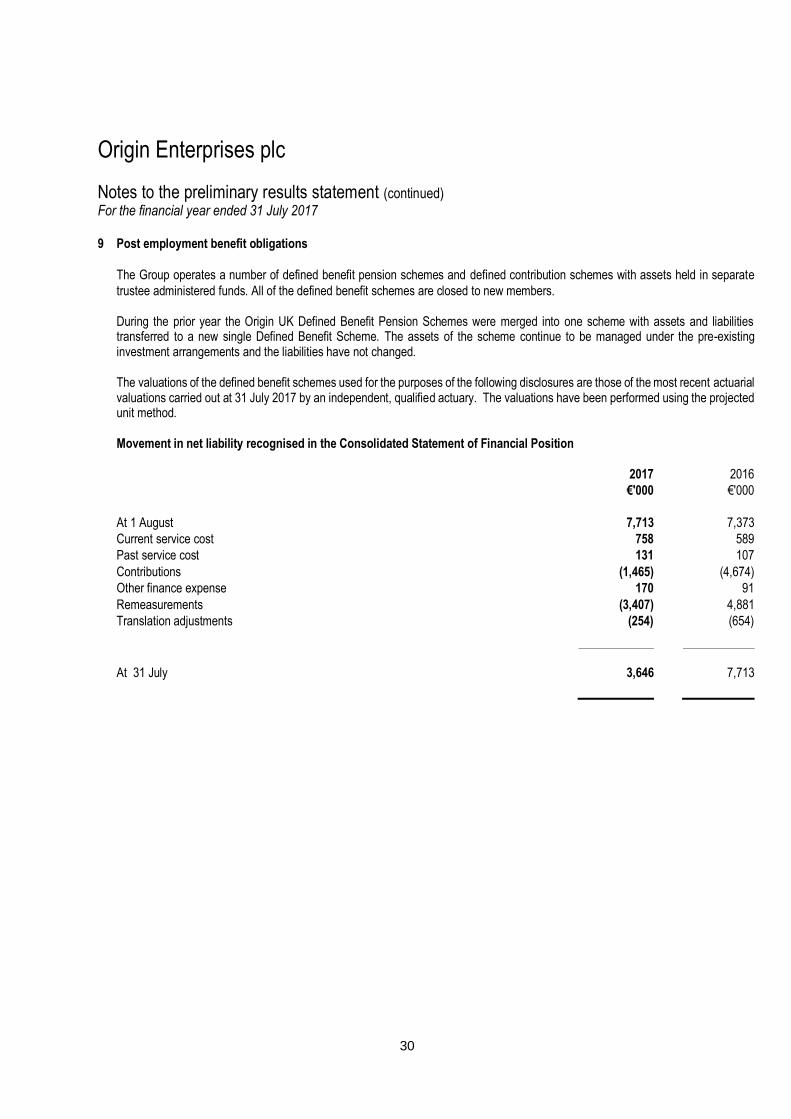
9 Post employment benefit obligations
The Group operates a number of defined benefit pension schemes and defined contribution schemes with assets held in separate
trustee administered funds. All of the defined benefit schemes are closed to new members. During the prior year the Origin UK Defined Benefit Pension Schemes were merged into one scheme with assets and liabilities transferred to a new single Defined Benefit Scheme. The assets of the scheme continue to be managed under the pre-existing investment arrangements and the liabilities have not changed. The valuations of the defined benefit schemes used for the purposes of the following disclosures are those of the most recent actuarial valuations carried out at 31 July 2017 by an independent, qualified actuary. The valuations have been performed using the projected unit method.
Movement in net liability recognised in the Consolidated Statement of Financial Position
2017 2016
€'000 €'000
At 1 August 7,713 7,373
Current service cost 758 589
Past service cost 131 107
Contributions (1,465) (4,674)
Other finance expense 170 91
Remeasurements (3,407) 4,881
Translation adjustments (254) (654)
At 31 July 3,646 7,713
31
Origin Enterprises plc
Notes to the preliminary results statement (continued)
For the financial year ended 31 July 2017
10 Restricted cash
On 28 July 2015, Origin announced that it had reached agreement to acquire Romanian based Redoxim SRL. On that date, Origin
placed in escrow an amount of €29,358,000 being the total consideration payable less local withholding tax. The completion of the
acquisition was dependent on an approval process which required notification to the Official Gazette of Romania. This approval
process was subsequently finalised and the acquisition of Redoxim SRL completed on 17 September 2015. On this date, 90 per
cent of the funds in escrow were released to the sellers of Redoxim. The balance of €2,948,000 was paid post year end on 17
September 2016.
11 Acquisition of subsidiary undertakings
During the year the Group completed a number of acquisitions. These acquisitions improved the strategic position of the Groups
integrated agronomy services business and further the Groups focus on building new capability, systems and process development.
Details of the acquisitions are as follows:
1. On 11 November 2016 the Agrii Group completed the acquisition of 100 per cent of David Dumosch Limited. David Dumosch is an agricultural and horticultural merchant.
2. On 9 March 2017 the Group completed the acquisition of 100 per cent of the Resterra Group (‘Resterra’). Resterra is a digital agricultural services group that provides an important enhancement to Origin’s growing digital technology capabilities with a particular emphasis on expanding the Group’s data driven group management solutions framework for the benefit of existing and potential new customers and agronomists.
3. On 1 July 2017 the Group completed the acquisition of 100 per cent of Linemark UK Limited (‘Linemark’). Linemark is a sports and amenity paint manufacturer supplying line marking paint, grass marking machines and accessories.
32
Origin Enterprises plc
Notes to the preliminary results statement (continued)
For the financial year ended 31 July 2017
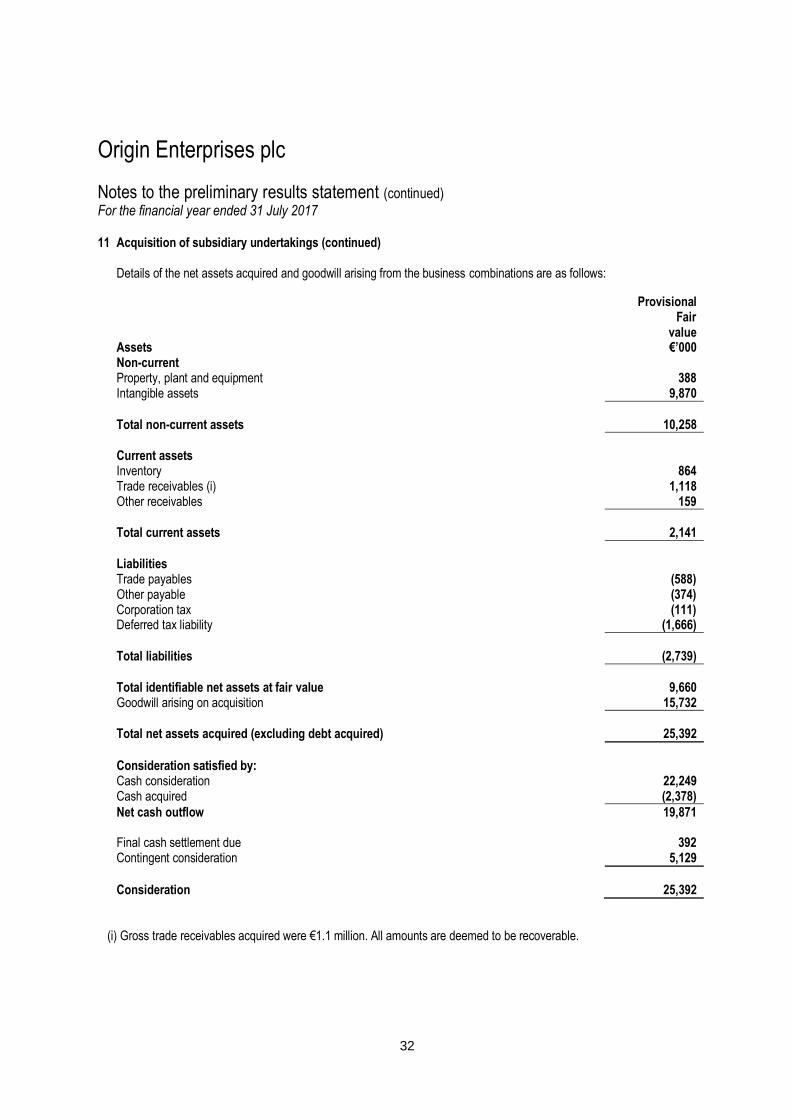
11 Acquisition of subsidiary undertakings (continued)
Details of the net assets acquired and goodwill arising from the business combinations are as follows:
(i) Gross trade receivables acquired were €1.1 million. All amounts are deemed to be recoverable.
Provisional Fair
value Assets €’000 Non-current Property, plant and equipment 388 Intangible assets 9,870
Total non-current assets 10,258 Current assets Inventory 864 Trade receivables (i) 1,118 Other receivables 159
Total current assets 2,141
Liabilities Trade payables (588) Other payable (374) Corporation tax (111) Deferred tax liability (1,666)
Total liabilities (2,739)
Total identifiable net assets at fair value 9,660 Goodwill arising on acquisition 15,732 Total net assets acquired (excluding debt acquired)
25,392
Consideration satisfied by: Cash consideration 22,249 Cash acquired (2,378)
Net cash outflow 19,871 Final cash settlement due 392 Contingent consideration 5,129
Consideration 25,392
33
Origin Enterprises plc
Notes to the preliminary results statement (continued)
For the financial year ended 31 July 2017
11 Acquisition of subsidiary undertakings (continued)
During the prior year the Group completed a number of acquisitions in Romania and Poland, with some additional bolt on
acquisitions in the United Kingdom. Details of the acquisitions are as follows:
1. On 17 September 2015 the Group completed the acquisition of 100 per cent of Redoxim SRL. Based in Romania, Redoxim SRL is a leading provider of agronomy services, macro and micro inputs to arable, vegetable and horticulture growers.
2. On 23 November 2015 the Group completed the acquisition of 100 per cent of the Kazgod Group. Based in Poland, the
Kazgod Group is a leading provider of agronomy services, inputs, crop marketing solutions as well as a manufacturer of micro nutrition applications.
3. On 16 December 2015 the Group completed the acquisition of 100 per cent of Comfert SRL. Based in Romania, Comfert
SRL is a leading provider of agronomy services, integrated inputs and crop marketing support to arable and vegetable growers.
4. On 20 August 2015 the Group completed the acquisition of 100 per cent of ReSo Seeds Limited. Based in the United
Kingdom, ReSo Seeds Limited is a leading mobile seed cleaning and processing specialist company. 5. On 1 July 2016 the Group completed the acquisition of 100 per cent of Headland Amenity Limited. Based in the United
Kingdom, Headland Amenity Limited is a technically advanced supplier of products and synergistic programmes to improve sports turf surfaces.
34
Origin Enterprises plc
Notes to the preliminary results statement (continued)
For the financial year ended 31 July 2017
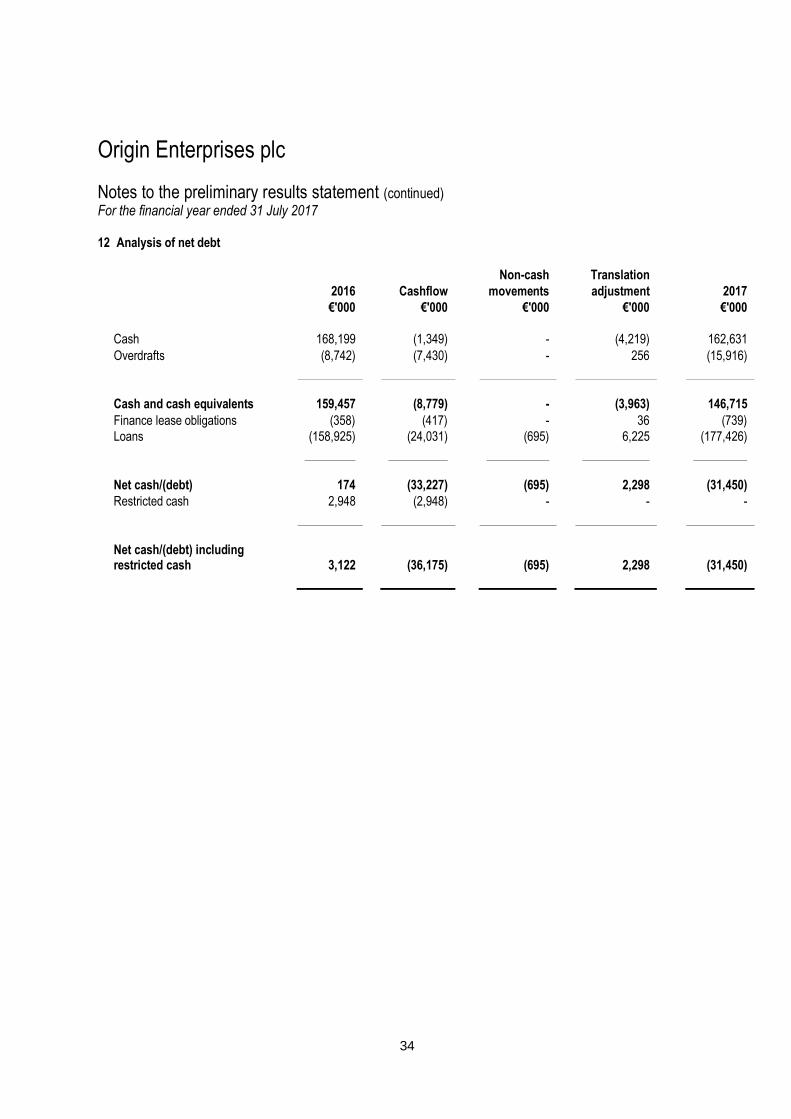
12 Analysis of net debt
Non-cash Translation
2016 Cashflow movements adjustment 2017
€'000 €'000 €'000 €'000 €'000
Cash 168,199 (1,349) - (4,219) 162,631
Overdrafts (8,742) (7,430) - 256 (15,916)
Cash and cash equivalents 159,457 (8,779) - (3,963) 146,715
Finance lease obligations (358) (417) - 36 (739)
Loans (158,925) (24,031) (695) 6,225 (177,426)
Net cash/(debt) 174 (33,227) (695) 2,298 (31,450)
Restricted cash 2,948 (2,948) - - -
Net cash/(debt) including restricted cash
3,122
(36,175)
(695)
2,298
(31,450)
35
Origin Enterprises plc
Notes to the preliminary results statement (continued)
For the financial year ended 31 July 2017
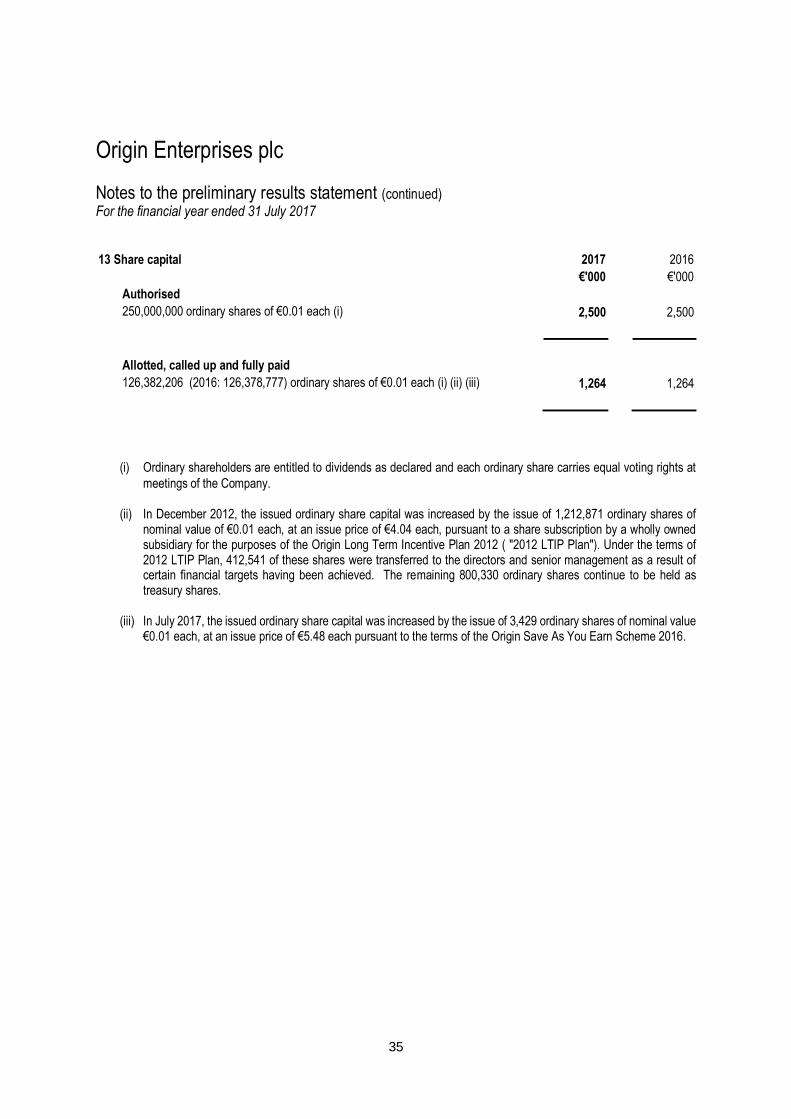
13 Share capital 2017 2016
€'000 €'000
Authorised
250,000,000 ordinary shares of €0.01 each (i) 2,500 2,500
Allotted, called up and fully paid
126,382,206 (2016: 126,378,777) ordinary shares of €0.01 each (i) (ii) (iii) 1,264 1,264
(i) Ordinary shareholders are entitled to dividends as declared and each ordinary share carries equal voting rights at
meetings of the Company.
(ii) In December 2012, the issued ordinary share capital was increased by the issue of 1,212,871 ordinary shares of nominal value of €0.01 each, at an issue price of €4.04 each, pursuant to a share subscription by a wholly owned subsidiary for the purposes of the Origin Long Term Incentive Plan 2012 ( "2012 LTIP Plan"). Under the terms of 2012 LTIP Plan, 412,541 of these shares were transferred to the directors and senior management as a result of certain financial targets having been achieved. The remaining 800,330 ordinary shares continue to be held as treasury shares.
(iii) In July 2017, the issued ordinary share capital was increased by the issue of 3,429 ordinary shares of nominal value €0.01 each, at an issue price of €5.48 each pursuant to the terms of the Origin Save As You Earn Scheme 2016.
36
Origin Enterprises plc
Notes to the preliminary results statement (continued)
For the financial year ended 31 July 2017
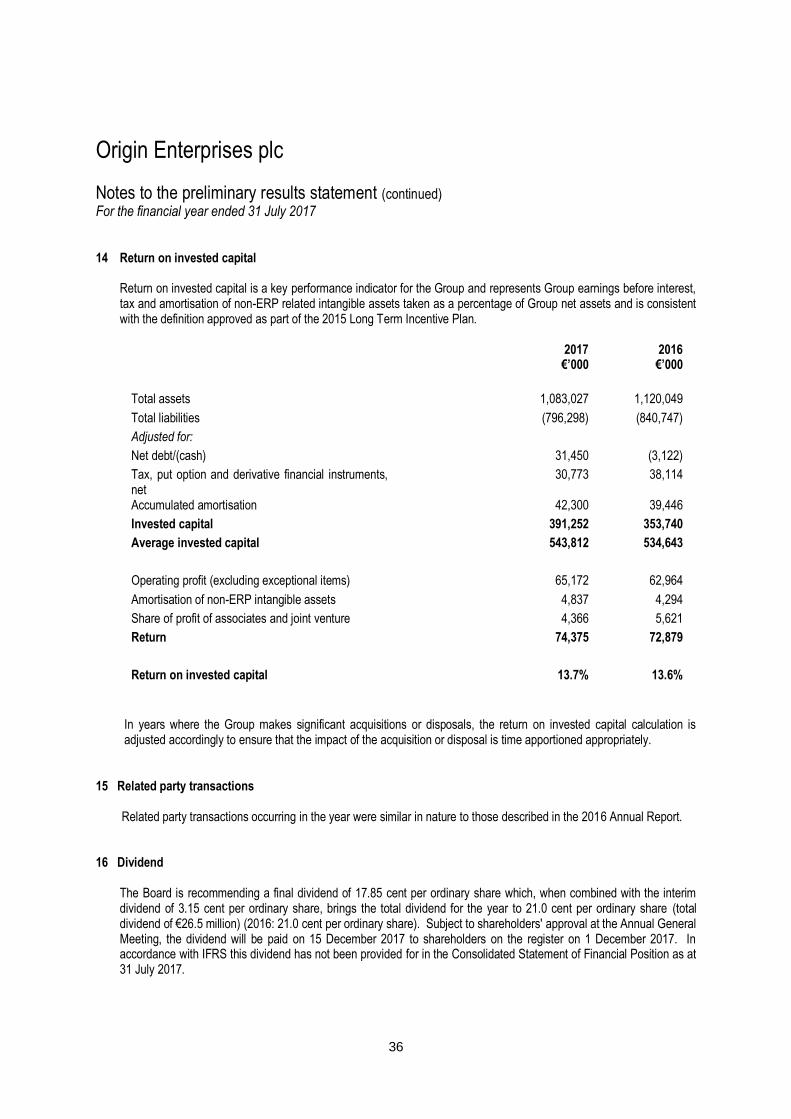
14 Return on invested capital
Return on invested capital is a key performance indicator for the Group and represents Group earnings before interest, tax and amortisation of non-ERP related intangible assets taken as a percentage of Group net assets and is consistent with the definition approved as part of the 2015 Long Term Incentive Plan.
2017
€’000 2016 €’000
Total assets 1,083,027 1,120,049
Total liabilities (796,298) (840,747)
Adjusted for:
Net debt/(cash) 31,450 (3,122)
Tax, put option and derivative financial instruments, net
30,773 38,114
Accumulated amortisation 42,300 39,446
Invested capital 391,252 353,740
Average invested capital 543,812 534,643
Operating profit (excluding exceptional items) 65,172 62,964
Amortisation of non-ERP intangible assets 4,837 4,294
Share of profit of associates and joint venture 4,366 5,621
Return 74,375 72,879
Return on invested capital 13.7% 13.6%
In years where the Group makes significant acquisitions or disposals, the return on invested capital calculation is adjusted accordingly to ensure that the impact of the acquisition or disposal is time apportioned appropriately.
15 Related party transactions
Related party transactions occurring in the year were similar in nature to those described in the 2016 Annual Report.
16 Dividend
The Board is recommending a final dividend of 17.85 cent per ordinary share which, when combined with the interim dividend of 3.15 cent per ordinary share, brings the total dividend for the year to 21.0 cent per ordinary share (total dividend of €26.5 million) (2016: 21.0 cent per ordinary share). Subject to shareholders' approval at the Annual General Meeting, the dividend will be paid on 15 December 2017 to shareholders on the register on 1 December 2017. In accordance with IFRS this dividend has not been provided for in the Consolidated Statement of Financial Position as at 31 July 2017.
37
Origin Enterprises plc
Notes to the preliminary results statement (continued)
For the financial year ended 31 July 2017 17 Financial commitments
The Group has a financial commitment of €8.8 million attributable to a strategic partnership with University College Dublin (‘UCD’). The commitment is over a five year period.
18 Subsequent events On 10 August 2017 Origin announced it had completed the acquisition of the fertiliser activities and certain assets of
Bunn Fertiliser Limited (‘Bunn’). Based in the United Kingdom, Bunn is a leading producer of prescription fertiliser blends and nutrition management system servicing the arable grassland and horticultural sector. Under the terms of the transaction, Origin acquired the Business on a debt free and cash basis for a consideration of £9 million. Due to the short time frame between completion date and the date of issuance of this report, it was not possible to reliably estimate the fair values of assets and liabilities or the goodwill amount associated with this acquisition.
There have been no other material events subsequent to 31 July 2017 that would require adjustment to or disclosure in
this report.


![A.I. Enterprises Ltd. and A.I. Enterprises Ltd. et …...[2014] 1 R.C.S. A.I. ENTERPRISES c. BRAM ENTERPRISES 177 A.I. Enterprises Ltd. et Alan Schelew Appelants c. Bram Enterprises](https://static.fdocuments.in/doc/165x107/5e918dac94e60f42b949e30a/ai-enterprises-ltd-and-ai-enterprises-ltd-et-2014-1-rcs-ai-enterprises.jpg)

