
OPTIMIZATION OF INBOUND TRANSPORTATION LOGISTICS MANAGEMENT
14
OPTIMIZATION OF INBOUND TRANSPORTATION LOGISTICS MANAGEMENT WITH GEOGRAPHIC INFORMATION SYSTEM AND MATHEMATICAL MODELING: A CASE STUDY OF SUGAR CANE COMPANY IN THAILAND by Attakorn Jaruthien Ph.D. Student in Logistics, School of Engineering, University of the Thai Chamber of Commerce Vibhavadee-Rangsit Road, Dindaeng, Bangkok, 10400, Thailand Tel. 02-697-6000 Fax. 02-276-2126, Email: [email protected] ABSTRACT Sugar and sugar cane industry is an important agricultural industry. It is the main of Thai agricultural economics for long time. Sugar cane is a main material of sugar manufacture. Thailand is the fourth major exporter next to Brazil, Europe Union and Australia. This reason indicates that sugar industry is important factory and can solve the economic problem in Thailand. The problem in the sugar cane production in Thailand has low quality of product, it make the efficiency of sugar production is low, and they have many factors of disadvantage from farming, harvest and transportation management. This paper study the inbound transportation logistics management for improves the value and productivity of sugar cane production. The method has used the geographic information system to analyze spatial and non-spatial data for design and selection in the suitability area to be hub and spoke, and used the mathematical model with vehicle routing problem for analyze the optimization in transportation cost and capacity of vehicle routing problem for planning the operation of transport. This results has represent the location of suitability area and the boundary of transportation with sugar cane. From results, the new model transportation with suitable location by k-mean clustering and vehicle routing model planning just better than the traditional transport to carriage sugarcane to factory. The new model transport can reducing the number of trucks in sugar factory yard maximum from 1,200 trips to 279 trips, and the queuing time to waiting from 28 hour to 6 hour and a half. The transportation distance and cost is percentage reducing to 27% and 25.6%, respectively. KEYWORDS Inbound of Transportation and Logistics, Capacity ofVehicle Routing Problem, Geographic Information System, Sugar Cane Industry, K-Means Clustering INTRODUCTION The sugar cane and sugar is important for the agricultural economics of Thailand. Inbound logistics of material management in sugar industries is concerned with the acquisition of sugar cane supporting the complete cycle of material flow from suppliers to manufacturers whereas outbound logistics or physical distribution encompasses all logistics activities related to customer satisfaction (Min and Zhou, 2002; Auckara-aree and Boondiskulchok, 2008). From the increased globalization of supply, customer markets and all businesses that aim to be competitive on the market have to focus on the entire supply chain. It’s so significant to analyze the flows of goods throughout from the supplier to customers and make with satisfaction. The sugar is one of the important economic corps in Thailand. The sugar factories have 47 plants to cover the sugar cane farms area in the upper regions in Thailand. The total capacity of sugar cane products in Thailand is 66.4 million tons per year (Office of the Cane and Sugar Board, 2009). Due to sugar industry is utilized the raw material inside the country, the low product and low commercial cane sugar value (C.C.S.) are the problem of sugar cane production. Disadvantage of sugar cane production in Thailand is low quality of product, it make the efficiency of sugar production is low. Moreover, the distance of transportation from farm to sugar industry is far and terrible of management (Pontawepitanun, 2004). Furthermore, the influence of production for the farmers is the price of product. The mill is usually geographically close to the farms, with an average distance of about 25 km, so as to minimize transport costs (Higgins et al, 2007). A growing region can contain one or several mills, with the mill size varying considerably across countries. The mill will produce raw sugar, which is usually either transported to storage
Transcript of OPTIMIZATION OF INBOUND TRANSPORTATION LOGISTICS MANAGEMENT

OPTIMIZATION OF INBOUND TRANSPORTATION LOGISTICS MANAGEMENT WITH GEOGRAPHIC INFORMATION SYSTEM AND MATHEMATICAL MODELING:
A CASE STUDY OF SUGAR CANE COMPANY IN THAILAND
by
Attakorn JaruthienPh.D. Student in Logistics, School of Engineering,
University of the Thai Chamber of CommerceVibhavadee-Rangsit Road, Dindaeng, Bangkok, 10400, Thailand
Tel. 02-697-6000 Fax. 02-276-2126,Email: [email protected]
ABSTRACT
Sugar and sugar cane industry is an important agricultural industry. It is the main of Thai agricultural economics for long time. Sugar cane is a main material of sugar manufacture. Thailand is the fourth major exporter next to Brazil, Europe Union and Australia. This reason indicates that sugar industry is important factory and can solve the economic problem in Thailand. The problem in the sugar cane production in Thailand has low quality of product, it make the efficiency of sugar production is low, and they have many factors of disadvantage from farming, harvest and transportation management. This paper study the inbound transportation logistics management for improves the value and productivity of sugar cane production. The method has used the geographic information system to analyze spatial and non-spatial data for design and selection in the suitability area to be hub and spoke, and used the mathematical model with vehicle routing problem for analyze the optimization in transportation cost and capacity of vehicle routing problem for planning the operation of transport. This results has represent the location of suitability area and the boundary of transportation with sugar cane. From results, the new model transportation with suitable location by k-mean clustering and vehicle routing model planning just better than the traditional transport to carriage sugarcane to factory. The new model transport can reducing the number of trucks in sugar factory yard maximum from 1,200 trips to 279 trips, and the queuing time to waiting from 28 hour to 6 hour and a half. The transportation distance and cost is percentage reducing to 27% and 25.6%, respectively.
KEYWORDSInbound of Transportation and Logistics, Capacity of Vehicle Routing Problem, Geographic Information System, Sugar Cane Industry, K-Means Clustering
INTRODUCTION
The sugar cane and sugar is important for the agricultural economics of Thailand. Inbound logistics of material management in sugar industries is concerned with the acquisition of sugar cane supporting the complete cycle of material flow from suppliers to manufacturers whereas outbound logistics or physical distribution encompasses all logistics activities related to customer satisfaction (Min and Zhou, 2002; Auckara-aree and Boondiskulchok, 2008). From the increased globalization of supply, customer markets and all businesses that aim to be competitive on the market have to focus on the entire supply chain. It’s so significant to analyze the flows of goods throughout from the supplier to customers and make with satisfaction.
The sugar is one of the important economic corps in Thailand. The sugar factories have 47 plants to cover the sugar cane farms area in the upper regions in Thailand. The total capacity of sugar cane products in Thailand is 66.4 million tons per year (Office of the Cane and Sugar Board, 2009). Due to sugar industry is utilized the raw material inside the country, the low product and low commercial cane sugar value (C.C.S.) are the problem of sugar cane production. Disadvantage of sugar cane production in Thailand is low quality of product, it make the efficiency of sugar production is low. Moreover, the distance of transportation from farm to sugar industry is far and terrible of management (Pontawepitanun, 2004). Furthermore, the influence of production for the farmers is the price of product.
The mill is usually geographically close to the farms, with an average distance of about 25 km, so as to minimize transport costs (Higgins et al, 2007). A growing region can contain one or several mills, with the mill size varying considerably across countries. The mill will produce raw sugar, which is usually either transported to storage
facilities (warehouses) at seaports for export or to sugar refineries. Mills usually have minimal storage facilities or silos, so raw sugar is transported immediately after being produced. The supply chain beyond the mill will vary significantly among sugar industries, particularly as some primarily target home markets (e.g. China), while others are primarily export oriented (e.g. Australia). In Thailand, the long distance between the mills and the ports makes the sugar transport and shipping logistics very critical (Auckara-aree and Boondiskulchok, 2008).
Sugar industry can efficiency produce the high quality of production that was acquired from collaboration of all party especially the farmer. But this paper has considering about transportation process of inbound logistics. When considering the inbound collecting system in the sugar cane industry, the collecting raw material is the main activity in the system. Most of system costs both fixed cost and variable cost rely on the operation model of the inbound collecting system. Moreover, the sugar cane industry has specific characters which need to be considered when implementing the inbound transportation collection system such as perishable product affecting time, energy cost which has increasing more and more is affecting to transportation cost and another from queuing in the inbound yards in front of factory is too much of trucks of sugar cane. For this reason, it significant to analyze the inbound transportation collecting system, and define which aspects should be considered as well as evaluate performance and value-added of the inbound transportation collecting system.
A strategy for countering the current low sugar prices is to control and reduce sugar production and logistics costs. Transport is the largest unit cost in the manufacturing of sugar as many authors have already pointed out (Diaz and Perez, 2000a, b; Martin et al., 2001; Auckara-aree and Boondiskulchok, 2008). Transportation cost depends on vehicle employed in the transport of sugar cane from the field to the sugar mills and the transport of different types of sugar products from the mills to the seaports via warehouses (Auckara-aree and Boondiskulchok, 2008). In this study, we will focus on the transport of sugar cane from the field to the mills. Because the problem from transport cost has affecting to farmers with the production cost and the queuing in the yard area in the front of factory is much of tracks to waiting to selling the sugar cane to factory. From the problem of queuing in front of factory has long time to waiting from 12 hours to 3 days in the peak period time.
NATURE OF SUGAR CANE AND CULTIVATION
Sugar cane has been grown well in sunny area, high temperature (25C - 35C) with moist in various kind of soil, recommended loamy sand, well-drained and soil mineral at least 2% since starting until 7-8 months(Pontawepitanun, 2004). It requires sufficient water resource and essential nutrient. Contrastly, it need cool weather to store sweet juice before harvesting in lesser water soil condition. Sugar cane has clump like rice. Firstly, it grows as one stem, then split to lot of clump with bud. These buds grow up to become stalks. Sweet juice in sugar content is used for nourishing and stored up gradually until the highest growth and ripe, then harvesting. In each period, it requires different environment, especially more factors involving in higher growth period.
Sugar cane cropping in Thailand mainly depend on rainfall rate approximately 80 percent, so planting timeframe is up to quantity of rainfall in rainy season:
Planting in early rainy season: usually start in April until the end of June. Farmer who begins cropping after this month cannot harvest sugar cane in time.
Planting at the end of rainy season or go through drought season: starts on October until January. Farmers should be assure that there is no rainfall in that season anymore, otherwise; they will face with weeding problem, high density of surface soil. These problems are lead to bad growth. However, they will manually clear soil and plowing on field to avoid this problem.
SUGAR CANE CULTIVATION FOR INDUSTRY
Sugar cane is an industrial crop need to send into factory. It has Sugar Cane Act which relevant people need to follow, including regulation from Sugar and Sugar Cane Committee, as following (Pontawepitanun, 2004):
(i) Sugar cane farmer registration. Farmer can register with agricultural governor’s officer in their local area that will be announced to farmer. This will provide many advantaged to farmer and supporting from public sector, for example, low loaning interest rate, cheap fertilizer chemical. This practice is also a measure to guarantee farmer’s security in sugar cane planting.
(ii) Access to Quota system or market for selling sugar cane. Farmer should contact with factory near their sugar crop to become factory’s contractor and assure that they can sell sugar production as well as cost supporting, fertilizer and other service from factory.

(iii) Finding sugar’s stalk in general, one rai of sugar cane field need for 1 ton of sugar’s stalk. Farmers should plant their own sugar cane for breeding purpose. This can save capital cost and get the best stalk. If farmers cannot do by themselves, they have to find out good stalk without pest and disease at the age 8-9 months.
(iv) Applying fertilizer for example, combination of Uria (40-0-0), Ammonium Sulfate (21-0-0), Triple super sulfate (0-46-0), Single super phosphate (0-(21-22)-0), and Potassium chloride (0-0-60) into your preferred formula or the appropriate one such as 15-15-15, 25-7-7, 28-28-0, 16-20-0, for ground surfacing. The fertilizer ratio depends on soil properties. Generally, farmers apply fertilizer by putting 1 set (50 kg.) per rai for ground surfacing and using nitrogen in from of ammonium sulfate (21-0-0) or putting 25-50 kg. of Uria (40-0-0) for upper surfacing.
(v) Organic fertilizer and fresh plant fertilizer besides chemical fertilizer, farmer may need to apply organic fertilizer, i.e. manure or fermented fertilizer, particularly from mixing of bagasse and molasses from sugar mill. The best organic fertilizer is from fresh plant such as bean family: Canavalia ensiformis, Crotalaria juncea or Cajanus cajan, after that farmer will plowing back in flowering period.
(vi) Hiring labor small size of farmers who have planted sugar cane lower 10 rai may use 4-5 labors in household. If it’s necessary to hire more labor, you should hire only at requirement time, for example, plantation, fertilization and herbicide.
(vii) Using machinery the suggested transportation machine are loading tractor with useful equipment which you can consider that you want to firstly buy tractor of rent. Because it can save labor cost. However, salf-dependent and saving cost a must.
(viii) Land/field selection select sugar cane area near the factory, having good infrastructure, none flooding soil in upper land, depth of surface at least 50 cm and no laterite or rock in lower soil layer.
THE SUPPLY CHAIN AND LOGISTICS OF SUGAR CANE
The supply chain of sugar cane has attracted some attention in the academic literature. Due to management the performance and production cost, an overview of logistics issues stressing the need for the coordination between harvesting, transport and storage (Strohm, 1999; Grunow et al, 2007). Lukesch (2005) studied in the problem of assigning sugar beet yields to alternative production site taking a complex reimbursement scheme into account which attributes different prices to on-time, early and late deliveries (Grunow et al, 2007). Issues such as improved transportation scheduling, new varieties and improved farm management practices do lead to economic benefits to more than one sector the value chain (Higgins et al, 2007).
The harvesting and transport interface of sugar value chain have provided more logistical opportunities than the other sectors upstream of the mill, and hence have attracted a large amount of attention. From the figure 1 has represent the supply chain of sugar miller industry of Thailand.

FIGURE 1SUPPLY CHAIN OF SUGAR INDUSTRY IN THAILAND
From the figure 1 has show the traditional relationship from the upstream to downstream of sugar industry supply chain in Thailand. From the upstream, the farmers all nearly sugar mill just contact to quota organizer and sugar miller for accept to send the sugar cane to the sugar miller when the harvesting time. In the middle is sugar miller and refinery to make transform sugarcane to pure sugar. And in the downstream, the miller has separate sugar product to selling in domestic 30% to save stock in warehouse/Distribution Center, another is sending to export in 70%. The 70% of export has sold separate one part direct to modern trade, food manufacturer (large size), and wholesaler (1st teir), and part two is going to Quata A. and Quota B. from the public policy. Finally, all of sugar product is going to end customers.
LITERATURE REVIEW AND RESEARCH APPROACH IN INBOUND LOGISTICS OF SUGARCANE
The publications in sugar cane supply of logistics inbound mainly focus on the transportation of the harvested crops to the mill. In Cuba, a simulation model for the road transport of sugar cane (Diaz and Perez, 2000) and a mixed-integer programming model for scheduling the deliveries in a single day (Lopez Milan et al, 2006) has develop and using the mathematical model to analyze the inbound of logistics in Cuba. Lopez Milan et al. also consider intermodal transports which include first transportation via trucks to warehouses and then subsequent shipments to the mill by train (Grunow et al, 2007). Here, the train system functions as a buffer as it operates-unlike the Cuban trucks-for 24h a day, this research has aggregate transportation volumes but do not schedule vehicles.

In Thailand, the sugar industry is characterized by a large number of family businesses and small sized independent farms. This industry structure leads to excessive supplies during with the supply to Thai sugar mills. A stochastic model which helps the mills to optimize their order quantities, given the uncertainties of agriculturists’ delivery lead-times and quantities has studied by Supsomboon and Yosnual (2004), and provide an integer programming approach for the supply of mill using two types of trucks (Yosnual and Supsomboon, 2004). Prichanont et al (2005) used discrete-event simulation to demonstrate that the number of trucks should be drastically reduced in order to avoid excess supplies. If the arrival time of vehicles at the mill were equally spaced apart and aligned with the mill throughput rate, there would be no queue at the mill and no mill idle time. This is difficult to achieve due to varying travel distances between the farms and the mill and the need for the time elapsed between when the cane is harvested and processed by the mill (i.e. cut-to-crush delay) to be within a certain threshold (Higgins, 2006).
The supply response of sugar cane in Thailand has studied by Dowling and Jessadachatr (1978), the Nerlovian supply adjustment model has been successfully fitted Thai sugar cane. Aggregate finding for the whole kingdom suggest significant and elastic output responsiveness to priced changes. Regional are less conclusive, perhaps because of data limitations. However, a pooled model of regional output determination performed well, suggesting conclusion in keeping with those for the kingdom as a whole. And many researchers have studied order-picking processes that can see De Koster et al. (2007), Geotschalckx and Ashayeri (1989) to study the objective of order-picking systems to maximize the service level subject to resource constrains such as labor, machines, and capital.
The service level is composed of a variety of factors such as average and variation of order delivery time, order integrity, and accuracy. A crucial link between order-picking and service level is that the faster an order is retrieved, and sooner for shipping to customer. If an order misses its shipping due time, that will be wait until the next time period (Chaiadamrong and Kawtummachai, 2008). There is a massive literature base of supply chain methodologies, the application to sugar and other agriculture products’ chain have been limited to date, mainly because sugar chain are usually more complex than those for manufacturing has review by Chaiadamrong and Kawtummachai (2008).
The problem of transport sugar cane from farm to the sugar mills is the prediction of capacity and planning to schedule to transport sugar cane that affecting to the volume of sugar cane not match the crushing capacity of sugar mill or sugar milling demand, Yorthnual (2005) has analyzed the uncertainty of transportation time and capacity with stochastic analysis method. The waiting time of many truck in the front yard of sugar mill is occur from the arrival rate is so unstable in many time of day, which was divide to 2 case. First in case of transport sugar with the free queue manage with optimal number of truck flow, and second case to reduced the average time of queue analyzed by simulation, which have found results that reduced average waiting time of truck in the 10 sugar mill from 4% in free queue to 67% in queue lock, queue lock is case of fixed queue of truck to transport in time. In case of transportation simulation of sugar cane in harvest season by
MATHEMATICAL MODEL AND RESEARCH APPROACH
The transportation, routing and logistics is so complicate to analyst and decision problem, they want to know the best solution and suitable. That mean the best efficiency, high profitable or minimize operation cost. The decision problem in the transportation and logistics business has 2 types as:
The operation decision problem: that is finding to use in the work process, and they want the best and correcting solution.
The strategic decision problem: that problem is use in planning process or testing the organization policy of the company.
The investment of equipment and facility in term of transport has more consideration; because of investment cost is too high. Therefore, the transportation manager are must to realized routing and scheduling of transport products for response to customer demands at just in time and saving cost. The advantage of suitable scheduling and routing transport is the improving of utilization, customer service and reducing equipment investment and cost of transportation. By the way, the advantage for the transportation users is minimal transportation cost and best of service (Lambert et al, 1998).
K-MEAN CLUSTERING AND RESEARCH APPROACH
The clustering formulation that are based on minimizing a formal objective function, perhaps the most widelyused and studied is k-means clustering (Kanungo et al, 2002). K-means clustering given a set of n data points in d-dimensional space Rd and an integer k and the problem is to determine a set of k points in Rd, called centers, so as to minimize the mean squared distance from each data point to its nearest center. This measure is often called the squared-error distortion (Jain and Dubes, 1988; Gersho and Gray, 1992) and this type of clustering falls into the general category of variance based clustering (Inaba et al, 1994; Inaba et al, 1996).
Clustering based on k-means is closely related to a number of other clustering and location problems. These include the Euclidean k-medians (Arora et al, 1998), (Kolliopoulos and Rao, 1999) in which the objective is to minimize the sum of distances to the nearest center and the geometric k-center problem (Agarwal and Procopiuc, 1998) in which the objective is to minimize the maximum distance from every point to its closest center. There are no efficient solutions known to any of these problems and some formulation are NP-hard (Garey and Johnson, 1979). An asymptotically efficient approximation for the k-means clustering problem has been presented by Matousek (2000), but the large constant factors suggest that it is not a good candidate for practical implementation.
VEHICLE ROUTING PROBLEM AND RESEARCH APPROACH
The vehicle routing problem (VRP) is the general calling in the problem of vehicle routing depended on the one warehouse or many warehouses that consider to the number of city distribution or customers. The objective of VRP is transporting the customer product demand in the minimal cost. In general, they have separated the transportation management planning in 3 levels as following:
(i) Strategic Planning(ii) Tactical Planning(iii) Operation Planning
The strategic planning is part of planning policies or the way to management and operation of company. In example, Design, Depot or Distribution Center, service boundary area and marketing parts. In the decision to buy the number of trucks or the type of trucks is in the level of Tactical Planning, and the last of operational planning is the vehicle routing problem. That is the company are must to distribute or transport to be how, and fixed the vehicle routing to transport to term of minimize cost. Bodin et al. (1993) has mention to node routing problem for problem solve routing is Node and Route of vehicle. These types of capacity planning models are commonly used for railway application (e.g., Higgins and Kozan (1997) for urban planning and Chen and Harker (1990) for single line fright planning) as well as for road planning (e.g., Lo and Tung, 2003; Higgins et al, 2004). Higgins et al. (2007), Grimley and Horton (1997), Milan et al. (2003) are among the researchers who aimed to develop mathematical models for optimizing and improving harvesting –to-transport logistics.
GEOGRAPHIC INFORMATION SYSTEM AND APPLICATION
The rapid population growth and enlargement of economics have led to rapid changes in land use and caused serious damage to the environment and natural resource. The geographic information system (GIS) helpful to analyzing natural resource management and planning, and the distribution location to located suitably or not will directly effect on the efficiency and serving quality of the whole system. Many scholars have discussed the modeling issue of logistics distribution center location from different points of view, and the models mainly are those, such as algorithm of mathematical programming, multi-rule decision-making, heuristic algorithm, simulation and so on (Wei, 2005).
Geographic information system (GIS) is also a high technology which integrates geography, geometry, computer science and all kinds of application objects together. GIS technology has a stronger power to integrate data from different sources together and analyzing spatial data powerfully, so it is plays a significant role in the field of spatial decision-making (Zhang, 2005).
STUDY AREA AND ANALYTICAL METHOD
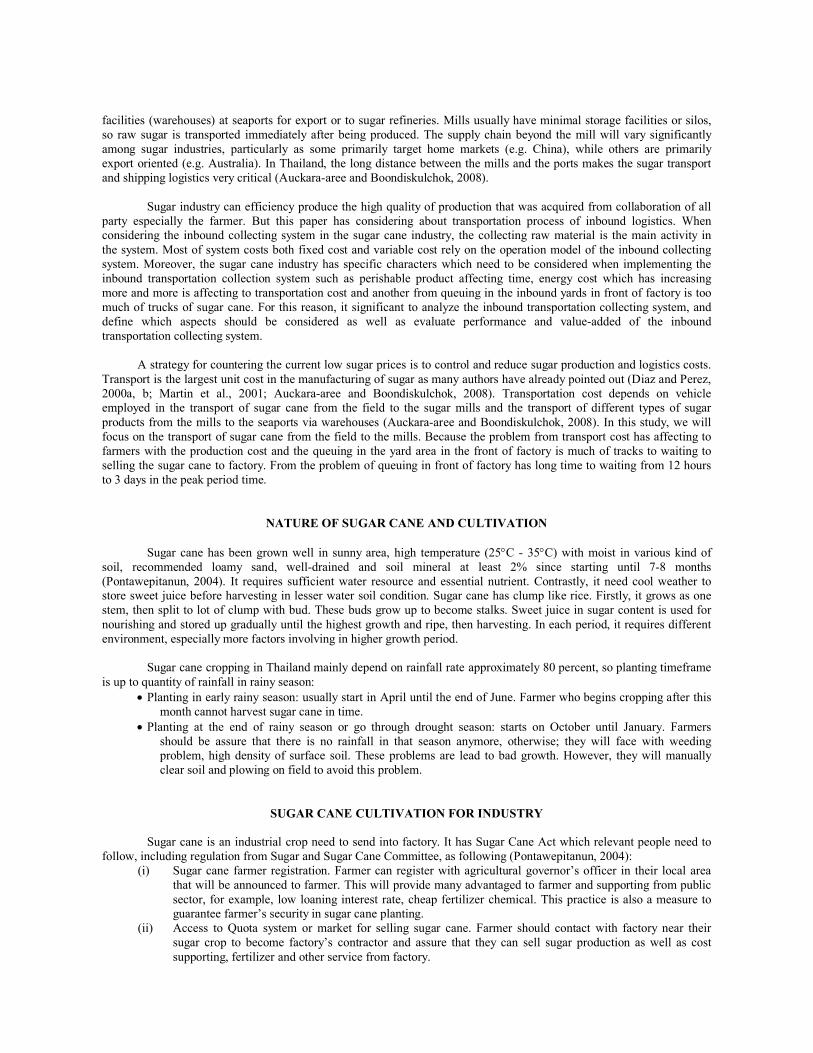
The study area of case study for sugar cane industry will mean sugar cane planted area in central region of Thailand, where include 3 province following Saraburi, Lop Buri and Nakhon Ratchasima province. And the factory of sugar mill is Saraburi sugar mills. That mill is one of Thai Roong Ruang Group of companies and expanded the plant’s

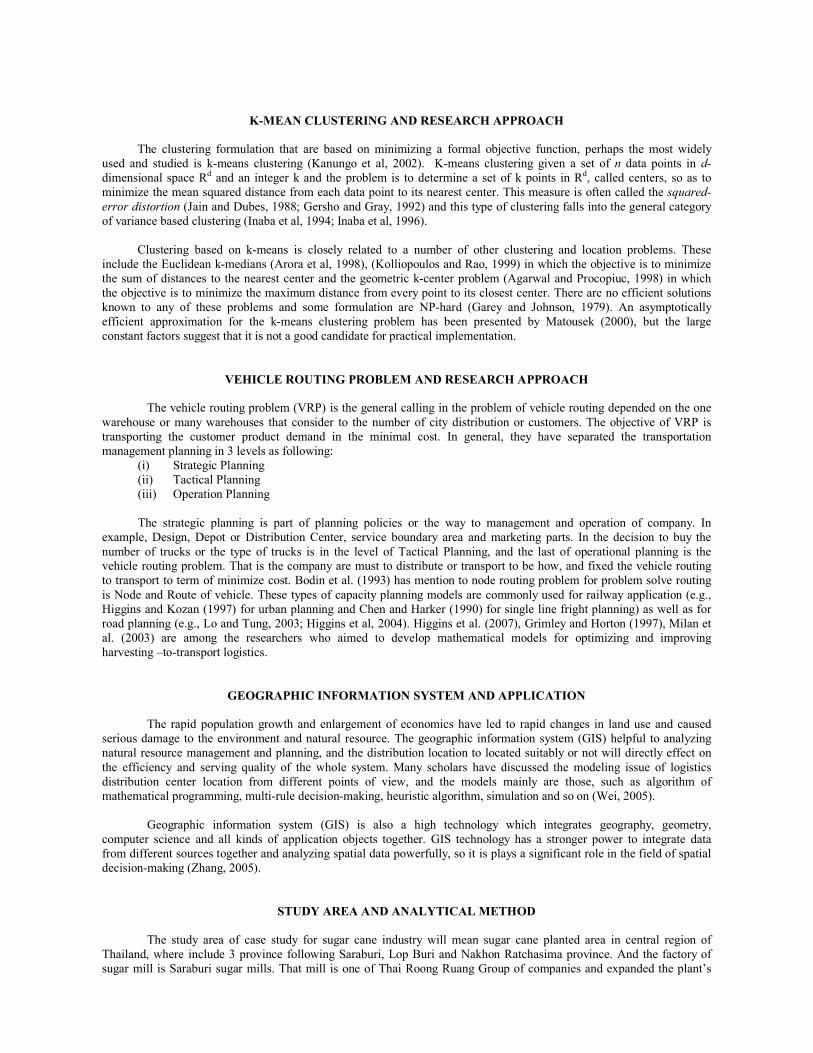
crushing capacity at present to 25,000 tons cane per day using both mills and a diffuser. In fact, its products include pure refined sugar, white sugar and brown sugar. Figure 2 shows location of Saraburi factory in red point and sugar cane planted area around the mill in green field. In this research, data on amount of the total volume sugar cane production during 2009/2010 harvest season, which show in figure 3 are used for exploring the methodology to support as well as making a comparison with the results developed from our methodology.
The methodology of this paper has represent the method of transportation of sugar cane from farms to sugar mills with the collecting location likely hub and sending the sugar cane direct to Saraburi factory. The step to analysis with mathematical model and GIS as following:
(i) Analysis the spatial data with Geographic Information System (GIS), that has show in figure 2.(ii) Analysis to finding suitable area for collecting location with k-mean clustering.(iii) Analysis the optimize routing from farms to each collecting location with capacity of vehicle routing
problem, by this formulation equation as:
Objective Function Min. Cost = (1)
Subject to: = bj (2)
= ai (3)
= (4)
Qij ≥ 0 (5)
By Cij = Transportation rate of sugar cane from farm i to factory j (Bath per tons)Qij = Capacity of sugar cane is transport from i to factory j (tons)bj = Total crushing capacity of Saraburi sugar factory in season (tons)ai = Capacity of sugar cane in ii = Sugar plantation area in central regionj = Saraburi Sugar factorym = Total plantation area in collecting locationn = Total factory to transport
Remark: Case of real situation adds Dummy Variable in
equation for adjust equal condition of calculation.
Condition of Model:- The routing is depends on quantity of demand, supply of transportation and other factors follow
structure and purchasing system in nowadays.- Sugar cane carriage is far from sugar cane plant area to collecting location, is use major highway
except carriage is close collecting location use road in farm.- Calculation of transportation cost considers transportation cost of ten wheel truck, that is comfort and
rapidity, can carry more than other vehicles, can carry from farm to collecting location and factory until sugar canes are milled in a process.
- Rate of transportation cost use this study; don’t consider variation of fuel price.- Accuracy and belief of result depend on input data, this study used maps at scale 1:50,000.
(iv) After collecting, sugar cane will carriage direct from each collecting location to sugar factory.(v) Analysis and finding solution of new model transportation distance and cost.(vi) Comparing the result of traditional transport with new model transportation.
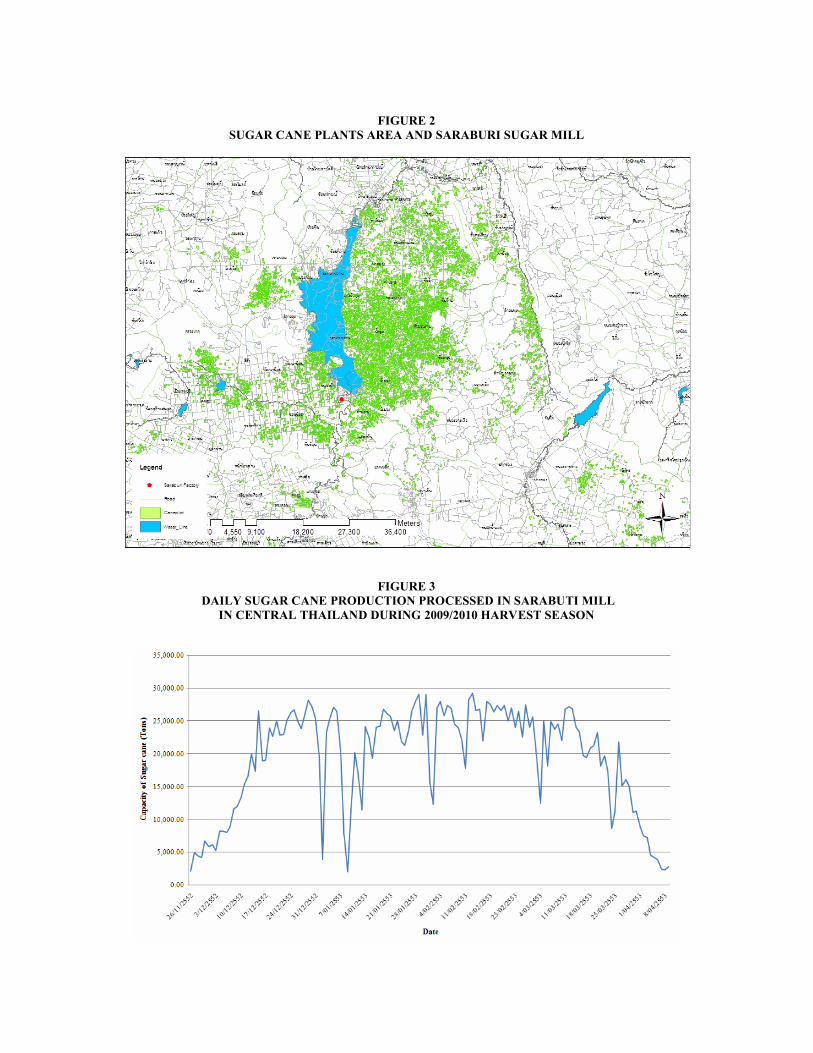
FIGURE 2SUGAR CANE PLANTS AREA AND SARABURI SUGAR MILL
FIGURE 3 DAILY SUGAR CANE PRODUCTION PROCESSED IN SARABUTI MILL
IN CENTRAL THAILAND DURING 2009/2010 HARVEST SEASON
The input data has collecting the distance metrix between farms and factory and the volume of sugar cane in each farm to analysis in 2 screnario, first scenario is analysis on traditional transportation direct from farm to factory and second scenario is analysis the routing from farms to collecting location. After collecting for more sugar cane and process of cutting leaf and split to small size will carriage to sugar factory and milling process.
CASE STUDY RESULTS AND DISCUSSION
From the results of analyst the traditional transportation and new model transportation that shows and comparision in this paper with the number of trucks to the sugar factory yard and queueing time in the waiting process before milling process, and the total cost and distance of transportation.
The result from traditional transportation has show in figure 4 that represent the number of trucks transport in the sugar factory yard for waiting to milling process. The number of trucks in maximize is going to 1,200 trips to waiting in the sugar factory yard, that is so terible affecting to the wasting of time, traffic jam, more accident and reducing the commercial cane sugar value (CCS) to the low level. The queueing time to waiting has show in figure 5 represent the total waiting time in the sugar factory yard per week for waitng before carriage to milling process, the miximize of total waiting time is 28 hour before milling process.
FIGURE 4NUMBER OF TRUCKS TO WAITING IN FACTORY YARD IN TRADITIONAL TRANSPORT TYPE

FIGURE 5THE TOTAL WAITING TIME OF SUGARCANE TRUCK
AVERAGE PER WEEK IN TRADITIONAL TRANSPORT TYPE
But in the figure 4 and 5 have some time of graph result has been drop down to lower level because that time is in the new year festival and sugar factory used this time for maintenance and cleaning the milling equipment and accessory in the factory.
The results of new model transportation have show in figure 6 about the collecting location to collecting the sugar cane from farm in nearly directing to sugar factory. The red point is the Saraburi sugar factory location, the black points is the collecting location of sugar cane from farm in nearly location. The total number of collecting location is 91 point to allocate around the farm area and factory, capacity to support cut of leaf, split to small size and stock to collecting in full trucks of collecting location is 200 tons per day.
FIGURE 6LAND OF SUITABLE AREA FOR COLLECTING SUGARCANE BEFORE SENDING TO FACTORY YARD

FIGURE 7 NUMBER OF TRUCKS TO WAITING IN FACTORY YARD IN NEW MODEL TRANSPORT TYPE
The number of trucks to waiting in factory yard in new model transport sugar cane is show in figure 7, that result have maximum number in 279 trips per day. The traffic jam and accident has reduce degree to low, and the queuing time for waiting time has reduce to total time per week in 6 hour and a half, which represent in figure 8.
FIGURE 8THE TOTAL WAITING TIME OF SUGARCANE TRUCK AVERAGE IN
PER WEEK IN NEW MODEL TRANSPORT TYPE

The results number of distance and costs to transport is show in table 1, which traditional transport distance is 105,844,644.54 km. that analysis from all of distance direct from farm to sugar factory and the transportation cost is 731,344,152.92 baths.
TABLE 1COMPARISON OF RESULTS IN METHOD OF TRANSPORTATION TYPE
Method of Transport Distance (km) Transportation Cost (Baths)Traditional Transport 105,844,644.54 731,344,152.92New Model Transport 77,266,590.51 544,120,049.77
Reducing total 28,578,054.03 187,224,103.10Percentage Difference 27% 25.6%
The results of new model transportation distance are 77,266,590.51 km. and transportation cost is 544,120,049.77 baths. After compare the results in 2 scenarios, the transportation distance to reduce is 28,578,054.03 km and the transportation cost is 187,224,103.10 baths if we using the new model of transportation with create collecting location by k-mean to clustering and using the vehicle routing model to transport from farms to collecting location and factory after that. The reduction of percentage transportation distance and transportation costs is 27% and 25.6%, respectively.
CONCLUSION
The methodology and analysis of this research is mainly a guideline to be used geographic information system (GIS) and applied with mathematical model in k-mean clustering and vehicle routing model mainly, the results from both the traditional transportation and new model transportation with creating suitable location of collection sugarcane and routing planning in central region of Thailand. However, it can be applied to another part of the country as well as different kind of corps.
From results, the new model transportation with suitable location by k-mean clustering and vehicle routing model planning just better than the traditional transport to carriage sugarcane to factory. The new model transport can reducing the number of trucks in sugar factory yard maximum from 1,200 trips to 279 trips, and the queuing time to waiting from 28 hour to 6 hour and a half. The transportation distance and cost is percentage reducing to 27% and 25.6%, respectively. But in this study does not including the factors of how to evaluating CCS process and queuing process of sugar cane in each quota, because the both process must to be using simulation and quality to helpful to the accuracy of data and results.
REFERENCES
Pontawepitanun, Nuntana. (2004), “Geo-Informatics for sugar cane industry zoning in eastern Thailand”, Thesis for degree of Master of Science, faculty of graduate studies, Mahidol University.
Min, H. & Zhou, G. (2002), “Supply chain modeling: past, present and future”, Computers & Industrial Engineering, Vol. 43, No. 1-2, pp. 231-249.
Office of the Cane and Sugar Board. (2009), Report of survey plantation of sugarcane area with Geographic Information System 2007/2008. The Office of the Cane and Sugar Board (OCSB), the Ministry of Industry of Thailand.
Higgins, A. (2006), “Scheduling of road vehicles in sugarcane transport: A case study at an Australian sugar mill”, European journal of operation research, Vol. 170, pp. 987-1000.
Higgins, A., Thorburn, P., Archer, A., Jakku, E. (2007), “Opportunities for value chain research in sugar industries”. Agricultural systems, Vol. 94, No. 3, pp. 611-621.
Auckara-aree, Kanya & Boondiskulchok, Rein. (2008), “Analysis of the inbound collecting system for a case of the natural rubber industry in Thailand”. International Journal of Logistics and Transport, Vol. 2, No. 1, pp. 25-39.
Diaz, J.A., Perez, I.G. (2000a). Simulation and optimization of sugar cane transportation in harvest season. Proceedings of the 2000 Winter Simulation Conference.

Diaz, J.A., Perez, I.G. (2000b). Simulation and optimization of sugarcane transportation in harvest season. Proceedings of the 2000 Winter Simulation Conference, pp. 1114-1117.
Martin, F., Pinkney, A., Xinghuo, X.Y. (2001). “Cane railway scheduling via constraint logic programming: leveling order and constraints in a real-live application”. Annals of Operation Research, Vol. 108, pp. 193—209.
Strohm, R. (1999). Logistik im Zuckerrubenanbau, Logistik Management, Springer Berlin, pp. 41-48 (in German).Lukesch, S. (2005). Optimierung der Sudzucker Rubenlogistik mittels iterative linearer programmierung. Supply chain management und logistik: Optimierung, Simulation, Decision Support. Physica, Heidelberg, pp. 235-247 (in German).
Grunow, M., Gunther, H.O., & Westinner, R. (2007). “Supply Optimization for the production of raw sugar”, International Journal of Production economics, Vol. 110, pp. 224-239.
Supsomboon, S., Yosnual, J., 2004. “A stochastic model for optimal order quantity for sugar cane factory with uncertainties”. Proceedings of the Fifth Asia Pacific Industrial Engineering and Management Systems Conference, Gold Cosast, Australia, pp. 21.2.1-21.2.11.
Yosnual, J., Supsomboon, S. (2004). “An integer programming for sugar cane supply allocation”. Proceedings of the Fifth Asian Pacific Industrial Engineering and Management Systems Conference, Gold Coast, Australia, pp. 21.3.1–21.3.10.
Prichanont, K., Prichanont, S., Buransri, N. (2005). “Improvement guidelines for sugar cane delivery systems”.Proceedings of the 35th International Conference on Computers and Industrial Engineering, vol. II. Istanbul, Turkey, pp. 1585–1590.
Lambert, D.M., Stock, J.R. and Ellram, L.M. (1998) Fundamentals of Logistics Management. Singapore: McGraw-Hill.
Bodin, L.D., Golden, B.L. and Assad, A.A. (1983) “Routing and scheduling of vehicles and crews”. Computer and Operation Research, Vol. 10, No. 2, pp: 63-211.
Kanungo, T., Mount, D.M., Netanyahu, N.S., Piiatko, C.D., Silverman, R. and Wu, A.Y. (2002). “An efficient k-means clustering algorithm analysis and implementation”. IEE Trannsactions on Pattern Analysis and Machine Intelligence, Vol. 24, No. 7, pp. 881-892.
Gersho, A. and Gray, R.M. (1992) Vector Quantization and Signal Compression. Boston: Kluwer Academic.
Inaba, M., Imai, H., and Katoh, N. (1996) “Experimental Results of a Randomized Clustering Algorithm.” Proceeding. 12th Annual. ACM Symposiums. Computational Geometry, pp. C1-C2.
Inaba, M., Katoh, N., and Imai, H. (1994) “Applications of Weighted Voronoi Diagrams and Randomization to Variance-Based k-clustering”. Proceeding. 10th Annual. ACM Symposiums. Computational Geometry, pp. 332-339.
Jain, A.K. and Dubes, R.C. (1988) Algorithms for Clustering Data. Englewood Cliffs, N.J.: Prentice Hall.
Agarwal, P.K. and Procopiuc, C.M. (1988) “Exact and Approximation Algorithms for Clustering”. Proceeding Ninth Annual ACM-SIAM Symposiums. Discrete Algorithms, pp. 658-667.
Arora, S., Raghavan, P. and Rao, S. (1998) “Approximation Schemes for Euclidean k-median and Related Problems”.Proceeding 30th Annual ACM Symposiums. Theory of Computing, pp. 106-113.
Kolliopoulos, S. and Rao, S. (1999) “A Nearly Linear-Time Approximation Scheme for the Euclidean k-median Problem”, Proceeding Seventh Annual European Symposiums. Algorithms, J. Nesetril, ed., pp. 362-371.
Garey, M.R. and Johnson, D.S. (1979) Computers and Intractability: A Guide to the Theory of NP-Completeness. New York: W.H. Freeman.
Matousek, J. (2000) “On Approximate Geometric k-clustering”, Discrete and Computational Geometry, vol. 24, pp. 61-84.

Wei, X.G. (2005) “Research on methods of logistics distribution center location”. Logistics and Traffic, Vol. 9, pp. 48-51.
Zhang, X.Z. (2005) “Application of logistics center location based on GIS”, Logistics Technology, Vol. 10, pp. 249-252.


