Operational risk management (ORM) systems – An Australian ...
175
Operational risk management (ORM) systems – An Australian study By Thitima Pitinanondha A thesis submitted in fulfilment of the requirements for the degree of Doctor of Philosophy Faculty of Engineering University of Technology Sydney Australia June 2008
Transcript of Operational risk management (ORM) systems – An Australian ...

Operational risk management (ORM) systems –
An Australian study
By
Thitima Pitinanondha
A thesis submitted in fulfilment of the requirements for
the degree of Doctor of Philosophy
Faculty of Engineering
University of Technology Sydney
Australia
June 2008

Certificate of authorship/originality
I certify that the work in this thesis has not previously been submitted for a degree,
nor has it been submitted as part of requirements for a degree except as fully
acknowledged within the text.
I also certify that the thesis has been written by me. Any help that I have received in
my research work and the preparation of the thesis itself has been acknowledged. In
addition, I certify that all information sources and literature used are indicated in the
thesis.
Signature of Student
__________________________________________________
i

Acknowledgements
This thesis would not have been completed without the great support from many
people. First, I would like to deeply thank my principal supervisor, Dr Hasan Akpolat
for opening the door for me to become a PhD candidate. For what I have learned from
you during the four-year PhD study period, I strongly believe that it will be infinitely
profitable for the rest of my life. Your inspired suggestions, superb guidance and
critical comments have significantly contributed to this thesis.
I am especially indebted to my co-supervisor, Professor James Irish, for guiding and
leading me to the risk management world in my first and second year. While
conducting this research project, I also obtained help from Dr John Crawford and Dr
Douglas Davis. I would like to thank them for providing the comments and
suggestions in questionnaire development and revision. I would like to thank all my
friends and colleagues at the Faculty of Engineering of the University of Technology,
Sydney. Although I cannot mention you all by name, my sincere thanks go out to you
all for creating such a pleasant working environment.
I wish to express my sincere thanks to my father, Manoch Pitinanondha, and my
mother, La-or Pitinanondha, for your love that brought me where I am today. I greatly
appreciate my sister, Thanawan Pitinanondha and my brother, Vorakorn Pitinanondha
for fulfilling my duty to take care of our parents. Finally, I would like to deeply thank
ii

my partner, Vorapin Kusolsomboon for your deep understanding, profound
encouragement, and unlimited support.
Thitima Pitinanondha,
June, 2008
iii

Contents
Acknowledgement ii
Contents iv
List of tables x
List of figures xi
Abstract xii
Chapter 1 Introduction
1.1 Background to the research 1
1.1.1 Operational risk (OR) 1
1.1.2 Managing operational risk 2
1.1.3 Operational risk management (ORM) systems 3
1.1.4 Status of ORM system implementation in Australia 5
1.2 Research objectives 9
1.3 Research questions 10
1.4 Research approach 11
iv

Chapter 2 Literature review
2.1 Introduction 13
2.2 History of ORM systems 13
2.3 The use of ORM systems in Australia 17
2.3.1 Generic risk management systems 17
2.3.1.1 Introduction 17
2.3.1.2 Generic risk management system framework 18
2.3.1.3 Generic risk management system applications 21
2.3.2 Enterprise-wide risk management systems 22
2.3.2.1 Introduction 22
2.3.2.2 ERM system framework 23
2.3.2.3 ERM system applications 25
2.3.3 ORM systems based on operations management systems 26
2.3.3.1 Introduction 26
2.3.3.2 Operations management system frameworks 27
2.3.3.3 Operations management system applications 29
2.3.4 Discussions 31
2.4 Summary 32
v

Chapter 3 Research model, propositions and hypotheses
3.1 Introduction 33
3.2 Proposed ORM system framework in this study 33
3.3 Elements of proposed ORM system framework 36
3.3.1 Element 1: Leadership 36
3.3.2 Element 2: Planning and strategic alignment 37
3.3.3 Element 3: Implementation 38
3.3.4 Element 4: Monitoring and continuous improvement 38
3.3.5 Element 5: Training and performance appraisal 39
3.3.6 Element 6: Employee involvement and empowerment 39
3.3.7 Element 7: Communication 40
3.4 Research model 40
3.4.1 Module 1: Top management 41
3.4.2 Module 2: Process management 43
3.4.3 Module 3: Human resource management 43
3.4.4 Summary of research model 43
3.5 Research propositions and hypotheses 44
3.6 Summary 49
vi

Chapter 4 Research method
4.1 Introduction 50
4.2 Systematic approach for this study 50
4.3 Theoretical foundation 52
4.4 Research design 52
4.5 Data collection method 53
4.6 Implementation 54
4.6.1 Population and sample selection 54
4.6.2 Sample size 55
4.6.3 Questionnaire development 56
4.6.4 Pilot testing 60
4.6.5 Ethics approval 62
4.6.6 Web-based survey 62
4.6.7 Response rate improvement 63
4.6.8 Data entry and data checking 64
4.7 Analysis of data 64
4.7.1 Preliminary data analysis and hypotheses testing 64
4.7.2 Reliability testing 65
4.7.3 Validity testing 67
4.8 Summary 69
vii

Chapter 5 Survey results and discussion
5.1 Introduction 71
5.2 General characteristics of respondents 71
5.2.1 Background of respondents 72
5.2.1.1 Size of responding organisations 72
5.2.1.2 Type of industry 73
5.2.2 Status of respondents’ ORM system practices 74
5.2.2.1 Use of management system standards for ORM systems 75
5.2.2.2 Integration of management system standards 75
5.3 Testing reliability of responses 77
5.4 Testing validity of responses 78
5.4.1 Content validity 78
5.4.2 Construct validity 79
5.4.3 Criterion-related validity 80
5.5 Result of the ORM survey 81
5.5.1 Perceptual responses to ORM practices 82
5.5.2 Perceptual responses to ORM importance 83
5.6 Testing research hypotheses 84
5.7 ORM system implementation guideline 100
5.7.1 Top management 103
5.7.2 Process management 103
viii

5.7.3 Human resource management 104
5.8 Summary 105
Chapter 6 Conclusions
6.1 Introduction 107
6.2 Brief summary 107
6.3 Summary 111
6.4 Limitations and future research perspectives 113
6.5 Research contributions 114
References 115
Appendices
Appendix 1 Final version of questionnaire survey 133
Appendix 2 Letter of approval from UTS Human Research Ethics Committee 138
Appendix 3 Example of survey email 139
Appendix 4 Questionnaire coding sheet 140
Appendix 5 Missing data analysis 150
Appendix 6 Factor analysis 152
Appendix 7 Multiple regression analysis 159
List of publications 161
ix

List of tables
Table 1.1 ORM standards and guidelines 4
Table 1.2 Environmental prosecution cases 9
Table 1.3 Breaching Trade Practices Act cases 9
Table 3.1 Framework comparison 34
Table 4.1 The structure of the research methodology of this study 51
Table 4.2 ORM system factors vs. Questionnaire statements 58
Table 5.1 Size of organisation 73
Table 5.2 Internal consistency analysis results 77
Table 5.3 Construct validity analysis results 80
Table 5.4 Mean practice results 82
Table 5.5 Mean importance results 83
Table 5.6 Comparison statistics for practice and importance 85
Table 5.7 Mean result of each item in Factor 1 87
Table 5.8 Pairwise comparison statistics for items of Factor 1 88
Table 5.9 Mean result of each item in Factor 2 89
Table 5.10 Pairwise comparison statistics for importance items of Factor 2 90
Table 5.11 Mean result of each item in Factor 3 91
Table 5.12 Comparison statistics for importance items of Factor 3 92
Table 5.13 Mean result of each item in Factor 4 93
Table 5.14 Pairwise comparison statistics for importance items of Factor 4 94
Table 5.15 Mean result of each item in Factor 5 95
x

Table 5.16 Pairwise comparison statistics for importance items of Factor 5 95
Table 5.17 Mean result of each item in Factor 6 97
Table 5.18 Comparison statistics for importance items of Factor 6 97
Table 5.19 Mean result of each item in Factor 7 98
Table 5.20 Comparison statistics for importance items of Factor 7 99
Table 5.21 Correlation analysis results of ORM system implementation factors 100
List of figures
Figure 2.1 History of operational improvements 14
Figure 2.2 The three ages of risk management 16
Figure 2.3 The AS/NZS 4360 model 20
Figure 2.4 The COSO ERM model 23
Figure 2.5 The ISO 9001 model 27
Figure 2.6 The ISO 14001 model 28
Figure 2.7 The AS/NZS 4801 model 28
Figure 3.1 The proposed ORM system implementation model 42
Figure 5.1 Breakdown of industry 74
Figure 5.2 Use of management system standards for ORM systems 76
Figure 5.3 Management system integration 76
Figure 5.4 ORM system implementation model 102
xi

Abstract
In today’s business environment, increased competition, market globalisation,
increased customer demands and accelerated technologies require organisations to
focus on efficiency in every aspect of their operations. Many studies in operations
management have focused on the improvement of operational performance, including
reduction of process variability, increasing flexibility or implementing controls in
operations. However, managing the risk in operations seems to have been neglected
by researchers.
Hence, there are two major objectives of this study. The first objective is to
investigate the use of the operational risk management (ORM) systems in Australia
and study the factors that have an impact on effective operational risk management.
Then, based on the identified factors, the second objective is to develop an ORM
system implementation model and guideline for Australian organisations.
A review of the ORM systems and its implementation was conducted. As a result of
this investigation, a definition of ORM system in this study was formulated and the
factors of effective ORM system implementation were identified as a basis for the
next stage of this study.
xii

An investigation of the factors of ORM system implementation was then carried out.
An extensive questionnaire survey was used to collect empirical data from Australian
organisations. Statistical analysis results and feedback from experts was used to
develop an applicable model and guideline for ORM system implementation.
The main outcome of this study is a proposed model and guideline for ORM system
implementation in Australian organisations, which will assist the organisation to
manage operational risks more effectively and provide motivation for carrying out
further research in ORM.
xiii

1
Chapter 1 Introduction
1.1 Background to the research
1.1.1 Operational risk (OR)
Today’s business environment is more complex than ever. All businesses have to live
with uncertainties in every aspect of their operations. According to Raz and Hillson
(2005), there is an increasing interest in improving the organisational ability to deal
with those uncertainties.
Organisations can be considered as systems consisting of many components (e.g.
people, products, processes, culture, etc.) that interact with each other and create
synergies (Akpolat 2004). Regardless of its purpose (e.g. to make profit or not), every
organisation employs a set of core functions and activities to achieve its goals and
objectives. These functions and activities have the potential to generate negative
consequences or risks for its employees (Brown 1996; Brown et al. 2000), for
customers (McFadden & Hosmane 2001), for the environment (Angell 1999; Geffen
& Rothenberg 2000) and for various other stakeholders (Peters 1999). Therefore,
managing risks in operations is essential for any organisation in order to enhance their
operational performance and management efficiency to satisfy their employees, local
community, shareholders, customers and other stakeholders.

2
Operational risk typically covers a broad range of risks that are internal to an
organisation (Corrigan 1998). It can be defined as the risks associated with losses that
may result from inefficiencies or non-conformances within the operational processes
of an organisation including quality, environmental, and occupational health and
safety risks (Cooke 2004; Raz & Hillson 2005). According to Frame (2003),
operational risk is different from other types of risks as it deals with established
processes rather than managing unknown circumstances. However, Williams et al
(2006) points out that managing operational risk is not an easy undertaking because
operational risks are interrelated in many complex ways. One operational risk can
have impacts on other operational risks in the system.
1.1.2 Managing operational risk
In the past, most organisations managed their operational losses by relying on
insurance underwriting and some protective equipment, such as fire extinguishers, to
limit their losses (Sadgrove 1996). Nowadays several factors including government,
customer and public concerns have made insurance and passive actions inadequate.
These contextual changes have led to operational risk management (ORM) becoming
an essential element for most organisations (Waring 2001). However, the number of
empirical researches in ORM is limited.
In financial and insurance fields, on the one hand, most research studies have focused
more on the management of market risk, credit risk and other financial risks rather

3
than operational risk (Cooke 2004; Frost et al. 2001; Hanna et al. 2003). According to
Cruz (2002), there has been an increasing trend of interest in ORM in financial and
insurance fields after the Barings Bank collapse in 1995.
In the operations management field, on the other hand, managing operational risks has
been also largely neglected in the past (McFadden & Hosmane 2001). Many
researchers dedicated their efforts more on improving operational efficiencies, which
include reducing process variability, increasing flexibility or implementing controls
rather than systematically managing risks in operations (Cooke 2004).
1.1.3 Operational risk management (ORM) systems
Although the concept of ORM is still at an immature stage, the need for effective
ORM has increased substantially. It has led to an increasing number of books, articles
and conferences in ORM as well as the development of a number of standards and
guidelines that advise organisations on the ‘best practice’ of ORM (Raz & Hillison
2005). Table 1.1 shows some of the most widely used national and international
standards as well as professional standards and guidelines for ORM. Clearly, most of
the standards and guidelines were recently published. Some standards and guidelines
have been developed to address ORM in the broadest sense dealing with all types of
risks in operations while others have more explicit guidelines to manage specific risks
only.

4
Table 1.1 ORM standards and guidelines
Reference/title Author Date ORM
coverage
National and international standards
AS/NZS 4360:2004, Risk Management Standards Australia and Standards New Zealand
2004 All
HB436:2004, Risk Management Guideline Companion to AS/NZS 4360:2004
Standards Australia and Standards New Zealand
2004 All
AS/NZS 4801:2001, Occupational Health and Safety Management Systems - Specification with Guidance for Use
Standards Australia and Standards New Zealand
2001 Safety risks
CAN/CSA-Q850-97, Risk Management: Guideline for Decision Makers
Canada Standards Association 1997 All
ISO 9001:2000, Quality Management Systems - Requirements
International Organization for Standardization
2000 Quality risks
ISO 14001:2004, Environmental Management Systems - Requirements with Guidance for Use
International Organization for Standardization
2004 Environmental risks
ISO/IEC 17799:2005, Information Technology - Security Techniques - Code of Practice for Information Security Management
International Organization for Standardization and International Electrotechnical Commission
2005 IT risks
JIS Q 2001:2001 (E), Guidelines for Development and Implementation of Risk Management system
Japanese Standards Association 2001 All
Professional standards/guidelines
A Risk Management Standard Institute of Risk Management (IRM), Association of Insurance and Risk Managers (AIRMIC) and National Forum for Risk Management in Public Sector (ALARM), UK
2002 All
Enterprise Risk Management - Integrated Framework
The Committee of Sponsoring Organizations of the Treadway Commission (COSO), USA
2004 All
New Basel Capital Accord - Consultative Document
Basel Committee on Banking Supervision, Switzerland
2001 All
Source: Adapted from Raz and Hillson (2005); Hillson (2006)

5
Paralleling the growth of ORM recognition is a significant increase in how to
implement those standards and guidelines for an effective ORM system. According to
Hillson (2006), having more than one standard is the lack of standardisation, which
would result in confusion and unsuccessful implementation of an ORM system.
1.1.4 Status of ORM system implementation in Australia
Over the past decades, the use of standards and guidelines to proactively manage risks
in operations has been common in Australia and other developed countries. However,
implementation of standards and guidelines differs between organisations.
In Australia, various standards and guidelines are presently being used to manage
risks in operations. One of these standards is based on the risk management system
standard AS/NZS 4360. Australia and New Zealand have pioneered the development
of risk management system standards (see AS/NZS 4360 series). Many organisations
in Australia use the AS/NZS 4360 standards as a basis for their ORM system from a
generic as well as a specific perspective (McCarty & Power 2000; Knight 2002).
However, organisations seem to have difficulties in its implementation. A survey
conducted by Standards Australia in conjunction with Bergman Voysey & Associates
has revealed that only 18% of the surveyed organisations have satisfactorily
implemented the AS/NZS 4360 (Jabbour 1999). In addition, there is a limited number

6
of empirical research studies about the applicability or usage of this standard, or its
effectiveness in handling operational risks.
The enterprise risk management (ERM) framework is an alternative option preferred
by some organisations (Berry & Phillips 1998; Merkley 2001; Eiss 1999; Kayfish
2001; Barrett 2003; Walker et al. 2003; Funston 2003; Schneier & Miccolis 1998). In
Australia, the most commonly published and referred to ERM framework is the
Committee of Sponsored Organisations (COSO) ERM framework. According to
COSO (2004), this ERM framework has many benefits to organisations. However,
there seems to be limited empirical research evidence to back it up. A recent survey
conducted by the IIA Research Foundation about the COSO ERM framework in
various regions including USA, Canada, Europe and Australia has revealed that most
companies were aware of the COSO ERM framework; however, only 11% of
responding organisations fully implemented it (Beasley et al. 2005). Furthermore, a
survey conducted by the Australian National Audit Office (ANAO) showed that most
organisations were facing difficulties with ERM implementations. Some of the
common problems mentioned in the survey included the organisational culture and
lack of expertise in implementation of the ERM framework (McPhee 2003).
As another alternative, many organisations favour managing operational risks using
operations management system standards. As Akpolat and Xu (2002) point out, the
implementation of these standards can be considered as a proactive approach to
manage operational risks. The most commonly used operations management system

7
standards in Australian organisations dealing with operational risk include the
following:
AS/NZS/ISO 9001:2000 - Quality Management Systems. This standard provides
a generic quality management framework and continuous improvement model to
prevent poor quality products and services.
ISO 14001:2004 - Environmental Management Systems. This standard provides a
guideline to identify potential risks (environmental aspects) of harming the
environment (environmental inputs). This helps in complying with environmental
legislation and managing environmental risk.
AS/NZS 4801:2001 - Occupational Health and Safety Management Systems. This
standard provides guidelines to identify hazards, and control and monitor risks. It
also helps in complying with occupational health and safety legislation, and
managing risks related to occupational health and safety.
ISO/IEC 17799:2005 - Information Security Management Systems. This standard
specifies a guideline for securing a documented Information Security
Management System to manage information security risk.

8
Quality management system is one of the most frequently studied frameworks in
operations management research (Williams et al. 2006). Consistent with this fact,
many organisations seem to prefer the quality management system as a foundation for
implementation of the other management systems (Pitinanondha & Akpolat 2005). In
the past few years, many organisations in Australia and elsewhere implemented
environmental, occupational health and safety, and information security management
systems in addition to their existing quality management system.
Over the past decade, although the organisations in Australia have used one or more
standards to manage risks in their operations, two surveys conducted by KPMG’s
Sydney office in 1996 (Tilley 1996) and spot poll conducted by Deloitte in May 2007
(Nicholls 2007) showed similar results that nearly 60% of the Australian
organisations still lack of effective risk management and training. Moreover, there is
an increasing trend in prosecution for breaching the laws such as the Environmental
Protection Act 1994 and Trade Practices Act 1974 in Australia as shown in Table 1.2
and Table 1.3. These results reflect that there is a need for effective ORM processes to
help organisations to sustain overall organisational performance.

9
Table 1.2 Environmental prosecution cases
State 1998-1999 1999-2000 2000-2001 2001-2002 2002-2003
New South Wales 85 115 94 109 115
Victoria 25 44 46 29 34
South Australia 1 1 5 5 2
Tasmania N/A N/A 0 2 1
Source: Annual Reports, Environment Protection Authorities (EPA)
Table 1.3 Breaching Trade Practices Act cases
1999-2000 2000-2001 2001-2002 2002-2003
No. of Cases 77 85 110 198
Source: Annual Reports, ACCC
1.2 Research objectives
The main purpose of this research was to investigate the use of ORM systems in
Australia and study the factors that have an impact on implementation of ORM
systems. These factors are then used to develop a model and guidelines for an
effective ORM system implementation.

10
In this research, new knowledge related to managing operational risks in Australian
organisations can be derived. This new knowledge is generated from existing
operations management knowledge integrated with specific characteristics of risk
management in Australia. After reviewing the existing operations management
literature, it has become very clear that this research is perhaps the only one that
systematically examines the use of ORM systems to manage operational risks in
Australian organisations.
1.3 Research questions
Based on the research objectives, the extensive literature review, brainstorming
sessions with the author’s supervisor, and informal talks with risk management
practitioners, the following research questions have been formulated:
Question 1: What is ORM system?
Question 2: What are the current ORM system practices in Australian organisations?
Question 3: What are the critical success factors of an effective ORM system
implementation?

11
1.4 Research approach
To achieve the research objectives and answer the research questions, a
comprehensive study based on theoretical verification and empirical testing were
conducted. The details of approach used in this research are discussed in the
subsequent chapters of this report. The summary of each chapter is presented as
follows:
Chapter 2 reviews the concept of ORM. It gives a brief history of ORM systems and
explains the fundamental concept of ORM system in this research. Thus, the research
question ‘What is ORM system?’ is answered. The current use of ORM systems in
Australia is reviewed: generic risk management systems (AS/NZS 4360 Risk
management system), enterprise-wide risk management systems (COSO ERM
framework) and operations management systems (ISO 9001 quality management
system, ISO 14000 environmental management system, and AS/NZS 4801
occupational health and safety management system).
Chapter 3 defines the concept of ORM system in this research based on the findings
of the literature review. The ORM system elements (factors) are then discussed and a
research model is proposed.
Chapter 4 describes the methodologies employed in this research. The strategies and
research design are discussed in greater detail. The development of the research

12
instrument, and method of testing reliability and validity of the instrument are also
described in this chapter.
Chapter 5 discusses the results of the survey and the evaluation of the measurement
instrument. The status of ORM in Australia and the perception regarding the critical
success factors of ORM system implementation in Australian organisations are the
two major aspects discussed in this chapter. Thus, the research questions ‘What are
the current ORM system practices in Australia organisations?’ and ‘What are the
critical success factors of an effective ORM system implementation?’ are addressed.
The discussion with academics and industry experts helped the author in
interpretation of the survey findings.
Chapter 6 presents a brief summary and the main conclusions of the research. The
limitations and suggestions for further study are also addressed.

13
Chapter 2 Literature review
2.1 Introduction
Through a literature review, this chapter aims to identify the types of ORM systems
and their use by Australian organisations. Section 2.2 presents the history and concept
of ORM systems. Section 2.3 discusses the ORM systems used in Australian
organisations based on a number of researchers in the field of operations
management. Finally, Section 2.4 summarises this chapter.
2.2 History of ORM systems
As seen in Figure 2.1, managing risks in operations can be traced back to the
beginning of the twentieth century when the scientific management of Frederick
Taylor was formally emerged to manage uncertainties and losses in production
(Taylor 1911). Scientific management was the first attempt to systematically manage
and improve processes. This concept replaced the decision-making based on tradition
and rules of thumb which can be seen as a proactive approach to manage risks in
operations using scientific methods.
Little (1992) points out that process control, continuous process improvement, and
standardisation concepts of scientific management were the important foundations for

14
quality innovation. Around the 1930s, quality control was introduced by Walter
Shewhart, who combined statistics with Lewis’s Theory of Knowledge to control the
variation of production processes and improve product quality (Shewhart 1939).
Shortly after the end of World War II, Edward Deming taught Japanese engineers
Shewhart’s Theory of Variation, statistical process control techniques and “Plan-Do-
Control-Act” cycle. The Japanese successfully blended these ideas with their culture
and tradition to create a new quality concept called Total Quality Control (TQC).
During the 1960s and 1970s, TQC methodology proved to be an effective way of
improving production efficiency and product quality. In the 1980s, Western industries
began adopting Deming philosophy and Japanese quality concepts under the Total
Quality Management (TQM) movement (Deming 1986).
1920s 1940s 1960s 1980s 2000s
Scientific Management
QualityControl
Total Quality Control
TQM, ISO 9000
Six Sigma, Lean, Quality Awards
Figure 2.1 History of operational improvements (Adapted from Akpolat 2004)

15
The idea of quality management and improvement was later adapted into other
operational aspects including environment, occupational health and safety, and
information security. As part of this movement, several national and international
management standards were also developed to help organisations manage losses or
risks in those operations (Brumale & McDowall 1999). In the 1990s, many national
and international quality awards schemes along with the Six-Sigma framework were
introduced to further improve processes and achieve substantial bottom-line results
(Akpolat 2004). The modern era of risk management also began in the 1990s, and
seemed to incorporate many concepts and ideas of the quality movement.
Sadgrove (2005) argues that risk management can be generally broken down into
three ages as shown in Figure 2.2. The first age was around the 1960s and 1970s.
Organisations focused only on managing non-entrepreneurial risks. They commonly
used an ad hoc or passive approach to manage their risks. However, several changes
including stricter government policies, increased customer demands, and growing
public concern, have made an ad hoc or passive approach inadequate for dealing with
risks. During the second age in the 1970s and 1980s, the organisations adopted
various quality concepts to reduce variation in the process as a proactive approach for
managing losses. In the current and third age of ORM that began around the mid-
1990s, organisations have been focusing on both internal and external risks, and
employing management system standards and frameworks as guidelines to
systematically control risks.

16
Risk management is quite comprehensive and has been studied in a broad range of
academic perspectives including financial (Bodnar et al. 1998), economic (Marshall
2000), and political (Kobrin 1979; Keillor et al. 2005) aspects. This research is
concerned with managing the risks associated with losses within operational processes
of the organisation.
Figure 2.2 The three ages of risk management (Adapted from Sadgrove, 2005)
FIRST AGE SECOND AGE THIRD AGE Earlier – 1970s 1970s – 80s 1990s - current
Internal
Insurance
Entrepreneurial and Non-entrepreneurial
Internal and
Market
Uncoordinated
Systematic
Risk type
Solutions
Focus
Strategy
Prevention
Non-entrepreneurial

17
2.3 The use of ORM systems in Australia
Currently, Australian organisations use many different approaches and methods for
managing risks in their operations. These methods can be grouped into three main
categories, namely:
• Generic risk management systems
• Enterprise-wide risk management systems
• ORM systems based on operations management systems
In the following sections, each category will be discussed further. This includes first
an introduction to the approach, then the detailed analysis of frameworks and models
utilised under that approach, and finally the application of those frameworks and
models.
2.3.1 Generic risk management systems
2.3.1.1 Introduction
The Australian and New Zealand Standard AS/NZS 4360, published in 1995, is one
of the first risk management standards of its kind. Knight (2002) points out that this
standard quickly became one of the top-selling standards after its publication. The

18
standard was revised and re-published in 1999. The second revision was published
with minor changes in August 2004.
The main objective of AS/NZS 4360 is to assist organisations in the implementation
of risk management practices. It provides a risk terminology/glossary, generic
implementation guidelines and a framework or model for risk assessment and
management. According to Keey (2003), AS/NZS 4360 introduces a simple risk
management approach that can be used across various disciplines and industries.
Unlike other management systems, there is currently no national or international
certification scheme available for a risk management system. It is also important to
note that AS/NZS 4360 does not require compliance with any legislative
requirements.
2.3.1.2 Generic risk management system frameworks
The AS/NZS 4360 risk management framework can be divided into a risk
management program and a risk management process. The risk management program
is the practice of risk management within an organisation. It consists of six
implementation steps, namely:
• Develop a risk management plan
• Ensure the support of senior management
• Develop and communicate the risk management policy
• Establish accountability and authority

19
• Customise the risk management process
• Ensure adequate resources.
The AS/NZS 4360 risk management process, as shown in Figure 2.2, consists of the
following components:
• Establish the context: Defining a risk management strategy and its
objectives, identifying an organisation’s capabilities, defining risk
evaluation criteria and developing a risk management plan.
• Identify risks: Identifying those (negative) outcomes which may have an
impact on an organisation’s objectives.
• Analyse risks: Identifying existing controls by considering the range of
potential consequences and the likelihood of their occurrence.
• Evaluate risks: Comparing risks against the organisation’s established
criteria and considering the balance between benefits and outcomes.
• Treat risks: Developing and implementing plans for treating those risks
previously established.
• Monitor and review: Monitoring and reviewing the performance and cost
effectiveness at each stage of the risk management process for continuous
improvement.
• Communicate and consult: Maintaining dialog with internal and external
stakeholders at each stage of the risk management process.

20
In summary, it can be argued that the AS/NZS 4360 model is developed on the basis
of the well-known ‘Plan-Do-Control-Act’ (PDCA) methodology. The components
‘Establish the context’ and ‘Communicate and consult’ can be seen as being the ‘Act’
phase, the component ‘Risk assessment’ as the ‘Plan’ phase, the component ‘Treat
risks’ as the ‘Do’ phase and the component ‘Monitor and review’ as the ‘Control’
phase. This simple risk management model also provides the answers to the
fundamental questions: Why manage risks, how to manage risks, and what risks need
to be managed.
Figure 2.3 The AS/NZS 4360:2004 – Risk management system model

21
2.3.1.3 Generic risk management system applications
The AS/NZS 4360 provides a framework that can be adapted by any organisation or
industry, as it does not emphasise any particular type of risks. As a management
framework, it could be applied to a wide variety of activities, decisions or operations
ranging from individual projects through to the corporate governance of any
organisation. In Australia, the approach outlined in the AS/NZS 4360 has been
adopted by federal, state and local government departments (Commonwealth of
Australia 1996a, Commonwealth of Australia 1996b) as well as by larger
organisations including the Australian Stock Exchange, ANZ Banking Group,
Australia Post, Qantas Airways, Telstra, BHP Billiton and Pioneer Australia for their
risk management program (Standards Australia and Standard New Zealand 2000).
It is too early to say whether these standards are effective in handling operational
risks. The number of research studies on the effectiveness of these standards is
limited. However, the case studies conducted by Arthur Andersen and several
participating organisations proved that this systematic risk management method
enabled organisations to minimise losses and maximise opportunities (Standards
Australia and Standard New Zealand 2000).
Despite these positive results, the AS/NZS 4360 has not been used widely as a risk
management model. According to a survey conducted among Australian organisations
by the consulting and accounting firm KMPG, only 40% of the respondents had

22
formal risk management strategies and policies in place (Tilley 1996). This seems to
be due to mainly the lack of management commitment to implementation of a risk
management program (Tilley 1997). Moreover, many organisations also appear to
have insufficient skills in implementing the framework (Karapetrovic 2003).
2.3.2 Enterprise-wide risk management systems
2.3.2.1 Introduction
ERM is an emerging concept that can be defined as an approach to managing risks in
an organisation by integrating and coordinating all risks across the entire organisation
(Kleffner et al. 2003; Sharman 2002). In this research, the ERM framework is
differentiated as a separate entity to other models which can be used as an enterprise-
wide risk management program. Some organisations, for instance, use the AS/NZS
4360 model in conjunction with other management approaches to manage risks across
the entire company (Affisco et al. 1997). Other organisations, on the other hand, use
their own self-developed models as an enterprise risk management program (COSO
2004; Sharman 2002).
Almost parallel to the AS/NZS 4360, the Committee of Sponsoring Organizations of
the Treadway Commission (COSO) developed the risk control methodology ‘Internal
Control - Integrated Framework’. Recent increases in concerns about risk
management practices led COSO then to expand on the Internal Control framework

23
and develop a robust framework called ‘Enterprise Risk Management - Integrated
Framework’. This framework is currently one of the most commonly published and
referred to risk management programs in Australia.
2.3.2.2 ERM system frameworks
As shown in Figure 2.3, the COSO ERM framework consists of three dimensions.
The first dimension consists of the four objectives of the framework including
Strategic; Operations; Reporting; and Compliance. The second dimension model
Figure 2.4 The COSO ERM– Integrated Framework

24
identifies the multi-level implementation of the model and comprises: Subsidiary;
Business Unit; Division, and Entity-Level.
The third dimension consists of the following eight components:
• Internal environment: Establishing the foundation of an organisational risk
management framework.
• Objective setting: Ensuring that the objectives are aligned with company’s
strategic goals.
• Event identification: Identifying internal and external factors that may
impact the organisation’s strategy and the achievement of objectives.
• Risk assessment: Analysing risks in the operations with an emphasis on
both the likelihood and impact of potential events.
• Risk response: Selecting risk responses and developing actions based on
risk tolerances set by the organisation.
• Control activities: Establishing and implementing policies and procedures
to ensure that risk responses are carried out effectively.
• Information and communication: Disseminating information about risk-
related matters to all levels of the organisation.
• Monitoring: Ensuring that all components of the enterprise risk
management framework are applied at all levels of the organisation.

25
Like the AS/NZS 4360 model, a closer look at the COSO model revealed that, it too
uses the PDCA methodology as the basis. The first two components ‘Internal
environment’ and ‘Objective setting’ are the ‘Act’ phase. The components ‘Event
identification’ and ‘Risk assessment’ refer to the ‘Plan’ phase while the component
‘Risk response’ can be seen as the ‘Do’ phase of the PDCA cycle. The components
‘Information and communication’ and ‘Monitoring’ are the final phase ‘Control’.
In summary, the eight components of COSO ERM framework perfectly align with the
seven elements of AS/NZS 4360. The only difference between these two models
appears to be the fact that the COSO model specifies the top-down implementation of
an organisation-wide risk management program.
2.3.2.3 ERM system applications
Like the AS/NZS 4360 framework, the COSO ERM model is generic in nature and
could be applied by all organisations, industries and sectors. According COSO, this
ERM framework has many benefits to organisations (COSO 2004). However, there
seems to be limited research evidence for this and is currently being explored further.
A recent survey conducted by the IIA Research Foundation about the benefits of the
COSO ERM framework in several countries, including USA, Canada, Europe and
Australia, comprising various disciplines, has confirmed that most companies were
aware of the COSO ERM framework. However, only 11% of responding
organisations had a complete ERM framework in place (cited in Beasley et al. 2005).

26
Furthermore, a survey conducted by the ANAO showed that most organisations were
facing difficulties with the ERM implementations. Some of the common problems
mentioned in the survey included the organisational culture and lack of expertise in
implementation of the ERM framework (cited in McPhee 2003).
The Enterprise Risk Management (ERM) framework is an alternative option preferred
by some organisations (COSO 2004; DeLoach 2000; Hopkin 2002). Like the AS/NZS
4360 framework, due to limited research it is too early to suggest that implementing
an ERM model leads to better results in regard to managing operational risks.
2.3.3 ORM systems based on operations management systems
2.3.3.1 Introduction
The idea of reducing losses caused by poor product or service quality through the
implementation of a ‘standardised’ system is not new and can be expanded into other
aspects of an operation as well. Currently, various management system standards are
available that can help organisations deal with risks in different operations (Brumale
& McDowall 1999).
In the past few years, many organisations in Australia and elsewhere implemented
environmental and/or safety management systems in addition to their existing quality
management system. Like the quality management system, environmental and safety
27
management systems can be certified by a third party using the following standards:
ISO 9001:2000 for the quality management system (QMS); ISO 14001:1996 for the
environmental management system (EMS); and AS/NZS 4801:1996 for the
occupational health and safety management system (OH&SMS).
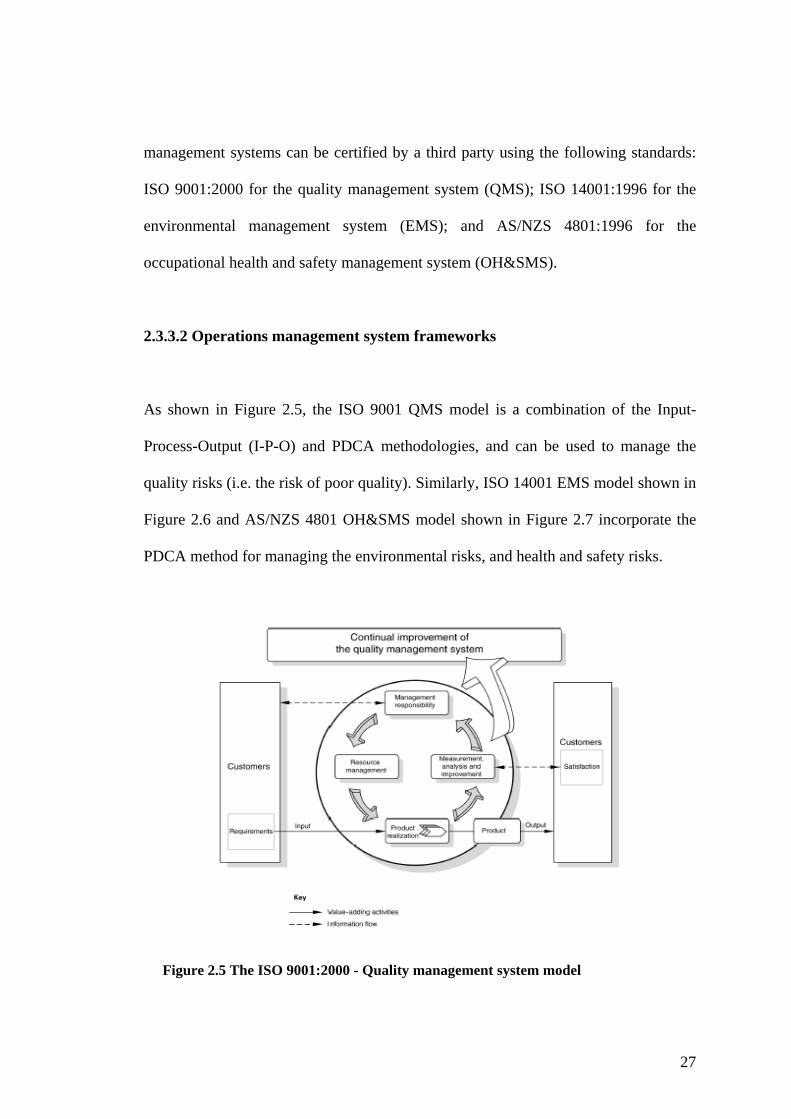
2.3.3.2 Operations management system frameworks
As shown in Figure 2.5, the ISO 9001 QMS model is a combination of the Input-
Process-Output (I-P-O) and PDCA methodologies, and can be used to manage the
quality risks (i.e. the risk of poor quality). Similarly, ISO 14001 EMS model shown in
Figure 2.6 and AS/NZS 4801 OH&SMS model shown in Figure 2.7 incorporate the
PDCA method for managing the environmental risks, and health and safety risks.
Figure 2.5 The ISO 9001:2000 - Quality management system model

28
Figure 2.7 The AS/NZS 4801:2001 – Occupational health and safety management system
Figure 2.6 The ISO 14000:2004 - Environmental management system model

29
2.3.3.3 Operations management system applications
According to Brumale and McDowall (1999), the implementation of management
systems can be considered as a proactive approach to managing risks and reducing
losses. Review of the literature about the quality, environmental and safety
management systems reveals that there is a relationship between those management
systems practices and the performance of an organisation (QMS (e.g. Gordon &
Wiseman 1995; Maani 1994; Sohal et al. 1992), EMS (e.g. Klassen & McLaughlin
1996; Sroufe 2003), and OHSMS (e.g. Lin & Mills 2001; Mohamed 1999)).
The relationship between quality management practice and organisational
performance has been discussed widely in the literature. According to the empirical
study carried out by Zhang (2000), the quality management practices have a positive
impact on operational performance in strategic, processes, suppliers, customers and
employees areas. This positive impact also leads to minimise the losses. These
findings are consistent with the results of other researchers (Powell 1995; Tena et al.
2001, Terziovski & Samson 1999). They also argue that implementation of quality
management practices as a whole shows better effect on overall performance.
Like the quality management practices, the link between environmental management
and organisational performance has been also discussed. The findings of research
conducted by Sroufe (2003) indicated the positive relationship between environmental
management practices and operational performance. This relationship seems to lead to

30
cost savings, market gains, higher material utilisation, and better product quality. As
discussed by Lin and Mills (2001), most occupational health and safety research
studies have shown that effective safety management leads to reduction of workplace
injuries.
Several factors may be responsible for the success of these management system
practices. Top management commitment seems to be the most critical factor for
success (Klassen & McLaughlin 1996; Lin & Mills 2001; Powell 1995; Sohal &
Terziovski 2000; Zhang 2000). Other factors include communication (Sroufe 2003),
employee empowerment (Powell 1995), training, involvement and review of the
system (Sohal & Terziovski 2000).
In Australia, most organisations use the three management systems as stand-alone
rather than as an integrated management system (Hasan & Kerr 2003). According to
Terziovski and Samson (1999), however, there is an increasing trend to amalgamate
all the management systems into a single integrated management system. A number
of benefits, such as minimising cost, reducing duplication, and saving time in the
implementation of an integrated management system, have been identified by many
researchers (Beechner & Koch 1997; Brumale & McDowall 1999; Jonker &
Karapetrovic 2003; Karapetrovic 2003; Karapetrovic & Willborn 1998; Scipioni et al.
2001).

31
The idea of management system integration became a popular research and discussion
topic after the publication of the environmental management system standard ISO
14001 in 1996 (Affisco et al. 1997; Beechner & Koch 1997; Karapetrovic & Willborn
1998). In recent years, the idea of integration has also expanded to occupational
health and safety (Scipioni et al. 2001) and other management systems (Jonker &
Karapetrovic 2003; Karapetrovic 2003).
2.3.4 Discussions
The following conclusions can be drawn from the discussions and analysis of ORM
system standards and frameworks:
• Presently in Australia, most organisations use one of the following three ORM
system frameworks: generic risk management systems (AS/NZS 4360),
enterprise-wide risk management systems (COSO ERM) or ORM systems
based on operations management systems (QMS, EMS and/or OH&SMS).
• A closer look at the discussed models revealed that the three frameworks refer
to the PDCA improvement methodology. This is not surprising, as most
commonly used business improvement methods and concepts, including TQM
and Six Sigma, also share the same PDCA roots.

32
• Whether stand-alone or integrated, it seems that many organisations face
difficulties with the implementation of first two frameworks, namely: generic
risk management systems (AS/NZS 4360) and enterprise-wide risk
management systems (COSO ERM). In contrast, managing operational risks
based on the QMS, EMS and OH&SMS models appears to be more common.
2.4 Summary
This chapter began with a review of the concept and history of ORM systems in the
operations management field. The three commonly used ORM systems, including
generic risk management systems (AS/NZS 4360), enterprise-wide risk management
systems (COSO ERM), and operations management systems (ISO9001, ISO14000,
and AS4801), were then reviewed. The frameworks and applications of these ORM
systems were also discussed.
The implementation of ORM system for many organisations has not been an easy
task. As discussed in this Chapter, has been shown, there is no framework that
integrated all approaches to manage operational risk. There is a need for a theoretical
model of more effective ORM system implementation. We propose such a model in
the next Chapter.

33
Chapter 3 Research model, propositions and hypotheses
3.1 Introduction
This chapter presents a framework and research model for ORM system
implementation in this study. Section 3.2 defines the ORM system framework while
Section 3.3 explains the elements of the framework in detail. Section 3.4 discusses the
proposed research model. Section 3.5 presents propositions and research hypotheses.
Finally, Section 3.6 summarises this chapter.
3.2 Proposed ORM system framework in this study
The extensive literature review suggests that ORM encompasses a vast spectrum of
topics and perspectives. Various standards and frameworks have been used for ORM.
In fact, the implementation of one or more operations management systems is
considered to be a proactive way to manage and reduce operational risks (Akpolat
2004; Gardner & Winder 1997).
In the field of operations management systems, quality management system seems to
be the most studied area. There are three commonly referenced articles by Saraph et
al. (1989), Flynn et al. (1994) and Ahire et al. (1996). Ahire et al. (1996)
recommended that an integration of these three frameworks would be useful for future

34
research. Therefore, this study attempts to develop the elements/factors that relate to
ORM system implementation based on the quality management system as well as risk
management system implementation.
Table 3.1 Framework comparison
Framework Elements/factors
Proposed ORM system framework
1: leadership; 2: planning and strategic alignment; 3: implementation; 4: monitoring and continuous improvement; 5: training and performance appraisal; 6: employee involvement and empowerment; and 7: communication.
Risk management system (AS/NZS 4360:2004)
1: review of existing process; 2: risk management plans; 3: top management support; 4: risk management policy; 5: authority and accountability; 6: customise of risk management process; and 7: adequate resources.
Quality management system (Saraph et al. 1989)
1: role of divisional top management and quality policy; 2: role of quality department; 3: training; 4: product/service design; 5: supplier quality management; 6: process management/operating; 7: quality data and reporting; and 8: employee relations.

35
Table 3.1 Framework comparison (cont.)
Framework Elements/factors
Quality management system (Flynn et al. 1994)
1: quality leadership; 2: quality improvement rewards; 3: process control; 4: feedback; 5: cleanliness and organisation; 6: new product quality; 7: interfunctional design process; 8: selection for teamwork potential; 9: teamwork; 10: supplier relationship; and 11: customer involvement.
Quality management system (Ahire et al. 1996)
1: top management commitment; 2: customer focus; 3: supplier quality management; 4: design quality management; 5: benchmarking; 6: SPC usage; 7: internal quality information usage; 8: employee empowerment; 9: employee involvement; 10: employee training; 11: product quality; 12: supplier performance.
Quality management system (Malcolm Baldridge National Quality Award (MBQA) and Australian Business Excellence Framework (ABEF))
1: leadership; 2: strategic and planning; 3: customer and market focus; 4: information and knowledge management; 5: people; 6: process management; and 7: business performance results
Table 3.1 shows the framework comparison among the ORM system elements/factors
in this study and others researches. The ‘supplier relationship’ and ‘customer
involvement’ elements/factors in Flynn et al. (1994) framework, ‘supplier quality

36
management’ element/factor in the Saraph et al. (1989) framework, ‘customer focus’,
‘supplier quality management’, ‘benchmarking’, and ‘supplier performance’
elements/factors in Ahire et al. (1996) framework and ‘customer and market focus’
element/factor in MBQA and ABEF were not included in this research framework
since those elements/factors focused on customer, supplier and competitors which are
external to the organisation.
In this study, an ORM system is defined as follows:
“A management system for managing losses in operational processes based on
leadership, planning and strategic alignment, implementation, monitoring and
continuous improvement, training and performance appraisal, employee involvement
and empowerment, and communication.”
3.3 Elements of proposed ORM system framework
3.3.1 Element 1: Leadership
DuBrin (1995) defined leadership as an ability to motivate confidence and deliver
supports among those needed to achieve organisational goals. According to Anderson
et al. (1994), the main role of top management is to establish, practise, and lead a
long-term vision for the organisation. Many management systems studies have

37
identified that the effective management system was directly associated with the role
and attitude of top management in the organisation (Klassen & McLaughlin 1996; Lin
& Mills 2002; Powell 1995; Pun & Hui 2002; Rahman 2001; Sohal & Terziovski
2000; Zhang 2000). Strong commitment from top management is vital. Brown et al.
(1994) points out that lack of top management commitment is one of the reasons for
management system failure. However, only top management commitment may not be
adequate. Stated vision and policy are also the powerful motivating force that can be
used to drive the process (Kanji & Asher 1993). Thus, the concept of leadership in
this study can be defined as the ability of top management to lead the organisation to
long-term business success.
3.3.2 Element 2: Planning and strategic alignment
Planning is one of the critical and core processes of a system and provides a great
potential for identifying and controlling other processes in the system. A strategic
plan provides the guidance to accomplish the goals. Alignment of the strategic plan to
business strategies is also the major concern for most organisations to achieve the set
goals (Akpolat 2004). An ORM plan should define how ORM is to be conducted
throughout the organisation. Employees at different levels should be involved in
developing the plan, which should be well communicated to all employees (Mann
1992). As a result, their commitment to the realisation of the plan is encouraged.

38
3.3.3 Element 3: Implementation
The system is defined as the organisation structure, procedures, processes, and
resources needed to implement the management (ISO8402 1994). After having
established the plan, the organisation should put the plan into action. The
implementation of an ORM system means to establish the system according to the
plan which is based on the objectives, requirements, benefits and resources of the
organisation. Zhang (2000) stated that implementation of the system as a whole shows
better on overall performance.
3.3.4 Element 4: Monitoring and continuous improvement
Monitoring is systematic examination used to identify the differences between actual
performance and the goal. It offers a starting point for continuous improvement by
understanding of the issue and the areas demanding attention. According to Flynn et
al. (1994), monitoring and continuous improvement of the system can ensure all
processes operate as expected. An important matter in monitoring and improving the
system is maintenance of the system to meet goals and targets. Goals and targets can
be defined as key performance indicators. Operational performance results are
normally used to plan the improvement. In addition, an audit can be used to evaluate
the need for standardisation of the system and continuous improvement.

39
3.3.5 Element 5: Training and performance appraisal
Training refers to the attainment of specific skills or knowledge that educates
employees about how to perform their job or activities, while education attempts to
provide employees with general knowledge that can be applied in many different
situations (Cherrington 1995). Deming (1986) pointed out that it is important to
properly train employees in performing their work. They are valuable resources
worthy of receiving education and training throughout their career development.
Cherrington (1995) also suggested that education and training require systematic
approach. It also requires a good performance assessment. Careful analysis of
employees’ performance provides valuable information to design effective training
activities.
3.3.6 Element 6: Employee involvement and empowerment
Employee involvement can be defined as the degree to which employees in an
organisation engage in various activities. It can be demonstrated by things such as
teamwork, employee suggestions and employee commitment. Deming (1986) points
out that teamwork is needed throughout organisations to compensate one’s strength
for another’s weakness. It can be characterised as a cross-functional team and
collaboration between managers and non-managers (Dean & Bowen 1994). To have
effective employee involvement, employee suggestions must receive serious

40
consideration and be taken into account whenever it is relevant in operations. Deming
(1986) and Ishikawa (1985) stated that one way to motivate employees at work is to
let them accomplish things and see those things actually work. Lam (1995) also points
out that employees committed to their jobs will be motivated to work and provide
high performance. To effectively manage the system, employees must be empowered
and encouraged to solve the problems they encounter (Deming 1986).
3.3.7 Element 7: Communication
Communication is essential for any organisational initiative, problem identification
and change management (Juran & Gryna 1993). It is vital to a success of ORM
system program. The employees’ responsibilities and awareness should be established
and communicated throughout the organisation. Sohal and Terziovski (2000) stated
that there should be two-way communication between employees and management
regarding ORM matters to ensure the correct decision is made all the time.
3.4 Research model
Through an extensive literature review, a research model was proposed. This research
model contains seven elements/factors: leadership; planning and strategic alignment;
implementation; monitoring and continuous improvement; training and performance

41
appraisal; employee involvement and empowerment; and communication, which are
believed to be the factors that have an affect on ORM system implementation.
As shown in Figure 3.1, those elements/factors are grouped into three fundamental
modules: top management module; process management module; and human resource
management module.
3.4.1 Module 1: Top management
The top management module represents the role and attitude of top management in
implementing the ORM system. In this module, leadership is the main element that
drives the whole system to meet or exceed the organisation’s goals.
The roles and responsibilities of top management include:
• committing to the success of an ORM system program
• developing an organisational mission, vision and values
• defining ORM policy and objectives
• driving and communicating ORM system across the organisation
• providing adequate resources and supports for ORM system activities
• reviewing of organisational performance regularly
• establishing appropriate levels of recognition, reward, approval and sanction
for risk-related actions.

42
Figure 3.1 The proposed ORM system implementation model
Module 2: Process management
Module 3: Human resource management
Effective ORM system
ORM
Implementation
Planning and strategic
alignment
Monitoring and continuous
improvement
Training and performance
appraisal
Employee involvement and empowerment
Communication
Element 2 Element 3 Element 4
Element 5 Element 6 Element 7
Module 1: Top management
Element 1
Leadership

43
3.4.2 Module 2: Process management
The process management module serves as the core processes of the ORM system
that plan, implement and monitor the whole system. It is comprised of three
elements: planning and strategic alignment; implementation; and monitoring and
continuous improvement.
3.4.3 Module 3: Human resource management
Human resource is the most valued asset for any organisation as people contribute to
the achievement of its objectives. Human resource management serves as a
mechanism to plan, manage and improve human resources. It is comprised of three
elements: training and performance appraisal; employee involvement and
empowerment; and communication.
3.4.4 Summary of research model
In the proposed model, the top management model defines objectives, and sets
direction and resources to achieve organisation’s goals. The process management
module sets a plan aligned with business strategies, and executes and continuously
improves operational performance, while human resource management module
develops and motivates employees to utilise their potential to align with the
organisation’s objectives and delivers the results.

44
3.5 Research proposition and hypotheses
According to the literature review, it would appear that the previous research studies
have not or insufficiently identified factors in the success of ORM system
implementation. The primary purpose of this study is to identify the factors that are
related to the success in implementing an ORM system.
Seven factors of ORM system implementation - leadership, planning and strategic
alignment, implementation, monitoring and continuous improvement, training and
performance appraisal, employee involvement and empowerment, and
communication - have been identified in the literature of operation management.
Although several studies have discussed the importance of those ORM system factors,
none has empirically examined the effects of these factors on ORM system
implementation.
Based on the proposed research model in this study and the review of literature, the
following propositions and hypotheses were proposed:
Proposition 1: Importance and practice
In Australia, ORM system has been widely implemented due to the organisational
awareness of the benefits and advantages of the ORM system. However, some

45
organisations seem to fail to transform that awareness in implementing ORM system
effectively.
Hypothesis 1: There is a significant difference between the importance and practice
of an ORM system.
Proposition 2: Leadership
Top management has a key role in leading the organisation to long-term success. Top
management should be fully committed to ORM and share the vision and direction
with all level in the organisation. Leadership and support from top management are
the vital ingredients of the implementation of an ORM system.
Hypothesis 2: Leadership has a positive impact on an ORM system.
Proposition 3: Planning and strategic alignment
Planning provides the road map for the achievement of goals. Strategic alignment of
the plan can improve resource allocation and encourage employees to focus their
attention on achieving clear and specific goals.

46
Hypothesis 3: Planning and strategic alignment have a positive impact on an effective
ORM system.
Proposition 4: Implementation
Implementation of an ORM system should be planned and systematic implementation
process. It is essential that all employees take part in the implementation in order to
increase their ownership of ORM system.
Hypothesis 4: Implementation has a positive impact on an effective ORM system.
Proposition 5: Monitoring and continuous improvement
Monitoring provides the essential mechanism for the control of an ORM system. It
can also be used for continuous improvement of the ORM system practices.
Hypothesis 5: Monitoring and continuous improvement have a positive impact on an
effective ORM system.

47
Proposition 6: Training and performance appraisal
Training can improve employees’ knowledge and skills and have important influence
on their development. Analysis of employees’ performance also provides valuable
information to design effective training program for employees. Therefore, employees
can generate ideas for solving problems and achieve objectives.
Hypothesis 6: Training and performance appraisal have a positive impact on an
effective ORM system.
Proposition 7: Employee involvement and empowerment
Employee involvement and empowerment are required for a successful
implementation of the ORM system. The participation of employee in ORM system
activities will increase their job satisfaction. Employee satisfaction may also increase
if employees are empowered to make suggestions for improvement.
Hypothesis 7: Employee involvement and empowerment have a positive impact on
an effective ORM system.

48
Proposition 8: Communication
Communication is vital to a success of ORM system. Communication channel should
be clearly established and ORM awareness need to be communicated at all levels of
the organisation.
Hypothesis 8: Communication has a positive impact on an effective ORM system.
Proposition 9: ORM system factors
Leadership, planning and strategic alignment, implementation, monitoring and
continuous improvement, training and performance appraisal, employee involvement
and empowerment, and communication are the factors of an effective ORM system.
They all are interrelated and have an impact on ORM system.
Hypothesis 9: There is a significant interrelationship among the seven factors of an
ORM system.

49
3.6 Summary
Based on the results of the literature review in the previous chapter, the concept of an
ORM system in this study was defined. ORM system consists of seven main
elements: leadership and commitment; planning and strategic alignment;
implementation; monitoring and continuous improvement; training and performance
appraisal; employee involvement and empowerment; and communication. The
detailed explanations of these elements were also described. Then, the research model
for ORM system implementation was proposed. The model consists of three modules
which are: top management module; process management module; and human
resource management module. Finally, the research proposition and hypotheses in this
study were presented. The next chapter will be demonstrated the research
methodologies employed to evaluate the proposed research model, propositions and
hypotheses for ORM system implementation.

50
Chapter 4 Research method
4.1 Introduction
This chapter describes the research methodology employed in carrying out this
research. Section 4.2 presents an overview of the systematic approach used for this
research. Section 4.3 provides a theoretical foundation of this study, while Section 4.4
discusses research design. Section 4.5 discusses the method of data collection. Section
4.6 provides the detail of implementation method including population and sample
selection, sample size, questionnaire development, pilot testing, ethics approvals,
web-based survey, response rate improvement, and data entry and data checking.
Section 4.7 presents data analysis methods for preliminary data analysis, hypotheses
testing, reliability testing, and validity testing. Finally, Section 4.8 summarises this
chapter.
4.2 Systematic approach for this study
Based on a systematic approach for empirical research methods in operations
management recommended by Flynn et al. (1990), this research is structured into a
five-stage study: establish the theoretical foundation; select a research design; select a
data collection method; implementation; and data analysis. Table 4.1 presents an

51
overview of the structure with brief research methodology for each stage of this
research.
Table 4.1 The structure of the research methodology of this study
Stage Activity
Theoretical foundation Descriptive study and theory verification study
Research design Questionnaire survey
Data collection method Quantitative and qualitative methods
Implementation
Population and sample selection
Sample size
Questionnaire development
Pilot testing
Ethics approval
Web-based survey
Response rate improvement
Data entry and data checking
Data analysis
Preliminary data analysis and hypotheses testing
Reliability testing
Validity testing

52
4.3 Theoretical foundation
This study can be considered as both a descriptive study and theory verification study.
A descriptive study is generally concerned with making complicated things
understandable (Punch 2000). Since the study used a literature review to identify the
concept of ORM and to provide a detail understanding of the status of ORM systems
today in terms of its research and its application, it can be argued that this stage of the
study is a descriptive study. After the research hypotheses were generated from the
literature and tested using the quantitative results, this study moved further to explain
as a theoretical verification study which focused on testing of the hypotheses (Flynn
et al. 1990).
4.4 Research Design
A web-based questionnaire survey was used to obtain information from a wide range
of Australian organisations about ORM system practices and opinion on critical
success factors of an effective ORM system implementation.
The questionnaire was chosen for this research because it is a convenient and
inexpensive method that can cover a wide geographical area compared to other
methods (Cooper & Emory 1995). Therefore, the collection of data from respondents
who were located all over Australia could be made simpler. Furthermore, this method

53
was favoured by respondents, as the questions are likely to be easy to understand and
convenient to response at their own pace and time (Sekaran 2003). Kumar (2005) also
pointed out that the questionnaire method provides greater anonymity which could
help to increase the accuracy of information obtained in some situations where
sensitive questions are asked.
Using a questionnaire as a web-based survey generally yields higher response rates
compared to other questionnaire survey techniques. However, finding and selecting
representative samples in electronic surveys could be the problematic area
(Williamson 2002). Details of the techniques for selecting valid representative
samples and improving the rates of response will be discussed in Section 4.6.
4.5 Data collection method
Qualitative and quantitative methods are normally used for collecting data in
empirical research. The qualitative method generally assists researchers to understand
in-depth and detailed descriptions of phenomena being studied (Yin 1984). Even
though the qualitative method provides a wealth of detailed information with a small
number of cases involved, it tends to generalise and be less useful for testing
hypotheses among variables (Ott 1989). The quantitative method, on the other hand,
is a structured methodology that allows researchers to quantify the extent of
phenomena being studied. It also provides a generalisable set of findings based on

54
statistical analysis which is fairly reliable (Kumar 2005). Therefore, the quantitative
method is more appropriate for generalisation and hypotheses testing.
Based on the theoretical foundation of this study, the quantitative method was mainly
used to design most questions in the questionnaire. However, some open-ended
questions were included in the questionnaire to collect qualitative data from the
respondents to get additional comments and strengthen research design by using both
quantitative and qualitative approaches.
4.6 Implementation
4.6.1 Population and sample selection
According to Cooper and Emory (1995), the population can be determined from the
objectives and the problem addressed in the research. Based on the objectives in this
study, the population covered small, medium, and large Australian business
organisations which were certified to one or more operations management system
standards. However, collecting the data from every certified organisation in Australia
would have been extremely expensive and time consuming. Thus, the potential
representative samples were drawn from the Joint Accreditation System of Australia
and New Zealand (JAS-ANZ) database in conjunction with Kompass (an electronic
database of Australian businesses). The JAS-ANZ database provides the list of

55
certified organisations, certified standard, and certified year, while the Kompass
database provides the organisation’s details including name, number of employees,
annual revenue, contact person, postal address, email address, website and telephone
number.
For this sampling frame, the selection of potential respondent organisations for
investigating ORM system implementation was undertaken on the basis of the number
of employees. Business organisations that had fewer than ten employees were
excluded from the sample. They may be termed as very small or micro business
organisations. The reason for their exclusion was that the practice of systematic
management system might not be carried out in very small or micro businesses. In
addition, the annual revenue was not included for this consideration because the
annual revenue might not be the main concern for the practice of systematic
management system.
4.6.2 Sample size
Based on the data of 2005 in JAS-ANZ database, there were about 15,000
organisations certified to one or more management system standards. As
recommended by Cooper and Emory (1995), the sample size was decided by
considering time, resources, expected response rate and requirements for statistical
analysis. A sample was obtained of 450 organisations randomly selected from the
JAS-ANZ database and matched with the contact details listed in Kompass.

56
4.6.3 Questionnaire development
The development of a suitable and reliable questionnaire is one of the major tasks in
empirical research. According to Fowler (1993), designing good questionnaires
should include carefully wording the questions. In particular, the questions should be
clear, simple and straightforward.
In the field of operations management, a number of researchers have employed
questionnaire surveys as tools to collect data (e.g. Flynn et al. 1994; Whybark 1997;
Sohal & Terziovski 2000). The questionnaires developed by these researchers gave
some insights into developing the questionnaire in this study. However, the design of
this research questionnaire was mainly developed from the theoretical constructs in
this study.
The questionnaire developed in this study consisted of two sections: Section 1 –
General organisation information; and Section 2 – Success factors for operational risk
management systems.
Section 1 – General organisation information
This section consists of questions related to general characteristics of the respondents,
which include each respondent’s department, industry type and organisation size. The
list of industry types followed ANZSIC (Australian and New Zealand Standard

57
Industrial Classification) obtained from the ABS (Australian Bureau of Statistics). In
addition, questions related to the overview of operational risk management used in
each respondent’s organisation also included.
Section 2 – Success factors for operational risk management systems
This section consists of 28 statements which were designed to collect a respondent’s
perception of the ORM system factors implemented in his or her organisation, and
opinion of the importance of those factors to an effective ORM system
implementation. The statements were developed from the seven ORM system factors
presented in chapter 3 which are believed to be the factors that have an effect on
ORM system implementation (see Table 4.2).
Respondents were asked to rate each statement on a five-point Likert scale. For the
‘IN MY ORGANISATION’ section, the scales ranged from (1) to (5) with (1) =
‘Strongly Agree’, (2) = ‘Agree’, (3) = ‘Neutral’, (4) = ‘Disagree’ and (5) = ‘Strongly
Disagree’. For the ‘IMPORTANCE’ section, the scale ranged from (1) to (5) with (1)
= ‘Not Important At All’, (2) = Not Important, (3) = ‘Average Important’, 4 =
‘Important’ and (5) = ‘Vital’.

58
Table 4.2 ORM system factors vs. Questionnaire statements
Module ORM system factor Questionnaire statement Top management Leadership
Q12. Top management and leadership are committed to the success of an operational RMS program. Q14. Clearly defined operational RMS objectives are tied to the business objectives. Q15. The organisation has a defined and documented operational RMS policy. Q17. Top management drives and champions operational RMS across the organisation. Q18. Top management provides adequate resources for operational RMS activities. Q33. Regular reviews of organisational performance are conducted to assess progress toward achievement of operational RMS objectives. Q36. Appropriate levels of recognition, reward, approval and sanction for risk-related actions are established.
Process management Planning and strategic alignment Implementation Monitoring and continuous improvement
Q10. Operational RMS is viewed as a critical tool in managing our business processes. Q11. Operational RMS helps an organisation to minimise losses and business opportunities. Q13. Operational risks are included in the strategic decision-making process. Q21. Operational RMS plans are consistent with operational RMS policies and linked to the strategic business plan.

59
Table 4.2 ORM system factor vs. Questionnaire statements (cont.)
Module ORM system factor Questionnaire statement Process management Implementation
Monitoring and continuous improvement
Q19. Management of operational risks is carried out in a systematic and repeatable manner. Q20. Management of operational risks are integrated and embedded into the organisation's philosophy, practices and business processes. Q23. Formal systems and procedures for operational RMS are implemented throughout the organisation. Q31. Risk management process is used for problem solving, in which problems are recognized, prioritised, and actions taken to resolve them. Q32. Key performance indicators for operational RMS performance have been identified. Q34. Operational performance results are used to plan improvement. Q35. Risk management information systems are used to record, track, and monitor risk management activities.
HR management Training and performance appraisal
Q29. Employees and management have appropriate operational risk assessment and management skills. Q30. Employees and management receive appropriate training. Q37. Operational RMS related performance is part of staff appraisal and performance management system.

60
Table 4.2 ORM system factors vs. Questionnaire statements (cont.)
Module ORM system factor Questionnaire statement HR management Employee involvement
and empowerment Communication
Q25. The implementation of the operational RMS had the involvement of, and consultation with, everyone in the organisation. Q26. Employees participate in organisation-wide operational RMS activities. Q27. Employees are empowered and have the authority to deal with operational risks. Q28. Teamwork and involvement are normal practices. Q16. Operational RMS policy is understood, implemented and maintained at all levels of the organisation. Q22. Operational RMS responsibilities are established and communicated to all levels of organisation. Q24. Awareness about management of operational risks exists throughout the organisation.
4.6.4 Pilot testing
The main purpose of pilot testing is to ensure the feasibility of the questionnaire and
test the reliability of the scales (Sekaran 2003). For this purpose, copies of the
questionnaire were distributed to three academics at University of Technology Sydney

61
to comment on instructions, length, question sequence and question transformation of
the questionnaire. The feedback given from the academics were used for rectifying
and improving the questionnaire. The main issues highlighted were the wording used
for instructions and statements under the ‘success factor’ section. Some new
statements were added and any duplicated statements were eliminated. After
modification, the questionnaire was emailed to 40 practitioners familiar with ORM
system implementation asking them to response to the questionnaire. The respondents
were also asked to comment on the structure and clarity of the questionnaire. A total
of 32 were returned, a response rate of 80%.
According to Sekeran (2003), a minimum sample size of 30 is required for 450
sample population to conduct the statistical analysis. Therefore, 32 completed
questionnaires of this pilot study were sufficient to conduct the reliability test. The
internal consistency using Cronbach’s alpha model was carried out to test reliability
of the scales. The Cronbach’s alpha value for the ‘Practice’ scale was found to be
0.947 and for the ‘Implementation’ scale was 0.951. In most cases, a value of greater
than 0.7 would normally indicate high internal consistency (Hair et al. 1998). Thus,
reliability of the scales in this questionnaire was more than adequate. Moreover, no
major comments were given in this pilot study, therefore no changes were made. The
final version of the questionnaire is presented in Appendix 1.

62
4.6.5 Ethics approval
It is a requirement at University of Technology Sydney (UTS) that all research studies
involving human subjects must have written approval from the UTS Human Research
Ethics Committee (HREC) in order to meet Commonwealth legislative requirements
in Australia. Thus, the researcher has a responsibility to ensure that written ethics
approval is obtained before commencing data collection.
To comply with this requirement, a completed application form along with copies of
the cover letter and questionnaire were forwarded to the UTS Human Research Ethics
Committee for approval. The written approval from the committee was given to
conduct the survey after reviewing the proposed research protocol and there were no
changes required to the questionnaire. A copy of the approval letter is in Appendix 2.
4.6.6 Web-based survey
The email containing the URL link of the online survey was mailed out to the 450
organisations identified from the JANZS and Kompass electronic databases. A copy
of the email is provided in Appendix 3.
The content of the email mainly explained the brief description of operational risk
management defined in this study, purpose of the research, the researcher and her

63
supervisor and the estimated time required to fill out the questionnaire. The email was
addressed to management representative(s) of the organisations who were familiar
with operations management systems. A management representative was preferred as
a key respondent because it was assumed that she or he could be the most relevant
person having the knowledge in operations management system implementation.
4.6.7 Response rate improvement
Initially, a total of 61 completed questionnaires were received. Reminder letters were
emailed to the organisation, resulting in 10 more completed questionnaires. At this
stage, the response rate was considered somewhat low in comparison to other survey
research studies.
Follow-up telephone calls to management representatives of the potential respondents
were made. Telephone calls were usually answered by a secretary, and the researcher
was asked to re-send the official letter with UTS letterhead to them again by
providing the receiver’s name and address. Thus, the official letters were sent by post
to selected organisations. As weeks progressed, the number of respondents increased
to a total of 136.

64
4.6.8 Data entry and data checking
A preliminary data analysis using SPSS Version 15 statistical analysis package was
carried out. A coding sheet as shown in Appendix 4 was developed to assist the data
entry process. The accuracy of data entry was checked with substantial effort.
A total of 136 questionnaires were returned with 75% (102/136) fully completed and
no missing data. The maximum percentage of missing data as shown in Appendix 5
for any item was 5.9% (8/136). With this level of missing data, there were no returned
questionnaires eliminated from the analysis and omit case option was used to handle
missing data.
4.7 Analysis of data
4.7.1 Preliminary data analysis and hypotheses testing
The statistical analysis package SPSS Version 15 was used to analyse the collected
data. Preliminary data analysis was performed using descriptive statistics (e.g. mean,
standard deviation and frequency distribution) before conducting tests of hypotheses.
Parametric tests, including t-test and Pearson correlation, were employed for testing
the research hypotheses. The t-test was used to see whether there was any significant
difference in the means of the two groups in the variable, while the Pearson

65
correlation was used to see whether there was any positive (negative) relationship
between two variables (Forza 2002).
To meet the purpose and test the theoretical model hypothesised in this study, the
measurement instrument should also be reliable and valid. Thus, the reliability and
validity tests should be performed. In the following subsections, reliability and
validity tests are discussed.
4.7.2 Reliability testing
According to Hair et al. (1998), reliability refers to the extent to which an instrument
can produce consistent measurement results in what it is intended to measure in
repeated trials. There are three commonly used methods to estimate reliability: test-
retest method; alternative or parallel form method; and internal consistency method
(Cooper & Schindler 1998).
a) Test-retest method
Test-retest method measures the consistency between the responses with the same
measure applied to the same respondents at different points in time. Its objective is to
ensure the ability of the measure is not too varied over time.

66
b) Alternative or Parallel form method
Alternative or Parallel form method measures the consistency between the responses,
with the two equivalent forms of the same measures applied to the same respondents
at different points in time. Its objective is to evaluate the different sets of items for
measuring the same construct.
c) Internal consistency method
Internal consistency method measures the consistency among the variables in the
summated scales, and the individual items of the scale should all measure the same
construct (Churchill 1979; Nunnally 1979). Nunnally (1979) points out that
Cronbach’s alpha is the most commonly used measure for internal consistency. The
Cronbach’s alpha, or coefficient alpha, is a basic measure for reliability, and its value
can range from 0 to 1. A value greater than 0.7 would normally indicate high internal
consistency (Hair et al. 1998).
As mentioned above, Cronbach’s alpha is the most widely used measure and well
supported by statistical packages. Thus, internal consistency using Cronbach’s alpha
was employed to assess the reliability of the research instrument in this study. A
Cronbach’s alpha value of 0.7 or above is judged as adequate for research purposes.

67
4.7.3 Validity testing
Validity refers to the extent to which an instrument correctly represents the concept of
the study. Validity is generally concerned with how well the concept is defined.
According to Sekaran (2003), three types of validity tests are commonly used which
are content validity, construct validity and criterion-related validity.
a) Content validity
Content validity refers to the extent to which the measure reflects an entire domain of
the subject or construct of interest. It is a subjective assessment method which cannot
numerically evaluate the survey instrument’s accuracy. The evaluation of content
validity mainly involves a panel of content experts to ensure that only appropriate
contents are included. The content validity of this research instrument was evaluated
by the extensive literature review and pilot study.
b) Construct validity
Construct validity refers to the extent to which an instrument measures what it is
designed to measure, and to which proper identification of independent and dependent
variables were included in the investigation. Convergent validity and discriminant
validity are the most accepted forms of construct validity. Convergent validity
assesses the correlation between the two measures of the same construct, while

68
discriminant validity assesses the separation between the two measures of different
constructs (Forza 2002). The construct validity of this research instrument was
evaluated using factor analysis. An item loading of 0.3 or above is acceptable for
convergent validity, and eigenvalues of 1.0 or above are acceptable for discriminant
validity.
c) Criterion-related validity
Criterion-related validity refers to the extent to which an instrument is related to a
relevant independent measure of a relevant criterion. In the case of this research
instrument, the perception of ORM system factors placed by the organisations as
‘practice data’ were used as independent variables, while the mean of ‘importance
data’ for each respondent served as the dependent variable. Multiple regression
analysis was used to determine whether the ORM system factors (practice data) were
related to effective ORM system (importance data). According to Hair et al. (1998),
correlation coefficient value can range from -1 to +1, +1 indicating a perfect positive
relationship, 0 indicating no relationship, and -1 indicating a negative or reverse
relationship.
69
4.8 Summary
This chapter has presented the research methodology adopted in this study which was
structured in five stages: Establish the theoretical foundation; Select a research
design; Select a data collection method; Implementation; and Data analysis. Based on
the research objectives, this research is both a descriptive study and theory
verification study. A web-based questionnaire survey was chosen as an instrument for
this research to obtain information from a wide range of Australian organisations
about ORM system practices and opinion on critical success factors of effective ORM
system implementation. In particular, the questionnaire used in this study was mainly
developed from the theoretical constructs in this study. A combination of qualitative
and quantitative methods was used for data collection. A pilot study was carried out to
ensure the feasibility of the questionnaire and to test reliability of the scales. The
feedback from the pilot study was used to improve the questionnaire. To get valid
representative samples for this study, a random sampling method was employed to
select a sample of 450 organisations from the JAS-ANZ database in conjunction with
the Kompass database. Before conducting the main survey, written ethics approval
was obtained. The URL link of the web-based questionnaire was then emailed to 450
organisations. The initial response rate was considered somewhat low in comparison
to other survey research studies. Follow-up telephone calls were made and reminder
letters were sent by post to selected organisations to increase the response rate.
Finally, this increased the final response rate to an acceptable level for this study.

70
Data entry and data checking methods to minimise the error were also discussed.
Moreover, the procedures for preliminary data analysis, testing research hypotheses,
and testing the reliability and validity of the instrument have been described in greater
detail in this chapter. The following Chapter will discuss the results of this study.

71
Chapter 5 Survey results and discussion
5.1 Introduction
This chapter presents the results of this research survey. Section 5.2 describes the
generic background of respondents. Section 5.3 addresses the reliability test of the
ORM implementation instrument, while Section 5.4 presents the results of the validity
testing. Section 5.5 provides the result of ORM system implementation and
determines the critical success factors for effective ORM implementation. Section 5.6
presents the research hypotheses analysis result. Section 5.7 discusses general
conclusion gathered from the survey and the guideline for ORM system
implementation. At the end of this chapter, Section 5.8 provides the summary.
5.2 General characteristics of respondents
As outlined in the research methodology chapter, this study focused on small, medium
and large Australian business organisations which were certified to one or more
operation management system standards. The samples were selected mainly from the
JAS-ANZ database in conjunction with the Kompass. The URL link of the web-based
questionnaire was originally emailed to 450 organisations. A total of 29 were returned
or not received by the target respondents due to discrepancies of email address, or
refusal of respondent to participate, thus reducing the sample to 421. A total of 71

72
completed questionnaires were received. This yielded a response rate of 16.9%
(71/421). This response rate was somewhat low in comparison to other survey
research studies. Follow-up telephone calls were made and reminder letters were sent
by post to selected organisations to increase the response rate. This increased the final
response rate to 32.3 % (136/421), which was considered to be reasonable and
acceptable for this study. The results of this study were analysed using the statistical
package SPSS Version 15.
5.2.1 Background of respondents
5.2.1.1 Size of responding organisations
The first aspects to be analysed was the general information of the respondents. There
is no universal method to ascertain the size of organisation. Number of employees and
the annual revenue are commonly the two indicators used. In this study, however,
only the number of employees was used. As discussed in the research methodology
chapter, the annual revenue might not be the main concern for the practice of
systematic management systems.
Table 5.1 shows the breakdown of the respondents based on the size of the
organisations. Large organisations having 200 employees or more constituted the
largest proportion (81.7 %) of the respondents. A total of 13.2% of the organisations
were medium-sized employing between 20 and 199 employees, while small

73
organisations having fewer than 20 employees represented 5.1% of the total. This
demonstrates that ORM practices are not limited to size of the organisation. ORM is
implemented by large organisations as well as small and medium-sized organisations.
Table 5.1 Size of organisation
Size of organisation No. of respondents %
Small (< 20 employees) 7 5.1
Medium (20 – 199 employees) 18 13.2
Large (200 – 499 employees) 8 5.9
Large (> 499 employees) 103 75.7
Total 136 100
5.2.1.2 Type of industry
As shown in Figure 5.1, the overwhelming majority (89.7%) of respondents were in
non-manufacturing industries. Only 10.3% were in the manufacturing industry. This
result corresponds with other Australian business statistics, as the majority of
Australian businesses operate in the non-manufacturing field.

74
10.3 %
89.7 %
ManufacturingNon-Manufacturing
Figure 5.1 Breakdown of industry
5.2.2 Status of respondents’ ORM system practices
As it was the objective of this study to discover where Australian organisations are in
managing operational risks, the questions in section 1 were designed to capture what
ORM activities had been implemented in the organisations.
One of the key findings was that most respondent organisations (94.9%) had risk
management policies or procedures in place. In addition, a large number (91.9%) of
respondents were employing one or more management system standards as guidelines
for their ORM system practices. This is in line with the literature review and the
findings of other research studies in the ORM field.

75
5.2.2.1 Use of management system standards for ORM systems
Figure 5.2 shows the use of various management system standards as a basis for ORM
system practices in Australian organisations. It seems that ISO 9001 (quality
management standard) was the most favourable standard (72%). It was not surprising
if we consider that ISO 9001 is the most commonly implemented management system
standard in Australia and the world. Among the other standards, AS/NZS 4360 (risk
management standard) (59.2%), ISO 14000 (environmental management standard)
(58.4%), and AS/NZS 4801 (occupational health and safety management standard)
(58.4%) were the alternative for many organisations. The use of COSO (3.2%) and
other standards (9.6%) seems relatively negligible. This was not surprising, as the
results of other research studies discussed in Section 2 literature review show similar
findings.
5.2.2.2 Integration of management system standards
The survey findings also show that a large number of respondent organisations
(94.1%) used management system standards as an integrated rather than stand-alone
approach as depicted in Figure 5.3. Approximately 32.4% of respondents fully
integrated their management system standards. A majority of organisations (61.8%)
were moving toward the amalgamation of all the management systems into a single
integrated management system.

76
59.2%
40.8%
3.2%
96.8%
72.0%
28.0%
58.4%
41.6%
58.4%
41.6%
9.6%
90.4%
0%
20%
40%
60%
80%
100%
AS/NZS4360
COSO ISO 9001 ISO14000
AS/NZS4801
Otherstandards
No
Yes
Figure 5.2 Use of management system standards for ORM systems
5.9% 6.6%
19.9%
35.3%32.4%
0.0%
10.0%
20.0%
30.0%
40.0%
Not at all low Medium High Fullyintegrated
Figure 5.3 Management system integration

77
5.3 Testing reliability of responses
Internal consistency using Cronbach’s alpha model was employed to assess the
reliability of the research instrument. The Cronbach’s alpha, or coefficient alpha, is a
basic measure for reliability, and its value can range from 0 to 1. In most cases, a
value greater than 0.7 would normally indicate high internal consistency (Hair et al.
1998).
Table 5.2 Internal consistency analysis results
Factors
Number
of items
Reliability
of construct
Potential item
for elimination
F1. Leadership 7 0.869 None
F2. Planning and strategic alignment 4 0.819 None
F3. Implementation 4 0.859 None
F4. Monitoring and continuous
improvement
3 0.736 None
F5. Training and performance appraisal 3 0.740 None
F6. Employee involvement and
empowerment
4 0.827 None
F7. Communication 3 0.838 None

78
In the case of the research instrument, a five-scale instrument was used to measure the
seven ORM factors (or constructs). Each factor consisted of several items. SPSS
reliability analysis program was performed for the items of each factor separately.
Table 5.2 presents Cronbach’s alpha values for different ORM factors. This table
shows that reliability coefficients ranged from 0.736 to 0.869, indicating that all the
factors are satisfactory. Thus, the instrument developed for measuring ORM
constructs was considered to have high internal consistency and reliability.
5.4 Testing validity of responses
To validate the survey instrument, three types of validity tests recommended by
Sekaran (2003) – content validity, construct validity and criterion-related validity –
were performed in this study.
5.4.1 Content validity
Content validity refers to the extent to which the measure reflects an entire domain of
the subject or construct of interest. It is a subjective assessment method which cannot
numerically evaluate the survey instrument’s accuracy. The evaluation of content
validity mainly involves a panel of content experts to ensure that only appropriate
contents are included (Sekaran 2003).

79
In the case of the research instrument, the seven ORM factors (or constructs) were
developed mainly on the basis of an extensive literature review in operational risk
management systems and standards. The detailed process of developing the research
questionnaire was addressed in the research methodology chapter. In addition, content
evaluation and the pilot study of the research instrument were performed by
academics and practitioners. Therefore, it is strongly believed that the research
instrument for measuring ORM factors (constructs) has content validity.
5.4.2 Construct validity
Construct validity refers to the extent to which an instrument measures what it is
designed to measure, and to which proper identification of independent and dependent
variables were included in the investigation. The construct validity of this research
instrument was evaluated using principal component factor analysis. A SPSS data
reduction procedure was performed for the items of each factor separately. The
‘practice’ data placed by the respondents was used for this analysis. The results are
shown in Table 5.3 and the detailed output of factor analysis is provided in
Appendix 6.
From the results obtained, all of the items had factor loadings greater than 0.50 and
eigenvalues greater than 1. It was clear that all factors are uni-factorial and none of
the items was removed. After conducting this analysis, it can be seen that the research
instrument for measuring ORM factors has been validated for construct validity.

80
Table 5.3 Construct validity analysis results
Factors
Eigen-
values
Variance
explained
(%)
Item for
elimination
Initial factor
loading for
Component 1
F1. Leadership 3.941 56.293 None 0.636 – 0.811
F2. Planning and strategic
alignment
2.599 64.975 None 0.744 – 0.837
F3. Implementation 2.281 70.518 None 0.799 – 0.873
F4. Monitoring and continuous
improvement
1.965 65.511 None 0.781 – 0.841
F5. Training and performance
appraisal
2.000 66.650 None 0.737 – 0.854
F6. Employee involvement and
empowerment
2.632 65.794 None 0.738 – 0.862
F7. Communication 2.267 75.580 None 0.860 – 0.879
5.4.3 Criterion-related validity
Criterion-related validity refers to the extent to which an instrument is related to a
relevant independent measure of a relevant criterion. In the case of this research

81
instrument, multiple regression analysis was used to determine whether the ORM
factors were related to effective ORM systems. SPSS regression analysis procedure
was performed for this evaluation. The ORM system factors placed by the
organisations as ‘practice data’ were used as independent variables, while the mean of
‘importance data’ for each respondent served as the dependent variable. The multiple
correlation coefficient computed for the seven factors and a measure of effective
ORM system was found to be 0.628 (the detailed analysis is shown in Appendix 7),
indicating that the seven factors have a reasonably high degree of criterion-related
validity when taken together.
After these validity tests, it can be concluded that the research instrument is reliable
and capable of measuring what it intended to measure.
5.5 Result of the ORM survey
After the research instrument has tested the reliability and validity, the means for the
perception of practice and importance were analysed. Several descriptive statistics
were calculated for all items. As discussed in the research methodology chapter, the
missing responses were excluded from the analysis. Mean and standard deviation
measures were calculated for all items.

82
5.5.1 Perceptual responses to ORM practices
The level of practice of each ORM system factor was the other aspect for
investigation. The overall means of practice perceived by the respondents are shown
in Table 5.4. The values range from 3.88 to 3.06 which correspond to the moderate
level of practice. From the table, ‘Planning and strategic alignment’ was found to be
the highest ‘practice’ factor. ‘Implementation’ and ‘Leadership’ were found to be the
second and the third ‘practice’ factors, respectively while ‘Training and performance
appraisal’ was found to be the lowest ‘practice’ factors. It can be concluded that there
was diversity in the mean and standard deviations of seven factors.
Table 5.4 Mean practice results
Factor Description Mean Std Dev. Ranking
F1 Leadership 3.53 1.15 3
F2 Planning and strategic alignment 3.88 1.01 1
F3 Implementation 3.56 1.05 2
F4 Monitoring and continuous improvement 3.37 1.13 4
F5 Training and performance appraisal 3.06 1.10 7
F6 Employee involvement and empowerment 3.24 1.16 6
F7 Communication 3.32 1.09 5

83
5.5.2 Perceptual responses to ORM importance
Table 5.5 shows the results of overall mean for each ORM system factor which
determine the level of importance perceived by respondents. The values range from
4.18 to 4.40, which fall between important and very important. ‘Planning and strategic
alignment’, ‘Communication’, and ‘Leadership’ were perceived to be the top three
most ‘importance’ factors, while ‘Employee involvement and empowerment’ was
found to be the least ‘important’ factor. However, there were only small different of
the mean and standard deviations indicating that there is general agreement on the
seven factors of ORM system.
Table 5.5 Mean importance results
Factor Description Mean Std dev. Ranking
F1 Leadership 4.27 0.80 3
F2 Planning and strategic alignment 4.40 0.70 1
F3 Implementation 4.20 0.77 5
F4 Monitoring and continuous improvement 4.22 0.81 4
F5 Training and performance appraisal 4.20 0.84 5
F6 Employee involvement and empowerment 4.18 0.84 7
F7 Communication 4.34 0.75 2

84
5.6 Testing Research Hypotheses
Hypothesis 1: There is a significant difference between the importance and practice
of an ORM system.
From the results obtained in previous section, it can be seen that the organisations
placed a high degree of importance for all ORM system factors; however, the extent
to which they practiced those factors was different. The statistical testing using SPSS
compare mean – a Pairwise t-test procedure was performed to determine whether
there was any significant difference between the level of importance and the extent of
practice.
Results shown in Table 5.6 indicate that there was a significant difference between
perceived importance and the extent of practice. Thus, Hypothesis 1 was supported.
From the results obtained, it can be concluded that the organisations are aware of the
importance of all the ORM system factors; however, they could still be struggling to
implement those factors successfully.
Further analysis was carried out to achieve a better understanding of ORM system
implementation. In order to measure the effectiveness of an ORM system, an
evaluation of its performance needs to be carried out. However, this is a difficult task.
Instead of measuring ORM system performance, each ORM system factor will be

85
measured in the way that, if the factor has high mean, we conclude that the factor has
a positive impact on an effective ORM system.
The overall mean of each factor was examined by considering the level of
importance; the hypothesis will be supported if the overall mean is over 4, on the 5-
point Likert scale (Chang 2002). Then, a series of Pairwise comparisons of the highest
mean item with others were performed to discover the most related items to the factor
using the method suggested by Siegel and Castellan (1956).
Table 5.6 Comparison statistics for practice and importance
Factor Description Practice
Mean
Importance
Mean
t-test
p-value tcritical Results
F1 Leadership 3.53 4.27 0.000 -10.874 Sig.
F2 Planning and strategic
alignment
3.88 4.40 0.000 -8.063 Sig.
F3 Implementation 3.56 4.20 0.000 -9.489 Sig.
F4 Monitoring and
continuous improvement
3.37 4.22 0.000 -11.302 Sig.
F5 Training and
performance appraisal
3.06 4.20 0.000 -14.441 Sig.
F6 Employee involvement
and empowerment
3.24 4.18 0.000 -11.615 Sig.
F7 Communication 3.32 4.34 0.000 -12.228 Sig.
tcritical value at 0.05 level of significance with 28 degrees of freedom

86
Hypothesis 2: Leadership has a positive impact on an effective ORM system.
From the results shown in Table 5.7, the mean values of each item under Factor 1
(Leadership) range from 4.18 to 3.98. Item 1.1, ‘Top management and leadership are
committed to the success of an ORM program’, and Item 1.4, ‘Top management
drives and champions ORM across the organisation’, have the highest mean, 4.37.
The overall mean was 4.27. Therefore, Hypothesis 2 was supported.
The detail comparison analysis results are presented in Table 5.8. The results show
that the two items differed significantly from the highest mean items were ‘Regular
reviews of organisational performance are conducted to assess progress toward
achievement of operational RMS objectives’ and ‘Appropriate levels of recognition,
reward, approval and sanction for risk-related actions are established’.
From the results obtained, top management’s leadership and commitment are essential
to the success of an ORM program. Moreover, top management should define ORM
policy and set ORM objectives that are in line with business objectives. Top
management should also act as a key driver in ORM across the organisation and
provide adequate resources for ORM activities.

87
Table 5.7 Mean result of each item in Factor 1
Factor 1: Leadership Mean Std. dev.
1.1 Top management and leadership are committed to the
success of an ORM program
4.37 0.78
1.2 Clearly defined ORM objectives are tied to the business
objectives
4.30 0.68
1.3 The organisation has a defined and documented ORM
policy
4.36 0.74
1.4 Top management drives and champions ORM across the
organisation
4.37 0.75
1.5 Top management provides adequate resources for ORM
activities
4.36 0.75
1.6 Regular reviews of organisational performance are
conducted to assess progress toward achievement of
operational RMS objectives
4.18 0.85
1.7 Appropriate levels of recognition, reward, approval and
sanction for risk-related actions are established
3.98 0.96
Overall mean for Leadership 4.27

88
Table 5.8 Pairwise comparison statistics for items of Factor 1
Compare mean t-test
p-value Results
Item 1.1 vs. Item 1.2 0.277 Not sig.
Item 1.1 vs. Item 1.3 0.841 Not sig.
Item 1.1 vs. Item 1.4 0.909 Not sig.
Item 1.1 vs. Item 1.5 0.906 Not sig.
Item 1.1 vs. Item 1.6 0.004 Sig.
Item 1.1 vs. Item 1.7 0.000 Sig.
Item 1.4 vs. Item 1.5 0.787 Not sig.
Item 1.4 vs. Item 1.6 0.002 Sig.
Item 1.4 vs. Item 1.7 0.000 Sig.
Hypothesis 3: Planing and strategic alignment have a positive impact on an effective
ORM system.
From the results shown in Table 5.9, the mean values of each item under Factor 2
(Planning and strategic alignment) range from 4.32 to 4.51. Item 2.3, ‘Operational
risks are included in the strategic decision-making process’, has the highest mean,
4.51. The overall mean was 4.40. Therefore, Hypothesis 3 was supported.

89
Table 5.9 Mean result of each item in Factor 2
Factor 2: Planning and strategic alignment Mean Std. dev.
2.1 ORM is viewed as a critical tool in managing our
business processes
4.43 0.69
2.2 ORM helps an organisation to minimise losses and
maximise business opportunities
4.32 0.85
2.3 Operational risks are included in the strategic decision-
making process
4.51 0.60
2.4 ORM plans are consistent with ORM policies and linked
to the strategic business plan
4.32 0.63
Overall mean for Planning and strategic alignment 4.40
The detailed comparison analysis results are presented in Table 5.10. The results show
that the items ‘ORM helps an organisation to minimise losses and maximise business
opportunities’ and ‘ORM plans are consistent with ORM policies and linked to the
strategic business plan’ were significantly different from highest mean item. From the
results obtained, ORM should be used as a critical tool in managing business
processes to minimise losses and maximise business opportunities, and operational
risks should be considered when making strategic decision.

90
Table 5.10 Pairwise comparison statistics for importance items of Factor 2
Compare Mean t-test
p-value Results
Item 2.3 vs. Item 2.1 0.220 Not sig.
Item 2.3 vs. Item 2.2 0.005 Sig.
Item 2.3 vs. Item 2.4 0.002 Sig.
Hypothesis 4: Implementation has a positive impact on an effective ORM system.
From the results shown in Table 5.11, the mean values of each item under Factor 3
(Implementation) range from 4.13 to 4.36. Item 3.1, ‘Management of operational risks
is carried out in a systematic and repeatable manner’ and Item 3.2, ‘Management of
operational risks are integrated and embedded into the organisation's philosophy,
practices and business processes’, and Item 3.3, ‘Formal systems and procedures for
ORM are implemented throughout the organisation’, have the highest mean, 4.36. The
overall mean was 4.30. Therefore, Hypothesis 4 was supported.

91
Table 5.11 Mean result of each item in Factor 3
Factor 3: Implementation Mean Std. dev.
3.1 Management of operational risks is carried out in a
systematic and repeatable manner
4.36 0.62
3.2 Management of operational risks are integrated and
embedded into the organisation's philosophy, practices
and business processes
4.36 0.71
3.3 Formal systems and procedures for ORM are
implemented throughout the organisation
4.36 0.68
3.4 Risk management process is used for problem solving,
in which problems are recognised, prioritised, and
actions taken to resolve them
4.13 0.98
Overall mean for Implementation 4.30
The detailed comparison analysis results are presented in Table 5.12. The results show
that the items ‘Risk management process is used for problem solving, in which
problems are recognised, prioritised, and actions taken to resolve them’ was
significantly different from the highest mean items. From the results obtained, the
implementation of ORM should be carried out in a systematic and repeatable manner
throughout the organisation. In addition, it should be integrated and embedded into
the organisation’s philosophy, practices and business processes.

92
Table 5.12 Comparison statistics for importance items of Factor 3
Compare mean t-test
p-value Results
Item 3.1 vs. Item 3.2 0.879 Not sig.
Item 3.1 vs. Item 3.3 0.877 Not sig.
Item 3.1 vs. Item 3.4 0.001 Sig.
Item 3.2 vs. Item 3.3 1.000 Not sig.
Item 3.2 vs. Item 3.4 0.003 Sig.
Item 3.3 vs. Item 3.4 0.002 Sig.
Hypothesis 5: Monitoring and continuous improvement have a positive impact on an
effective ORM system.
From the results shown in Table 5.13, the mean values of each item under Factor 4
(Implementation) range from 4.20 to 4.24. Item 4.2, ‘Operational performance results
are used to plan improvement’ has the highest mean, 4.24. The overall mean was
4.22. Therefore, Hypothesis 5 was supported.

93
Table 5.13 Mean result of each item in Factor 4
Factor 4: Monitoring and continuous improvement Mean Std. dev.
4.1 Key performance indicators for ORM performance have
been identified
4.23 0.79
4.2 Operational performance results are used to plan
improvement
4.24 0.81
4.3 Risk management information systems are used to
record, track, and monitor risk management activities
4.20 0.84
Overall mean for Monitoring and continuous improvement 4.22
The detailed comparison analysis results are presented in Table 5.14. The results show
that there was no significant difference among all items. From the results obtained,
the organisation should identify the key performance indicators for ORM system
performance and use the operational performance results to plan the improvement.
Moreover, the organisation should set up risk management information systems to
record, track and monitor ORM activities.

94
Table 5.14 Pairwise comparison statistics for importance items of Factor 4
Compare mean t-test
p-value Results
Item 4.1 vs. Item 4.2 0.905 Not sig.
Item 4.1 vs. Item 4.3 0.639 Not sig.
Hypothesis 6: Training and performance appraisal have a positive impact on an
effective ORM system.
From the results shown in Table 5.15, the mean values of each item under Factor 5
(Training and performance appraisal) range from 4.02 to 4.33. Item 5.2, ‘Employees
and management receive appropriate training’ has the highest mean, 4.33. The overall
mean was 4.20. Therefore, Hypothesis 6 was supported.
The detailed comparison analysis results are presented in Table 5.16. The results show
that the item ‘Operational RMS related performance is part of staff appraisal and
performance management system’ differed significantly from the highest mean items.
From the results obtained, employees and management should have skills in assessing
and managing risks, and they should receive appropriate training about risk
management.

95
Table 5.15 Mean result of each item in Factor 5
Factor 5: Training and performance appraisal Mean Std. dev.
5.1 Employees and management have appropriate
operational risk assessment and management skills
4.24 0.79
5.2 Employees and management receive appropriate
training
4.33 0.78
5.3 Operational RMS related performance is part of staff
appraisal and performance management system
4.02 0.91
Overall mean for Training and performance appraisal 4.20
Table 5.16 Pairwise comparison statistics for importance items of Factor 5
Compare mean t-test
p-value Results
Item 5.2 vs. Item 5.1 0.062 Not sig.
Item 5.2 vs. Item 5.3 0.000 Sig.

96
Hypothesis 7: Employee involvement and empowerment have a positive impact on
an effective ORM system.
From the results shown in Table 5.17, the mean values of each item under Factor 6
(Employee involvement and empowerment) range from 4.05 to 4.31. Item 6.3,
‘Employees are empowered and have the authority to deal with operational risks’ has
the highest mean, 4.31. The overall mean was 4.18. Therefore, Hypothesis 7 was
supported.
The detailed comparison analysis results are presented in Table 5.18. The results show
that the items ‘The implementation of the ORM had the involvement of, and
consultation with, everyone in the organisation’ and ‘Employees participate in
organisation-wide ORM activities’ were differed significantly from the highest mean
item. From the results obtained, employees should be involved and work as a team for
ORM. Moreover, they should have power and authority to deal with operational risks.

97
Table 5.17 Mean result of each item in Factor 6
Factor 6: Employee involvement and empowerment Mean Std. dev.
6.1 The implementation of the ORM had the involvement of,
and consultation with, everyone in the organisation
4.05 0.94
6.2 Employees participate in organisation-wide ORM activities 4.07 0.85
6.3 Employees are empowered and have the authority to deal
with operational risks
4.31 0.78
6.4 Teamwork and involvement are normal practices 4.28 0.74
Overall mean for Employee involvement and empowerment 4.18
Table 5.18 Comparison statistics for importance items of Factor 6
Compare mean t-test
p-value Results
Item 6.3 vs. Item 6.1 0.000 Sig.
Item 6.3 vs. Item 6.2 0.000 Sig.
Item 6.3 vs. Item 6.4 0.574 Not sig.

98
Hypothesis 8: Communication has a positive impact on an effective ORM system.
From the results shown in Table 5.19, the mean values of each item under Factor 7
(Communication) range from 4.30 to 4.40. Item 7.3, ‘Awareness about management
of operational risks exists throughout the organisation’ has the highest mean, 4.40.
The overall mean was 4.34. Therefore, Hypothesis 8 was supported.
Table 5.19 Mean result of each item in Factor 7
Factor 7: Communication Mean Std. Dev.
7.1 ORM policy is understood, implemented and
maintained at all levels of the organisation
4.30 0.83
7.2 ORM responsibilities are established and communicated
to all levels of organisation
4.32 0.74
7.3 Awareness about management of operational risks exists
throughout the organisation
4.40 0.69
Overall mean for Communication 4.34
The detailed comparison analysis results are presented in Table 5.20. The results show
that there was no significant difference among all items. Form the results obtained,
ORM policy should be understood, implemented and maintained at all levels of the
organisation. In addition, the ORM responsibilities and awareness should be
established and communicated throughout the organisation.

99
Table 5.20 Comparison statistics for importance items of Factor 7
Compare mean t-test
p-value Results
Item 7.2 vs. Item 7.1 1.000 Not sig.
Item 7.2 vs. Item 7.3 0.078 Not sig.
Hypothesis 9: There is a significant interrelationship among the seven factors of an
ORM system.
The Pearson correlation analysis helped to examine the interrelationship among ORM
system factors by calculating their correlation coefficient (r). From the results shown
in Table 5.21, the correlation coefficient of all factors range from 0.840 to 0.607,
indicating that the interrelationship of all the factors was statistically strong.
Therefore, Hypothesis 9 was supported.
From the study findings, the interrelationship of Factor 1 (Leadership) and Factor 3
(Implementation) was the strongest (r = 0.840), followed by that of Factor 1
(Leadership) and Factor 2 (Planing and strategic alignment) (r = 0.811), and then
Factor 3 (Implementation) and Factor 7 (Communication) (r = 0.792), respectively. It
can be concluded that planning and implementation of effective ORM system would
rely significantly on the role of top management leadership and commitment.

100
Moreover, the implementation of ORM system should be understood and
communicated at all levels of the organisation.
Table 5.21 Correlation analysis results of ORM system factors
Factor 1 2 3 4 5 6 7
1 1
2 0.811* 1
3 0.840* 0.775* 1
4 0.752* 0.625* 0.708* 1
5 0.788* 0.607* 0.756* 0.750* 1
6 0.776* 0.687* 0.740* 0.681* 0.717* 1
7 0.784* 0.757* 0.792* 0.628* 0.709* 0.763* 1
* Correlation is significant at the 0.01 level (two-tailed).
5.7 ORM system implementation guideline
Data from 136 Australian organisations were used for analysing and testing the
research hypotheses. The following conclusions can be drawn from the discussions
and analysis carried out in the previous sections: (a) Implementation of the ORM
system was not limited to size or type of organisation. The majority of the surveyed

101
organisations had risk management polices and procedures in place. It appears that
there is a trend in increase of awareness of operational risks in organisations. (b)
Managing operational risks based on management system standards appears to be a
common practice. ISO 9001 (quality management standard) can be seen as the most
favourable standard being used as a basis for ORM systems. Other preferred standards
included the AS/NZS 4360 (risk management standard), the ISO 14000
(environmental management standard), and/or the AS/NZS 4801 (occupational health
and safety management standard). In addition, most of the surveyed organisations
employed these standards in integration rather than as stand-alone. (c) Despite the fact
that most organisations were aware of the importance factors for their ORM systems,
they were still struggling with the successful implementation of those factors.
‘Planning and strategic alignment’ factor scored as the highest in the practice and
perceived to be the most critical factors among all the other factors. (d) The proposed
seven factors in this study – leadership, planning and strategic alignment,
implementation, monitoring and continuous improvement, training and performance
appraisal, employee involvement and empowerment, and communication – were all
found to be critical for successful deployment of an ORM system and there were a
strong interrelation among all the factors.
Based on the above findings and discussion with experts on the survey results, the
ORM system implementation guideline was developed on the basis of the operations
management system (PDCA) model and the theoretical model of ORM system factors
which were confirmed by the questionnaire survey data. The schematic presentation

102
of the guideline is displayed in Figure 5.4. As can be seen, there are seven ORM
elements and seven processes which are interconnected and interact with each other to
determine the effective ORM system. The ORM system implementation guideline is
discussed further as follows.
Figure 5.4 ORM system implementation model
Top management
Process management
Human resource management
Define ORM policy and objectives
Develop ORM Plan
Identify critical ORM
processes
Establish
ORM system
Measure results and evaluate performance
Standardise procedures
and practices
Implementation
Acquire and deploy
resources
Planning and strategic
alignment
Training and performance
appraisal
Employee involvement and empowerment
Communication
Monitoring and continuous
improvement
Effective ORM system Leadership

103
5.7.1 Top management
Top management is a crucial factor of any management system implementation. In
the case of ORM system, top management is the key driver throughout the whole
process of system implementation. Leadership and commitment of top management
can bring about ORM initiatives and improvements to the organisation. The main role
of top management is to provide leadership and commitment by defining ORM policy
and convert the policy into ORM objectives. Top management also needs to ensure
that ORM policy and objectives are understood, implemented and maintained at all
levels of the organisation. The critical processes and limits of factors that might affect
the ORM implementation need to be identified. In particular, top management needs
to clearly define the roles and responsibilities, delegate authorities, and assign
adequate resources for deployment and maintenance of the ORM system. In addition,
review of the ORM system needs to be carried out on a regular basis.
5.7.2 Process management
Every system is made of many processes that interact with each other. These
processes have to be managed carefully to ensure an effective system. The planning
process itself is one of the critical processes that provide great potential for
identifying and controlling other processes (Akpolat 2004). ORM strategies and plans
should be developed to be consistent with ORM policy and aligned with strategic

104
plans. ORM should also be used as a critical tool in managing business processes, and
operational risks should be considered when making strategic decisions. The ORM
system should be established using an integrated approach by incorporating
compliance requirements of other management system standards and regulations. It is
also important for the organisation to identity key risk performance measures and
conduct regular audits. Results of performance reviews and audits need to be used for
standardisation of procedures and practices, as well as continuous improvement.
Furthermore, ORM information systems should be used to monitor risk management
activities, and documents should be controlled for future references.
5.7.3 Human resource management
Employees’ involvement in an operations management system is included in most
guidelines and practices. However, the involvement of employees requires
appropriate knowledge of the various elements of the system. It is necessary to
provide proper training and education of ORM to all management and employees.
Competence of employees for handling operational risks needs to be regularly
evaluated and feedback of their performance should be provided by their superiors. It
is also important to reinforce the implementation of risk culture and empower
employees to actively manage risks. The ORM responsibilities and awareness should
be established and communicated throughout the organisation. Employees should be
involved and work as a team for ORM. This usually helps improve employee
satisfaction and productivity (Powell 1995; Pun & Hui 2002). Moreover, there should

105
be two-way communication between employees and management regarding ORM
matters to ensure the correct decision is made all the time (Sohal & Terziovski 2000).
5.8 Summary
This chapter has presented the results from the survey conducted on ORM system
implementation in Australian organisations. Testing of reliability and validity on the
research instrument was performed, which concluded that the instrument was reliable
and valid to measure what it intended to measure. The analysis results revealed that
there was a significant difference between the means of perceived importance and
levels of practice, indicating that the organisations have not performed the activities
they perceived to be important for ORM system. Another major finding was the
results of hypotheses testing that confirmed the proposed seven factors – leadership,
planing and strategic alignment, implementation, monitoring and continuous
improvement, training and performance appraisal, employee involvement and
empowerment, and communication – are interrelated and critical to the success of
ORM system implementation. Based on the findings, the ORM system
implementation guideline was developed. This guideline is generic in nature because
it does not prescribe a series of steps to undertake or follow, but rather an overview in
working towards building an effective ORM system. Refinements to the framework
could be made in the future, in particular on the case studies. It was not possible in
this research to have case studies due to resource limitations and constraints.

106
Nevertheless, it is believed that the guideline provided will be of great benefit to
many organisations which are still struggling to implement an effective ORM system.

107
Chapter 6 Conclusions
6.1 Introduction
This chapter provides the summary of this thesis, research conclusions obtained from
this study and a brief research evaluation. Section 6.2 presents a brief summary of this
study. Section 6.3 provides conclusions obtained from conducting this research
Section 6.4 focuses on a brief research evaluation including research limitations and
future research perspectives. Finally, Section 6.5 presents contributions of this
research.
6.2 Brief summary
In the field of operations management, a large number of research studies have been
conducted dealing with the reduction of process variability, increasing flexibility or
implementing controls in operations. Managing risk in operations has focused more
on reducing the risks of producing non-conforming products or inadequate services
(quality risks). In fact, the concept of ORM was not clearly defined. Concerning the
effects and the factors of ORM system implementation, a number of researchers
concluded that implementation of one or more operations management systems has
proactively reduced losses or risks in operations; however, there is a limited number
of empirical studies in this area.

108
After the literature related to ORM system implementation in Australian organisations
was studied, it became evident that no empirical research dealing with the success
factors of ORM system implementation performance had been systematically
conducted. In addition, no research has been conducted for developing an ORM
implementation model that can be used by Australian organisations to effectively
manage their operational risks. The lack of specific guidelines to assist organisations’
ORM system implementation has led to a number of unsuccessful ORM system
implementations in Australia. Therefore, the major objectives of this study were:
• to obtain the success factors of ORM system implementation in Australian
organisations
• to obtain an ORM system implementation model for Australian organisations.
To achieve the two research objectives, three research questions were proposed as
follows, namely:
• What is ORM system?
• What are the current ORM system practices in Australian organisations?
• What are the critical success factors of an effective ORM system
implementation?
As the first step of this study, an extensive review of operations management
literature and various standards and frameworks including AS/NZS 4360 (risk

109
management standard), COSO ERM (enterprise-wide risk management framework),
ISO 9001 (quality management system standard), ISO 14000 (environmental
management system standard) and AS/NZS 4801 (occupational health and safety
management system standard) was conducted. Based on this literature review, seven
factors were considered important for ORM system implementation: leadership,
planning and strategic alignment, implementation, monitoring and continuous
improvement, training and performance appraisal, employee involvement and
empowerment, and communication. Thus, a model of ORM system implementation
was formulated on the basis of the existing research results. This model consists of
nine hypotheses.
To achieve the research objectives and answer the research questions, web-based
questionnaire survey was chosen as an instrument for this research. The URL link of
the web-based questionnaire was emailed to 450 organisations Australia-wide. Only
organisations certified to one or more management system standards were selected to
receive questionnaires; these 450 organisations were randomly selected from the JAS-
ANZ database in conjunction with the Kompass database. Finally, 136 questionnaires
were returned, with a response rate of approximately 32%.
The measurement instrument was evaluated for reliability and validity using the data
from 136 respondents. Reliability analysis (internal consistency) and validity analysis
(content, construct and criterion-related analysis) were used for instrument evaluation.

110
Finally, it was concluded that the instrument for measuring ORM system
implementation is reliable and valid.
The statistical analysis package SPSS Version 15 was used to conduct the analysis of
the collected data from 136 respondents. Preliminary data analysis was performed
using descriptive statistics (e.g. mean, standard deviation and frequency distribution)
before conducting tests of hypotheses. Parametric tests including t-test and the
Pearson correlation were employed for testing the research hypotheses.
The analysis results revealed that there was a significant difference that organisations
have not performed the activities they perceived to be important for ORM systems.
Another major finding was the results of hypotheses testing that confirmed (all) the
proposed seven factors – leadership, planing and strategic alignment, implementation,
monitoring and continuous improvement, training and performance appraisal,
employee involvement and empowerment, and communication – are interrelated and
critical to the success of ORM system implementation. Findings from the survey and
the inputs from experts were used for the development of the ORM system
implementation model. As part of this process some useful guidelines were developed
as well. It should be noted that there is no single or best way of implementing this
ORM system implementation model. Organisations differ in structure, resources,
culture, goals, technologies, processes and operating environments. Therefore, they
should combine their uniqueness with the model and develop their own ways to
excellence. Although this model was initially developed for Australian organisations,

111
organisations in other countries can also use it as reference, since the existing
knowledge of operations management systems was used extensively in developing
this model.
Finally, it is necessary to review the study of the three research questions. The first
question, ‘What is ORM system?’ was answered on the basis of the extensive
literature review. The defined ORM system concept was used throughout this study,
which laid a solid foundation for conducting this research. The second question ‘What
are the current ORM system practices in Australian organisations?’ and third question
‘What are the critical success factors of an effective ORM system implementation?’,
were answered using the data from 136 respondents of Australian organisations. The
status of ORM in Australia and the perception regarding the critical success factors
for managing operational risks in Australian organisations were identified. In
summary, the three research questions were answered and the two research objectives
achieved through conducting this study.
6.3 Summary
The following conclusions have been obtained from this research. First, the
instrument in this study is reliable and valid. It can be used by other researchers in
future studies in the ORM system implementation area. Second, several conclusions
have been obtained from survey analysis, which are listed as follows: (1) ORM
system implementation is not limited to the size of the organisation. It is implemented

112
by large organisations as well as SMEs; (2) ISO 9001 (quality management standard)
was the most favourable standard used for ORM system implementation.
AS/NZS 4360 (risk management standard), ISO 14000 (environmental management
standard), and AS/NZS 4801 (occupational health and safety management standard)
were the alternatives for many organisations, while COSO and other standards seems
relatively negligible; (3) A large number of organisations used management system
standards as an integrated approach rather than stand-alone. A majority of
organisations were moving toward the amalgamation of all the management systems
into a single integrated management system; (4) Organisations were aware of the
importance of all the ORM system factors; however, they could be still struggling to
implement those factors successfully. Planning and strategic alignment factors are
well practised and perceived to be the most critical factors among all the other factors;
(5) All proposed ORM system elements including Leadership, Planning and strategic
alignment, Implementation, Monitoring and continuous improvement, Training and
performance appraisal, Employee involvement and empowerment, and
Communication have a positive impact on the ORM system. Consequently, all these
factors are considered to be critical to effective ORM system implementation; (6)
There is a trend towards strong positive correlation among all critical success factors.

113
6.4 Limitation and future research perspectives
The research has been completed. It is necessary to evaluate this study in the context
of its limitations. The limitations of this study are discussed as follows:
• This research is exploratory in nature. Thus, it identifies the ‘what’ about
ORM system but not ‘why’.
• Data used in this study came from only 136 respondents of Australian
organisations certified to one or more management system standards. This
may limit the representativeness of the finding and its generalisation.
The direction of future research is recommended as follows:
• Replication of this study would be helpful in re-examining the validity of its
findings. Further empirical studies using larger sample sizes, greater
geographical diversity and firm type diversity would be helpful in validating
specific parts of the theoretical models proposed in this study.
• This study would be investigated in different countries to test whether they go
in the same or different directions.
• A set of longitudinal studies would be very valuable in studying the time
dimension of ORM system implementation.

114
• Structured interviews would be conducted in different types of Australian
organisations in order to continuously improve the ORM system
implementation model.
• An in-depth case study would be conducted in an Australian organisation to
gain more insight into using this ORM system implementation model in
practice.
6.5 Research contributions
The major contributions in this research are shown as follows:
• A reliable and valid research instrument has been developed.
• Seven factors that are critical to the success of ORM system implementation in
Australian organisation are identified.
• A model and guidelines for ORM system implementation have been proposed.
With the above contributions, this research establishes a foundation for ORM
researchers to continue in their future research studies on ORM system
implementation. In addition, the results of this study can be beneficial to practitioners
to understand the core characteristics of the ORM system and appropriate roles in the
organisation they should play to achieve ORM excellence.

115
References
ACCC 2000, Annual Report 1999-2000, ACCC Publishing, Canberra.
ACCC 2001, Annual Report 2000-01, ACCC Publishing, Canberra.
ACCC 2002, Annual Report 2001-02, ACCC Publishing, Canberra.
ACCC 2003, Annual Report 2002-03, ACCC Publishing, Canberra.
Affisco, J.F., Nasri, F., & Paknejad, M.J. 1997, Environmental versus quality
standards: an overview and comparison, International Journal of Quality Science,
2(1): 5–23.
Ahire, S.L., Golhar, D.Y., & Waller, M.A. 1996, Development and validation of
TQM implementation constructs, Decision Sciences, 27(1): 23–56.
Akpolat, H. 2004, Six Sigma in Transactional and Service Environments, Gower
Publishing Co., UK.
Akpolat, H., & Xu, J. 2002, Integrated management systems: quality, environment
and safety, The Asian Journal on Quality, 3(1):85–90.

116
Anderson, E.W., Fornell, C., & Lehmann, D.R. 1994, Customer satisfaction, market
share, and profitability: findings from Sweden, Journal of Marketing, 58: 53–56.
Angell, L.C. 1999, Integrating environmental issues into the mainstream: an agenda
for research in operations management, Journal of Operations Management, 17(5):
575–599.
Barrett, P.J. 2003, Strategic Insights into Enterprise Risk Management (ERM),
Conference Audience: Address to the ACT Chapter of the Australasian, Institute of
Risk Management.
Beasley, M.S., Clune, R., & Hermanson, D.R. 2005, ERM: a report status, Internal
Auditor, 62(1): 67–72.
Beechner, A.B., & Koch, J.E. 1997, Integrating ISO 9001 and ISO 14001, Quality
Progress, February: 33–36.
Berry, A., & Phillips, J. 1998, Pulling it together, Risk Management, 45(9): 53–58.
Bodnar, G.M., Hayt, G.S., & Marston, R.C. 1998, Financial Management, 27(4): 70–
91.

117
Brown, K.A. 1996, Workplace safety: a call for research, Journal of Operations
Management, 14(2): 157–171.
Brown, K.A., Willis, P.G., & Prussia, G.E. 2000, Predicting safe employee behavior
in the steel industry: the development and test of a socio-technical model, Journal of
Operations Management, 18(4): 445–468.
Brown, M.G., Hitchcock, D.E., & Willard, M.L. 1994, Why TQM Fails and What to
Do About It, Irwin, Burr Ridge, Illinois.
Brumale, S., & McDowall, J. 1999, Integrated management systems, The Quality
Magazine, 8(1): 52–58.
Chang, T. 2002, Six Sigma: A Framework for Small and Medium-sized Enterprises to
Achieve Total Quality, PhD thesis, Cleveland State University, USA.
Cherrington, D.J. 1995, The Management of Human Resources, 4th edition, Prentice-
Hall, Englewood Cliffs, Prentice-Hall, New Jersey.
Churchill, G.A. 1979, A paradigm for developing better measures of marketing
constructs, Journal of Marketing Research, 16(1):64–73.

118
Commonwealth of Australia 1996a, Guidelines for Managing Risk in the Australian
Public Service, MAB/MIAC Report 22, AGPS, Canberra.
Commonwealth of Australia 1996b, Managing Risk in Procurement – a Handbook,
AGPS, Canberra.
Cooke, D.L. 2004, The Dynamics and Control of Operational Risk, PhD thesis, The
University of Calgary, Alberta.
Cooper, D.R., & Emory, C.W. 1995, Business Research Methods, Irwin, USA.
Cooper, D.R., Schindler, P.S. 1998, Business Research Methods, McGraw-Hill, New
York.
Corrigan, E.G. 1998, The Practice of Risk Management: Implementing Processes for
Managing Firmwide Market Risk, Euromoney Publications, London.
COSO 2004, Enterprise Risk Management – Integrated Framework, New York.
Cruz, M.G. 2002, Modeling, Measuring, and Hedging Operational Risk, John Wiley
& Sons, Chichester.

119
Dean, J.W., & Bowen, D.E. 1994, Management theory and total quality: improving
research and practice through theory development, Academy of Management Review,
19(3): 392–418.
DeLoach, J.W. 2000, Enterprise Wide Risk Management: Strategies for Linking Risk
with Opportunity, Financial Times/Prentice Hall, London.
Deming, W.E. 1986, Out of Crisis, Massachusetts Institute of Technology, Center for
Advanced Engineering Study, Cambridge, MA.
DuBrin, A.J. 1995, Leadership: Research Findings, Practice, and Skills, Houghton
Mifflin Company, Boston.
Eiss, E. 1999, Enterprising solutions, Risk Management, 46(8): 34–39.
EPA NSW 1999, Annual Report 1998–1999, EPA NSW Publishing, Sydney.
EPA NSW 2000, Annual Report 1999–2000, EPA NSW Publishing, Sydney.
EPA NSW 2001, Annual Report 2000–2001, EPA NSW Publishing, Sydney.
EPA NSW 2002, Annual Report 2001–2002, EPA NSW Publishing, Sydney.

120
EPA NSW 2003, Annual Report 2002–2003, EPA NSW Publishing, Sydney.
EPA South Australia 1999, Annual Report 1998–1999, EPA South Australia
Publishing, Adelaide.
EPA South Australia 2000, Annual Report 1999–2000, EPA South Australia
Publishing, Adelaide.
EPA South Australia 2001, Annual Report 2000–2001, EPA South Australia
Publishing, Adelaide.
EPA South Australia 2002, Annual Report 2001–2002, EPA South Australia
Publishing, Adelaide.
EPA South Australia 2003, Annual Report 2002–2003, EPA South Australia
Publishing, Adelaide.
EPA Victoria 1999, Annual Report 1998–1999, EPA Victoria Publishing, Southbank.
EPA Victoria 2000, Annual Report 1999–2000, EPA Victoria Publishing, Southbank.
EPA Victoria 2001, Annual Report 2000–2001, EPA Victoria Publishing, Southbank.

121
EPA Victoria 2002, Annual Report 2001–2002, EPA Victoria Publishing, Southbank.
EPA Victoria 2003, Annual Report 2002–2003, EPA Victoria Publishing, Southbank.
EPA Tasmania 2003, Annual Report 2002–2003, EPA Tasmania Publishing, Hobart.
Flower, F.J. Jr 1993, Survey Research Methods, Sage Publications, New York.
Flynn, B.B., Sakakibara, S., Schroeder, R.G., Bates, K.A., & Flynn, E.J. 1990,
Empirical research methods in operations management, Journal of Operations
Management, 9(2):250–284.
Flynn, B.B., Schroeder, R.G. & Sakakibara, S. 1994, A framework for quality
management research and an associated measurement instrument, Journal of
Operations Management, 11:339–366.
Forza, C. 2002, Survey research in operations management: a process-based
perspective, International Journal of Operations & Production Management,
22(2):152–194.
Frame, J.D. 2003, Managing Risk in Organizations: A Guide for Managers, Jossey-
Bass, San Francisco.

122
Frost, C., Allen, D., Porter, J., & Bloodworth, P. 2001, Operational Risk and
Resilience: Understanding and Minimizing Operational Risk to Secure Shareholder
Value, Boston, Butterworth-Heinemann.
Funston, R. 2003, Creating a risk-intelligent organization, The Internal Auditor,
60(2):59–63.
Gardner, D.H., & Winder, C. 1997, Occupational health and safety management
system, Quality Assurance, 5(3): 183–196.
Geffen, C.A., & Rothenberg, S. 2000, Suppliers and environmental innovation: the
automotive paint process, International Journal of Operations and Production
Management, 20(2): 166–186.
Gordon, J., & Wiseman, J. 1995, Thriving on competition, Business Quarterly,
Spring: 79–84.
Hair, J.F., Anderson, R.E., Tatham, R.L., & Black, W.C. 1998, Multivariate Data
Analysis, Prentice-Hall, New Jersey.
Hair, J.F., Bush, R.P., & Ortinau, D.J. 2006, Marketing Research: Within a Changing
Information Environment, McGraw-Hill/Irwin, New York.

123
Hanna, B., Smith, M., & Mindrum, C. 2003, Managing operational risk, Canadian
Underwriter, 70(3): 44–46.
Hasan., M., & Kerr., R.M. 2003, The relationship between total quality management
practices and organisational performance in service organisations, The TQM
Magazine, 15(4): 286–291.
Hillson, D. 2006, The Risk Management Universe: A Guide Tour, British Standards
Institute, London.
Hopkin, P. 2002, Holistic risk management in practice, London, Wither by Australian
CPA, 71(10): 75.
Ishikawa, K. 1985, What is Total Quality Control? The Japanese Way, Prentice-Hall,
London.
ISO8402 1994, Quality Management and Quality Assurance - Vocabulary,
International Organization for Standardization, Geneve.
Jabbour, L. 1999, Organisations on a risky foothold: survey reveals, Australia, SAI-
GLOBAL Newsletter.

124
Jonker, J., & Karapetrovic, S. 2003, Integration of standardized management systems:
searching for a recipe and ingredients, Total Quality Management, 14(4): 451–459.
Juran, J.M., & Gryna, F.M. 1993, Quality Planning and Analysis, 3rd edition,
McGraw-Hill, Inc., New York.
Kanji, G.K., & Asher, M. 1993, Total Quality Management Process: A Systematic
Approach, Advances in Total Quality Management Series, Carfax, Abingdon.
Karapetrovic, S. 2003, Musings on integrated management systems, Measuring
Business Excellence, 7(1): 4–13.
Karapetrovic, S., & Willborn, W. 1998, Integration of quality and environmental
management systems, The TQM Magazine, (10): 204–213.
Kayfish, L. 2001, ERM advice from pioneers, Risk Management, 48(10): 64.
Keey, R.B. 2003, Risk management: an Australasian view, Trans IChemE, 81(PartB):
31–35.
Keillor, B.D., Wilkinson, T.J., & Owens, D. 2005, Threats to international
operations: dealing with political risk at the firm level, Journal of Business Research,
58(5): 629–635.

125
Klassen, R.D., & McLaughlin, C.P. 1996, The impact of environmental management
on firm performance, Management Science, 42(8): 1199–1214.
Kleffner, A.E., Lee, R.B., & McGannon, B. 2003, The effect of corporate governance
on the use of enterprise risk management: evidence from Canada, Risk Management
and Insurance Review, 16(1): 53–73.
Knight, K.W. 2002, Developing a risk management standard - the Australian
experience, Safety Science, 40: 69–74.
Kobrin, S.J. 1979, Political Risk: A Review and Reconsideration, Journal of
International Business Studies, 10(1): 67–80.
Kumar, R. 2005, Research Methodology: A Step-by-step Guide for Beginners,
Pearson Education, Australia.
Lam, S.S.K. 1995, Quality management and job satisfaction: an empirical study,
International Journal of Quality & Reliability Management, 12(4): 72–78.
Lin, J., & Mills, A. 2001, Measuring the occupational health and safety performance
of construction companies in Australia, Facilities, 19(3/4): 131–138.

126
Little, J.H. 1992, Variation, Knowledge, and the Quality Movement, The 1992
Academy of Management Annual Meeting, 10 August 1992.
Maani, K.E. 1994, Empirical analysis of quality management in manufacturing, Asia
Pacific Journal of Quality Management, 3(1): 5–23.
Mann, R.S. 1992, The Development of a Framework to Assist in the Implementation
of TQM, PhD thesis, Department of Industrial Studies, University of Liverpool, UK.
Marshall, A.P. 2000, Foreign exchange risk management in UK, USA and Asia
Pacific multinational companies, Journal of Multinational Financial Management,
10(2): 185–211.
McCarty, L.S., & Power, M. 2000, Approaches to developing risk management
objectives: an analysis of international strategies, Environmental Science & Policy,
3:311–319.
McFadden, K.L., & Hosmane, B.S., 2001, Operations safety: an assessment of a
commercial aviation safety program, Journal of Operations Management, 19(5): 579–
591.
McPhee, L. 2003, Risk management and governance, Canberra Bulletin of Public
Administration, 106:1–8.

127
Merkley, W. 2001, Does enterprise risk management count?, Risk Management,
48(4): 25–28.
Mohamed, S. 199), Empirical investigation of construction safety management
activities and performance in Australia, Safety Science, 33(3): 129–142.
Nicholls, C. 2007, Aussie businesses still risky: Deloitte, Financial Standard, 19 July
2007.
Nunnally, J. 1979, Psychometric Theory, McGraw-Hill, New York.
Ott, J. 1989, The Organizational Culture Perspective, Dorsey, Chicago.
Peters, G. 1999, Waltzing with the Raptors: A Practical Roadmap to Protecting Your
Company's Reputation, Wiley, New York.
Pitinanondha, T., & Akpolat, H. 2005, Operational risk management systems in
Australian organisations - a comparative study, 1st International Conference on
Operation and Supply Chain Management, Bali.
Powell, T.C. 1995, Total quality management as competitive advantage: a review and
empirical study, Strategic Management Journal, 16(1): 15–37.

128
Pun, K., & Hui, I. 2002, Integrating the safety dimension into quality management
systems: a process model, Total Quality Management, 13(3): 373–391.
Punch, K.F. 2000, Developing Effective Research Proposals, SAGE Publications,
London.
Rahman, S. 2001, A comparative study of TQM practice and organizational
performance of SMEs with and without ISO 900 certification, International Journal
of Quality & Reliability Management, 18(1): 35–49.
Raz, T., & Hillson, D. 2005, A comparative review of risk management standards,
Risk Management: An International Journal, 7(4): 53–66.
Sadgrove, K. 1996, The Complete Guide to Business Risk Management, England,
Gower Publishing.
Sadgrove, K. 2005, The Complete Guide to Business Risk Management, England,
Gower Publishing.
Saraph, J.V., Benson, G.P., & Schroeder, R.G. 1989, An instrument for measuring the
critical factors of quality management, Decision Sciences, 20: 810–829.

129
Schneier, R., & Miccolis, J. 1998, Enterprise risk management, Strategic &
Leadership, 26(2): 10–14.
Scipioni, A., Arena, F., Villa, M., & Saccarola, G. 2001, Integration of management
systems, Environmental Management and Health, 12(2): 134–145.
Sekaran, K. 2003, Research Methods for Business: A Skill Building Approach, John
Wiley & Sons, New York.
Sharman, R. 2002, Enterprise risk management – the KPMG approach, The British
Journal of Administrative Management, May/June (31): 26.
Shewhart, W.A. 1939, Statistical Method From the View Point of Quality Control,
Washington DC: The Graduate School of the Department of Agriculture.
Siegel S., & Castellan, N.J. 1956, Nonparametric Statistics for the Behavioral
Sciences, McGraw-Hill.
Sohal, A.S., Ramsay, L., & Samson, D. 1992, Quality management practice in
Australia industry, Total Quality Management, 3(3): 283–299.

130
Sohal, A.S., & Terziovski, M. 2000, TQM in Australian manufacturing: factors
critical to success, International Journal of Quality & Reliability Management, 17(2),
158–167.
Sroufe, R. 2003, Effects of environmental management systems on environmental
management practices and operations, Production and Operations Management,
12(3): 416–431.
Standards Australia and Standard New Zealand 2000, HB250-2000 Organisational
Experiences in Implementing Risk Management Practices, Sydney and Wellington.
Taylor, F.W. 1911, The Principles of Scientific Management, Reprint, 1967, Norton
Company.
Tena, A.B.E., Llusar, J.C.B., & Puig, V.R. 2001, Measuring the relationship between
total quality management and sustainable competitive advantage: a resource-based
view, Total Quality Management,12(7&8): 932–938.
Terziovski, M., & Samson, D. 1999, The link between total quality management
practice and organisational performance, International Journal of Quality &
Reliability Management, 16(3): 226–237.

131
Tilley, K. 1996, Risk program lag in Australia, survey shows, Business Insurance,
30(35): 2.
Tilley, K. 1997, Risk undermanaged down under (Risk management in Australia),
Business Insurance, 31(16): 41–42.
Walker, P.L., Shenkir, W.G., & Barton, T.L. 2003, ERM in practice, The Internal
Auditor, 60(4): 51–55.
Waring, S. 2001, Risk ready, Australian CPA, 71(10): 75.
Whybark, D.C. 1997, GMRG survey research in operations management,
International Journal of Operations & Production Management, 17(7): 686–696.
Williams, R., Bertsch, B., Dale, B., Wiele, T.V., Iwaarden, J.V., Smith, M., & Visser,
R. 2006, Quality and risk management: what are the key issues?, The TQM Magazine,
18(1), 67–86.
Williamson, K. 2002, Research Methods for Students, Academics and Professionals:
Information Management and Systems, Centre for Information Studies, Wagga
Wagga.

132
Yin, R. 1984, Case Study Research: Design and Methods, Sage Publishing, Beverly
Hills.
Zhang, Z. 2000, Developing a model of quality management methods and evaluating
their effects on business performance, Total Quality Management, 11(1), 129–137.

133
Appendix 1 Final version of questionnaire survey

134

135

136

137

138
Appendix 2 Letter of approval from UTS Human Research
Ethics Committee

139
Appendix 3: Example of survey email
Dear Madam/Sir, This survey is part of my PhD research project under the supervision of Dr Hasan Akpolat at University of Technology Sydney and intended to obtain information on how organisations manage operational risks Australia and New Zealand. Operational Risk Management (ORM) systems are used for the systemic management of risks that may include: • Quality, safety, and environmental risks • Risks associated with the management of facilities and infrastructures • Risks of failure of IT systems and services • Risks associated with corporate and marketing compliance The following questionnaire should only take about 5 minutes to complete: http://services.eng.uts.edu.au/~hasan/orms_survey.html Please also forward the questionnaire to the person(s) who is/are familiar with management systems in your organisation. It would be much appreciated if the survey is completed within the next few days. If you would like a copy of the results of this study, please send the blank email to [email protected]. Thank you very much for your participation in this survey. Kindest regards, Thitima Pitinanondha PhD Candidate Management, Policy and Practice Group UTS, Faculty of Engineering City Campus, Room CB.02.303 Mail Address: University of Technology Sydney PO Box 123, Broadway NSW 2007, Australia Phone: 61-2-9514 2647 Fax: 61-2-9514 2633 Email: [email protected]

140
Appendix 4 Questionnaire coding sheet
Question Variable Number
Code Description Variable Name
1 Identification Number ID 1 2 Department
1 = HR 2 = Operations 3 = Sales & Marketing 4 = Others 9 = Missing
Department
2 3 Operation type 1 = Mining 2 = Electricity, Gas and Water supply 3 = Wholesale Trade 4 = Hospitality 5 = Media and Communications 6 = Health and Community services 7 = Manufacturing 8 = Construction 9 = Retail Trade 10 = Transport and Storage 11 = Education 99 = Missing
Operation
3 4 Organisation size 1 = under 20 employees 2 = 20 -199 employees 3 = 200 - 499 employees 4 = 500 - 2499 employees 5 = over 2500 9 = Missing
Size
4 5 Risk Policy 1 = Yes 2 = No 9 = Missing
Policy
5 6 ORMS system 1 = Single 2 = Multiple 3 = None 9 = Missing
System
6
7 Risk Manager 1 = Yes 2 = No 9 = Missing
Manager
7 8 Use standard as a guideline 1 = Yes 2 = No 9 = Missing
Guideline
8 9 AS/NZS 4360 1 = Tick 9 = No tick
AS4360

141
Question Variable Number
Code Description Variable Name
8 10 COSO 1 = Tick 9 = No tick
COSO
8 11 ISO 9001 1 = Tick 9 = No tick
ISO9001
8 12 ISO 14000 1 = Tick 9 = No tick
ISO14000
8 13 AS/NZS 4801 1 = Tick 9 = No tick
AS4801
8 14 Other standards 1 = Tick 9 = No tick
Others
9 15 System Integration 1 = Not at all 2 = Low 3 = Medium 4 = High 5 = Full integrated 9 = Missing
Integration
10 16 10 Practice 1 = Strongly disagree 2 = disagree 3 = Neutral 4 = Agree 5 = Strongly agree 9 = Missing
Planning1p
10 17 10 Importance 1 = Not important at all 2 = Not important 3 = Neutral important 4 = Important 5 = Vital 9 = Missing
Planning1i
11 18 11 Practice 1 = Strongly disagree 2 = disagree 3 = Neutral 4 = Agree 5 = Strongly agree 9 = Missing
Planning2p
11 19 11 Importance 1 = Not important at all 2 = Not important 3 = Neutral important 4 = Important 5 = Vital 9 = Missing
Planning2i

142
Question Variable Number
Code Description Variable Name
12 20 12 Practice 1 = Strongly disagree 2 = disagree 3 = Neutral 4 = Agree 5 = Strongly agree 9 = Missing
Leadership1p
12 21 12 Importance 1 = Not important at all 2 = Not important 3 = Neutral important 4 = Important 5 = Vital 9 = Missing
Leadership1i
13 22 13 Practice 1 = Strongly disagree 2 = disagree 3 = Neutral 4 = Agree 5 = Strongly agree 9 = Missing
Planning3p
13 23 13 Importance 1 = Not important at all 2 = Not important 3 = Neutral important 4 = Important 5 = Vital 9 = Missing
Planning3i
14 24 14 Practice 1 = Strongly disagree 2 = disagree 3 = Neutral 4 = Agree 5 = Strongly agree 9 = Missing
Leadership2p
14 25 14 Importance 1 = Not important at all 2 = Not important 3 = Neutral important 4 = Important 5 = Vital 9 = Missing
Leadership2i
15 26 15 Practice 1 = Strongly disagree 2 = disagree 3 = Neutral 4 = Agree 5 = Strongly agree 9 = Missing
Leadership3p

143
Question Variable Number
Code Description Variable Name
15 27 15 Importance 1 = Not important at all 2 = Not important 3 = Neutral important 4 = Important 5 = Vital 9 = Missing
Leadership3i
16 28 16 Practice 1 = Strongly disagree 2 = disagree 3 = Neutral 4 = Agree 5 = Strongly agree 9 = Missing
Communication1p
16 29 16 Importance 1 = Not important at all 2 = Not important 3 = Neutral important 4 = Important 5 = Vital 9 = Missing
Communication1i
17 30 17 Practice 1 = Strongly disagree 2 = disagree 3 = Neutral 4 = Agree 5 = Strongly agree 9 = Missing
Leadership4p
17 31 17 Importance 1 = Not important at all 2 = Not important 3 = Neutral important 4 = Important 5 = Vital 9 = Missing
Leadership4i
18 32 18 Practice 1 = Strongly disagree 2 = disagree 3 = Neutral 4 = Agree 5 = Strongly agree 9 = Missing
Leadership5p
18 33 18 Importance 1 = Not important at all 2 = Not important 3 = Neutral important 4 = Important 5 = Vital 9 = Missing
Leadership5i

144
Question Variable Number
Code Description Variable Name
19 34 19 Practice 1 = Strongly disagree 2 = disagree 3 = Neutral 4 = Agree 5 = Strongly agree 9 = Missing
Implementation1p
19 35 19 Importance 1 = Not important at all 2 = Not important 3 = Neutral important 4 = Important 5 = Vital 9 = Missing
Implementation1i
20 36 20 Practice 1 = Strongly disagree 2 = disagree 3 = Neutral 4 = Agree 5 = Strongly agree 9 = Missing
Implementation2p
20 37 20 Importance 1 = Not important at all 2 = Not important 3 = Neutral important 4 = Important 5 = Vital 9 = Missing
Implementation2i
21 38 21 Practice 1 = Strongly disagree 2 = disagree 3 = Neutral 4 = Agree 5 = Strongly agree 9 = Missing
Planning4p
21 39 21 Importance 1 = Not important at all 2 = Not important 3 = Neutral important 4 = Important 5 = Vital 9 = Missing
Planning4i
22 40 22 Practice 1 = Strongly disagree 2 = disagree 3 = Neutral 4 = Agree 5 = Strongly agree 9 = Missing
Communication2p

145
Question Variable Number
Code Description Variable Name
22 41 22 Importance 1 = Not important at all 2 = Not important 3 = Neutral important 4 = Important 5 = Vital 9 = Missing
Communication2i
23 42 23 Practice 1 = Strongly disagree 2 = disagree 3 = Neutral 4 = Agree 5 = Strongly agree 9 = Missing
Implementation3p
23 43 23 Importance 1 = Not important at all 2 = Not important 3 = Neutral important 4 = Important 5 = Vital 9 = Missing
Implementation3i
24 44 24 Practice 1 = Strongly disagree 2 = disagree 3 = Neutral 4 = Agree 5 = Strongly agree 9 = Missing
Communication3p
24 45 24 Importance 1 = Not important at all 2 = Not important 3 = Neutral important 4 = Important 5 = Vital 9 = Missing
Communication3i
25 46 25 Practice 1 = Strongly disagree 2 = disagree 3 = Neutral 4 = Agree 5 = Strongly agree 9 = Missing
Employee1p
25 47 25 Importance 1 = Not important at all 2 = Not important 3 = Neutral important 4 = Important 5 = Vital 9 = Missing
Employee1i

146
Question Variable Number
Code Description Variable Name
26 48 26 Practice 1 = Strongly disagree 2 = disagree 3 = Neutral 4 = Agree 5 = Strongly agree 9 = Missing
Employee2p
26 49 26 Importance 1 = Not important at all 2 = Not important 3 = Neutral important 4 = Important 5 = Vital 9 = Missing
Employee2i
27 50 27 Practice 1 = Strongly disagree 2 = disagree 3 = Neutral 4 = Agree 5 = Strongly agree 9 = Missing
Employee3p
27 51 27 Importance 1 = Not important at all 2 = Not important 3 = Neutral important 4 = Important 5 = Vital 9 = Missing
Employee3i
28 52 28 Practice 1 = Strongly disagree 2 = disagree 3 = Neutral 4 = Agree 5 = Strongly agree 9 = Missing
Employee4p
28 53 28 Importance 1 = Not important at all 2 = Not important 3 = Neutral important 4 = Important 5 = Vital 9 = Missing
Employee4i
29 54 29 Practice 1 = Strongly disagree 2 = disagree 3 = Neutral 4 = Agree 5 = Strongly agree 9 = Missing
Training1p

147
Question Variable Number
Code Description Variable Name
29 55 29 Importance 1 = Not important at all 2 = Not important 3 = Neutral important 4 = Important 5 = Vital 9 = Missing
Training1i
30 56 30 Practice 1 = Strongly disagree 2 = disagree 3 = Neutral 4 = Agree 5 = Strongly agree 9 = Missing
Training2p
30 57 30 Importance 1 = Not important at all 2 = Not important 3 = Neutral important 4 = Important 5 = Vital 9 = Missing
Training2i
31 58 31 Practice 1 = Strongly disagree 2 = disagree 3 = Neutral 4 = Agree 5 = Strongly agree 9 = Missing
Implementation4p
31 59 31 Importance 1 = Not important at all 2 = Not important 3 = Neutral important 4 = Important 5 = Vital 9 = Missing
Implementation4i
32 60 32 Practice 1 = Strongly disagree 2 = disagree 3 = Neutral 4 = Agree 5 = Strongly agree 9 = Missing
Monitoring1p
32 61 32 Importance 1 = Not important at all 2 = Not important 3 = Neutral important 4 = Important 5 = Vital 9 = Missing
Monitoring1i

148
Question Variable Number
Code Description Variable Name
33 62 33 Practice 1 = Strongly disagree 2 = disagree 3 = Neutral 4 = Agree 5 = Strongly agree 9 = Missing
Leadership6p
33 63 33 Importance 1 = Not important at all 2 = Not important 3 = Neutral important 4 = Important 5 = Vital 9 = Missing
Leadership6i
34 64 34 Practice 1 = Strongly disagree 2 = disagree 3 = Neutral 4 = Agree 5 = Strongly agree 9 = Missing
Monitoring2p
34 65 34 Importance 1 = Not important at all 2 = Not important 3 = Neutral important 4 = Important 5 = Vital 9 = Missing
Monitoring2i
35 66 35 Practice 1 = Strongly disagree 2 = disagree 3 = Neutral 4 = Agree 5 = Strongly agree 9 = Missing
Monitoring3p
35 67 35 Importance 1 = Not important at all 2 = Not important 3 = Neutral important 4 = Important 5 = Vital 9 = Missing
Monitoring3i
36 68 36 Practice 1 = Strongly disagree 2 = disagree 3 = Neutral 4 = Agree 5 = Strongly agree 9 = Missing
Leadership7p

149
Question Variable Number
Code Description Variable Name
36 69 36 Importance 1 = Not important at all 2 = Not important 3 = Neutral important 4 = Important 5 = Vital 9 = Missing
Leadership7i
37 70 37 Practice 1 = Strongly disagree 2 = disagree 3 = Neutral 4 = Agree 5 = Strongly agree 9 = Missing
Training3p
37 71 37 Importance 1 = Not important at all 2 = Not important 3 = Neutral important 4 = Important 5 = Vital 9 = Missing
Training3i

150
Appendix 5 Missing data analysis
Variable Mean Std. dev. Min. Max. Max
poss. N Valid N Missing data
% Missing
data Q1 2.82 1.027 1 4 136 136 0 0Q2 9.43 2.378 2 12 136 136 0 0Q3 4.10 1.276 1 5 136 136 0 0Q4 1.05 .222 1 2 136 136 0 0Q5 1.72 .526 1 3 136 136 0 0Q6 1.10 .296 1 2 136 135 1 0.74Q7 1.08 .274 1 2 136 136 0 0Q9 3.82 1.137 1 5 136 136 0 0Q10p 4.04 .972 1 5 136 134 2 1.47Q10i 4.43 .688 2 5 136 134 2 1.47Q11p 4.13 .856 1 5 136 133 3 2.21Q11i 4.32 .972 1 5 136 134 2 1.47Q12p 3.90 .987 1 5 136 135 1 0.74Q12i 4.37 .780 2 5 136 135 1 0.74Q13p 3.86 1.038 1 5 136 135 1 0.74Q13i 4.51 .598 3 5 136 134 2 1.47Q14p 3.66 1.098 1 5 136 134 2 1.47Q14i 4.30 .683 2 5 136 134 2 1.47Q15p 4.10 1.046 1 5 136 135 1 0.74Q15i 4.36 .740 1 5 136 134 2 1.47Q16p 3.16 1.139 1 5 136 135 1 0.74Q16i 4.30 .829 1 5 136 135 1 0.74Q17p 3.51 1.112 1 5 136 135 1 0.74Q17i 4.37 .753 2 5 136 134 2 1.47Q18p 3.33 1.125 1 5 136 135 1 0.74Q18i 4.36 .750 2 5 136 134 2 1.47Q19p 3.63 1.025 1 5 136 136 0 0.00Q19i 4.36 .618 2 5 136 135 1 0.74Q20p 3.73 .976 1 5 136 128 8 5.88Q20i 4.36 .706 2 5 136 136 0 0.00Q21p 3.50 1.036 1 5 136 135 1 0.74Q21i 4.32 .631 2 5 136 136 0 0.00Q22p 3.25 1.063 1 5 136 135 1 0.74Q22i 4.32 .740 1 5 136 135 1 0.74Q23p 3.69 1.058 1 5 136 134 2 1.47Q23i 4.36 .680 2 5 136 132 4 2.94Q24p 3.55 1.039 1 5 136 136 0 0.00Q24i 4.40 .692 1 5 136 136 0 0.00Q25p 2.86 1.218 1 5 136 136 0 0.00Q25i 4.05 .937 1 5 136 136 0 0.00Q26p 3.10 1.194 1 5 136 136 0 0.00Q26i 4.07 .849 1 5 136 136 0 0.00Q27p 3.50 1.078 1 5 136 135 1 0.74Q27i 4.31 .784 1 5 136 136 0 0.00

151
Variable Mean Std. dev. Min. Max. Max
poss. N Valid N Missing data
% Missing
data Q28p 3.51 1.040 1 5 136 136 0 0.00Q28i 4.28 .740 2 5 136 135 1 0.74Q29p 3.04 .988 1 5 136 136 0 0.00Q29i 4.24 .791 1 5 136 136 0 0.00Q30p 3.06 1.107 1 5 136 136 0 0.00Q30i 4.33 .781 1 5 136 135 1 0.74Q31p 3.21 1.078 1 5 136 136 0 0.00Q31i 4.13 .985 1 5 136 136 0 0.00Q32p 3.40 1.156 1 5 136 136 0 0.00Q32i 4.23 .788 1 5 136 136 0 0.00Q33p 3.35 1.092 1 5 136 136 0 0.00Q33i 4.18 .845 1 5 136 136 0 0.00Q34p 3.39 1.058 1 5 136 135 1 0.74Q34i 4.24 .815 1 5 136 135 1 0.74Q35p 3.33 1.164 1 5 136 135 1 0.74Q35i 4.20 .836 2 5 136 135 1 0.74Q36p 2.85 1.115 1 5 136 136 0 0.00Q36i 3.98 .961 1 5 136 134 2 1.47Q37p 3.07 1.196 1 5 136 136 0 0.00Q37i 4.02 .913 1 5 136 134 2 1.47

152
Appendix 6: Factor analysis Factor 1: Leadership Communalities Initial Extraction Leadership 1 1.000 .658Leadership 2 1.000 .564Leadership 3 1.000 .405Leadership 4 1.000 .647Leadership 5 1.000 .603Leadership 6 1.000 .489Leadership 7 1.000 .574
Extraction method: Principal component analysis. Total variance explained
Initial eigenvalues Extraction sums of squared loadings Component Total % of variance Cumulative % Total % of variance Cumulative % 1 3.941 56.293 56.293 3.941 56.293 56.2932 .749 10.697 66.990 3 .669 9.562 76.553 4 .554 7.910 84.462 5 .457 6.530 90.993 6 .316 4.516 95.509 7 .314 4.491 100.000
Extraction method: Principal component analysis. Component matrix(a)
Component 1 Leadership 1 .811Leadership 2 .751Leadership 3 .636Leadership 4 .804Leadership 5 .777Leadership 6 .699Leadership 7 .758
Extraction method: Principal component analysis. a 1 components extracted.

153
Factor 2: Planning and strategic alignment Communalities Initial Extraction Planning 1 1.000 .700Planning 2 1.000 .553Planning 3 1.000 .701Planning 4 1.000 .645
Extraction method: Principal component analysis. Total variance explained
Initial eigenvalues Extraction sums of squared loadings Component Total % of variance Cumulative % Total % of variance Cumulative % 1 2.599 64.975 64.975 2.599 64.975 64.9752 .595 14.880 79.855 3 .494 12.350 92.205 4 .312 7.795 100.000
Extraction method: Principal component analysis. Component matrix(a)
Component 1 Planning 1 .837 Planning 2 .744 Planning 3 .837 Planning 4 .803
Extraction method: Principal component analysis. a 1 components extracted.

154
Factor 3: Implementation Communalities Initial Extraction Implementation 1 1.000 .761Implementation 2 1.000 .679Implementation 3 1.000 .743Implementation 4 1.000 .638
Extraction method: Principal component analysis. Total variance explained
Initial eigenvalues Extraction sums of squared loadings Component Total % of variance Cumulative % Total % of variance Cumulative % 1 2.821 70.518 70.518 2.821 70.518 70.5182 .482 12.060 82.578 3 .392 9.801 92.379 4 .305 7.621 100.000
Extraction method: Principal component analysis. Component matrix(a)
Component 1 Implementation 1 .873Implementation 2 .824Implementation 3 .862Implementation 4 .799
Extraction method: Principal component analysis. a 1 components extracted.

155
Factor 4: Monitoring and continuous improvement Communalities Initial Extraction Monitoring 1 1.000 .647Monitoring 2 1.000 .610Monitoring 3 1.000 .708
Extraction method: Principal component analysis. Total variance explained
Initial eigenvalues Extraction sums of squared loadings Component Total % of variance Cumulative % Total % of variance Cumulative % 1 1.965 65.511 65.511 1.965 65.511 65.5112 .582 19.384 84.895 3 .453 15.105 100.000
Extraction method: Principal component analysis. Component matrix(a)
Component 1 Monitoring 1 .804 Monitoring 2 .781 Monitoring 3 .841
Extraction method: Principal component analysis. a 1 components extracted.

156
Factor 5: Training and performance appraisal Communalities Initial Extraction Training 1 1.000 .727Training 2 1.000 .730Training 3 1.000 .542
Extraction method: Principal component analysis. Total variance explained
Initial eigenvalues Extraction sums of squared loadings Component Total % of variance Cumulative % Total % of variance Cumulative % 1 2.000 66.650 66.650 2.000 66.650 66.6502 .628 20.930 87.580 3 .373 12.420 100.000
Extraction method: Principal component analysis. Component matrix(a)
Component 1 Training 1 .853 Training 2 .854 Training 3 .737
Extraction method: Principal component analysis. a 1 components extracted.

157
Factor 6: Employee involvement and empowerment Communalities Initial Extraction Employee 1 1.000 .722Employee 2 1.000 .742Employee 3 1.000 .622Employee 4 1.000 .545
Extraction method: Principal component analysis. Total variance explained
Initial eigenvalues Extraction sums of squared loadings Component Total % of variance Cumulative % Total % of variance Cumulative % 1 2.632 65.794 65.794 2.632 65.794 65.7942 .799 19.973 85.768 3 .386 9.638 95.405 4 .184 4.595 100.000
Extraction method: Principal component analysis. Component matrix(a)
Component 1 Employee 1 .850 Employee 2 .862 Employee 3 .789 Employee 4 .738
Extraction method: Principal component analysis. a 1 components extracted.

158
Factor 7: Communication Communalities Initial Extraction Communication 1 1.000 .755Communication 2 1.000 .773Communication 3 1.000 .739
Extraction method: Principal component analysis. Total variance explained
Initial eigenvalues Extraction sums of squared loadings Component Total % of variance Cumulative % Total % of variance Cumulative % 1 2.267 75.580 75.580 2.267 75.580 75.5802 .391 13.034 88.614 3 .342 11.386 100.000
Extraction method: Principal component analysis. Component matrix(a)
Component 1 Communication 1 .869Communication 2 .879Communication 3 .860
Extraction method: Principal component analysis. a 1 components extracted.

159
Appendix 7 Multiple regression analysis Variables entered/removed(b)
Model Variables entered Variables removed Method
1 Leadership 1 Leadership 2 Leadership 3 Leadership 4 Leadership 5 Leadership 6 Leadership 7 Planning 1 Planning 2 Planning 3 Planning 4 Implementation 1 Implementation 2 Implementation 3 Implementation 4 Monitoring 1 Monitoring 2 Monitoring 3 Training 1 Training 2 Training 3 Employee 1 Employee 2 Employee 3 Employee 4 Communication 1 Communication 2 Communication 3 (a)
. Enter
a All requested variables entered b Dependent variable: Importance Model summary
Model r r square Adjusted r
square Std. error of the estimate
1 .628(a) .394 .199 .49288a Predictors: (Constant), Leadership 1, Leadership 2, Leadership 3, Leadership 4, Leadership 5, Leadership 6, Leadership 7, Planning 1, Planning 2, Planning 3, Planning 4, Implementation 1, Implementation 2, Implementation 3, Implementation 4, Monitoring 1, Monitoring 2, Monitoring 3, Training 1, Training 2, Training 3, Employee 1, Employee 2, Employee 3, Employee 4, Communication 1, Communication 2, Communication 3

160
ANOVA(b)
Model Sum of squares df Mean square F Sig.
Regression 13.749 28 .491 2.021 .007(a) Residual 21.135 87 .243
1
Total 34.884 115 a Predictors: (Constant), Leadership 1, Leadership 2, Leadership 3, Leadership 4, Leadership 5, Leadership 6, Leadership 7, Planning 1, Planning 2, Planning 3, Planning 4, Implementation 1, Implementation 2, Implementation 3, Implementation 4, Monitoring 1, Monitoring 2, Monitoring 3, Training 1, Training 2, Training 3, Employee 1, Employee 2, Employee 3, Employee 4, Communication 1, Communication 2, Communication 3 b Dependent Variable: Importance Coefficients(a)
Unstandardised coefficients
Standardised coefficients t Sig.
Model B Std. error Beta B Std. error 1 (Constant) 3.028 .305 9.926 .000 Leadership 1 .012 .081 .023 .151 .880 Leadership 2 -.156 .096 -.320 -1.625 .108 Leadership 3 .133 .066 .242 2.028 .046 Leadership 4 .003 .078 .005 .033 .973 Leadership 5 -.066 .073 -.132 -.906 .368 Leadership 6 -.045 .086 -.091 -.524 .602 Leadership 7 .013 .074 .027 .175 .861 Planning 1 .042 .092 .073 .458 .648 Planning 2 .036 .075 .059 .484 .629 Planning 3 -.059 .089 -.109 -.659 .512 Planning 4 .108 .094 .203 1.150 .253 Implementation 1 .047 .087 .089 .542 .589 Implementation 2 -.113 .096 -.208 -1.172 .245 Implementation 3 -.106 .089 -.200 -1.192 .237 Implementation 4 -.015 .080 -.029 -.183 .855 Monitoring 1 .036 .063 .078 .572 .569 Monitoring 2 .115 .067 .225 1.702 .092 Monitoring 3 .066 .068 .143 .972 .334 Training 1 -.043 .074 -.080 -.582 .562 Training 2 -.042 .084 -.087 -.500 .618 Training 3 .109 .068 .241 1.597 .114 Employee 1 .010 .075 .022 .131 .896 Employee 2 .027 .092 .061 .292 .771 Employee 3 -.018 .082 -.035 -.223 .824 Employee 4 .035 .071 .068 .497 .621 Communication 1 .138 .076 .285 1.809 .074 Communication 2 .040 .096 .076 .419 .677 Communication 3 .019 .078 .036 .240 .811
a Dependent variable: Importance
161
List of publications:
Pitinanondha, T., & Akpolat, H. 2005, Operational risk management systems in
Australian organisations - a comparative study, 1st International Conference on
Operation and Supply Chain Management, Bali.
Pitinanondha, T., & Akpolat, H. 2007a, Managing operational risks: a conceptual
framework for operational risk management, 2nd International Conference on
Operation and Supply Chain Management, Bangkok.
Pitinanondha, T., & Akpolat, H. 2007b, Managing operational risks: critical
factors for operational risk management system, 8th International Conference on
Operations & Quantitative Management, Bangkok.