Validation of MODIS based GOES-R ABI AOD retrievals using Ground based LIDAR Data

Evaluation of the MODIS retrievals of dust aerosol over the ocean during PRIDE
Robert C. Levy’*, Lorraine A. Remer2, Didier Tanrk3, Yoram J. Kaufman2, Charles
Ichoku’, Brent N. Holben4, John M. Livingston’, Philip B. Russell6, Hal Maring7
Science Systems and Applications Inc., Lanham, MD 20706 I
*Laboratory for Atmospheres, NASA Goddard Space Flight Center, Greenbelt, MD 2077 1
3Lab. d’Poptique Atmos., CNRS, Univ. de Sciences et Techniques de Lille, Villeneuve d’Ascq,
France
4Laboratory for Terrestrial Physics, NASA Goddard Space Flight Center, Greenbelt, MD 2077 1
’SRI International, 333 Ravenswood Avenue, Menlo Park, CA 94025
6NASA Ames Research Center, Moffett Field, CA
Rosenstiel School of Marine and Atmospheric Science, University of Miami, Miami, FL 7
*corresponding author E-mail: levy @ climate. gsfc .nasa. gov
1
https://ntrs.nasa.gov/search.jsp?R=20030032180 2018-09-14T04:40:05+00:00Z
Abstract:
The Puerto Rico Dust Experiment (PRIDE) took place in Roosevelt Roads, Puerto Rico
from June 26 to July 24,2000 to study the radiative and physical properties of African
dust aerosol transported into the region. PRIDE had the unique distinction of being the
first major field experiment to allow direct comparison of aerosol retrievals from the
MODerate Imaging Spectro-radiometer (MODIS) with sunphotometer and in-situ aerosol
measurements. Over the ocean, the MODIS algorithm retrieves aerosol optical depth
(AOD) as well as information about the aerosols’ size distribution. During PRIDE,
MODIS derived AODs in the red wavelengths (0.66 pm) compare closely with AODs
measured from sunphotometers, but, are too large at blue and green wavelengths (0.47
and 0.55 pm) and too small in the infrared (0.87 pm). This discrepancy of spectral slope
results in particle size distributions retrieved by MODIS that are small compared to irr-
situ measurements, and smaller still when compared to sunphotometer sky radiance
inversions. The differences in size distributions are, at least in part, associated with
MODIS’ simplification of dust as spherical particles. Analysis of this PRIDE data set is a
first step towards derivation of realistic non-spherical models for future MODIS
retrievals.
2

1. Introduction
Mineral dust aerosols are produced mainly by wind erosion of desert soils, and are a
significant component of tropospheric aerosols [Prospero, 1996; Chiupello, et al. 19991.
These aerosols are lifted by the wind, raised to high altitudes by convection, and may be
transported over long distances from their sources [Ginoux et al., 2001; Li-Jones and
Prospero, 1998; Formenti et al., 200 1 ; Smirnov et al., 2000bl. They influence the optical
properties of the Earth's atmosphere and climate through the scattering and absorption of
sunlight [Tanre' et al., 20011, thereby in turn influencing local and global atmospheric
dynamics [AZpert et al., 1998; Miller and Tegen, 19981. As for indirect climate forcings,
dust aerosol may influence photochemical processes [Dickerson et al. , 19971, contribute
to cloud condensation nuclei [Levin and Ganor, 19961, or act to suppress precipitation
[Rosenfeld et al., 20011. Dust is deposited into the ocean [Gao et al., 20011, and is related
to the biological productivity of a basin. Mineral dust in large quantities affects visibility,
and may have adverse influences on human health [Prospero et nl.. 19991, and upon
animal populations [Stallard, 200 11. Recent studies, mentioned by Sokolik et al. [200 13,
suggest that some change in dust production may be caused by anthropogenic activities
[Tegen et al., 1996; Tegen und Fung, 19951, though satellite data analysis indicates
dominance of sources in scarcely populated regions [Prospero et al., 20021.
A major source region for mineral dust is the combined Sahara and Sahel areas of North
Africa [Prospero, 1996; Moulin et al., 1997; Johansen et al., 20001. This source is active
nearly all year, with plumes flowing across the Atlantic towards the Caribbean and the
Americas, especially during the summer months [Prospero, 1996; Higurashi et al.,
20001. These plumes have been well documented by satellite sensors such as the Total
Ozone Mapping Spectrometer (TOMS) [Herman et al., 1997; Chiupello et al., 19991 and
the Advanced Very High Resolution Radiometer (AVHRR) [Husar et al., 1997;
Higurashi et al., 20001. Ground based in-situ instruments and sunphotometers have also
observed dust in the Caribbean, at sites such as Barbados [Prospero, 1996; Smirnov et al.,
2000bl.
3
For some dusty regions of the world, satellite observations have been linked to
sunphotometer data in the works of Higurashi et al. [2000] and Livinsgston et al. [2000]
(using AVHRR data), Tanre' et al. [2001] (using Thematic Mapper data.), and Moulin et
al. [ 19971 (using Meteosat data). Specifically, in the Caribbean, satellite retrievals have
been compared with in-situ measurements by works such as Husar et al. [ 19971 and
Chiupello et al. [ 19991. These studies have shown that satellite retrievals are a promising
method for identifying dust and retrieving its properties.
As part of the NASA's Earth Observing System (EOS), the Terra satellite was launched
in December 1999. Its flagship instrument, the MODerate resolution Imaging
Spectrometer (MODIS) [Salmonson et al., 1989; King et al., 19921 measures the ambient
aerosol column over oceans at seven wavelengths in the solar spectrum, with high
accuracy and high resolution over a variety of time scales. Aerosol algorithms for
MODIS over ocean [Tunre' et al., 19971 and over land [Kaufman et al., 19971 have been
validated under a variety of conditions [Remer et al., 2002; Chu et al., 20021, but no
evaluation has been made specifically for dust over the ocean.
Retrieving dust aerosol properties from satellite may prove to be particularly challenging,
mainly due to the non-spherical shape of dust particles. Microscopic analyses of dust '
particles show that they are irregular in shape rather than spherical [Koren et al., 20011.
However, the dust optical properties for MODIS, similarly to previous satellite missions,
are modeled by assuming that the particles are spherical [Tanre' et al., 19971.
Investigators such as Mischenko et al. [ 19971 showed that non-sphericity may have large
effects on the scattering optical properties of the aerosol, especially at large scattering
angles (greater than 120") that would be seen by MODIS.
An opportunity for dust validation arose with the Puerto RIco Dust Experiment (PRIDE)
[Reid, 2000; Reid et al, 20021. Held from June 26 to July 24,2000, PRIDE was operated
from Roosevelt Roads, Puerto Rico, and was designed to study the African dust aerosol
transported into Puerto Rico. For MODIS, PRIDE had the unique distinction of being the
4

first major field experiment to allow direct comparison of its aerosol retrievals to field
measurements.
In this study, we report on the evaluation of the MODIS aerosol retrievals from MODIS
during PRIDE, using sunphotometer and in-situ observations. In section 2, we outline the
theoretical and operational use of the MODIS aerosol over ocean algorithm. Section 3
describes each instrument used to validate the MODIS retrievals, and the data taken
during PRIDE. In section 4, we show the comparisons of MODIS and validation data,
and in section 5, we discuss how these comparisons should be used as a basis for new
science on dust aerosol.
2. MODIS Aerosol Retrieval
The MODerate Imaging Spectro-radiometer (MODIS) is the flagship instrument aboard
the Earth Observing System (EOS) satellites [Salmonson et al., 1989; King et al., 19921.
MODIS performs measurements at 36 channels in the solar and infrared regions (0.415 to
14.235 pm), with resolutions of 250 m, 500 m, or 1 km, depending on the wavelength.
At a nominal altitude of about 700 km, MODIS observes a swath about 2300 km wide.
The first MODIS instrument was launched with the Terra satellite in December, 1999,
which has a sun-synchronous orbit that passes southward over the equator at 10:30 AM
local (solar) time. Aboard Terra, MODIS provides nearly global coverage each day.
MODIS’S wide spectral range and fine spatial resolution, coupled with its broad swath
over the Earth’s surface, make it suitable for monitoring events on short term local time
and spatial scales, as well as for global and long term scales. Previous papers by
Kaufman et al. [ 19971 and Tanre‘ et al. [ 19971 discuss using MODIS to retrieve aerosol
properties over the land and ocean, respectively.
2.1. Theoretical Description of the Retrieval Algorithm
5

Tunre‘ et al. [ 19971 details the strategy for using MODIS to retrieve aerosol properties
over the ocean. Observed top of the atmosphere (TOA) reflectances at six wavelengths
(0.55,0.66,0.87, 1.24, 1.64 and 2.13 pm) are compared with a lookup-table of pre-
computed reflectance for an array of angles, size distributions and optical depths. The
modeled reflectance with the smallest difference from the observed reflectance is
retrieved from the look up table. This best fit reflectance is associated with a
corresponding set of aerosol properties, which are considered to be the retrieved products.
The reflectances in the lookup table are computed from aerosol models that represent the
aerosol properties of a vertical column. Currently, nine tropospheric aerosol models are
used, including four “fine” mode models (accumulation mode: dominated by chemical
and combustion processes) and five “coarse” mode models (dominated by maritime
particles and dust). The optical models are described in Tables l a and lb. The current
lookup tables were updated from those described by Tanre‘ et aZ. [ 19971, the main
difference being the use of new “dust-like” particle models (large modes 4 and 5). Their
scattering and absorption properties were derived from a combination of AERONET data
and LANDSAT Thematic Mapper (TM) image analysis [Tanre‘et al., 2001; Kaufman et
az., 20011.
For each model, the modeled satellite signal is assumed to be a combination of radiation
from the atmosphere and reflection from the surface. The atmospheric calculation
accounts for multiple scattering by molecules and the aerosol, as well as reflection of the
atmosphere by the sea surface. The ocean surface calculation includes three
contributions: the Fresnel (“sun glitter”) reflection off the surface waves, reflection by
whitecaps and foam and Lambertian reflectance coming from underwater scattering
(sediments, chlorophyll, etc). The surface wind speed (for sunglitter and foam
calculations) is assumed fixed at 6.0 m/s. Zero water leaving radiance is assumed at all
wavelengths, except for at 0.55 pm, where a reflectance of 0.005 is used.
Using the radiative transfer code developed by Ahmad and Fruser [ 19811, spectral
reflectances were computed for each of the nine aerosol models. Five values of aerosol
6

columnar optical depth, z,, (total aerosol loading) at 0.55 pm are considered for each
mode, ranging frGm a pure molecular (Rayleighj atmosphere (z, = 0.0) to a highly turbid
atmosphere = 2.0), with intermediate values of 0.2,0.5 and 1 .O. For each model and
aerosol optical depth at 0.55 pm, the associated optical depths are stored for the other five
wavelengths, plus an additional wavelength in the blue (at 0.47 pm). Computations are
performed for combinations of 9 solar zenith angles, 16 satellite zenith angles and 16
relative sun/satellite azimuth angles (2304 total combinations j.
To perform the aerosol retrieval, we use the method discussed by Tanre‘ et al. [1997].
The multiple scattering radiance from two lognormal modes (we assume one small, one
large) can be approximated by the weighted average of the two modes, calculated for the
same optical thickness [Gordon et al., 19971. Let us assume that the total reflectance
measured at a wavelength channel h, phm, (superscript “m” denotes “measured”) at the
satellite level is:
(1) I
Pr = w-4 + (1 - V ) P h 7
where pAs and p: are the reflectances of the small (s) and large (1) modes, respectively,
and q is the ratio of the reflectance contribution from the small mode to the combined
modes. These reflectances include the contributions from the surface and rayleigh
scattering.
Given one of the 20 combinations of small and large modes, we compute the expected
reflectance by interpolating to the exact sudsattellite geometry, for each of the aerosol
optical depths in the table. Starting at 0.87 pm, we derive the exact AOD for the
combination by comparing to the observed reflectance, and then using this to derive the
optical thickness at the other wavelengths. From the two modes, the small mode ratio, q,
is computed, which is the ratio of the optical depth contributed by the small mode to the
total optical depth.
q =‘cs/z (2)
7

If we denote the calculated reflectance at channel h by p;”’, (where sl represents the
combination of small and large modes) and the measured reflectance by phm, then the
relative error between the two, E:’, is given by:
where the constant 0.01 is a small residual used to prevent division by zero. The total
relative error for all wavelengths, E”, is given by:
where the relative error from the blue (0.47 pm) is not included in the calculation at this
time, due to potentially large uncertainties in oceanic pigment concentrations . Whichever
ratio q, of the combination of modes, sl, gives the smallest total relative error is
considered the “best” solution. For operational purposes, we often use the average for the
three combinations with the smallest error. Going back to the lookup tables, we retrieve
the number size distribution for each mode, and weight them to compute the effective
radius R,,of the particle population, defined as:
I I
where r is the radius.
2.2. Retrieval Algorithm in Operation
Proper preparation of the MODIS input is necessary for valid aerosol retrievals over
ocean. MODIS measures its 36 channels at three different resolutions. Using a geo-
location file, MODIS data are separated into land and ocean. For the ocean aerosol
retrieval, reflectance inputs include: two wavelengths (0.66 and 0.87 pm) at 250 meter
resolution, and five wavelengths (0.47,0.55, 1.24, 1.64 and 2.13 pm) at 500 meters.
These reflectances are separated into 10 km x 10 km boxes (Le. 20 x 20 pixel boxes for
the 500 m channels, and 40 x 40 pixel boxes for the 250 m channels). Using a
I
\
8
combiliation of reflectance thresholds and variability tests [Martins et ul., 20021, data are
quality screened and a cloud mask is produced.
Using the reflectance at 0.87 pm, we remove the brightest 25% and darkest 25% of the
remaining (non-screened) pixels in each 10 km x 10 km box. in order to minimize
contamination arising from inhomogeneous surfaces and subpixel cloud and cloud
shadow features. Averages and standard deviations of the remaining pixels are stored.
Before doing the actual aerosol retrieval, we perform a number of tests on the reflectance
data; for example, ensuring that all reflectance values are at least the minimum rayleigh
value. Additionally, we check the glint angle, defined as:
= cos -‘((cose,cose,)-(sine,sine,cos~)), (6)
where e,, e,, and $ are the solar zenith, the satellite zenith and the relative azimuth angles
(between the sun and satellite), respectively. To avoid glint contamination, we do not
retrieve aerosol properties on boxes within 40 degrees of the specular reflection angle.
Rerner et al. [2002] has shown that, as compared with oceanic AERONET sunphotonieter
data, the ocean algorithm gives optical depth zccuracy of AT = :.. 0.032 f 0.05. For the
effective radius, the accuracy was calculated to be d . 1 0 pm. However, all of their..
validation points were of non-dust aerosol.
2.3. PRIDE Data
Table 2 lists the date and time of each MODIS overpass over Roosevelt Roads. Puerto
Rico during PRIDE. Included are data for the solar and satellite zenith angles and the
relative azimuth angle between the two (all measured from the surface). The next
columns define the path scattering angle, and the computed glint angle (from equation 6) .
The last column denotes whether Roosevelt Roads is within the defined glint masked
region (40 degrees from the specular angle). Note that MODIS does not operationally
retrieve aerosol properties over the ocean for “Glint” overpasses.
9
Some of the higher optical depth conditions during PRIDE occurred on July 21,2000
(Julian day 203), when the optical depth at 0.55pm was about 0.5. Figure 1 shows the
MODIS “true-color” image, produced by combining reflectance data from the MODIS
red, green and blue channels (0.66,0.55 and 0.47 pm). In the image, Puerto Rico (at
I SON, 66”W) is located about one-third of the way between the left and right sides,
approximately centered vertically. Notice the visible glint centered near the top of the
image. I
Figure 2 is the corresponding MODIS aerosol retrieval at 0.55 pm for the image in Figure
1, combined for land and ocean. The potential “glint” region (40 degrees) is masked out
in gray, along with areas removed by the cloud mask. This 40” glint mask is purposely
conservative, and encompasses a much larger area than the area anticipated by the visible
glint in Fig 1. Also, some of the glint may not be visible in Fig L because it is obscured
by heavy dust. At the time this data was acquired, the main pulse of the high optical
depth was near or slightly west of Puerto Rico. To the east of the “glint” mask, we see
evidence of the moderate dust plume that hit Puerto Rico a €ew days iater.
I
I
3. Validation Data Sets
For validating MODIS data, we employed data from multiple platforms. For direct
comparison of optical depth, we used three different types of sunphotometers. For
analysis of MODIS size distribution retrievals, we used both AEP-ONET sunphotometer
almucantars and ground-based in-situ retrievals. As a schematic illustration, figure 3
shows where instruments were deployed in relation to the MODIS satellite track on 4
July.
3.1. Sunphotometer data
10

For the validation of MODIS optical depth, we use data collected from three types of
sunphotometer instruments. Two automatic sunphotometers were provided by the
AERONET program [Holben et al., 19981 for the duration of PRIDE. Two
MICROTOPS I1 handheld sunphotometers [Morys et al., 200 11 were deployed at various
times and locations, including during ship cruises. Finally, the 6 channel Ames Airborne
Tracking Sunphotometer (AATS-6) [Matsurnoto et al., 19871 was flown aboard the
Navajo aircraft on numerous flights [Livingston et al., this issue]. On different days,
measurements from some or all of the sunphotometers coincided with MODIS overpass.
Spectral ranges are 0.44 -_ 1.02pm for AERONET, 0.34 - 0.87p.m for MICROTOPS and
0.38 - 1.02p.m for the AATS-6.
3.1.1. AERONET SudSky -photometers
The AERONET network is a global network of sunhky autonomous radiometers.
Description of the instruments and data acquisition is given by Holben et al. [ 19981. In
“sun” mode, the instrument automaticaliy tracks the sun, retrieving optical depth from
measurements of solar extinction. In “sky” mode, the instrument measures radiance in
the sun’s almucantar (same zenith angle, varying azimuth), which are later used to
retrieve aerosol size distribution and other parameters.
Two such instruments were deployed for the duration of the PRIDE experiment, one
along the east coast of Puerto Rico at Roosevelt Roads (Latitude = 18.20“N, Longitude =
65.60”W) the other along the south coast in La Paguera (Latitude = 17.97”N, Longitude =
67.05”W). These instruments (especially Roosevelt Roads) were expected to measure
dust directly transported over the ocean, with little contamination from other sources.
During PRIDE, both instruments performed sky and sun measurements in at least four
spectral bands, 0.44p.m, 0.67p.m, 0.87pm and 1.02pm, from which the aerosol optical
depth and the aerosol size distribution were derived. Direct optical depth measurements
were taken approximately every 15 minutes, while sky radiance data were observed every
hoar. Figure 4 presents a time series of PRIDE optical depth at both Roosevelt Roads
11

and La Paguera. Optical depth calibration coefficients are based on inter-comparison with
a reference instrument (usually one calibrated at the pristine mountain top of Mauna Loa,
in Hilo, Hawaii), whereas radiance measurements are calibrated using an integrating
sphere at NASA-Goddard Space Flight Center. Expected error is less than 0.01 for the
optical depth, and less than 5% for the sky radiance [Holben et al., 19981.
Direct optical depth measurements used in this study, have been quality checked and
cloud screened using the method of Smirnov et al. [2000a]. Quality controlled radiance
measurements were turned into retrievals of aerosol size distribution by the method of
Dubovik and King [2000]. The third column of Table 3 lists almucantars taken within two
hours of MODIS overpass (later used for size distribution analysis).
3.1.2. Handheld Sunpho tome ters
Two handheld sunphotometers (MICROTOPS 11) were deployed for PRIDE. These
instruments, manufactured by Solar Light Co, Inc (Philadelphia, PA USA), weigh less
than a kilogram and measure 10 x 20 x 4.3 cni [fi4orys et aZ., 20011. Both of our
instruments were identical, intended to measure AOD at four channels (0.340,0.440, .
0.675 and 0.870 pm) and the precipitable water column using 0.936 pm.
Calibration for these instruments was done from inter-comparison with a reference
sunphotometer [Ichoku, et al., 2002bl. Usually this instrument was a reference
AERONET instrument located at Goddard Space Flight Center (regularly calibrated by
performing Langley plot analyses atop the pristine Mauna Loa Observatory in Hilo,
Hawaii). Calibration error for MICROTOPS optical depth is no more than 0.02 [Zchoku,
et al., 2002bl.
Tests show that two main sources of error are improper pointing at the sun, and improper
cloud screening decisions [Zchoku et al., 2002bl. In practice, users of these MICROTOPS
I1 sunphotometers undergo proper orientation before use, in order to minimize these
12

human errors. Even so, we require three or more scans in quick succession, per
observation, and retain only those triplets that are sufficiently constant in value.
These instruments are highly portable and can be deployed at locations where the
logistics of installing other types of sunphotometers may be impossible. During one three
day period, intensive observations were taken aboard the University of Puerto Rico’s RV
Chapman, at various ocean locations east of Puerto Rico. We learned that taking
mcasurements aboard a rolling ship causes unique problems for sun-pointing, but we
believe that taking multiple scans per observation enabled quality control. The fourth
column in Table 3 lists the dates and location of calibrated MICROTOPS measurements,
corresponding to MODIS overpass. Observations labeled “Roosy Roads” were taken at
several locations, but always within a few kilometers of the AERONET sunphotometer at
Roosevelt Roads.
3.1.3. Ames Airborne Tracking Sunphotometer
The Ames Airborne auto-Tracking Sunphotometer automatically tracks the sun and
measures the transmitted the solar beam, retrieving the overlying columnar optical depth
[Russell et al., 1993; Matsumoto et al., 19871. During PRIDE, the 6-channel version was
mounted in the Navajo aircraft and was set to observe AOD and column water vapor. It
measured direct solar beam transmission in six spectral channels (380.1,450.9,525.7,
864.5,941.9, and 1021.3 nm, with filter bandwidths of 5.0-5.8 nni) [Livingston et al., this
issue]. Data were digitized and recorded every 3 seconds.
The AATS-6 was calibrated before and after PRIDE, by taking it to the pristine
conditions of the Mauna Loa Observatory (in Hilo, HI), and performing Langley plot
analyses [Russell et al., 19931. AATS-6 data quality during PRIDE are discussed in
Livingston et al., [this issue].
During PRIDE, the Navajo flight paths were designed in part so that the AATS-6 could
measure the vertical distribution of AOD. However, most flights included a level track
13

within 100 meters of the ocean surface, between 5 minutes before and 5 minutes after
MODIS overpass. By assuming that only a small fraction of the total optical depth was
located below the aircraft, we used the statistics from the AATS-6 during over-pass time
to compare with MODIS data. The fifth column of Table 3 lists the AATS-6 flights
during PRIDE, where the latitude and longitude values are the midpoint of the near-
surface flight track.
3.2. In-situ Measurements
During PRIDE, ground based aerosol sampling and in-situ optical measurements were
made at Roosevelt Roads. The instrumentation and setup were similar to that described
by Muring et ul., [2000], however here we will only describe them briefly.
A sample intake pipe brought air from the roof of the trailer laboratory down to an
iiistrument table. Just above the table, the pipe made a 90 degree bend and ran
horizontally to provide sample air to the instruments. At certain points, snialler tubes
were connected such that the origiiial air ?ample was teed off to different instruments.
This intake quantitatively samples aerosols (less than 10% error) for up to IO pm
diametei (5 pm radius - hereafter, we will denote size in terms ofradius), but has up to . .
50% error for larger particles. The lowest meter of the tube includes an inline heater to
control the relative humidity of the sample. The total flow rate in the intake was set to 90
L, min-', which provided a laminar flow such that diffcsional losses for 3 nm particles
were less than 4%.
Aerosol number size distributions were measured with a series of instruments. A TST@
Aerodynamic Particle Siz-er (APS) Model ApS33 measured large aerosols from 0.4 to
>7.5 pm aerodynamic radius with a resolution of 32 channels per half decade. Smaller
particles (0.075 to 0.425 pm) were measured by a TSI@ Scanning Mobility Particle Sizer
(SMPS) Model 3934L. Corrections to the aerosol size distributions, for aerodynamic and
diffusional loss, are discussed in Muring et al., [2000]. The combined information from
these instruments give aerosol number size distribution in 150 radius bins ranging from
about 0.007 pm to 7 pm, during a twenty minute measurement. From the size
14

distribution, we can calculate a particle effective radius (equation 5) in order to compare
to MODIS.
Aerosol light scattering measurements were performed using a TSI@ integrating
Nephelometer Model 3563 [Anderson et al., 19961. The instrument measures total and
backscattering by aerosols at 0.45,0.55 and 0.70 pm. Data were corrected for angular
non-idealities according to Anderson and Ogren [ 19961. Data were recorded as five
minute averages during the period 2 July to 24 July.
Nearly continuous measurements by both sets of instruments were made during PRIDE.
The data we use from the Particle Sizers were rrom the twenty minute measurements
taken between *I hour of MODIS overpass, daily for the period 3 July to 14 July and 16
July to 18 July (there were instrument problems on 15 July and after 18 July). The
nephelometer data used also correspond to the same overpass time windows (but
including 15 July and 18-24 July).
4. Validation of MODIS Retrievals
By deploying multiple instruments at different locations, we had a better chance of
catching a comparison to MODIS. Also, more comprehensive studies of aerosol
prgperties could be performed. Because data from each validating instrument were taken
at different frequencies, slightly different approaches are used to compare MODI§ with
each data set.
'To compare MODIS optical depth with ground sunphotometer data, we use the spatio-
temporal approach outlined in Zchoku et al., [2002a], where the main assumption is that
spatial statistics from satellite retrievals can be compared to temporal statistics from point
observations. According to in-situ data taken at Roosevelt Roads, the average wind
speed within *I hour of satellite overpass was similar to the 6.0 m/s used in the lookup
tables (average = 5.98 d s , standard deviation = 0.82 d s ) . If we assume that the parcel
can travel in any direction, aerosol can travel up to 22 km in any direction within an hour.
15

For easier computations, we chose a 50 km by 50 km grid as our MODIS validation box.
That is, each validation box is composed of five 10 km x 10 km MODIS aerosol retrieval
pixels in each direction (25 total).
For the sunphotometer direct sun measurement data. we counted all valid observations
within +.30 minutes of MODIS overpass. For both MODIS and ground-based
measurements, we computed statistics for comparable quantities. Acceptable
comparisons were defined when aerosol was retrieved in at least 20% of the pixels (i.e.
five lOkm x lOkm pixels out of a possible 25) and at least two valid sunphotometer
retrievals (out of a possible four or five for AERONET, and more for other types).
When comparing size distribution retrievals, we were less stringent. Because only one
almucantar was performed per hom, we could not usually expect to get two almucantars
within the one hour period. Therefore, we rdaxed to allow a single valid AERONET
retrieval within a two hour period (+1 hox of o1;erpass). For comparisons with in situ
scattering and aerosol size parameters, we also used awiages taken about + i hour of
MODIS overpass. However, -M still used the SO k m x 50 km box for MODIS.
4.1. Aerosol Optical Depth
Total aerosol column optical depth at a particular wavelength, T ~ , is the quantity most
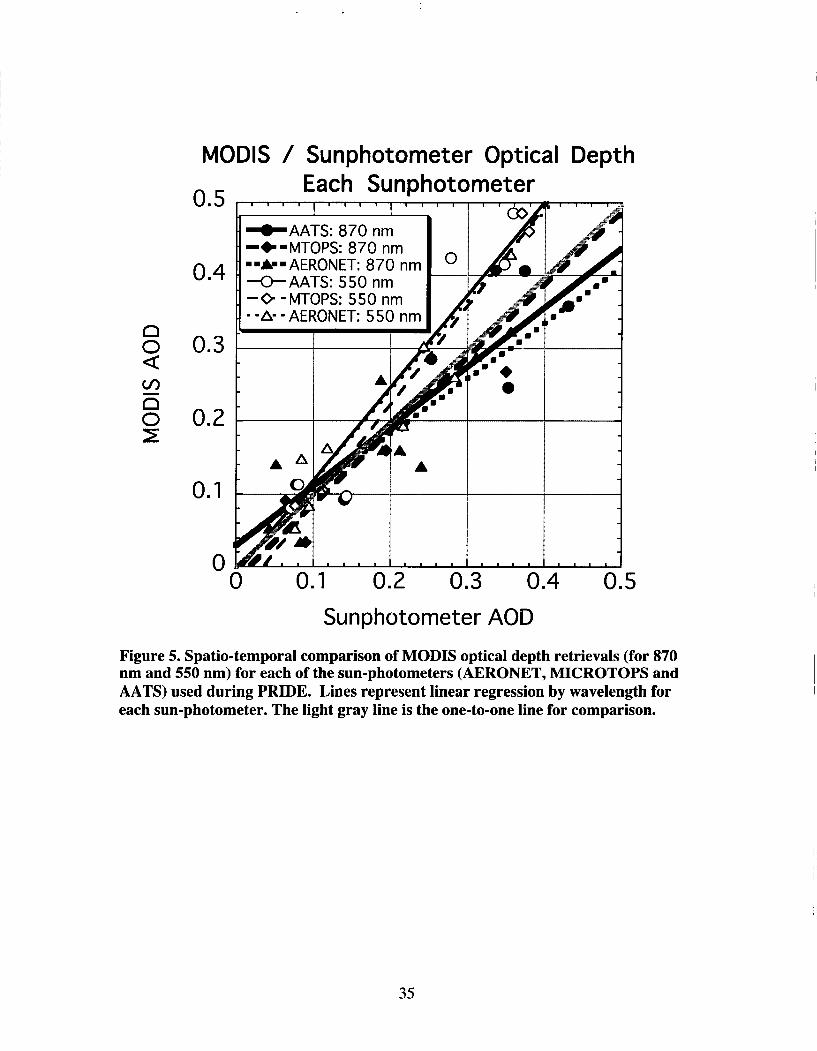
easily “validated.” Figure 5 shows optical depth of MODIS compared to sunphotometer
for two wavelengths (0.87 and 0.55 pm), separated by sunphotometer type (AERONET,
MICROTOPS and AATS). Only at the 0.87 pm channel, can MODIS be directly
compared with all three sunphotometers. At 0.55 pm, linear interpolation in loghog
space was performed (between 0.50 and 0.67 pm for AERONET, between 0.440 and
0.675 pm for Microtops and between 0.525 and 0.864 pm for the AATS). The lines are
linear regression fits. We see that, for a given wavelength, there are no systematic
differences between fits for different sunphotometers, implying that all sunphotometer
data can be grouped together.
16
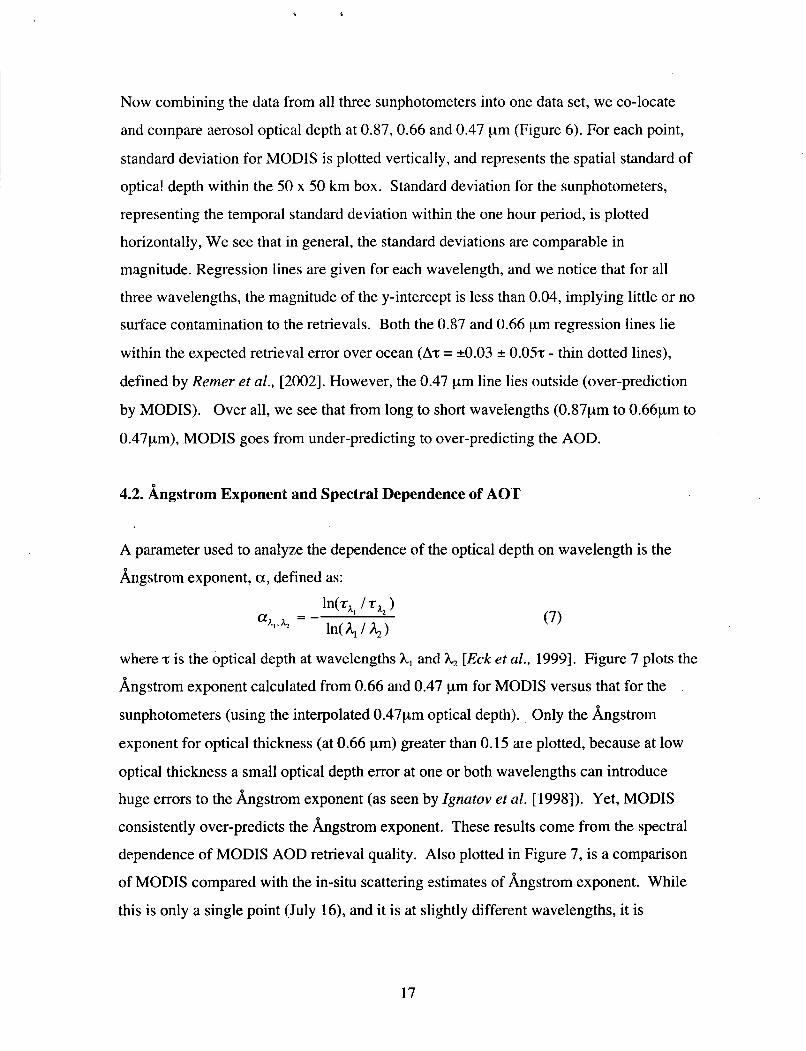
Now combining the data from all three sunphotometers into one data set, we co-locate
and compare aerosol optical depth at 0.87,0.66 and 0.47 pm (Figure 6). For each point,
standard deviation for MODIS is plotted vertically, and represents the spatial standard of
optical depth within the 50 x 50 km box. Standard deviation for the sunphotometers,
representing the temporal standard deviation within the one hour period, is plotted
horizontally, We see that in general, the standard deviations are comparable in
magnitude. Regression lines are given for each wavelength, and we notice that for all
three wavelengths, the magnitude of the y-intercept is less than 0.04, implying little or no
surface contamination to the retrievals. Both the 0.87 and 0.66 pm regression lines lie
within the expected retrieval error over ocean (AT = 20.03 2 0 . 0 5 ~ - thin dotted lines),
defined by Remer et al., [2002]. However, the 0.47 pm line lies outside (over-prediction
by MODIS). Over all, we see that from long to short wavelengths (0.87ym to 0.66pm to
0.47pm), MODIS goes from under-predicting to over-predicting the AOD.
4.2. Angstrom Exponent and Spectral Dependence of AOI'
A parameter used to analyze the dependence of the optical depth on wavelength is the
Angstrom exponent, a, defined as:
where z is the optical depth at wavelengths h, and h, [Eck et al., 19931. Figure 7 plots the
Angstrom exponent calculated from 0.66 aiid 0.47 pm for MODIS versus that for the
sunphotometers (using the interpolated 0.47pm optical depth). Only the Angstrom
exponent for optical thickness (at 0.66 pm) greater than 0.15 are plotted, because at low
optical thickness a small optical depth error at one or both wavelengths can introduce
huge errors to the Angstrom exponent (as seen by Zgnatov et al. [1998]). Yet, MODIS
consistently over-predicts the Angstrom exponent. These results come from the spectral
dependence of MODIS AOD retrieval quality. Also plotted in Figure 7, is a comparison
of MODIS compared with the in-situ scattering estimates of Angstrom exponent. While
this is only a single point (July 16), and it is at slightly different wavelengths, it is
17

consistent compared to the sunphotometer retrievals. All MODIS Angstrom exponents
lie bbove the one to one line.
Another way of looking at the spectral dependence of AOD, is to compare MODIS
optical depth retrieval to sun photometer retrieval, plotted in wavelength space. Figure 8
shows the spectral dependence of each retrieval for cases with z,,, greater than 0.15. For
the same color curves, the solid curve connects the sunphotometer data, while the dotted
curve connects MODIS AOD. On two dates, coincident sunphotometer measurements
were made during MODIS overpass. On July 16, Roosevelt Roads (AERONET) and
Roosey Roads (MICROTOPS) were operated next to each other, and observed nearly
identical spectral optical thickness (red curves). On July 4, the AATS flew directly above
the ship borne MICROTOPS, and observed similar optical depths in the red and near TR
wavelengths, but varied somewhat at other wavelengths (dark green curves). For each of
these pairs, there is only a single MODIS retrieval. The sunphotometer curves display
very little slope in contrast to the MODIS retrievals.
.
4.3, Aerosol Size Parameters
The Angstrom exponent, a measure of the spectral dependence of aerosol optical depth, is
related to the size distribution of the measured particles. Small Angstrom exponent
values are associated with large particles in accordance with Mie scattering theory. The
fact that MODIS over-predicts the wavelength dependence of optical depth, means that it
probably under-predicts the size distribution. Figure 9 displays a comparison of the
AERONET and MODIS effective radii (dots) calculated from Equation 5. Each point
represents a successful sky radiance inversion from within two hours of MODIS
overpass. When there were two retrievals (one before overpass, one after), they are
marked with “A” and “B.” Note that there are fewer points than for direct optical depth
comparisons, because of strict almucantar selection, and that size distribution retrievals
are only possible from AERONET data. The actual optical depth (magnitude is
represented by the “error bar” lines attached to each point) shows little influence upon the
18

.
quality of the retrieval. During PRIDE, all values of effective radius from MODIS are
far iower than corresponding values from AERONET.
As for the in-situ measurements of size at the surface, there are only two measurements
that were coincident with MODIS overpass: 7 July and 16 July. Included on Figure 9 are
the effective radii computed from the in situ size distribution (squares). Because surface
dust measurements are related to total column measurements in the Caribbean [Smirnov
et al., 2001a1, we can plot the in situ measurements on the same graph with the total
column measurements. Like AERONET effective radius, they are larger than MODIS,
though somewhat closer.
4.4. Errors of Validation
Deeper analysis of the MODIS retrieval errors yields interesting relationships. We can
summarize the previous plots by stating that the quality of optical depth retrieval is a
function of wavelength, and that the spectral error gives rise (through Mie theory) to
under-prediction of the particles’ size. Let us define an optical thickness error that is the
departure from the expected errors (AT = d.03 2 0.0%) defined by Remer et al. [2002].
’Thus, we are defining a measure that works for all values of optical depth, encompassing
both the absolute errer, absolute
‘error = (‘MODIS - ‘sp 1
- (‘MODIS - Z’SP 1 / ‘SP,
and the relative error, relat,ile -
‘error
This “expectation error” can be defined as:
expeLt - - (‘MODIS - ‘sp 1 (0.03 + 0.05 zsp ) ’ Tenor
where zsp is from a sunphotometer direct sun measurement. By defining this measure of
the error, we can define a “large” expectation error when the magnitude is greater than
unity, meaning that the actual error exceeded the expected uncertainty. For the effective
radius, as we do not yet have an expectation of the error, so we will define the effective
radius error simply as the relative error, that is:
19
(9) relative -
Reffernor - (ReffMoDJs - ReffAERONm ReffAERONET 9
where ReffAERoNET is retrieved from AERONET almucantar sky measurements [Dubovik
and King, 20001. For each wavelength, these quantities are plotted in Figure 10. This
figure clearly illustrates what we learned from the spectral analysis. At 0.66 ym, there is
almost no relationship between z,,,, and Reffernor . The greater the over-estimation of
the optical depth at 0.47 pm and under-estimation of the optical depth at 0.87 pm, the
expect relative
more severe the under-estimation of the effective radius is when compared to AERONET
inversions. Even when all wavelengths of AOD retrieval fall within expectations, we still
may have errors in effective radius. This is in contrast to the non-dust findings by Remer
et al. [2002] that MODIS effective radii differed from AERONET values by only 2 0.1
ym. These wavelength dependence and effective radius retrieval problems seem Lo be
unique to the dusty conditions during PRIDE.
5. Discussion and Further study
For PRIDE, we have compared MODIS aerosol retrievals nver ocean with optical depth
and aerosol size retrievals from sunphotometers. Regression lines of MODIS retrievals
of optical depth (compared with sunphotometers) fall inostly within published estimates
[Remer et al., 20021 at both 0.87 and 0.66 ym, but with 0.87 pm retrieved low and 0.66
retrieved high. At 0.47 pm, MODIS significantly over-estimates the optical depth. These
spectral discrepancies help to illustrate why MODIS retrieves small mode particles in
dust regions, where we believe large particles dominate. These discrepancies were fully
anticipated because of the necessity of assuming particle sphericity in the original
MODIS algorithms.
According to Dubovik et al. [2000], non-sphericity of dust particles can cause retrieval of
a “spurious” small mode in the AERONET retrievals, especially when using radiance
from scattering angles greater than 40 degrees. The actual dust phase function better
resembles phase functions of smaller spherical particles than phase functions from
spherical particles having dust size [Mischenko et al., 19971. Figure 11 shows the size
distributions retrieved from AERONET, for almucantars measured within two hours of
20

MODIS overpass. Nearly all of these AERONET retrievals show a mode centered
around 0.1 pm, which is believed to be non-physical [Dubovik et al., 20001. This brings
up an interesting observation. That is, if AERONET has a spurious small mode, then the
effective radius computed from AERONET is already too small, implying that the
effective radii calculated from MODIS are actually worse. The in situ size measurements
also suggest that MODIS retrievals may be far too small. The two squares plotted in
Figure 9 are reasonably close to the one-to-one line. However, literature [Muring et al.,
20001 tells us that the Particle Sizers may under-sample the large particles (up to 50% for
10 ym particles) so that in reality, the in situ effective radius would be larger. It is
interesting to note that all three types of measurements seem to under-estimate particle
size.
According to Mischenko et al. [ 19971, large scattering angles magnify optical differences
between spheres and non-spheres. Therefore, for MODIS data, where scattering angles
are all very large, we might expect to see some dependence of the retrieval upon
scattenng angle. Figure 12 shows errors of the spectral optical depth and reflectance
fitting, against scattering angle (for z6M) > 0.15). Because the optical depth is large
enough, we use the relative optical depth error, defined as
(xmm - TAERONET Y TAERONET~
and the reflectance fitting error defined by Equation (4) in Section 2. The curves are fits
to the data using second order polynomials. For all four wavelengths, the optical depth
error is nearly constant up to a scattering angle of about 130 degrees. Then MODIS tends
toward under-estimation of optical depth (especially at 0.8’7 pm) as the scattering angle
increases. We also see that as the scattering angle increases, MODIS has more difficulty
fitting the modeled reflectance to the observed reflectance. These trends, as functions of
scattering angle, suggest problems with our aerosol model for dust-like aerosols.
Problems could include our assumptions of size distribution and/or our assumptions
about refractive indices. However, given the AERONET experience, errors are most
likely due to assumptions of spherical particles, and the use of Mie theory in construction
of the MODIS lookup tables.
21

PRIDE was our first opportunity to evaluate the performance of MODIS in dust settings.
The PRIDE results tell us that the anticipated errors introduced by non-sphercity do not
appear to significantly degrade our optical depth retrievals at 0.87 and 0.66 pm.
However, non-sphericity does appear to affect optical thickness retrievals at other
channels and causes severe under-prediction of the dust particle size. These problems
can be corrected. Over time, the growing data base of co-located MODIS retrievals and
sunphotometer measurements (in dust environments), will provide us with sufficient data
to measure the phase function of the ambient, column integrated, non-spherical dust at
MODIS observation angles. We plan to derive empirically corrected phase functions and
to introduce these into the MODIS lookup tables. These new lookup tables should
improve the ability of MODIS to observe and monitor dust aerosol.
Acknowledgments. We would like to thank SSAI’s Richard Kleidman for installation
and maintenance of the two AERONET sunphotometers, and for collection of some of
the MICROTOPS data. We are grateful towards others whom have collected
MICROTOPS data, including: Roy Arnistrong and Julio Morel from the University of
Puerto Rico, Rick Hansel from the University of California, Los Angeles and Joe
Prospero from the University of Miami. Finally, we appreciate the crew of the R N
Chapman for their assistance and accommodation.
References
Ahmad, Z., and R.S. Fraser, An Iterative Radiative Transfer Code For Ocean- Atmosphere Systems, Journal of the Atmospheric Sciences, 39,656-665, 198 1.
Alpert, P., Y.J. Kaufman, Y. Shay-El, D. TanrC, A. da Silva, S . Schubert, and J.H. Joseph, Quantification of dust-forced heating of the lower troposphere, Nature, 395 (6700), 367-370, 1998.
Anderson, T.L. et al., Performance characteristics of a high sensitivity, three-wavelength, total scatterbackscatter nephelometer, J . Atmos. Oceanic. Technol., 13,967-986, 1996.
Anderson, T.L. and J.A. Ogren, Determining aerosol radiative properties using the TSI 3563 integrating nephelometer, Aerosol Sci. Tecnol., 29,57-69, 1998.
22

Chiapello, I., J.M. Prospero, J.R. Herman, and N.C. Hsu, Detection of mineral dust over the North Atlantic Ocean and Africa with the Nimbus 7 TOMS, Journal of Geophysical Research-Atmospheres, 104 (D8), 9277-929 1, 1999.
Dickerson, R.R., S . Kondragunta, G. Stenchikov, K.L. Civerolo, B.G. Doddridge, and B.N. Holben, The impact of aerosol on solar ultraviolet radiation and photochemical smog, Science, 278,827-830, 1997.
Dubovik, O., and M.D. King, A flexible inversion algorithm for retrieval of aerosol optical properties from Sun and sky radiance measurements, Journal of Geophysical Research-Atmospheres, 105 (D 16), 20673-20696,2000.
Dubovik, O., A. Smirnov, B.N. Holben, M.D. King, Y.J. Kaufman, T.F. Eck and I. Slutsker, Accuracy assessments of aerosol optical properties retrieved from Aerosol Robotic Network (AERONET) sun and sky radiance measurements , Journal of Geophysical Research-Atmospheres, 105 (D8), 979 1-9806,2000.
Eck, T.F., B.N. Holben, J.S. Reid, 0. Dubovik, A. Smirnov, N.T. O'Neill, I. Slutsker, and S. Kinne, Wavelength dependence of the optical depth of biomass burning, urban, and desert dust aerosols, Journal of Geophysical Research-Atmospheres, 104 (D24), 3 1333- 31349,1999.
Formenti, P., M.O. Andreae, L. Lange, G . Roberts, J. Cafmeyer, I. Rajta, W. Maenhaut, B.N. Holben, P. Artaxo, and J. Lelieveld, Saharan dust in Brazil and Suriname during the Large-Scale Biosphere- Atmosphere Experiment in Amazonia (LBA) - Cooperative LBA Regional Experiment (CL,AIRE) in March 1998, Journal of Geophysical Research- Atmospheres, 106 (D14), 14919-14934,2001.
Gao, Y., Y.J. Kaufman, D. Tanrk, D. Kolber, and P.G. Falkowski, Seasonal distributions of aeolian iron fluxes to the global ocean, Geophysical Research Letters, 28 (l), 29-32, 2001.
Ginoux, P., M. Chin, I. Tegen, J.M. Prospero, B. Holben, 0. Dubovik, and S.J. Lin, Sources and distributions of dust aerosols simulated with the GOCART model, Journal of Geophysical Research-Atmospheres, 106 (D17), 20255-20273,2001.
Gordon, H.R., Atmospheric correction of ocean color imagery in the Earth Observing System era, Journal of Geophysical Research-Atmospheres, 102 (D14), 1708 1 - 17 106, 1997.
Herman, J.R., P.K. Bhartia, O.Torres, C. Hsu, C. Seftor, and E. Celarier, Global distribution of UV-absorbing aerosols from Nimbus 7/TOMS data, Journal of Geophysical Research-Atmospheres, 102 (P14), 1691 1-16992, 1997.
23
Higurashi, A., T. Nakajima, B.N. Holben, A. Smirnov, R. Frouin, and B. Chatenet, A study of global aerosol optical climatology with two-channel AVHRR remote sensing, Journal ofClimate, 13 (12), 201 1-2027,2000.
Holben, B.N., T.F. Eck, I. Slutsker, D. TanrC, J.P. Buis, A. Setzer, E. Vermote, J.A. Reagan, Y.J. Kaufman, T. Nakajima, F. Lavenu, I. Jankowiak, and A. Smirnov, AERONET - A federated instrument network and data archive for aerosol characterization, Remote Sensing ofEnvironment, 66 (l), 1- 16, 1998.
Husar, R.B., J.M. Prospero, L.L. Stowe, Characterization of tropospheric aerosols over the oceans with the NOAA advanced very high resolution radiometer optical thickness product, Journal of Geophysical Research-Atmospheres, 102 (D14), 16889- 16909, 1997.
Ichoku C., D. A. Chu, S. Mattoo, Y.J. Kaufman, L.A. Rerner, D. T a d , I. Slutsker, B.N. Holben, A spatio-temporal approach for global validation and analysis of MODIS aerosol products, Geophysical Research Letter. in press, 2002a.
Ichoku, C., R. Levy, Y. Kaufman, L. Remer, R-R. Li, V.J. Martins, R.N. Holben, N. Abuhassan. I. Slutsker, T.F. Eck, C. Pietras, Analysis of the performance characteristics of the five-channel MICROTOPS I1 sun photometer for measuring Aerosol Optical Thickness and Precipitable Water Vapor, Journal of Gcophysical Research-Atmospheres, in press, 2002b.
ignatov, A., L. Stowe and R. Singh, Sensitivity study of the h g s k o m exponent derived fl-om AVHRR over oceans. Adv. Space Res.,21,439-442, 1998.
Johanseii, A.M., R.L. Siefert, and n/l .R. Hoffmann, Chemical composition of aerosols collected over the tropical North Atlantic Ocean, Journal of Geophysical Research- Atmospheres, 105 (D12), 15277-15312,2000.
Kaufman, Y.J., D. TanrC, 0. Dubovik, A. Karnieli, L.A. Remer, Absorption of sunlight by dust as inferred from satellite and ground-based remote sensing, Geophysical Research Letters, 28 (8), 1479-1482,2001.
Kaufman, Y.J., D. Tanrt, L.A. Remer, E.F. Vermote, A. Chu, and B.N. Holben, Operational remote sensing of tropospheric aerosol over land from EOS moderate resolution imaging spectroradiometer, Journal of Geophysical Research-Atmospheres, 102 (D14), 17051-17067,1997.
King, M.D., Y.J. Kaufman, W.P. Menzel, and D. TanrC, Remote-Sensing of Cloud, Aerosol, and Water-Vapor Properties From the Moderate Resolution Imaging Spectrometer (Modis), Ieee Transactions On Geoscience and Remote Sensing, 30 (l), 2- 27, 1992.
24

Koren, I., E. Ganor, and J.H. Joseph, On the relation between size and shape of desert dust aerosol. Journal of Geophysical Research-Atmospheres, I06 (Dl 6), 18047- 18054, 200 1.
Levin, Z. and E. Ganor, The effects of desert particles on cloud and rain formation in the eastern Mediterranean, in The Impact of Desert Dust Across the Mediterranean, edited by S. Guerzoni and R. Chester, pp. 77-86, Kluwer Acad., Dordrecht, The Netherlands, 1996.
Li-Jones, X., and J.M. Prospero, Variations in the size distribution of non-sea-salt sulfate aerosol in the marine boundary layer at Barbados: Impact of African dust, Journal of Geophysical Research-Atmospheres, 103 (D 13), 16073- 16084, 1998.
Livingston, J.M., V.N. Kapustin, B. Schmid, P.B. Russell, P.K. Quinn, T.S. Bates, P.A. Durkee, P.J. Smith, V. Freudenthaler, M. Wiegner, D.S. Covert, 5. Gasso, D. Hegg, D.R. Collins, R.C. Flagan, J.H. Seinfeld, V. Vitale, and C . Tomasi, Shipboard sunphotometer measurements of aerosol optical depth spectra and columnar water vapor during ACE-2, and comparison with selected land, ship, aircraft, and satellite measurements, Tellus Series B-Chemical and Physical Meteorology, 52 (2), 594-619,2000.
Livingston, J. M., J. Redemann, J. S . Reid, P. B. Russell, B. Schmid, D. Allen, 0. Torres, R. C. Levy, L. A. Remer, E. J. Welton, B. N. Holben, S. A. Christopher, and J. Wang, . Airborne sunphotometer measurements of aerosol optical depth and columnar water '
vapor during t.he Puerto Rico Dust Experiment, and comparison with ;and, aircraft, and satellite measurements, J . Geophys. Res., this issue.
Maring, H., D.L. Savoie, M.A. Izaguirre, C. McCormick, R. Arimoto, J.M. Prospero, and C. Pilinis, Aerosol physical and optical properties and their relationship to aerosol composition in the free troposphere at Izana, Tenerife, Canary Islands, during July 1995, Journal of Geophysical Research-Atmospheres, 105 (D1 l), 14677- 14700,2000.
Martins, J.V., D. Tanre, L. Remer, Y. Kaufman, S. Mattoo, R. Levy, MODIS cloud screening for remote sensing of aerosol over oceans using spatial variability, Geophys Res Lett., in press, 2002.
Matsumoto, T., P. B. Russell, C. Mina, and W. Van Ark, Airborne tracking sunphotometer, J. Atmos. Oceanic Technol., 4,336-339, 1987.
Miller, R.L., and I. Tegen, Climate response to soil dust aerosols, Journal of Climate, I 1 (12), 3247-3267, 1998.
Mishchenko, M.I., and L.D. Travis, Satellite retrieval of aerosol properties over the ocean using measurements of reflected sunlight: Effect of instrumental errors and aerosol absorption, Journal of Geophysical Research-Atmospheres, 102 (D 12), 13543- 13553, 1997.
25

Morys, M., F.M Mims 111, S. Hagerup, S.E. Anderson, A. Baker, J. Kia, T. Walkup, Design, calibration and performance of MICROTOPS I1 handheld ozone monitor and Sun photometer, Geophysical Research-Atmospheres, 106(D 13), 14573- 14582,200 1.
Moulin C., F. Guillard, F. Dulac, and C.E. Lambert, Long-term daily monitoring of Saharan dust load over ocean using Meteosat ISCCP-B2 data 2. Accuracy of the method and validation using Sun photometer measurements, Journal of Geophysical Research- Atmospheres, 102 (D14), 16959-16969, 1997.
Prospero, J.M., Saharan dust transport over the North Atlantic Ocean and Mediterranean: And overview, in The Impact of Desert Dust Across the Mediterranean, edited by S . Guerzoni and R. Chester, pp. 133-15 1, Kluwer Acad., Dordrecht, The Netherlands, 1996.
Prospero, J.M., Long-term measurements of the transport of African mineral dust to the southeastern United States: Implications for regional air quality, Journal of Geophysical Research-Atmospheres, 104 (D13), 15917-15927. 1999.
Prospero, J.M., G. Paul & 0. Torres, Environmental characterization of global sources of atmospheric soil dust identified with the NIMBUS-7 TOMS absorbing aerosol product. accepted to Geoph. Rev.: 2002.
Reid, J.S. et al., The Puerto Rico dust experiment (PRIDE): Mission overview, Eos Trans AGU, 8 1, F42,2000.
Reid, J.S, J.E. Kinney, D.L. Westphai, B.N. Holben, E.J. Welton, S-C.Tsay, D.P. Eleuterio, J. Campbell, S.A. Christopher, H.H. Jonnson, J.M. Livingston, H.B. Maring, M.hleier, P. Pilewskie, J.Prospero, E.A. Reid, L.A. Remer, P.B. Russell, D. Savoie, ASmirnov and D. Tanre, Measurements of Saharan dust by airborne and ground-based remote sensing methods during the Puerto Rico Dust Experiement (PRIDE), J . Geophys. Res., this issue.
Remer, L.A., D. Tanr6, Y.J. Kaufman, C. Ichoku, S. Mattoo, R. Levy, D.A. Chu, B.N. Holben, 0. Dubovik, Z. Ahmad, A. Smirnov, J.V. Martins and R-R. Li, Validation of MODIS aerosol retrieval over ocean, Geophys Res Lett., in press, 2002.
Russell, P.B., J.M. Livingston, E.G.. Dutton, R.F. Pueschel, J.A. Reagan, T.E. DeFoor, M.A. Box, D.Allen, P. Pilewskie, B .M. Herman, S .A. Kinne, and d. J. Hofmann, Pinatubo and Pre-Pinatubo Optical-Depth Spectra: Mauna Loa Measurements, Comparisons, Inferred Particle Size Distributions, Radiatiive Effects and Relationship to Lindar Data, Journal of Geophysical Research-Atmospheres, 98 (D 12), 22969,22985, 1993.
Smirnov, A., B.N. Holben, T.F. Eck, 0. Dubovik, and I. Slutsker, Cloud-screening and quality control algorithms for the AERONET database, Remote Sensing of Environment, 73 (3), 337-349,2000a.
26

Smirnov, A., B.N. Holben, D. Savoie, J.M. Prospero, Y.J. Kaufman, D. Tanre, T.F. Eck, and I. Slutsker, Relationship between column aerosol optical thickness and in situ ground based dust concentrations over Barbados, Geophysical Research Letters, 27 (1 l), 1643- 1646,2000b.
Sokolik, I.N., D.M. Winker, G. Bergametti, D.A. Gillette, G. Carmichael, Y.J. Kaufman, L. Gomes, L. Schuetz, and J.E. Penner, Introduction to special section: Outstanding problems in quantifying the radiative impacts of mineral dust, Journal of Geophysical Research-Atmospheres, I06 (D 16), 1801 5- 18027,200 1.
Stallard R.F., Possible environmental factors underlying amphibian decline in eastern Puerto Rico: Analysis of US government data archives, Conservation Biology, 15 (4), 943-953,2001.
Tegen, I., and I. Fung, Contribution to the Atmospheric Mineral Aerosol Load From Land- Surface Modification, Journal of Geophysical Research-Atmospheres, 100 (D9), 18707- 1 8726,1995.
Tegen, I., A. A. Lacis and I. Fung, The influence on climate forcing of mineral aerosols from distrubed soils. Nature,380,419-422, 1996.
Tegen, I., P. Hollrig, M. Chin, I. Fung, D. Jacob and J. Penner, Contribution of different aerosol species to the global aerosol extinction optical thickness: Estimates from model results. J . Geophys. Res., 102,23,895-23,915, 1997.
Tanrk, D., M. Herman, and Y.J. Kaufman, Information on aerosol size distribution contained in solar reflected spectral radiances, Journal' of Geophysical Research, 101 (D 14), 19043- 1 9060,1996.
Tanr6, D., Y.J. Kaufman, M. Herman, and S. Mattoo, Remote sensing of aerosol properties over oceans using the MODISEOS spectral radiances, Journal of Geophysical Research-Atmospheres, 102 (D14), 16971-16988, 1997.
Tanrk, D., Y.J. Kaufman, B.N. Holben, B. Chatenet, A. Karnieli, F. Lavenu, L. Blarel, 0. Dubovik, L.A. Remer, and A. Smirnov, Climatology of dust aerosol size distribution and optical properties derived from remotely sensed data in the solar spectrum, Journal of Geophysical Research-Atmospheres, 106 ( D 16), 18205- 182 17,200 1.
27

Table la: Refractive Indices, Median, Standard Deviation and Effective Radius for small mode particles used in the MODIS Lookup Table
, withhumiditv ,
I h =0.47-->0.86pm h = 1 . 2 4 p
1.45-0.00351 1.45-0.00351 1.45-0.0035i 1.45-0.0035i 1.45-0.0035i 1.45-0.0035
1.53-0.003i (0.47) 1.46-0.OOOi 1.53-0.001i (0.55)
i 1.53-0.OGOi (0.66) 1.53-0.OOOi (0.86J
1.53-0.003i (0.47) 1.46-0.OOOi 1.53-0.001i (0.55) 1.53-0.OOOi (0.66) 1.53-0.OOOi (0.86)
--.
Table lb: Refractive Indices, Median, Standard Deviation and Effective Radius for large mode particles used in the MODIS Lookup Table
h = 1 . 6 4 p
1.43-0.00351 1.43-0.0035i 1.43-0.0035 1.46-0.Om
- 1.46-0.001i
U=2.13pm r 1.43-0.00351 0.40 1.43-0.00351 0.60 1.43-0.0035i 0.80
1.46-0.0003 0.6@
- 1.46-0.OOOi 0.50
U 0.60
0.60 0.60
0.60
0.80
reff 0.98
1.48 1.98
1.48
--
-- 2.50
comments
Wet Sea salt type Wet Sea salt type Wet Sea salt tyE
Dust-like type
-
- Dust-like type
28

Table 2: MODIS overpass parameters for Roosevelt Roads, Puerto Rico, during PRIDE.
DOY is the “Day Of Year” or the Julian date. The columns marked “Solar-Zen”, “Sensor-Zen”, Relative-Azm” and “Scat-Angle” denote the solar zenith angle, sensor zenith angle, relative azimuth (solar/sensor) azimuth angle and the scattering angle, respectively .
29

Table 3: Identification of ground-based and airborne aerosol measurements coincident with MODIS overDass.
The column marked “G/NG” refers to whether Roosevelt Roads was within the MODIS glint mask. The listing for AERONET is for almucantars taken within two hours of over- pass. For the MICROTOPS, the location (and name of location) is exactly at overpass, while for the AATS-6, the location is the midpoint of its low-level leg. The last column denotes in-situ measurements within one hour of overpass.
30

Figure 1. MODIS “true-color” imagery seen on Jul21,2000. The image is a composite of Red Green and Blue MODIS channels. Note Puerto Rico to the left of center, and the glint reflection in the upper middle of the image.
31

Figure 2. MODIS combined land and ocean Optical Depth retrieval (at 550 nm) €or July 21,2000. Notice Puerto Rico to the left of the center. The glint region (reflection within 40 degrees of the specular reflection) is not retrieved.
32

-67.60 -67.20 -66.80 -66.40 -66.00 -65.60 -65.20 4 8 . . \. . ; . _:. : . .:_. .I . . . . . . . . . . . . . . . . . . . . . . . . . . . . . . . . . . . . . . . . . . . . . . . . . . . . Location .of . . !.
Observations: : AtlanticOceanI \
bit. 8 . . . . .! . .Aircraft ?$e. . . . . . . . . . . I . . . . . . . ,
: \ i ! Caribbean Sea !
Figure 3. Schematic showing how the field instruments were deployed together on July 4-6, where the filled circles, filled square and open triangle represent approximate locations of the AERONET, MICROTOPS and Ames sun- photometers. The solid line is a flight track of the Navajo aircraft, following the same heading as the MODIS satellite track (dotted). In situ data were taken at Roosevelt Roads.
33

0 v) 0 I
3
AERONET Optical Depth
0.8
0.7 k, 0.6 [- 0.5
0.4 4
0.3 1 0.2 1 0.1 1
t
I at 670 nm
I "" 1 ' ' " I ' ' I ' 1 ' ' ' '
1 - 1 -Roosevelt Roads I
O t - 180185 190 195 200 205 210 215
Jul 1 Jul 15 Jul 30 Day of Year (2000)
Figure 4. Time series of columnar optical depth from Roosevelt Roads and La Paguera AERONET stations during PRIDE. Day 183 corresponds to July 1,2000.
34
MODIS / Sunphotometer Optical Depth
0.5
0.4
n o 0.3 a v> - n 5 0.2 x
0.1
0
Each Sunphotometer l " " 1 " "
-AATS: 870 nm --C-MTOPS: 870 nm ==*=AERONET: 870 nm +AATS: 550 nm -0 -MTOPS: 550 nm - -& - AERONET: 550 nm
I I /
.1
0.1 0.2 0.3 0.4 0.5 Sunphotometer AOD
Figure 5. Spatio-temporal comparison of MODIS optical depth retrievals (for 870 nm and 550 nm) for each of the sun-photometers (AERONET, MICROTOPS and AATS) used during PRIDE. Lines represent linear regression by wavelength for each sun-photometer. The light gray line is the one-to-one line for comparison.
35

n a 0
r
- 0 0.1 0.2 0.3 0.4 0.5 0.6 0.7
Sunphotometer AOD
Figure 6. Spatio-temporal comparison of MODIS optical depth retrievals for all sun-photometers grouped together. Solid, Dashed and Dotted are linear regressions for Blue, Red and IR wavelengths, respectively. The thin dotted lines are estimated errors (k0.03 k 0.0% ) published by Rerner et al. [2002].
36

Angstrom Exponent Defined when Sunphotometer z > 0.15 660
L 0
1.5
1.25
1
0.75
0.5
0.25
0
1 0-LC 0 Sunphoto 660/470
In Situ 700/450 30-R$ -I
23-OA I
0 0.1 0.2 0.3 0.4 Sunphotometer or InSitu Angstrom Exponent
Figure 7. Comparison of MODIS Angstrom exponent to sunphotometer (dots) and to in-situ nephelometer measurements (square), showing that MODIS over-predicts for all cases (compared to the dotted one-to-one line). The text associated with each symbol represents the day of July (except 30 = June 30), location and type of instrument. Locations: R = Roosevelt Roads, L = La Paguera, 0 = Ocean; Instruments: C = Cimel (AERONET), M = MICROTOPS, A = AATS-6, I = In Situ.
37

Spectral dependence of aerosol optical depth
> 0.15
0.5
0.4
0.3
0.2
0.1
-AATS Jul21 -LaPaguera Jul 21 -Roosy Jul 16 -Roosevelt Jul 16 -AATS Jul4 -Chapman Jul4 -AATS Jut 23
400 600 800 1000 Wavelength (nm)
Figure 8. Spectral dependence of PRIDE optical depth, when sunphotometer z,, > 0.15. For the same color curves, solid curves COM& sun-photometer measurements, while dotted curves COM& MODIS retrievals. Roosevelt Roads (AERONET) and Roosey Roads (MICROTOPS) were operated next to each other on July 16, and the AATS fiew above the RV Chapman (MICROTOPS) on July 4. Because each of these pairs of sunphobmer mmsurements occurred in the same MODIS “pixel,” only one MODIS retrieval is associated with each P i
38

5 n S 0 L
.o 4 E
v) 3 5 3
U
rn OL a, > 0 a,
W
c, 2 % Y-
m 1 - Q 0 2
0 .
Figure 9. Comparison of effective radius retrieved from MODIS versus AERONET (dots) and in-situ data at the surface (squares). The magnitude of each “error bar” is the optical depth (multiplied by 0.025). The numbers represent the date in July (e.g. 4 = July 4), and if followed by a letter, then it represents AERQNET retrieval for the same date (e.g. “A” and “B” are two almucantars within one hour of MODIS overpass). The dotted line is one-to-one.
l ‘ ~ ~ ~ l ~ ~ ~ ~ l 1 .
a
- “Error Bars” - AOD * 40 1 “Notation” - Day of July
Mu I t i ple Retrievals
a - a
- I
~ ....a
a 0
- -
I - 0
1 a
be AERONET -
0
In Situ - y’: , :J J7pJ 7B , , ,‘ , , , , , , , , , -
39

Errors of AOD and Effective Radius 3 n
n 0 0 Q v
-1 J J
-3 -1
I " ' I ' "
870nm a 0 660nm
470nm .
\
! I i -,
t w
a 0 t i .-
L a i 1 00 -8Q -60 -40 -20 0
Effective Radius Error (%)
Figure 10. Relationship between effective radius error and the optical depth expectation error (defined by Equation 9), for three wavelengths. Optical depth expectation error is defined so that a magnitude less than one (between thin dotted lines) represents a retrieval within the Rerner et al. [2002] expected retrieval error (i0.03 i 0.0% ). A perfect retrieval would lie on the dotted zero line. The effective radius error is the relative error defined by Equation 9.
40

Size Distribution
Q) N v)
E P 3 -
Om05
0
Volume
I . - . . _ .
-RR: 6/30 14:27 -RR: 7/7 14:29 -RR: 7/7 1529 -RR: 7/16 14:30 -RR: 7/19 14:30 -RR: 7/19 15:30
ti:: - 1 7 -1 '. '
-LP: 7/19 14:36 -----In situ: Jul 7 -----In situ: Jul 16
: I , -4. -. -,
H -
0.1 1 10 100
Particle Radius (pm)
Figure 11. Volume size distribution retrieved tkom AERONET ahnucantars (solid curves) and from in-situ data (dotted curves), corresponding to valid MODIS retrievals. For in-situ data, we are assuming an aerosol layer thickness of 1 km, to derive the same units.
41

Scattering Angle Dependence of Optical Depth and Fitting Errors
I =+=%Err-470 1 I .10 =%Err-550 i
.-%Err,870 j
i
100 . =o=%Err-660 / x +
I I
i
A x I 1
-d - S W " " " ' " " ' " '4Y " " ' " " ' ' I .
110 120 130 140 150 160 170
Scattering Angle (degrees) Figure 12. Optical Depth error (in percent) compared with scattering angle, fo MODIS wavelengths. MODIS reflectance fitting error is given by the Xs. The curves are second order polynomials
6
5
4
3
2
42

Evaluation of the MODIS retrievals of dust aerosol over the ocean during PRIDE
Robert C. Levy’? Lorraine A. Reme#, Didier Tanrk3? Yoram J. Kaufman2, Charles Ichoku’, Brent N. Holbenq John M. Livingston5? Philip B. Russellb, Hal Maring7
‘Science Systems and Applications Inc., Lanham, MD 20706
’Laboratory for Atmospheres, NASA Goddard Space Flight Center, Greenbelt, MD 20771
3Lab. d’Optique Atmos., CNRS, Univ. de Sciences et Techniques de Lille, Villeneuve d’Ascq, France
Laboratory for Terrestrial Physics, NASA Goddard Space Flight Center, Greenbelt, MD 20771
’SRI International, 333 Ravenswood Avenue, Menlo Park, CA 94025
6NASA Ames Research Center, Moffett Field, CA
’Rosenstiel School of Marine and Atmospheric Science, University of Miami, Miami, FL
4
Submitted to AGU Journal of Geophysical Research
Popular Summary
Mineral dust aerosols are airborne particles produced by wind erosion of the earth’s surface, and can be transported far distances by the prevailing winds. Their presence in the atmosphere perturbs global and regional climate, by scattering and absorbing sunlight. In large amounts, dust reduces visibility and adversely affects human health. A major source region for dust is the combined African deserts, from where summertime prevailing winds transport the aerosol towards the Caribbean Sea. In the summer of 2000 (June 26 to July 24,2000), the Puerto Rico Dust Experiment (PRIDE) took place in Roosevelt Roads, Puerto Rico, to study the African dust aerosol transported into the region.
Satellite systems have the ability to view large areas of the globe nearly simultaneously, thus are useful tools for monitoring large scale phenomena, including African dust transport. Recently, a new sensor, the MODerate Imaging Spectro-radiometer (MODIS), began retrieving global aerosol information, at much increased spatial resolution and spectral resolution (more wavelengths) from previous satellite missions. Over oceanic regions, this new capability allows for not only retrievals of the aerosol amount, but also determination of the aerosol type. PRIDE had the unique distinction of being the first major field experiment to allow for direct comparison of aerosol retrievals from MODIS with ground based and airborne based aerosol measurements.
In this paper, we examine the ability of MODIS to retrieve dust aerosol properties over oceanic regions around Puerto Rico. The primary products from MODIS include the “spectral optical depths,” which are measures of the amount of light scattering and absorption in an atmospheric column, in turn related to the amount of aerosol, and the “effective radius,” a measure of the characteristic size of the particles, which is indicative of the aerosol type. Compared to ground based measurements, we show that MODIS accurately retrieves the aerosol optical depth at one wavelength, but systematically varies in quality when retrieving optical depths at other wavelengths. This discrepancy, related to wavelength, results in MODIS estimating an effective radius that is much smaller than the ground-based measurement. We believe that discrepancies in the spectral optical depth and dust size retrievals are, at least in part, associated with the use of only spherical particle models in the MODIS algorithm. Future generations of MODIS aerosol algorithms will include more accurate treatment of the non-spherical shapes of dust aerosol.