Validation of MODIS aerosol optical depth retrievals … of MODIS aerosol optical depth retrievals...
44
Validation of MODIS aerosol optical depth retrievals over a tropical urban site, Pune, India Sanjay Morel, P. Pradeep Kuman, Pawan Gupta23, P. C. S. Devara4, G. R. Ahers* 1 Department of Atmospheric and Space Sciences, University of Pune - 07 2 NASA Goddard Space Flight Center Greenbelt, MD 20771, USA 3 Universities Space Research Association, Greenbelt, MD 20771, USA 4 Indian Institute of Tropical Meteorology, Pune-08 5 Physics Department Nowrosjee Wadia College, Pune-O! Summary This paper attempts to validate the MODIS dark target aerosol optical depth product over tropical urban location in India. The ground truth data used in this study has been collected using Microtops hand held sun-photometer on cloud free days during 2008-2010. AERONET measurements have also been compared against MODIS and Microtops. Aerosol properties derived from the AERONET over the same location have been analyzed as well. This is the first ever systematic validation of the MODIS aerosol products over Pune. MODIS AOD retrievals are well correlated with the AERONET and Microtops AODs. MODIS AODs underestimate during winter and overestimate during pre-monsoon. MODIS retrievals are capable of characterizing AOD distributions over Pune. Systematic error in the MODIS aerosol products needs further investigation. Single scattering albedo shows seasonal variability, winter months were dominated by absorbing type of aerosols whereas summer time scattering aerosols dominates the AOD values. Both winter and pre monsoon months do not shows large diurnal variations at the station. https://ntrs.nasa.gov/search.jsp?R=20110023024 2018-06-10T02:30:54+00:00Z
Transcript of Validation of MODIS aerosol optical depth retrievals … of MODIS aerosol optical depth retrievals...
Validation of MODIS aerosol optical depth retrievals over a tropical urban site, Pune, India
Sanjay Morel, P. Pradeep Kuman, Pawan Gupta23, P. C. S. Devara4, G. R. Ahers* 1 Department of Atmospheric and Space Sciences, University of Pune - 07
2 NASA Goddard Space Flight Center Greenbelt, MD 20771, USA 3 Universities Space Research Association, Greenbelt, MD 20771, USA
4 Indian Institute of Tropical Meteorology, Pune-08 5 Physics Department Nowrosjee Wadia College, Pune-O!
Summary
This paper attempts to validate the MODIS dark target aerosol optical depth product over
tropical urban location in India. The ground truth data used in this study has been collected using
Microtops hand held sun-photometer on cloud free days during 2008-2010. AERONET
measurements have also been compared against MODIS and Microtops. Aerosol properties
derived from the AERONET over the same location have been analyzed as well. This is the first
ever systematic validation of the MODIS aerosol products over Pune. MODIS AOD retrievals
are well correlated with the AERONET and Microtops AODs. MODIS AODs underestimate
during winter and overestimate during pre-monsoon. MODIS retrievals are capable of
characterizing AOD distributions over Pune. Systematic error in the MODIS aerosol products
needs further investigation. Single scattering albedo shows seasonal variability, winter months
were dominated by absorbing type of aerosols whereas summer time scattering aerosols
dominates the AOD values. Both winter and pre monsoon months do not shows large diurnal
variations at the station.
https://ntrs.nasa.gov/search.jsp?R=20110023024 2018-06-10T02:30:54+00:00Z
Validation of MODIS aerosol optical depth retrievals over a tropical urban site, Pune, India
Sanjay Morel, P. Pradeep Kumart, Pawan Gupta2 3, P. C. S. Devara4, G. R. Aher5
*
1 Department of Atmospheric and Space Sciences, University of Pune - 07 2 NASA Goddard Space Flight Center Greenbelt, MD 20771, USA
3 Universities Space Research Association, Greenbelt, MD 20771, USA 4 Indian Institute of Tropical Meteorology, Pune-08
5 Physics Department Nowrosjee Wadia College, Pune-Ol
Abstract
In the present paper, MODIS (Terra and Aqua; level 2, collection 5) derived aerosoloptical depths (AODs) are compared with the ground-based measurements obtained from AERONET (level 2.0) and Microtops - II sun-photometer over a tropical urban station, Pune (18°32'N; 73°49'E, 559 m amsl). This is the first ever systematic validation of the MODIS aerosol products over Pune. Analysis of the data indicates that the Terra and Aqua MODIS AOD retrievals at 550 nm have good correlations with the AERONET and Microtops - II sun-photometer AOD measurements.
During winter the linear regression correlation coefficients for MODIS products against AERONET measurements are 0.79 for Terra and 0.62 for Aqua; however for premonsoon, the corresponding coefficients are 0.78 and 0.74. Similarly, the linear regression correlation coefficients for Microtops measurements against MODIS products are 0.72 and 0.93 for Terra and Aqua data respectively during winter and are 0.78 and 0.75 during pre-monsoon. On yearly basis in 2008-2009, correlation coefficients for MODIS products against AERONET measurements are 0.80 and 0.78 for Terra and Aqua respectively while the corresponding coefficients are 0.70 and 0.73 during 2009-2010. The regressed intercepts with MODIS vs. AERONET are 0.09 for Terra and 0.05 for Aqua during winter whereas their values are 0.04 and 0.07 during pre-monsoon. However, MODIS AODs are found to underestimate during winter and overestimate during pre-monsoon with respect to AERONET and Microtops measurements having slopes 0.63 (Terra) and 0.74 (Aqua) during winter and 0.97 (Terra) and 0.94 (Aqua) during pre-monsoon.
Wavelength dependency of Single Scattering Albedo (SSA) shows presence of absorbing and scattering aerosol particles. For winter, SSA decreases with wavelength with the values 0.86 ±0.03 at 440 nm and 0.82 ±0.04 at 1020nm. In pre-monsoon, it increases with wavelength (SSA is 0.87 ±0.02 at 440nm; and 0.88 ±0.04 at 1020 nm).
1 1. Introduction
2 The knowledge of spatial and temporal distributions of aerosols on regional and
3 global scale is essential to understand the dynamics of aerosols and the associated
4 influence on regional and global climatic conditions (Tripathi et al., 2005). Satellites-
5 based remote sensing technique provides systematic retrieval of aerosol optical properties
6 on regional and global scale (Kaufman et al., 2005, Kahn et al., 2010). The MODerate
7 Resolution Imaging Spectroradiameters (MODIS) aboard the Terra (launched in 1999)
8 and Aqua (in 2002) observe the earth-atmosphere systems twice daily. Columnar aerosol
9 optical properties such as aerosol optical depth (AOD) and aerosol small mode fraction
10 (ASMF) are retrieved from these observations over both land and ocean (Kaufman et al.,
11 1997; Tanre et al., 1997). Satellite observations have advantages that they can provide
12 information in the larger spatio-temporal domain (Kaufman et aI., 2002) as most of the
13 ground measurements are limited to very small area (point observations). However,
14 aerosols from the space is challenging in areas where surface reflectance is high as it may
15 introduce considerable errors in the derived results. So as to improve the accuracy of the
16 MODIS data, it is essential to compare and validate the MODIS data with independent
17 ground-based measurements. Several research studies have compared and validated
18 MODIS data with the data obtained from the ground-based Microtops II sun-
19 photometers and that measured from federated network instruments viz., Aerosol
20 Robotic Network (AERONET) (Jing-Mei et al., 2010; Retalis et al., 2010; Aloysus et al.,
21 2009; Misra et aI., 2008; Levy at al., 2010,Remer et aI., 2005; Tripathi et al., 2005;
22 Ichoku et aL, 2002a; Chu et al., 2002; Holben et al., 1998, Hyer et at, 2011). Since the
2
23 launch of MODIS, validation studies suggested that the expected error (EE) over land
24 could be represented by EE = ± 0.05 ±0.15xAOD (Remer et aI., 2005).
25 In India, several validation of MODIS derived AOD has been carried out by
26 various groups (Jethva et aI., 2005, Tripathi et aI., Prasad and Singh, 2007 ). Tripathi et
27 aI., (2005) using MODIS level 2 and collection 4 AOD data with AERONET data for
28 2004 found an overestimation by MODIS during dust and an underestimation during non-
29 dust seasons having slopes and intercepts in the two cases 2.46, -0.63 and 0.69, 0.12
30 respectively with nearly same correlation coefficients (0.72 and 0.71 respectively). For
31 the Indo-Gangatic basin, Jethva et al.,(2005) compared the monthly mean AOD at 550
32 nm from MODIS level 3 daily gridded data with AERONET sunphotometer derived
33 monthly mean AOD values for Kanpur, India during January 2001 to July 2003 and
34 found a systematic overestimation by MODIS during summer and underestimation
35 during winter. Prasad and Singh (2007) also found MODIS overestimating AOD values
36 during summer and underestimating during winter with the slopes and intercepts with two
37 cases 0.51, 0.52 and 0.48, 0.15 respectively. The correlation coefficients in the two cases
38 were less than 0.5.
39 In the present study, we compare MODIS (Terra and Aqua) AOD retrievals with
40 AERO NET AODs of level 2.0 and Microtops II sun-photometer measurements at Pune
41 (l8°32'N; 73°49'E, 559 m amsl), India. CIMEL sun-sky radiometer installed at Indian
42 Institute of Tropical Meteorology (IITM) as a part of AERONET global network, and it
43 makes measurements at 440,675, 870, 940, and l020nm and three polarized channels at
44 870 nm. In the present study, data retrieved from 440, 675, 870 and 1020 channels are
45 used Microtops II sun-photometer (five channels) is operated from Pune
3
46 campus on cloud free days observing seasons spanning over Dec-May for the period
47 2008-09 and 2009-10. To the best of our knowledge this is the first kind of systematic
48 study that validates MODIS data over Pune. The study also presents seasonal behaviour
49 of AERONET inversion products viz., aerosol columnar volume size distribution
50 (ACVSD), single scattering albedo (SSA), and Angstrom Exponent (a).
51 2. Study Location and Local Meteorology:
52 The study location, over which the validation has been performed, is Pune (18°3iN;
53 73049'E, 559m amsl). It is about 100 km from the west cost ofIndia and Lee-ward side of
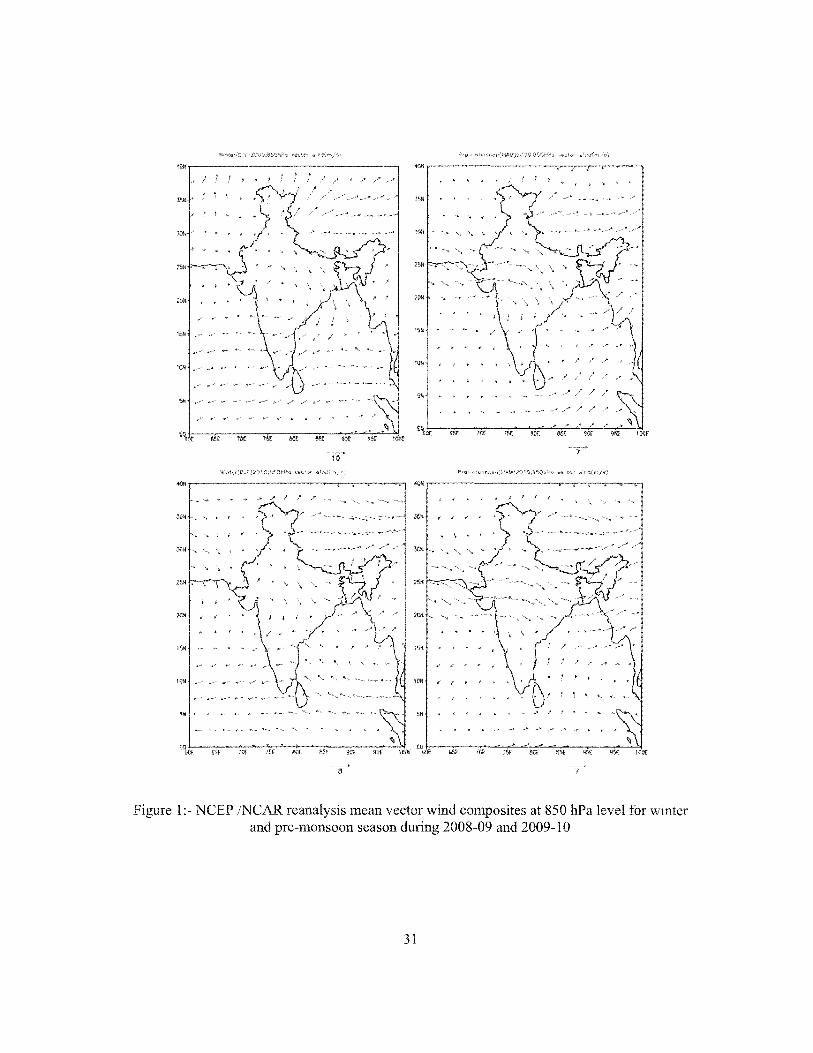
54 Sahyadri Range (Western Ghats). Pune has tropical wet and dry climate. Figure (1)
55 shows the NCEP /NCAR reanalysis mean vector wind composites at 850 hPa for winter
56 and pre-monsoon seasons during 2009 and 2010 over the Indian region (0 - 40° N; 60 -
57 100° E). In winter (Dec, Jan and Feb), minimum temperature is up to 3 to 4°C with light
58 winds and continental air mass passing over the region. During the Pre-monsoon (Mar,
59 Apr and May) the weather is very hot with the maximum temperature of about 40° C and
60 surface winds mostly gusty and dust content in the atmosphere is maximum.
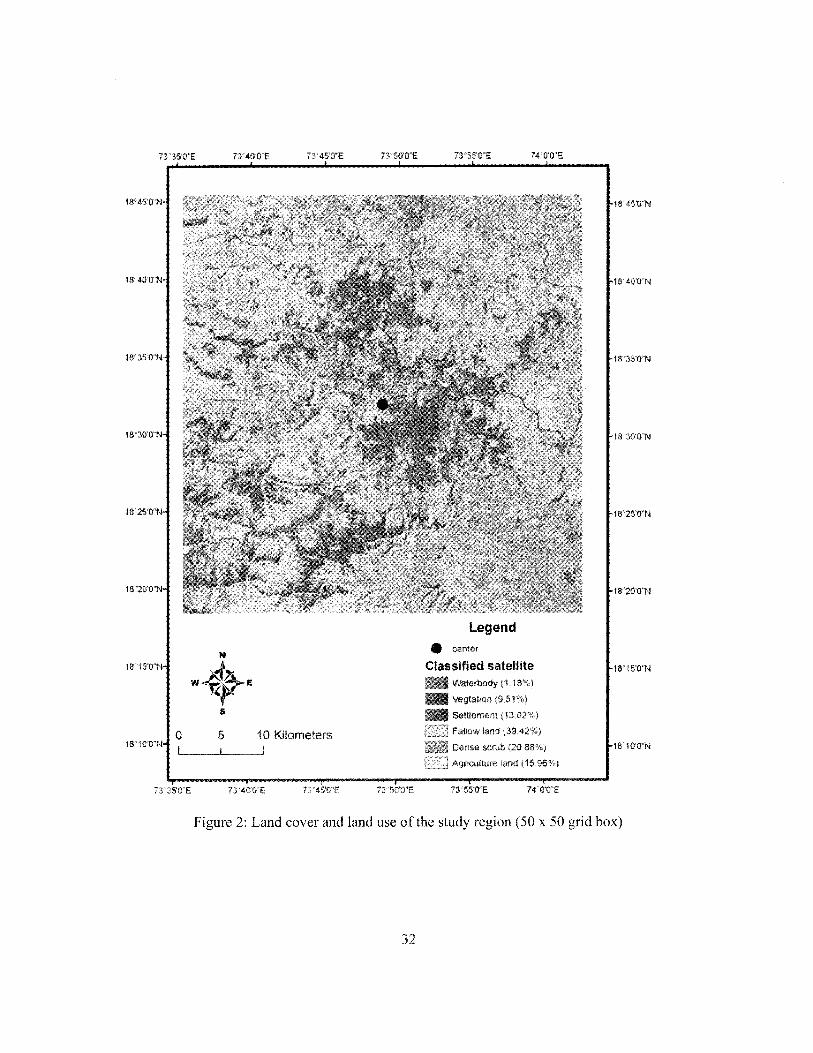
61 The study region mainly comprises of semi arid region and has six types of land
62 use and land cover as shown in Figure (2). It mainly consist of fallow land (39.42%),
63 dense scrub (20.88%), agriculture land (15.96%), settlement (l3.02%), vegetation
64 (9.51%) and water body (1.18%). It contains 377 villages and has a population of 44,
65 54,509 (Census of India 2001). The population and the number of vehicles and
66 industrialization has been increasing at a steady rate over pune since 2001.
67
4
68 3. Data and Methodology:
69 3.1 Data
70 MODIS data are available at different processing levels, level 1.0 (geolocated &
71 calibrated brightness temperatures and radiances), level 2.0 (derived geophysical data
72 products) and level 3.0 (Gridded time-averaged product) (King et aI., 2003). AERONET
73 data are also available at three different levels, level 1.0 (raw or un screened data), level
74 1.5 (cloud screened data) and level 2.0 (quality assured data) (Holben et aI., 1998). For
75 this study, we have employed MODIS (both Terra & Aqua) level 2 collection 5
76 instanteneous AOD data at 550 nm .. MODIS AOD retrievals are compared with level 2.0
77 AERONET and Microtops II sun-photometer measurements of AODs.
78 3.2 MODIS
79 Radiant energy reflected and emitted by the Earth carries a signature of atmospheric and
80 surface properties. Satellite sensors can quantify several atmospheric properties by
81 measuring the wavelength, angular and polarization properties of this radiant energy
82 (Kaufman et at., 2002). The MODIS has been designed with aerosol and cloud remote
83 sensing in mind (King et aI., 1992). It is sun-synchronous and near polar orbiting, with a
84 circular orbit of705 km above the surface. MODIS has 36 bands ranging from 0.4 to 14.4
85 /lm wavelengths with three different spatial resolutions (250,500 and lOOO m) and views
86 the Earth with a swath of 2330 km thereby observing the entire globe every day, with
87 equatorial crossing local time 10:30 am and 1 :30 pm (Terra and Aqua respectively).
88 The MODIS retrievals of aerosol use two separate algorithms for land and ocean.
89 Both the algorithms were developed before the Terra and are well described in
90 Kaufman et al. (1997) for land and Tanre et al. (1997) for ocean. MODIS retrievals of
91 AOD over land uses three spectral channels centered at 0.47, 0.66, and 2.13 11m
92 wavelength. The retrieval of AOD is performed and reported at lOxlO km2 pixel size
93 although the original observations are made at 250-1000m resolution. Each high
94 resolution pixel in the IOxlOkm2 box is evaluated for cloud, ice/snow and then mean
95 reflectance values are utilized to retrieve AOD using lookup table approach. More details
96 on AOD retrieval can be found elsewhere [i.e. Remer et aI., 2005, Levy et aI., 2007a,
97 2007b]
98 3.4 AERONET (AErosol RObotic NETwork)
99 The AERONET (AErosol RObotic NETwork) is a federation of ground-based
100 remote sensing aerosol networks established by NASA and is greatly expanded by
101 collaborators from other agencies. The program provides a long-term, continuous
102 database of aerosol optical, microphysical and radiative properties for aerosol research
103 and characterization, validation of satellite retrievals, and synergism with other databases.
104 The network imposes standardization of instruments, calibration, processing and
105 distribution.
106 AERONET provides globally distributed observations of spectral AOD, inversion
107 products, and precipitable water in various aerosol regimes. It employs CIMEL sun-sky
108 spectral radiometer which measures the direct sun radiances at eight spectral channels
109 centered at 340, 380, 440, 500, 670, 870, 940 and 1020 nm. The accuracy of direct sun
110 measurements are within ±0.01 and ±0.02 for larger wavelengths (greater than 440 nm)
111 and shorter wavelength (Holben et at, 1998; Eck et aI., 1999). Optical depth is calculated
112 from spectral extinction of direct 'UUl"U.lVH at each wavelength based on the
6
113 Lambert-Beer-Bouguer Law. Aerosol optical depth (AOD) is determined by correcting
114 optical depth for attenuation due to Rayleigh scattering, absorption by ozone and gaseous
115 pollutants. In addition to direct solar radiance, instrument also measures the diffuse sky
116 radiance at four spectral bands (440, 670, 870 and 1020 nm) along the solar principal
117 plane and solar almucantar through a constant aerosol profile to retrieve size distribution,
118 phase function and AOD (Holben et aI., 1998).
119 Indian Institute of Tropical Meteorology (IlTM) is one of the stations of this
120 network. CIMEL sun/sky radiometer is installed in the campus of IITM and continuously
121 operational since 2004 (Sumit and Devara, 2011). The automatic sun-sky tracking
122 radiometer at IITM makes measurements with a 1.20 full field of view at every ~ 15 min
123 interval at five spectral channels (440, 675, 870, 940, 1020nm). In this study data
124 retrieved form 440,675,870 and 1020 nm are used for its comparison with MODIS AOD
125 retrievals. To determine aerosol columnar volume size distribution and Single Scattering
126 Albedo (0)0) solar principal plane (constant azimuth angle, with varied scattering angles)
127 and solar almucantar (constant elevation angle, with varied azimuth angles) geometry is
128 used at 440,675,870 and 1020 nm.
129 3.5 Microtops II Sun-photometer
130 The ground based measurements have been carried out at Pune University campus
131 (l803iN; 73049'E) using handheld Microtops II Sun-photometer from morning till
132 evening at an interval of 10 min. during 2008-09 and 2009-10 on clear sky days. The
133 instrument is well calibrated (Manufactured by Solar Light Company, Philadelphia,
134 USA.). The design, calibration and performance details have been described by Devara et
135 and et al., (2001). The expected accuracy the sun-photometer
7
136 retrievals is comparable with those of CIMEL sun-photometer used in AERONET
137 network with uncertainties in the range of 0.01 to 0.02 (lchoku et al., 2002b). The
138 instrument measures the intensity of direct solar irradiance at· five spectral narrow band
139 spectral channels centered at 440, 500, 675, 870 and 1020 nm. From this data, AOD
140 value for each wavelength is estimated. These data are used along with AERONET as a
141 "ground truth" for the validation of the MODIS AOD products for this study.
142 3.6 Methodology
143 For validation purpose, MODIS retrievals must be collocate in space and time with
144 AERONET and Microtops measurements. We averaged the quality controlled MODIS
145 AOD values at 10 km2 spatial resolution over 50 km x 50 km grid box centered at ground
146 measurements site. For this, we choose 50 km x 50 km grid box because in larger
147 window size, topography and aerosol type heterogeneity playa role and could bring in
148 errors where as smaller grid box contain insufficient data (lchoku et al., 2002a).
149 In order to accomplish realistic comparison of AOD's from these instruments viz.,
150 MODIS, AERONET and Microtops II sun-photometer. AERONET and Microtops
151 measured AODs are adjusted to the MODIS derived 550 nm wavelength AODs using the
152 Angstrom exponent (a) and Angstrom turbidity coefficient (P) derived from Microtops
153 and AERONET measured AODs at the wavelengths 440, 500, 675, 870 and 1020 nm
154 (440, 675, 870 and 1020 nm for AERONET) on the corresponding day through a
155 logarithmic regression using the Angstrom empirical formula viz., AOD = P x A-a. This
156 yields the corresponding retrieved AOD value at 550 nm for the AERONET and
157 Microtops within ±30 min of MODIS overpass time. Thus, over the two years period (i.e.
158 2008-09 and 2009-1 we obtained 118 and 119 identical data sets MODIS
159 and AERONET (48 and 60 data sets for Microtops) during 2008-09 and 2009-10
160 respectively. Similarly, there were 101 and 96 identical data points for MODIS (Aqua)
161 and AERONET (41 and 50 data points for Microtops) during the same period. Thus
162 MODIS -AERONET and MODIS - Microtops data sets fonn the subject matter of the
163 present paper.
164 4 Results and Discussion
165 4.2 Aerosol Properties
166 4.2.1 AOD Variation and Angstrom Exponent (a)
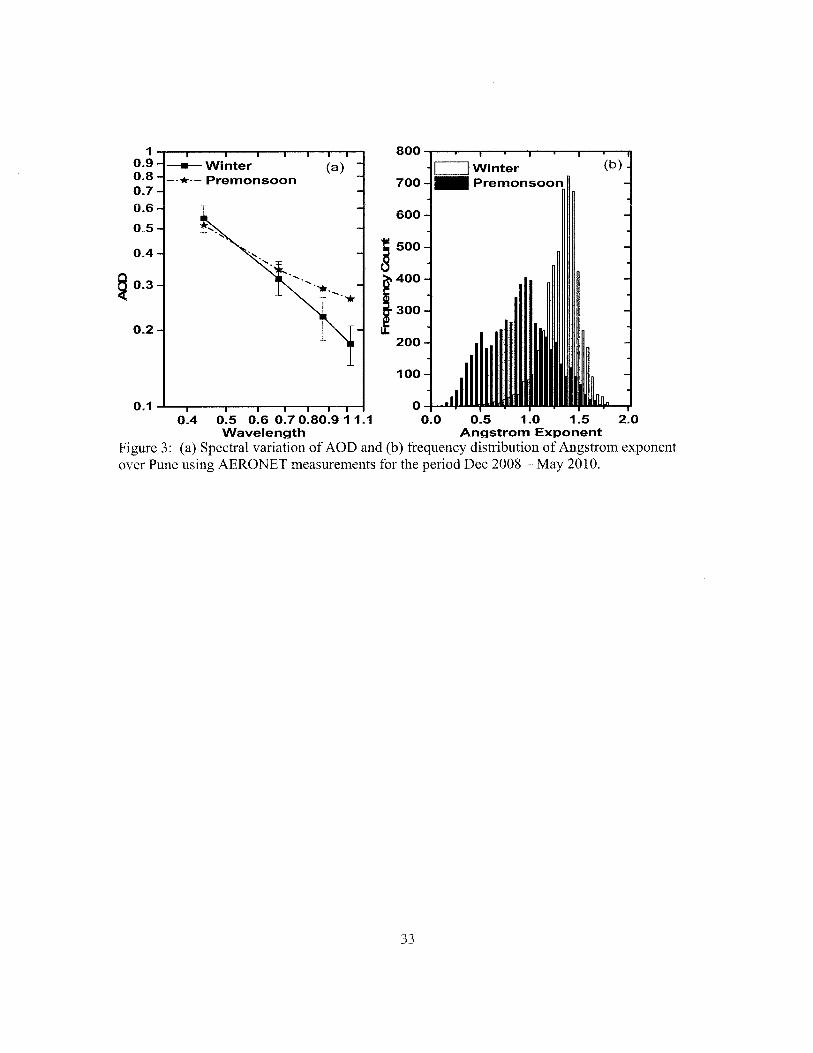
167 The spectral variation of aerosol optical depth and frequency distribution of a
168 during winter and pre-monsoon season for the period of Dec 2008-May 2010 over Pune
169 is shown in Figure 3(a b). Seasonal variation of a is mono modal in winter and bimodal
170 in pre-monsoon. The modal value of a of 1.4 during winter suggests dominance of
171 submicron aerosol particles originating from anthropogenic activity like fossile fuel
172 combustion and biofuel burning (Pandithurai et aI., 2007, Venkataraman et aI., 2005,).
173 During pre-monsoon, bimodal nature of a has modal values 0.5 and 0.95 indicating that
174 dominance of both fine and coarse mode particles. This reveals that the aerosol system
175 over Pune is controlled by different sources.
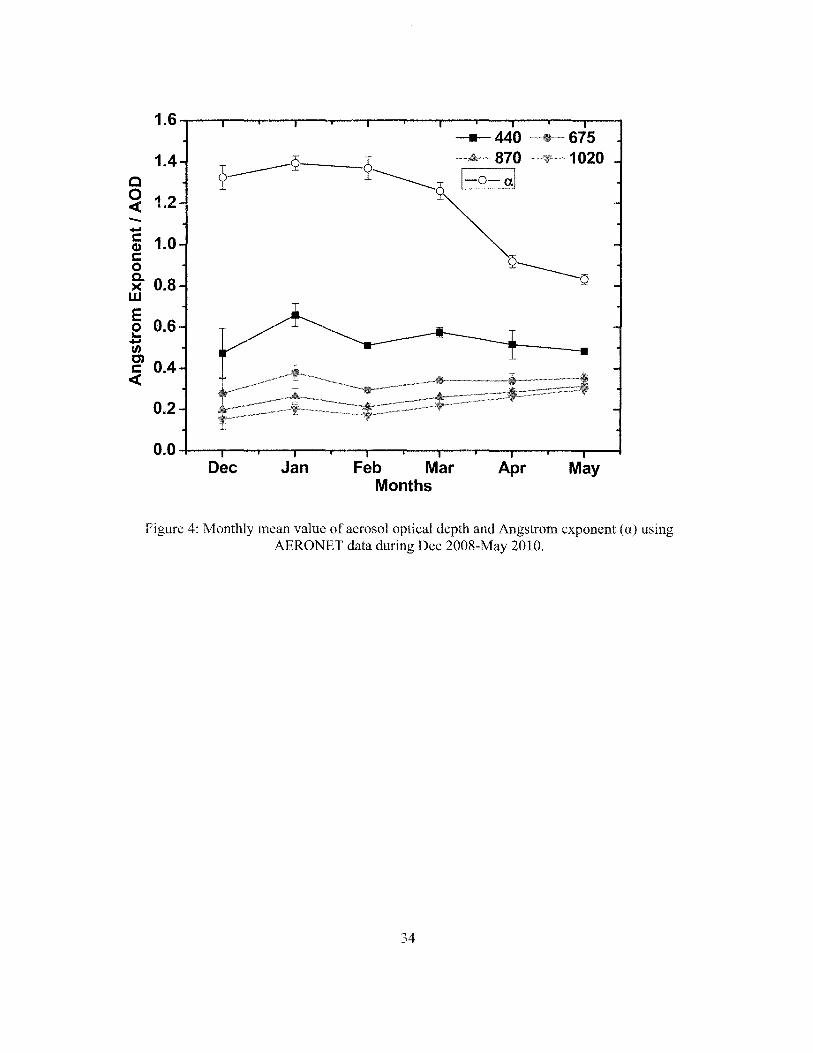
176 Figure (4) reveals monthly mean value of aerosol optical depth and a obtained from
177 AERONET measurements during Dec2008-May2010. From the figure, high AE values at
178 low AODs during winter and low a at high AOD values during pre-monsoon also
179 indicates the dominance of fine mode and coarse mode particles in winter and pre-
180 monsoon respectively.
9
181 4.2. 2 Aerosol Columnar Volume Size Distribution
182 Atmospheric aerosols, which come from many natural and man-made sources,
183 present a wide range of particle sizes and concentrations. Their behavior and the
184 atmospheric effects produced by them depend on their size. The inversion algorithm
185 developed by Dubovik and King (2000) has been used.
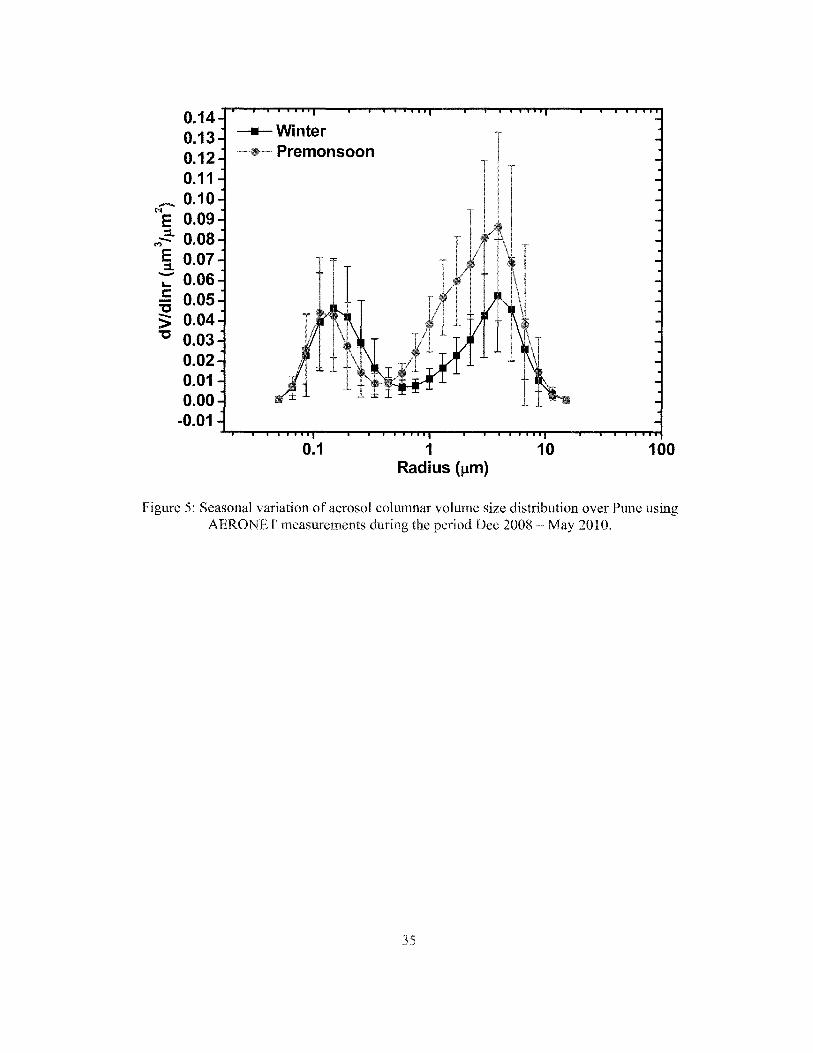
186 Results of this analysis are given in Figure (5) which depicts seasonal variation of
187 aerosol columnar volume size distribution over Pune using AERONET data during the
188 period Dec 2008 - May 2010. It is clear from the figure that the modal volume size
189 concentration of both accumulation mode « 1 flm) and coarse mode (> 1 flm) are low
190 during winter. As compared to winter, during pre-monsoon there is no considerable
191 change in accumulation mode but there is significant increase in modal volume
192 concentration (about 1.5) for the coarse mode. The dominance of coarse mode particles
193 may be due to dust generation by strong winds (wind blown dust) and strong surface
194 heating. Low value of a (0.85) also supports the dominance of coarse mode particles in
195 pre-monsoon. The sources of fine mode particles are fossil fuel combustion and industrial
196 pollutants.
197 The observed Aerosol Columnar Yolume Size Distribution (ACYSD) is found to
198 be bimodal and is represented by
199 dV
dlnr (1)
200 where dY/dlnr is volume size distribution, Yo is columnar volume of particle per cross
201 section of atmosphere, r is radius, rm is mode radius and (J is standard deviation of the
202 logarithm of particle radii.
10
203 The bimodal nature of volume size distribution may be due to different sources of
204 aerosols such as combination of two air masses with different aerosol origin (Hoppel et
205 aI., 1985), generation of new fine particles in the air by the process of heterogeneous
206 nucleation or by homogeneous heteromolecular nucleation and growth of larger particles
207 by condensation of gas-phase reaction products (Singh et aI., 2004).
208 The ACVSD parameters and a are given in Table I. During winter, the average values of
209 volume concentration of accumulation mode and coarse mode are 0.020 ±0.016 and
210 0.025 ±0.017 respectively and in pre-monsoon, the corresponding average values are
211 0.022 ± 0.015 and 0.047 ± 0.032. For accumulation mode, the model value of volume
212 concentration (peak) is almost same (0.046 and 0.0.044) for winter and pre-monsoon
213 respectively. For coarse mode, values of volume concentration are 0.053 and 0.087 for
214 winter and pre-monsoon respectively.
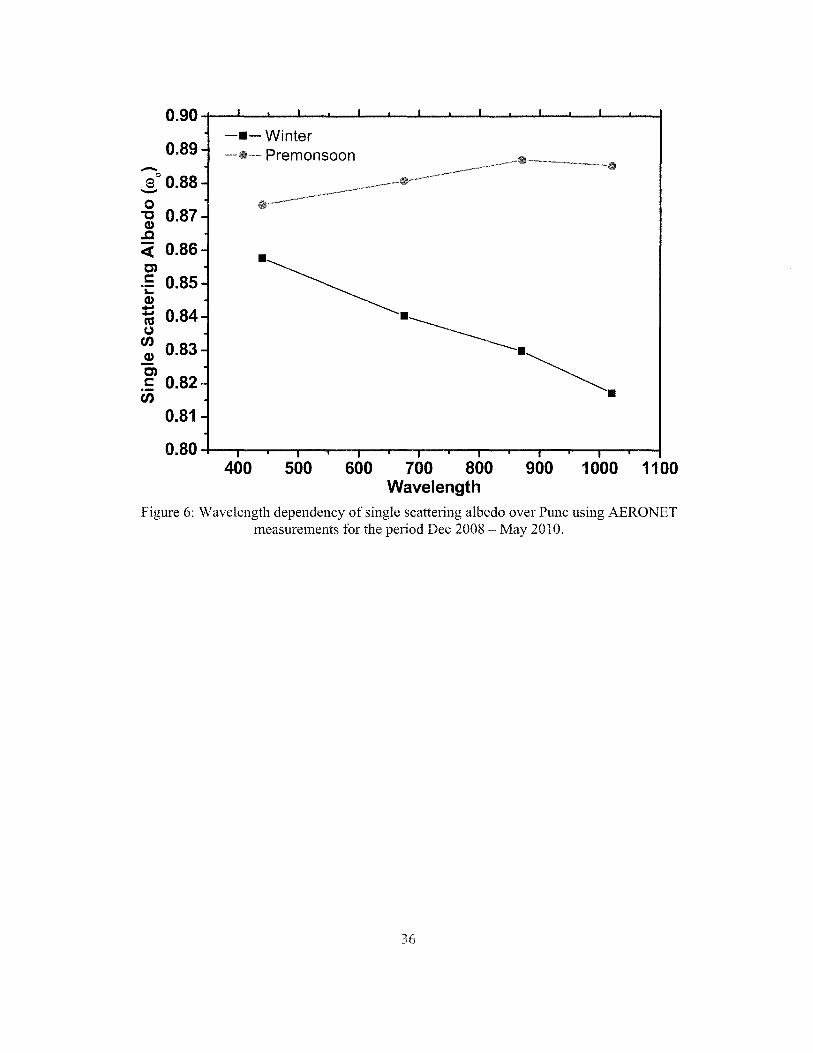
215 4.2.3 Single Scattering Albedo
216 Single scattering albedo (SSA) is a common measure of the relative contribution of
217 absorption to extinction and is a key variable in assessing the climatic effects of aerosols
218 (Jacobson, 2000; Dubovik et aI., 2002). Its value is mostly dependent on the composition
219 and size distribution of aerosols. It is studied by using AERONET inversion product
220 (level 2.0) during Dec 2008 to May 2009. For this, the retrieval algorithm of Dubovik and
221 King (2000) is used to obtain SSA from direct sun and sky radiance measurements by
222 AERONET (CIMEL sun photometer).
223 Figure (6) depicts the wavelength dependence of SSA. During winter, SSA decreases
224 wavelength a 0.86 ±O.03 at nm and ±O.04 at l020nm. Lower
225 SSA at longer wavelength shows dominance of absorbing urban aerosol over Pune,
226 which is attributed to the presence of a mixture of aerosols from mUltiple sources like
227 vehicular pollution, industrial pollutants, biomass burning in the field. However, in pre-
228 monsoon season, the SSA slightly increases with wavelength (SSA is 0.87 ±0.02 at
229 440mn; and 0.89±0.04 at 1020 nm). This suggests the dominance of coarse particles
230 (mostly dust) during pre-monsoon, which may be either due to local activities like
231 urbanization, industrialization and construction activities or windblown dust due to strong
232 surface heating. Similar observations have been reported by Singh et aI., (2004) over
233 Kanpur, Smirnov et aI., (2002) in the Persian Gulf, Xia et ai., (2005) and Cheng et aI.,
234 (2006) over Northern China and Lyamani et al. (2006) over Europe and the
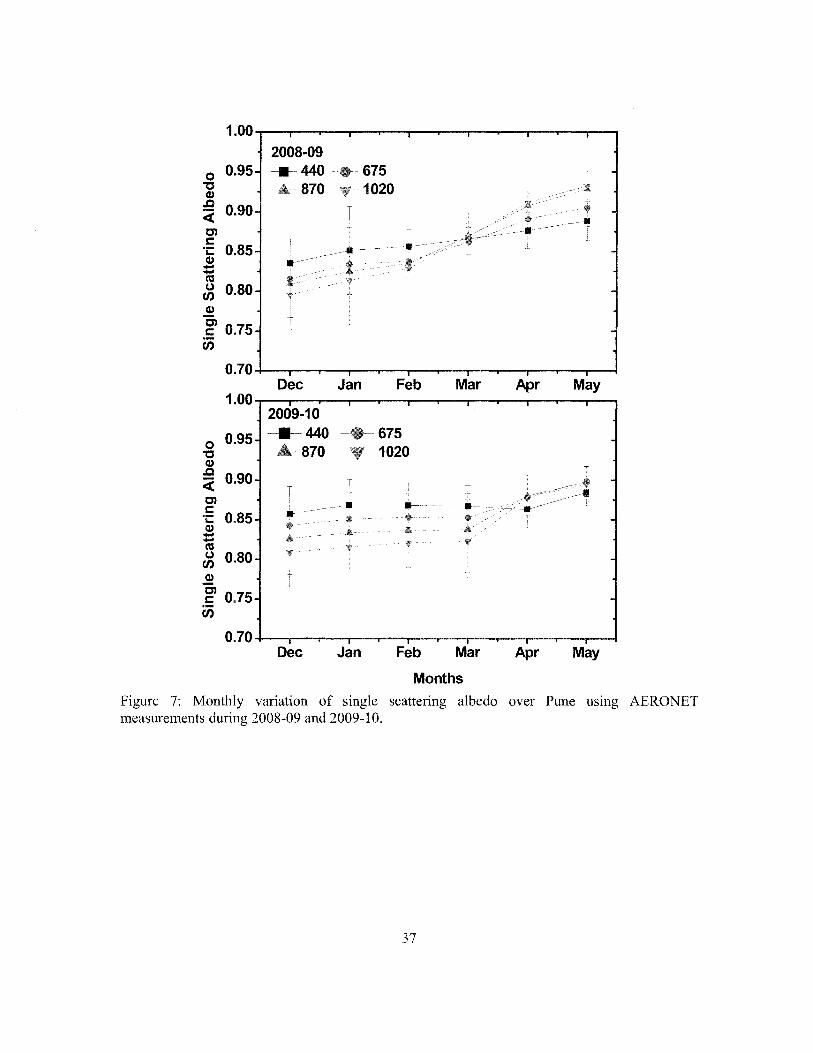
235 Mediterranean region. Monthly variation of SSA for the period of 2008-10 and 2009-10
236 is shown in Figure (7). It reveals that during 2008-09 there is a sharp increase in SSA
237 from Dec to May while the increase is moderate during 2009-10. Seasonal variation and
238 spectral dependence of SSA is well reflected in the monthly variation.
239 4.3 Inter-comparison between MODIS-AERONET -Microtops II Sun-photometer
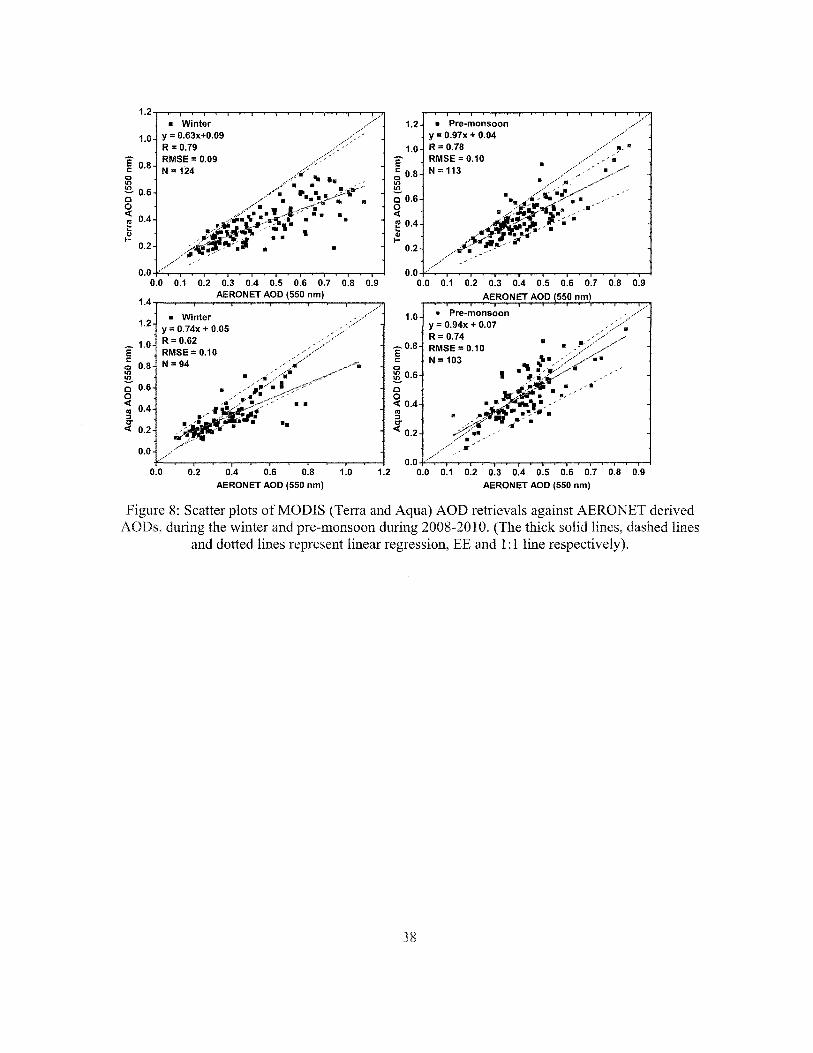
240 4.3.1 MODIS and AERONET
241 Figure (8) shows seasonal comparison of MODIS AOD retrievals against
242 AERONET derived AODs, during the winter (Dec-Feb, 2008-2010) and pre-monsoon
243 (Mar-May, 2009-2010). From the figure, it is seen that during winter the correlation
244 coefficient of linear regression fit (R) are 0.79 and 0.62 for Terra and Aqua respectively.
245 While during pre-monsoon the corresponding coefficients are 0.78 and 0.74. These
246 correlation coefficients are significant at 0.01 level. The root mean squared error (RMSE)
247 between the ground based AERONET and MODIS AODs lies in the range 0.09 to 0.10
248 for the data under study.
249 Intercepts of linear regression fit are 0.09 for Terra and 0.05 for Aqua during
250 winter whereas during pre-monsoon intercept values are 0.04 and 0.07 for Terra and
251 Aqua respectively. Slopes of the regressed lines, for Terra and Aqua are 0.63 and 0.74
252 respectively during winter and 0.97 and 0.94 (for Terra and Aqua respectively) during
253 pre-monsoon.
254 Results of regression model for MODIS derived AODs against AERONET
255 measurements at 550 nm during 200S-2009 and 2009-2010 are shown in Table II. It is
256 clear from the table that during 200S-2009 and 2009-2010, MODIS retrievals bear a good
257 correlation with AERONET measurements with correlation coefficients O.SO and 0.7S for
258 (Terra and Aqua respectively) during 200S-2009 while the corresponding coefficients are
259 0.70 and 0.73 during 2009-2010. Intercept oflinear regression model during 200S-2009
260 are 0.05 and -0.01 for Terra and Aqua respectively and the corresponding intercept
261 during 2009-2010 is 0.11 for both Terra and Aqua. Slopes of the regressed line are 0.S6
262 and 1.05 during 200S-2009 for Terra and Aqua respectively while during 2009-2010, the
263 corresponding slopes are 0.65 and 0.73.
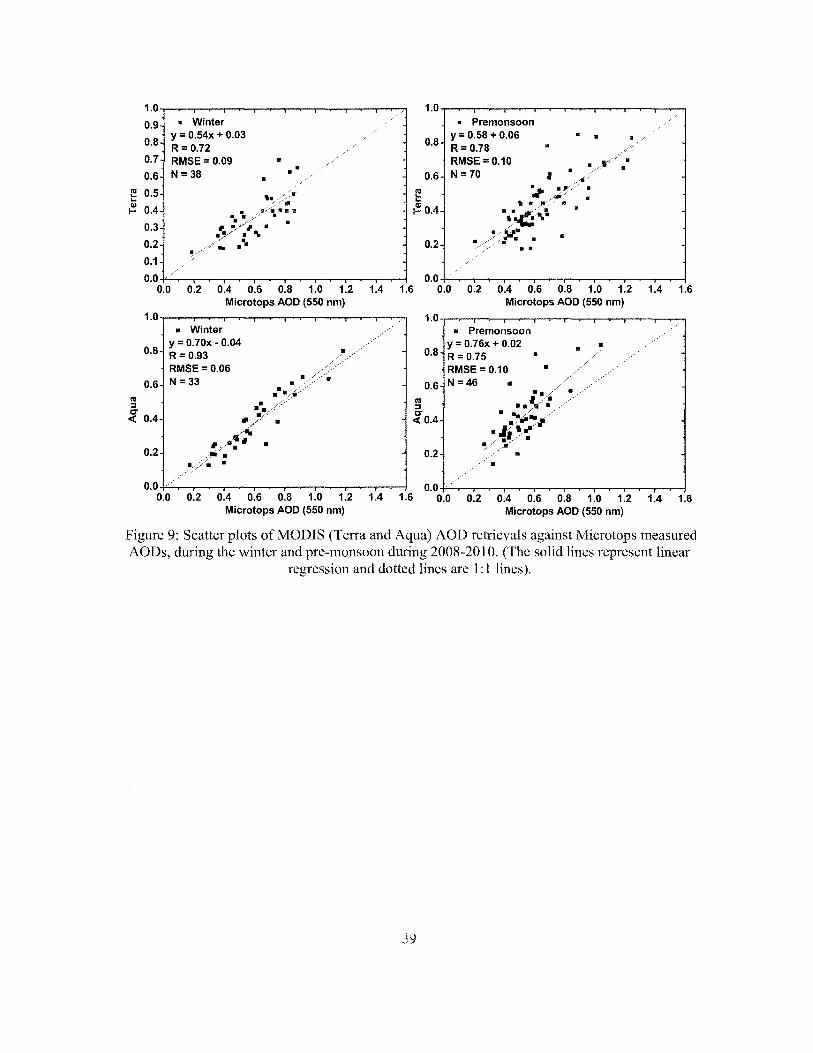
264 4.3.2 MODIS and Microtops II Sun-photometer
265 Figure (9) shows scatter plot of MODIS AOD retrievals against Microtops
266 measured AODs, during the winter (Dec-Feb, 200S-201O) and pre-monsoon (Mar-May,
267 200S-2010). MODIS AOD retrievals also show a good correlation with Microtops II sun-
268 photometer measurements. Correlation coefficients during winter are 0.73 and 0.93 while
269 are 0.78 Terra RMSE
3
270 between ground based Microtops II sun-photometer and MODIS AODs lie in the range
271 0.06 - 0.10 for winter and pre-monsoon during the study period.
272 Intercepts of the linear regression fit for MODIS and Microtops AODs are 0.03
273 for Terra and 0.04 for Aqua during winter whereas for pre-monsoon, intercept values are
274 O.OS and 0.09 for Terra and Aqua respectively. Slopes of the regressed lines are 0.S4 &
275 0.70 during winter and 0.S8 & 0.76 during pre-monsoon for Terra and Aqua respectively.
276 4.3.3 AERONET and Microtops Il Sun-photometer
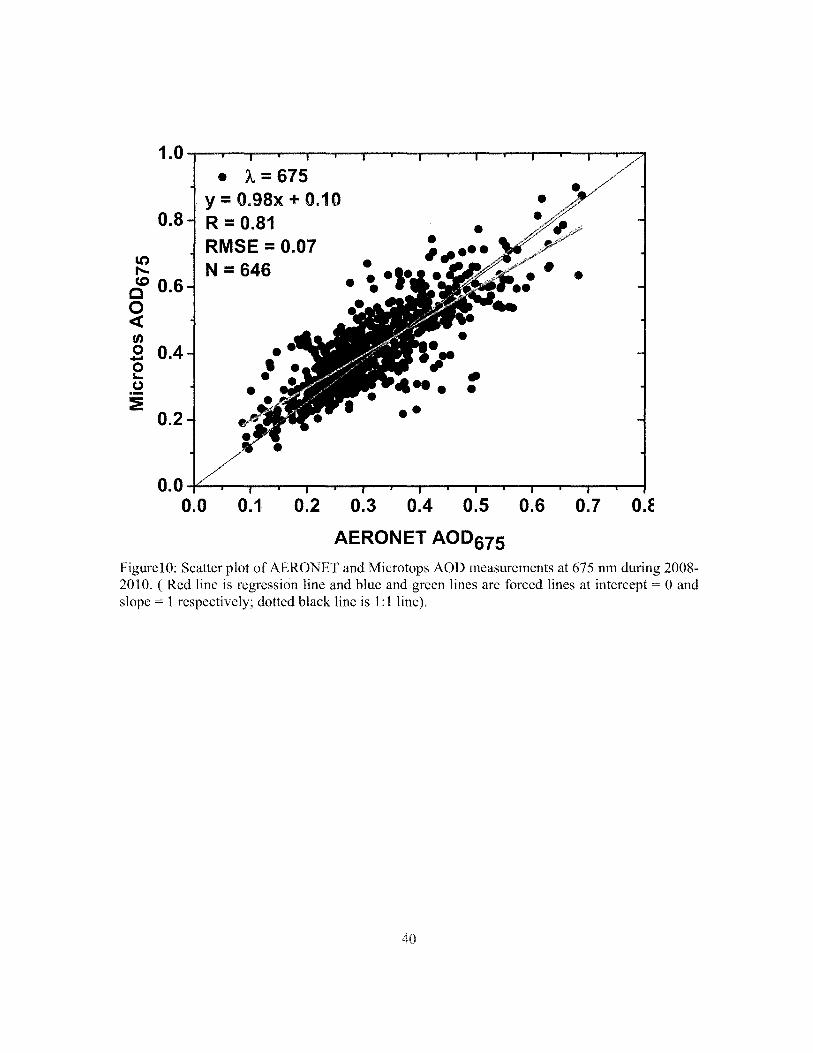
277 Figure (10) reveals the scatter plot of AERONET against Microtops at 67Snm for all
278 collocated data points during 2008-2010. The linear regression analysis between these
279 data points shows that the correlation coefficient is 0.81 while slope and intercept are
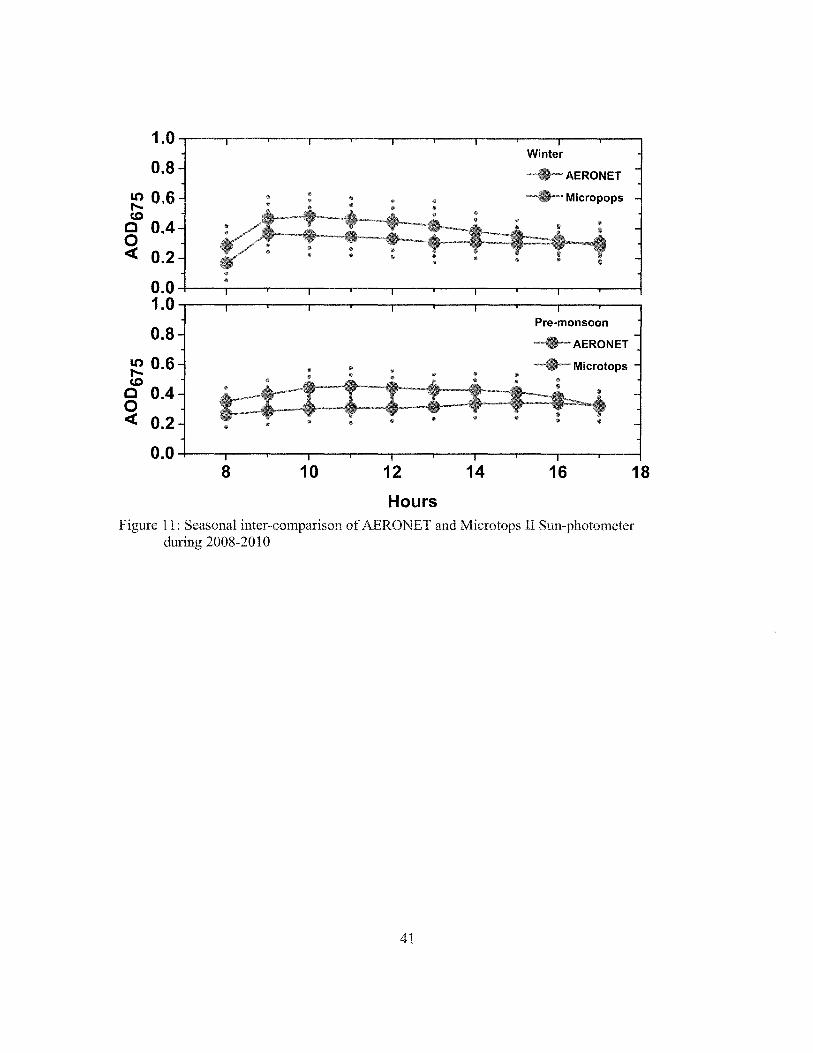
280 0.97 and 0.10 respectively. The seasonal inter-comparison between AERONET and
281 Microtops is shown in Figure (11). It is clear form the Figures (10 and 11) that,
282 Microtops AODs are consistently overestimating compared to those of the AERONET
283 AODs during winter and pre-monsoon over the study period with mean bias is about 0.1
284 in AOD.
285 From the Figures 8 and 9 it is clear that, the MODIS retrievals systematically
286 underestimate during winter and overestimate during pre-monsoon over Pune. Similar
287 results have been reported by lethva et al.,(200S) and Prasad and Singh (2007) over
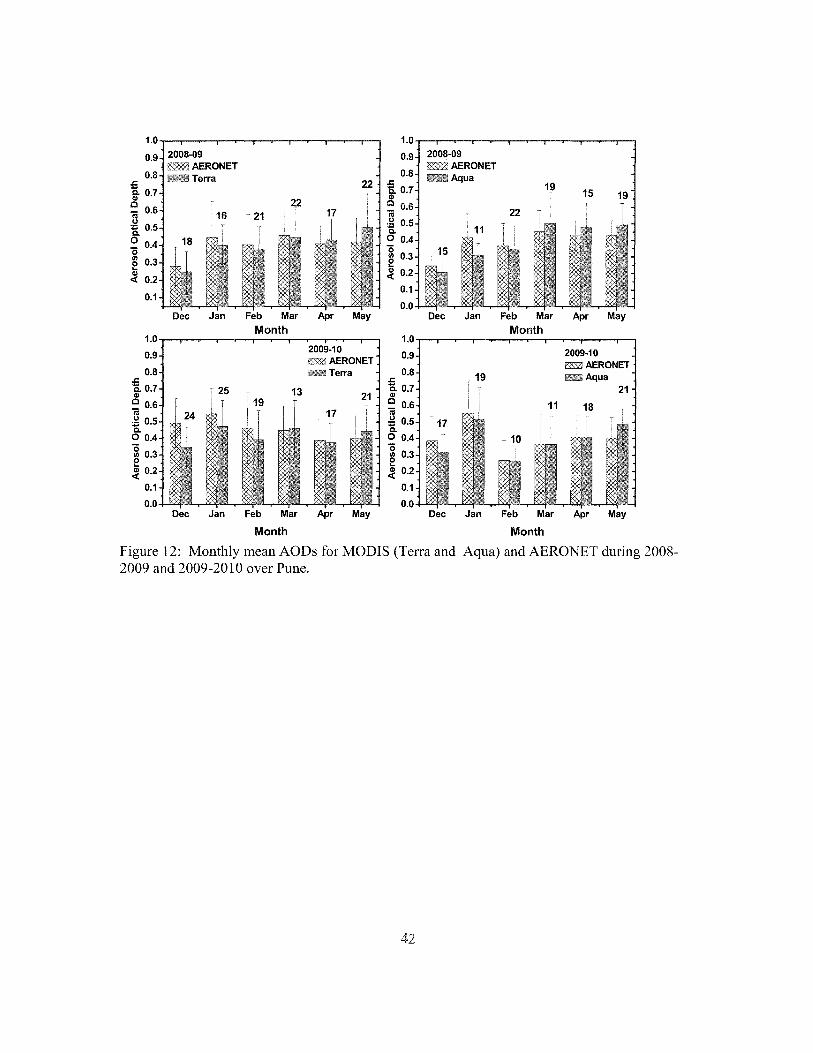
288 Kanpur. Monthly variation of AOD using MODIS and AERONET measurements shown
289 in Figure (12) also support this result.
290 The linear regression model for MODIS-AERONET (Fig. 8) and MODIS-Microtops II
291 9) and Table II show non-zero intercepts. This indicates that the retrieval algorithm
292 is biased at low AOD values which may be associated with a sensor calibration error or
293 an improper assumption about ground surface reflectance (Tripathi et ai., 2005; Zhao et
294 aI., 2002). Also, large errors in surface reflectance may lead to large intercepts (Tripathi
295 et aI., 2005; Chu et aI., 2002).
296 The inconsistency between aerosol microphysical and optical properties used in the
297 MODIS retrieval algorithm and that in the ground truth retrievals generated by
298 AERONET and Microtops is signified by the deviation of the slope from unity. Similar
299 observations have been reported by in other studies (i.e. Jing-Mie , 2010; Tripathi et aI.,
300 2005; Zhao et aI., 2002).
301 The effect of slope and intercept on the correlation of MODIS derived AODs with
302 AERONET and Microtops measurements shown in Figure (8) and Figure (9) is well
303 represented in the average monthly variation of AOD values from MODIS and
304 AERONET during the study period (2008-10) as shown in Figure (12). Error bars in the
305 figure represent standard deviation of AOD in the month which generally ranges between
306 0.05 - 0.2. The number of days used in the analysis is also indicated on bar chart. It is
307 clear from the figure that the variation patterns of both MODIS (Terra and Aqua) and
308 AERONET AOD data are well matched for both the years with MODIS AOD values
309 relatively lower than those of AERONET AOD values in winter i. e. in relatively low
310 dust period. While in dust loading period (pre-monsoon), MODIS AOD values are higher
311 or tend to be higher than the AERONET AODs. Similar observations have been reported
312 by Tripathi et aI., (2005).
313 As overpass time of MODIS Terra and Aqua are 10:30 and 1: 30 respectively the
314 monthly variation AERONET-Microtops-MODIS-Terra data sets corresponds to
15
315 monthly variation of AOD during morning hours and that of AERONET-Microtop-
316 MODIS-Aqua to monthly variation of AOD during afternoon. This may be regarded as
317 the diurnal asymmetry in AOD data. This has its origin in the meteorological conditions
318 over Pune. Weather conditions in Pune in winter are conducive to the formation of low
319 level capped inversion of 8 10° K per 100 meter in the atmospheric boundary layer
320 (ABL) during February and to some extent also in March. (Vernekar et aI., 1993,
321 Pandhurai et aI., 2007). High value of AOD in January/February for Terra and Microtop
322 is produced by the processes such as atmospheric moisture precipitating as haze particles
323 on cold mornings in winter, inversion episodes and the influx of aerosol due to
324 atmospheric circulation as discussed in NCEP/NCAR reanalysis mean vector wind
325 composites at 850 hPa for winter and pre-monsoon seasons (Figure 1). April/May
326 maximum in AOD is normal pre-monsoon high. High value of AOD in pre-monsoon is
327 also a global feature attributed to increased aerosol inputs due to surface heating, wind-
328 blown dust and influx of aerosols (Holben et aI., 2001)
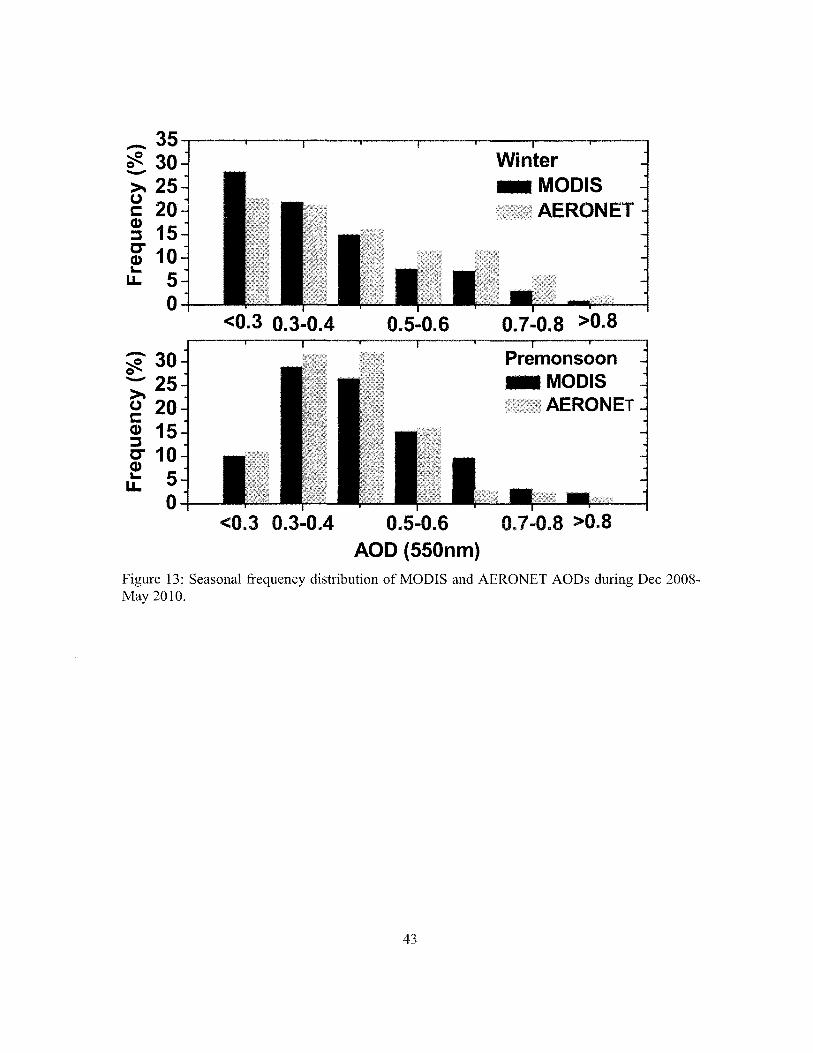
329 Seasonal frequency distribution for collocated data points of Terra and Aqua of
330 MODIS and AERONET measured values for 2008-09 and 2009-10 presented in Figure
331 (13). It is clear from the figure that, the frequency distribution is maximum at the range
332 AOD < 0.3 and 0.3-0.4 during winter and pre-monsoon respectively. During winter in the
333 range of AOO < 0.3-04 the frequencies of MODIS AODs are higher than those of
334 AERONET AODs while during pre-monsoon reverse of this case can be seen clearly.
335 The frequencies of MODIS AODs during pre-monsoon found lower than those of
336 AERONET AODs at the range of AOD <0.3-0.5. Maximum frequency difference is 5.86
337 for winter and 7.04 % during pre-monsoon.
338 In the range of AOD > 0.5 MODIS AODs are consistently lower than AERONET
339 AODs during winter while in pre-monsoon in the AOD range> 0.6 MODIS AODs are
340 consistently higher than AERONET AODs. The frequency distribution pattern also
341 supports the underestimation of AOD by MODIS during winter and overestimation
342 during pre-monsoon.
343 5. Summary and Conclusion
344 The paper presents the comparison of MODIS AODs (Terra and Aqua) retrievals with
345 ground-based measurements made by AERONET and Microtops II sun-photometer for 2
346 years over a tropical urban station, Pune. The main conclusions from the study are:
347 1. Higher value of a during winter is associated with low AODs and an opposite
348 trend is found to prevalent during pre-monsoon. This confirms occurrence of fine
349 and coarse mode particles during these seasons.
350 2. Aerosol volume size distribution is shows a bimodal distribution during both
351 winter and premonsoon seasons. The volume concentration of coarse mode
352 particles in pre-monsoon is 1.5 times higher as compared to that winter. Similarly,
353 volume concentration of fine mode particles is nearly same in both winter and
354 pre-monsoon. Bimodal structure of volume size distributions indicates the
355 presence of a mixture of aerosols from multiple sources during respective seasons
356 in the atmosphere over Pune.
357 3. The SSA observer over Pune is found to be highly wavelength dependent. It
358 decreases with wavelength in winter indicating the dominance of absorbing
359 mainly arising from vehicular pollution, industrial biomass
17
360 burning. During pre-monsoon an opposite trend is observed showing the presence
361 of coarse mode particles which may be due to construction activity, wind blown
362 dust and strong surface heating.
363 4. The MODIS AOD retrievals are well correlated with the AERONET and
364 Microtops measurements as indicated by the high correlation coefficients. These
365 are found to be 0.79 for Terra and 0.62 for Aqua during winter; 0.78 for Terra and
366 0.74 for Aqua during pre-monsoon against AERONET data. The corresponding
367 values for Microtops measurements are 0.72 for Terra and 0.93 for Aqua during
368 winter; 0.78 for Terra and 0.75 for Aqua during pre-monsoon with small
369 intercepts.
370 5. MODIS AODs underestimate during winter and overestimate during pre-monsoon
371 with respect to the AERONET and Microtops measurements with slopes less than
372 unity (0.63 for Terra and 0.74 for Aqua during winter; 0.97 for Terra and 0.94 for
373 Aqua during pre-monsoon against AERONET and 0.54 for Terra and 0.70 for
374 Aqua during winter; 0.58 for Terra and 0.76 for Aqua during pre-monsoon against
375 Microtops II sun-photometer).
376 6. Average monthly variation of AODs of MODIS and AERONET shows a similar
377 pattern of variation with MODIS AOD values systematically less than those of
378 AERONET during winter and higher during pre-monsoon. High AODs are
379 observed during January/ February and April/May. Jan! Feb high is mainly due to
380 higher relative humidity during morning hours, light wind and associated low
381 level capped inversions in the morning. Higher AOD values in April/May are
8
382 associated with increased aerosol inputs due to surface heating, wind-blown dust
383 and influx of aerosols
384 7. Microtops AODs are consistently overestimating than those of AERONET AODs
385 during the study period with mean bias is about 0.1 in AOD.
386 8. Although, there is systematic error in the MODIS products which needs further
387 investigation. In spite of this, results presented in the present paper indicate that
388 the Terra and Aqua MODIS retrievals are capable of characterizing AOD
389 distributions over tropical urban region Pune.
390
391 Acknowledgements:
392 MODIS data were obtained from the Level I and Atmosphere Archive and Distribution System (LAADS) at Goddard Space Flight
393 Center (GSFC) .• The authors would like to thank UOC and DST authorities for providing the
394 research grant under the Major Research Scheme and PURSE programme respectively.
395 Authors thank the AERONET federation and scientific team for the ground data.
396
397
398
399
400
401
402
403
404
406 References:
409 Ackerman, T. P., & Toon O. B. (1981). Absorption of visible radiation in atmosphere
410 containing mixtures of absorbing and non-absorbing particles. Appied Optics, 20, 3661-
411 3668, doi: 10. 1364/A0.20.00366 1.
410
414 Aloysius M., Mohan M., Babu S. S., Parameswaran K., & Moorthy K. K. (2009).
415 Validation of MODIS derived aerosol optical depth and an investigation on aerosol
416 transport over South East Arabian Sea during ARMEX-II. Annales Geophysicae, 27,
417 2285-2296.
415
418 Cheng T., Liu Y., Liu D., Xu Y., & Li H. (2006). Aerosol properties and radiative
419 forcing in Hunshan Dake Desert; northern China. Atmospheric Envronment, 40, 2169-
420 2179, doi:lO.l016/j.atmosenv.2005.11.054.
419
422 Chu D. A., Kaufman Y. 1., Ichoku c., Remer L. A., Tanre D., & Holben B. N. (2002).
423 Validation of MODIS aerosol optical depth retrieval over land. Geophysical Research
424 Letters, 29 (12), 1617-1621 doi: 10.1029/2001GL013205.
423
427 Devara P. C. S., Maheskumar R. S., Raj P. E., Dani K. K., & Sonbawne S. M., (2001).
428 Some features of columnar aerosol optical depth, ozone and precipitable water content
429 observed over land during the INDOEX-IFP 9. Meterologische ZeitschriJt, 10 (2), 123-
430 130.
428
428 Dubovik 0 & King M. D. (2000). A flexible inversion algorithm for retrieval of aerosol
429 optical properties form sun and sky radiance. Journal of Geophysical Research, 105
430 (DI6),20673-20696.
431
432 Dubovik 0., Holben B. N., King M. D., Tanre D., & Slutsker I. (2002). Variability of
433 absorption and optical properties of kaey aerosol types observed in world wide locations.
434 Journal of Atmospheric Science, 59, 590-608.
435
436 Eck T., Holben B. N., Reid 1., Dubovik 0., Smirnov A., O'Neill N., Slutsker 1., & Kinne
437 S. (1999). Wavelength dependence of the optical depth of biomass burning, urban, and
438 desert dust aerosols. Journal of Geophysical Research, 104,31333-31349.
439
440 Holben B. N., Eck T. F., Slutsker I., Danre D., Buis 1. P., Setzer A., Vermote E., Reagan
441 J. A., Kaufman Y. J., Nakajima T., Lavenu F., Jankowiak 1., & Smirnov A. (1998).
442 AERONET -A federated instrument network and data archive for aerosol characterization.
443 Remote Sensing of Environment, 66, 1-16.
444
445 Hoppel W. A., Fitzgerald & Larson R. R. (1985). Aerosol size distribution in air mass
446 advecting off the east coast of the United States. Journal of Geophysical Research, 90,
447 2365-2379
448
449 Hyer E. J., Reid J. S., & Zhang J. (2011). An over-land aerosol optical depth data set for
450 data assimilation by filtering, correction, and aggregation of MODIS Collection 5 optical
451 depth retrievals. Atmospheric Measurement Techniques, 4 (379), 379-408 doi:
452 10.5194/amt-4-379-2011
453
454 Ichoku C., Chu D. A., Mattoo S., Kaufman Y. J, Remer L. A., Tanre D., Slutsker I., &
455 Holben B. N. (2002a). A spatio-temporal approach for global validation and analysis of
456 MODIS aerosol products. Geophysical Research Letters, 29 (12), MOOl-l- MOO 1-4,
457 doi: 10/1029/2001GL013206
458
459 Ichoku c., Levy R., Kaufman Y. 1., Remer L. A., Li R. R., Martins V. J., Holben B. N.,
460 Abuhassan N., Slutsker 1., Eck T. F., & Pietras C. (2002b). Analysis of the performance
461 characteristics of the five-channel Microtops II sun photometer for measuring aerosol
462 optical thickness and precipitable water vapour. Journal of Geophysical Research, 107
463 (013),4179, doi: 10.1029/200110001302.
464
465 Jacobson M. Z. (2000). A physically based treatment of elemental carbon optics:
466 Implications for global direct forcing of aerosols. Geophysical Research Letters, 27, 217-
467 220
468
469 Jethva H., Satheesh S. K., & Srinivasan J. (2005). Seasonal variabilities over the Indo-
470 Gangatic basin. Journal of Geophysical Ressearch, 110, 021204, doi
471 1O.1029/2005J0005938.
472
22
473 Jing-Mai A., Jin-Auan Q., & Yan-Liang Y. (2010). Validation of aerosol optical depth
474 from Terra and Aqua MODIS retievelas over a tropical coastal site in China. Atmospheric
475 and Oceanic Science Letters, 3 (1), 36-39.
476
477 Kahn R.A, Gaitley B. 1., Garay M. J., Diner D. J., Eck T., Smirnov A., and Holben B.
478 N. (2010). MISR global aerosol product assessment by comparison with Aerosol Robotic
479 Network. Journal of Geophysical Research, 115, D23209, doi:1O.1029/2010JD014601
480
481 Kaufman, Y. 1., Tanre D., Ramer L. A, Vermote, E. F., A Chu., & Holben B. N. (1997).
482 Operational remote sensing of tropospheric aerosols over land from EOS moderate
483 resolution imaging spectroradiometer. Journal of Geophysical Research, 102(DI4),
484 17051-17067
485
486 Kaufman, Y. J., Tanre D., & Boucher O. (2002). A satellite view of aerosols in the
487 climate system. Nature, 419,215-223.
488
489 King M. D., Kaufman Y. J., Menzel W. P., & Tanre D .(1992). Remote sensing of Cloud,
490 Aerosol, and Water vapour properties from the Moderate Resolution Imaging
491 Spectroradiometer (MODIS). IEEE Transactions on Geoscience and Remote Sensing, 30
492 (1), 2-26
493
494 King M. D., Menzel W. P., Kaufman Y. J., Tanre D., Gao B., Platnick S., Ackerman S.
495 A, Remer L. A., Pincus R., & Hubanks P. A. (2003). Cloud and Aerosol Properties,
496 Precipitable Water, and Profiles of Temperature and Water Vapor from MODIS. IEEE
497 Transactions on Geoscience and Remote Sensing, 41, 442-458.
498
499 Levy R. c., Remer L. A., Marines J. V., & Kaufman Y., J. (2005). Evaluation of the
500 MODIS Aerosol Retrievals over Ocean and Land during CLAMS. Journal of
501 Atmospheric Science, 62, 974-992.
502
503 Levy R. C., Remer L. A., Mattoo S., Vermote E., F., & Kaufman Y. J. (2007a). Second-
504 generation operational algorithm: Retrieval of aerosol properties over land from inversion
505 of Moderate Resolution Imaging Spectroradiometer spectral reflectance. Journal of
506 Geophysical Research, 112, D 13211, doi: 10.1 029!2006JD007811
507
508 Levy R. C., Remer L. A., & Dubovik O. (2007b). Global aerosol optical properties and
509 application to Moderate Resolution Imaging Spectroradiometer aerosol retrieval over
510 land. Journal of Geophysical Research, 112, D13210, doi:l0.1029!2006JD007815
511
512 Lyamani H., Olmo F. 1., Alcantara & Alados-Arboledas L. (2006). Atmospheric aerosols
513 during 2003 heat wave in southwestern Spain: Microphysicsl Columnar properties and
514 radiative forcing. Atmospheric Environment, 40. 6465-6476,
515 doi: 10.10 16!j .atmosenv.2006.04.048.
516
517
518 Misra A., Jayraman A., & Ganguly O. (2008). Validation of MOOIS derived aerosol
519 optical depth over Western India. Journal of Geophysical Research, 113, 004203, doi
520 10.1029/2007J0009075.
521
522 Morys M., F. M. Mims Ill., Hagerup S., Anderson S. E., Baker A., Kia J., & Walkup T.
523 (2001). design, calibration and performance of MICROTOPS II hand held ozone monitor
524 and sun photometer. Journal of Geophysical Research, 106, 013, doi:
525 10.1029/200110900103
526
527 Pandithurai G., Pinkaer R. T., Oevara P. C. S., Takamura T., & Oani K K (2007).
528 Seasonal asymmetry in diurnal variation of aerosol optical characteristics over Pune,
529 western India. Journal of Geophysical Research, 112, 008208, doi
530 10.1029/2006J0007803.
531
532 Prasad A. K, Sing R. P., & Sing A. ( 2004). Variability of Aerosol Optical Oepth Over
533 Indian Subcontient Using MOOIS Oata. Journal of Indian Society of Remote Sensing, 32
534 (4)
535
536 Prasad A. K, & Singh R. P. (2007). Comparison of MISR-MOOIS aerosol optical depth
537 over INOO-Gangatic basin during the winter and pre-monsoon seasons (2000-2005).
538 Remote Sensing of Environment, 107, 109-119.
539
540
25
541 Remer L. A., & Kaufman Y. J. (1998). Dynamic aerosol model: Urban/industrial
542 aerosol. Journal of Geophysical Research, 103 (0 12), 13,859-13,871.
543
544 Remer L. A., Kaufman Y. J., Tanre D., Mattoo S., Chu D. A., Martines 1. V., Li R. R.,
545 Ichoku C., Levy R. C., Kleidman R. G., Eck T. F., Vermote E., & Holben B., N. (2005).
546 The MODIS Aerosol Algorithm, products, and validation. Journal of Atmospheric
547 Science, 62, 947-973.
548
549 Retalis A., Hadjimitsis D. G., Michaelides S., Chrysoulakis N., Clayton C. R. 1., &
550 Themistocleous K. (2010). Comparison of aerosol optical thickness with in situ visibility
551 data over Cyprus. Natural Hazards and Earth System Science, 10,421-428.
552
553 Schaap M., Timrnermans R. M. A., Koelemeijer R. B. A., Leeuw G. De., & Builtjes P. J.
554 H. (2008). Evaluation of MODIS aerosol optical thickness over Europe using sun
555 photometer observations. Atmospheric Environment 42, 2187-2197.
556
557 Singh R. P., Day S., Tripathi S. N., & Tare V. (2004). Variability of aerosol parameters
558 over Kanpur, northern India. Journal of Geophysical Research, 19 (023206), doi:
559 10.1 029/2004JD004966
560
561 Smirnov A., Holben B. N., Dubovik 0.,0' NiH N. T., Eck T. F., Westphal D. L., Goroch
562 A. K., Pietras c., & Slutsker I. (2002). Atmospheric Aerosol Optical Properties in the
563 Persian Gulf. Journal of Atmospheric Science, 59, 620-634.
564
565 Sumit K., Devara P.C.S., Dani K.K., Sonbawne S.M., & Saha S.K. (2011). Sun-sky
566 radiometer-derived column-integrated aerosol optical and physical properties over a
567 tropical urban station during 2004-2009. Journal of Geophysical Research, 116
568 (D10201), doi:lO.l029/201OJD014944.
569
570 Tanre D., Kaufman Y. J., Herman M., & Mattoo S. (1997). Remote sensing of aerosol
571 properties over oceans using the MODIS/EOS spectral radiance. Journal of Geophysical
572 Research, 102(D14), 16971-16988.
573
574 Tripathi S. N., Day S., Chandel A., Srivastava S., Sing R. P., & Holben B. N. (2005).
575 Comparision of MODIS and AERONET derived aerosol optical depth over Ganga Basin,
576 India. annals Geophysicae, 23, 1093-1101.
577
578 Venkataraman c., Habib G., Femande A., Miguel A. H., & Friedlander S. K. (2005).
579 Residential Biofuels in South Asia: Carbonaceous Aerosol Emissions and Climate
580 Impacts. Science, 307 (5714), 1454-1456.
581
582 Vemeker K. G., Mohan B., Saxena S., & Patil M. N. (1993). Characteristics of the
583 atmospheric boundary layer over a tropical station as evidenced by tethered balloon
584 observations. Journal of Applied Meteorology, 32, 1426-1432.
585
586
27
587 Xia X., Wang P., Chen H., Philippe G. & Zhang W. (2005). Ground based remote
588 sensing of aerosol optical properties over north China in Spring. Journal of Remote
589 Sensing, 9 (4), 429-437.
590
591 Zhao T. X. -P., Stowe L. L., Smimov A., Crosby S., Sapper J., & McClain C. (2002).
592 Development of a Global Validation Package for Satellite Oceanic Aerosol Optical
593 Thickness Retrieval Based on AERONET Observations and Its Application to
594 NOAAlNESDIS Operational Aerosol Retrievals. Journal of Atmospheric Science, 59,
595 294-312
28
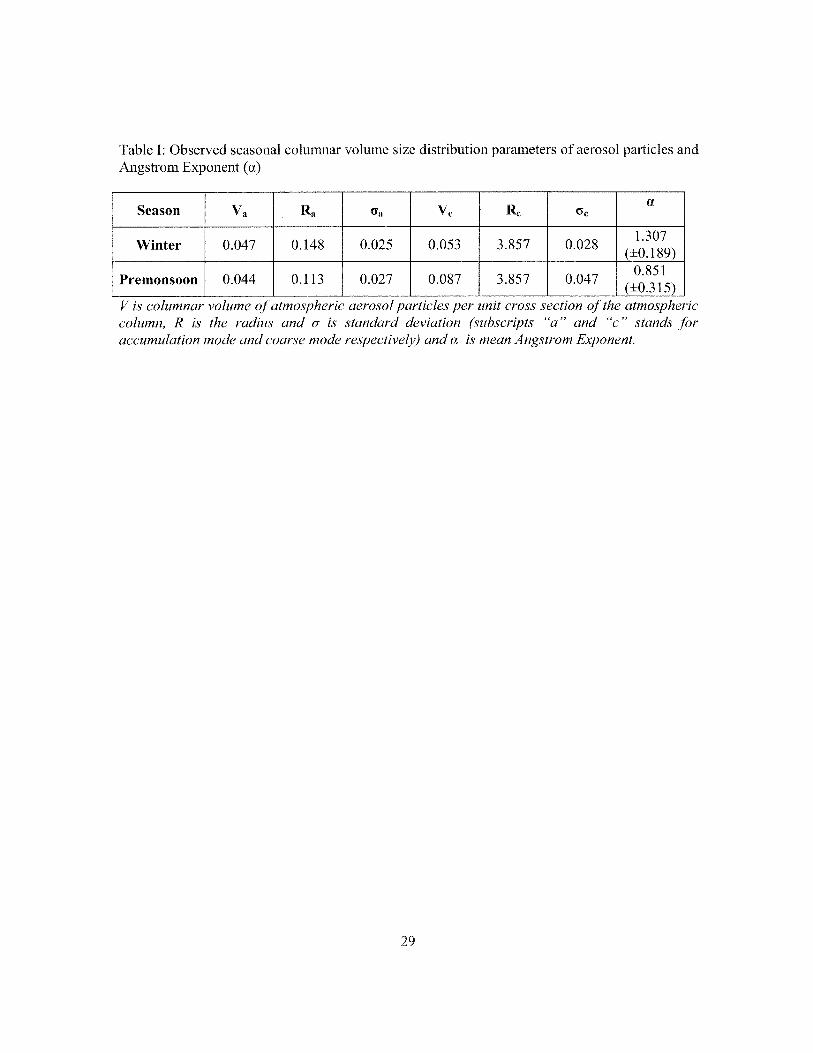
Table I: Observed seasonal columnar volume size distribution parameters of aerosol particles and Angstrom Exponent (a)
Season Va Ra Vc Rc a
O'a O'c
Winter 0.047 0.148 0.025 0.053 3.857 0.028 1.307
(±0.189)
Premonsoon 0.044 0.113 0.027 0.087 3.857 0.047 0.851
(±0.315) V is columnar volume of atmospheric aerosol particles per unit cross section of the atmospheric column, R is the radius and (J is standard deviation (subscripts "a" and "c" stands for accumulation mode and coarse mode respectively) and (X is mean Angstrom Exponent.
29
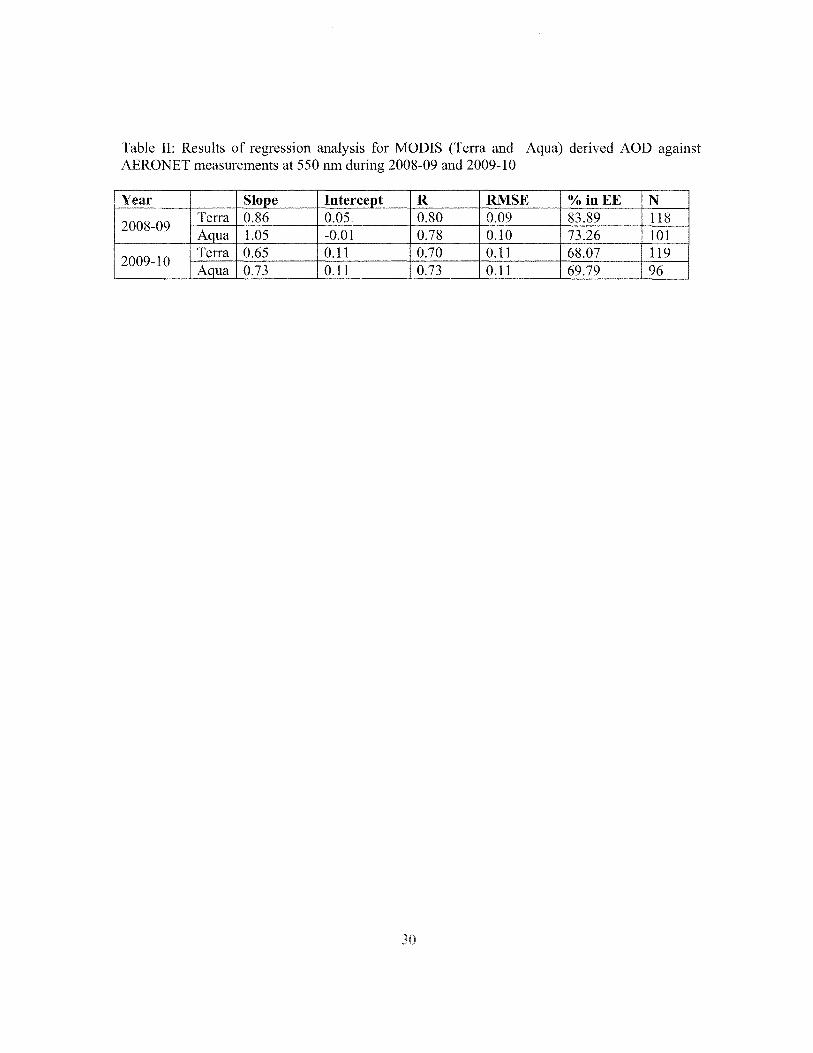
Table II: Results of regression analysis for MODIS (Terra and Aqua) derived AOD against AERONET measurements at 550 nm during 2008-09 and 2009-10
Year Slope Intercept R RMSE %in EE N
2008-09 Terra 0.86 0.05 0.80 0.09 83.89 118 Aqua 1.05 -0.01 0.78 0.10 73.26 101
2009-10 Terra 0.65 0.11 0.70 0.11 68.07 119 Aqua 0.73 0.11 0.73 0.11 69.79 96
10
Figure 1:- NCEP /NCAR reanalysis mean vector wind composites at 850 hPa level for winter and pre-monsoon season during 2008-09 and 2009-10
31
184S'(J"N
1825'0"1'1
o 18 HYO'N
n'35'O'E
5 10 Kilometers I
734(J(JE 7345'(fE 7350'O'E
740'O'E
Legend
• center
Classified satellite Walertxldy
Se!t!ement (1302%)
Fallow land (39,42%)
Dense scrub (2088%)
Aglicutlure tand (15,96%)
1840'O'N
183S'O'N
HI30'O'N
1525'O'N
1820'O'N
18' !,;'Q'N
1!110'O'N
Figure 2: Land cover and land use ofthe study region (50 x 50 grid box)
32
1 800 0.9 ---- Winter (a) c::::J Winter (b) 0.8 --*-- Premonsoon 700 _ Premonsoon 0.7 0.6 600 0.5
0.4 " ~ 500
~ 0.3 , roo ''I!r
-'-'I!r
300
0.2 200
100
0.1 0 ...................... 0.4 0.5 0.6 0.70.80.9 11.1 0.0 0.5 1.0 1.5 2.0
Wavelength Angstrom Exponent Figure 3: (a) Spectral variation of AOD and (b) frequency distribution of Angstrom exponent over Pune using AERONET measurements for the period Dec 2008 - May 2010,
1.4 c o « 1.2 -.... ; 1.0 c o Co >< 0.8 w E e 0.6 .... t/) en c 0.4 «
0.2
---440
Q--2 870 2---- _____ I-o-al
2~
Dec Jan Feb Mar Months
~-----Cd
Apr May
Figure 4: Monthly mean value of aerosol optical depth and Angstrom exponent (a) using AERONET data during Dec 2008-May 2010.
0.14 0.13 0.12 0.11
_ 0.10 N
E 0.09 ,..,..2- 0.08 [ 0.07 ::- 0.06 ~ 0.05 :> 0.04 '"C 0.03
0.02 0.01 0.00
-0.01
---Winter Premonsoon
0.1 1 Radius (/Jm)
10 100
Figure 5: Seasonal variation of aerosol columnar volume size distribution over Pune using AERONET measurements during the period Dec 2008 May 20lO.
0.90 -+-......... --''---..L.---'---'_-'----'-----L_.i..---'-----'-_.L-...L.---'----1
0.89 -SO 0.88 -o -g 0.87 ..a <C 0.86 C)
c: 0.85 'i: Q)
~ 0.84 (.)
CJ) 0.83 Q)
C)
.: 0.82 CJ)
0.81
-.-Winter ~.~ Premonsoon
•
.---------.~
•
0.80 -+--.,-~-,...__-r-----r----,~..,--__r___r-r---r-__r_--,-.....--I 400 500 600 700 800 900 1000 1100
Wavelength Figure 6: Wavelength dependency of single scattering albedo over Pune using AERONET
measurements for the period Dec 2008 May 2010.
36
1.00 2008-09
0 0.95 _____ 440 675 "0 870 1020 (I) .Q
0.90 T « -. en i --~~~-.> -Uc·-
c:: i 'i: 0.85 -_ ..... -.......... _ ...... ....
/ !
(I) .. ~/',
~ .-~
! ta • u 0.80 en ~ en c:: 0.75 en
0.70 Dec Jan Feb Mar Apr May
1.00 2009-10
0.95 -11-440 675 0 Ar·870 1020 "0 (I)
.Q 0.90 « • en T • -----..--"~,
c:: __ --IJ -IJ- - ~ --IJ --~-.~-<~;. ..... ---- !
'i: 0.85 ...... -
• • -. (I) A A ~ ta u 0.80 en ~ en c:: 0.75 en
0.70 Dec Jan Feb Mar Apr May
Months
Figure 7: Monthly vanatIOn of single scattering albedo over Pune using AERONET measurements during 2008-09 and 2009-10.
1.2 '--"'-'~-'-~.-~'---'--r~-.-~.,.... ........ ~-'-.... -::'1 ••
• Winter ..... . 1.0 Y = 0.63x+0.09
R = 0.79 RMSE = 0.09 N = 124 f 0.8
Q In
e 0.6 Q o « 0.4 ~ ~
0.2 •
• •
..... 0.0 -I"'-.,......,,---.-,-~-.--~,--."'"'"'T~-r-~.,.-...-,....-.-,--I
0.0 0.1 0.2 0.3 0.4 0.5 0.6 0.7 0.8 0.9 AERONET AOD (550 nm)
1.4-r-~--''--~-'--~-'--~-'''-~--'-~71
_ 1.0 E
• Winter 1.2 Y = 0.74x + 0.05
R=0.62 RMSE= 0.10
I: Q 0.8 In e Q 0.6
~ .. 0.4 ::l
:[ 0.2
0.0
N =94
....
•
••
1.2
1.0
E .; 0.8 In In
0'0.6 o « f! 0.4
~ 0.2
• Pre-monsoon Y = 0.97x + 0.04 R= 0.78 RMSE = 0.10 N = 113
. ..•.... . .......... .
• ••••••.••• ~ ... IJ
.......... ...;. ....
0.0 -I"'-.,......, ........ -,-~-.--~,--."'"'"'T~-r-~.,--...-,~-,--I 0.0 0.1 0.2 0.3 0.4 0.5 0.6 0.7 0.8 0.9
1.0
AERONET AOD (550 nm)
• Pre-monsoon Y = 0.94x + 0.07 R = 0.74
E 0.8 RMSE = 0.10 I: N = 103
Q eO•6 Q o « 0.4 .. ::l C'
« 0.2
...... 0.0 +-........,....-.-,-~-.-~,--."'"'"'T~-r-~.,--...-,~-,--l
0.0 0.2 0.4 0.6 0.8 1.0 1.2 0.0 0.1 0.2 0.3 0.4 0.5 0.6 0.7 0.8 0.9 AERONET AOD (550 nm) AERONET AOD (550 nm)
Figure 8: Scatter plots of MODIS (Terra and Aqua) AOD retrievals against AERONET derived AOOs, during the winter and pre-monsoon during 2008-2010. (The thick solid lines, dashed lines
and dotted lines represent linear regression, EE and 1: 1 line respectively).
C! ... <II I-
til ;:,
1.0
0.9
0.8
0.7
0.6
0.5
0.4
0.3
0.2
0.1
0.0
• Winter y = O.54x + 0.03 R= 0.72 RMSE= 0.09 N=38 •
• •
0.0 0.2 0.4 0.6 0.8 1.0 1.2
1.0
0.8
0.6
Microtops AOD (550 nm)
• Winter y = 0.70x - 0.04 R= 0.93 RMSE = 0.06 N =33
0.8
0.6
~ ~0.4
0.2
• Premonsoon y = 0.58 + 0.06 R=0.78 RMSE = 0.10 N =70
•
0.0 +-~-r--'-"-~"'-~-'-~-r-~-,-~....,...-.--l 1.4 1.6 0.0 0.2 0.4 0.6 0.8 1.0 1.2
0.8
0.6
Microtops AOD (550 nm)
• Premonsoon y = 0.76x + 0.02 R= 0.75 RMSE =0.10
• •
N =46 • • a/-:./ .. ,,{:
• /
/
•......
•
1.4 1.6
~ 0.4
til ;:,
~0.4 ... .:- .'
." ".' 0.2
. ~""'. ~/ ...•. , • 0.2
• 0.0 +-~-r-"""--r-"""-""'-"""--r-"""--r-""--r--""--r--.,...-j 0.0 +-~-'--"""--'--"""--r-"""-"-""-r-""-r-""-'--.,...-j
0.0 0.2 0.4 0.6 0.8 1.0 1.2 1.4 1.6 0.0 0.2 0.4 0.6 0.8 1.0 1.2 1.4 1.6 Microtops AOD (550 nm) Microtops AOD (550 nm)
Figure 9: Scatter plots of MODIS (Terra and Aqua) AOD retrievals against Microtops measured AODs, during the winter and pre-monsoon during 2008-2010. (The solid lines represent linear
regression and dotted lines are 1: 1 lines).
1.0
• A= 675 Y = 0.98x + 0.10
0.8 R = 0.81 • RMSE = 0.07
II) N =646 ...... • ~ 0.6
0 < t/J 0 0.4 -0 • '-(.) • . -:E •• 0.2
o.o~~~~~~~~~~~~--~~~~~~
0.0 0.1 0.2 0.3 0.4 0.5 0.6 0.7 O.f
AERONET AOD675 FigurelO: Scatter plot of AERONET and Microtops AOD measurements at 675 nm during 2008-2010. ( Red line is regression line and blue and green lines are forced lines at intercept = 0 and slope = 1 respectively; dotted black line is 1: 1 line).
1.0 Winter
0.8 AERONET
~ 0.6 Micropops
U)
c 0.4 0 <C 0.2
0.0 1.0
Pre-monsoon 0.8
AERONET
II) 0.6 I"-
Microtops U)
c 0.4 0 <C 0.2
0.0 8 10 12 14 16 18
Hours Figure 11: Seasonal inter-comparison of AERONET and Microtops II Sun-photometer
during 2008-2010
41
1.0 1.0
0.9 2008-09 0.9 2008-09 ~AERONET
0.8 ~AERONET
.c .c Aqua 19 C. C. 0.7 15
Q) Q) 19 c ~ 0.6 iU t'O 22 0 ,g 0.5 a Co
0 o 0.4 "0 "0
'" '" 2 2 Q)
Q) « «
Dec Jan Feb Mar Apr May Dec Jan Feb Mar Apr May
Month Month
2009-10 2009-10 i83l2l AERONET i83l2l AERONET
Terra _ 19 Aqua :[ .c
C. 21 Q) Q)
c c I iU 0 a 0
Dec Jan Feb Mar Apr May Dec Jan Feb Mar Apr May
Month Month
Figure 12: Monthly mean AODs for MODIS (Terra and Aqua) and AERONET during 2008-2009 and 2009-2010 over Pune.
_ 35 ?fl. 30 - Winter >. 25 _MODIS g 20 AERONET ~ 15 g 10 ~
5 u. 0
<0.3 0.3-0.4 0.5-0.6 0.7-0.8 >0.8
~ 30 Premonsoon 0
_MODIS - 25 >. AERONET (.) 20
c: cP 15 ::l C" 10 ~ 5 u.
0 <0.3 0.3-0.4 0.5-0.6 0.7-0.8 >0.8
AOD (550nm) Figure 13: Seasonal frequency distribution of MODIS and AERONET AODs during Dec 2008-May 2010.