An analysis of the collection 5 MODIS over-ocean aerosol .... Shi et al.: Analysis of the collection...
9
Atmos. Chem. Phys., 11, 557–565, 2011 www.atmos-chem-phys.net/11/557/2011/ doi:10.5194/acp-11-557-2011 © Author(s) 2011. CC Attribution 3.0 License. Atmospheric Chemistry and Physics An analysis of the collection 5 MODIS over-ocean aerosol optical depth product for its implication in aerosol assimilation Y. Shi 1 , J. Zhang 1 , J. S. Reid 2 , B. Holben 3 , E. J. Hyer 2 , and C. Curtis 2 1 Department of Atmospheric Science, University of North Dakota, Grand Folks, ND, USA 2 Marine Meteorology Division, Naval Research Laboratory, Monterey, CA, USA 3 NASA Goddard Space Flight Center, Greenbelt, MD, USA Received: 1 June 2010 – Published in Atmos. Chem. Phys. Discuss.: 26 August 2010 Revised: 24 November 2010 – Accepted: 25 November 2010 – Published: 19 January 2011 Abstract. As an update to our previous use of the col- lection 4 Moderate Resolution Imaging Spectroradiometer (MODIS) over-ocean aerosol optical depth (AOD) data, we examined ten years of Terra and eight years of Aqua col- lection 5 data for its potential usage in aerosol assimilation. Uncertainties in the over-ocean MODIS AOD were studied as functions of observing conditions, such as surface charac- teristics, aerosol optical properties, and cloud artifacts. Em- pirical corrections and quality assurance procedures were de- veloped and compared to collection 4 data. After applying these procedures, the Root-Mean-Square-Error (RMSE) in the MODIS Terra and Aqua AOD are reduced by 30% and 10–20%, respectively, with respect to AERONET data. Ten years of Terra and eight years of Aqua quality-assured level 3 MODIS over-ocean aerosol products were produced. The newly developed MODIS over-ocean aerosol products will be used in operational aerosol assimilation and aerosol cli- matology studies, as well as other research based on MODIS products. 1 Introduction Recent studies have shown that the assimilation of satellite aerosol products, such as the near real time Moderate Reso- lution Imaging Spectroradiometer (MODIS) aerosol optical depth product, can improve aerosol analyses and forecasts (e.g. Zhang et al., 2008). However, biases and uncertainties exist in satellite aerosol data due to the complications inher- ent to retrieval processes and varying observational condi- Correspondence to: J. Zhang ([email protected]) tions (e.g. Zhang and Reid, 2006; Liu and Mishchenko, 2008 and Kahn et al., 2009). The impact of product uncertainty is application specific. In the area of data assimilation for aerosol forecasting, the tightest tolerances are required, be- cause any noise or systematic high bias in the product will propagate through the analysis to the forecasting cycle. Products from the MODIS sensors can provide high spatial and spectral resolution aerosol data with observations twice a day that cover most of the planet. Retrievals are possible over global oceans and most vegetated regions. MODIS data is also easily accessible in near real time. These advantages make MODIS one of the most popular satellite aerosol prod- ucts in current aerosol research for numerous applications. To employ MODIS data in an aerosol forecasting system, Zhang and Reid (2006) created a series of procedures to re- move outliers and reduce bias in MODIS Collection 4 (C4), level 2, over-ocean, aerosol products. The data performances for the year 2005 were examined as functions of the main sources of uncertainties, such as boundary conditions, cloud contaminations, and aerosol microphysics. Empirical studies and quality control procedures were applied to create quality assured MODIS level 3 aerosol products. The newly gener- ated MODIS aerosol products from Zhang and Reid (2006) are specifically made for aerosol data assimilation and fore- casting where they have been successfully used (e.g. Zhang et al., 2008). MODIS AOD data assimilation is now oper- ational at the Fleet Numerical Meteorology and Oceanog- raphy Center (FNMOC) to aid Navy Aerosol Analysis and Prediction System (NAAPS) forecasts. However, after Zhang and Reid’s study, the MODIS Col- lection 5 (C5), level 2, aerosol products have been distributed since 2007. Developers indicated very minor differences be- tween C4 and C5 data over oceans (personal communica- tion Robert Levy and Lorraine Remer, NASA Goddard SFC). Published by Copernicus Publications on behalf of the European Geosciences Union.
-
Upload
trinhkhanh -
Category
Documents
-
view
224 -
download
2
Transcript of An analysis of the collection 5 MODIS over-ocean aerosol .... Shi et al.: Analysis of the collection...
Atmos. Chem. Phys., 11, 557–565, 2011www.atmos-chem-phys.net/11/557/2011/doi:10.5194/acp-11-557-2011© Author(s) 2011. CC Attribution 3.0 License.
AtmosphericChemistry
and Physics
An analysis of the collection 5 MODIS over-ocean aerosol opticaldepth product for its implication in aerosol assimilation
Y. Shi1, J. Zhang1, J. S. Reid2, B. Holben3, E. J. Hyer2, and C. Curtis2
1Department of Atmospheric Science, University of North Dakota, Grand Folks, ND, USA2Marine Meteorology Division, Naval Research Laboratory, Monterey, CA, USA3NASA Goddard Space Flight Center, Greenbelt, MD, USA
Received: 1 June 2010 – Published in Atmos. Chem. Phys. Discuss.: 26 August 2010Revised: 24 November 2010 – Accepted: 25 November 2010 – Published: 19 January 2011
Abstract. As an update to our previous use of the col-lection 4 Moderate Resolution Imaging Spectroradiometer(MODIS) over-ocean aerosol optical depth (AOD) data, weexamined ten years of Terra and eight years of Aqua col-lection 5 data for its potential usage in aerosol assimilation.Uncertainties in the over-ocean MODIS AOD were studiedas functions of observing conditions, such as surface charac-teristics, aerosol optical properties, and cloud artifacts. Em-pirical corrections and quality assurance procedures were de-veloped and compared to collection 4 data. After applyingthese procedures, the Root-Mean-Square-Error (RMSE) inthe MODIS Terra and Aqua AOD are reduced by 30% and10–20%, respectively, with respect to AERONET data. Tenyears of Terra and eight years of Aqua quality-assured level3 MODIS over-ocean aerosol products were produced. Thenewly developed MODIS over-ocean aerosol products willbe used in operational aerosol assimilation and aerosol cli-matology studies, as well as other research based on MODISproducts.
1 Introduction
Recent studies have shown that the assimilation of satelliteaerosol products, such as the near real time Moderate Reso-lution Imaging Spectroradiometer (MODIS) aerosol opticaldepth product, can improve aerosol analyses and forecasts(e.g. Zhang et al., 2008). However, biases and uncertaintiesexist in satellite aerosol data due to the complications inher-ent to retrieval processes and varying observational condi-
Correspondence to:J. Zhang([email protected])
tions (e.g. Zhang and Reid, 2006; Liu and Mishchenko, 2008and Kahn et al., 2009). The impact of product uncertaintyis application specific. In the area of data assimilation foraerosol forecasting, the tightest tolerances are required, be-cause any noise or systematic high bias in the product willpropagate through the analysis to the forecasting cycle.
Products from the MODIS sensors can provide high spatialand spectral resolution aerosol data with observations twicea day that cover most of the planet. Retrievals are possibleover global oceans and most vegetated regions. MODIS datais also easily accessible in near real time. These advantagesmake MODIS one of the most popular satellite aerosol prod-ucts in current aerosol research for numerous applications.To employ MODIS data in an aerosol forecasting system,Zhang and Reid (2006) created a series of procedures to re-move outliers and reduce bias in MODIS Collection 4 (C4),level 2, over-ocean, aerosol products. The data performancesfor the year 2005 were examined as functions of the mainsources of uncertainties, such as boundary conditions, cloudcontaminations, and aerosol microphysics. Empirical studiesand quality control procedures were applied to create qualityassured MODIS level 3 aerosol products. The newly gener-ated MODIS aerosol products from Zhang and Reid (2006)are specifically made for aerosol data assimilation and fore-casting where they have been successfully used (e.g. Zhanget al., 2008). MODIS AOD data assimilation is now oper-ational at the Fleet Numerical Meteorology and Oceanog-raphy Center (FNMOC) to aid Navy Aerosol Analysis andPrediction System (NAAPS) forecasts.
However, after Zhang and Reid’s study, the MODIS Col-lection 5 (C5), level 2, aerosol products have been distributedsince 2007. Developers indicated very minor differences be-tween C4 and C5 data over oceans (personal communica-tion Robert Levy and Lorraine Remer, NASA Goddard SFC).
Published by Copernicus Publications on behalf of the European Geosciences Union.

558 Y. Shi et al.: Analysis of the collection 5 MODIS over-ocean aerosol optical depth product
However, before C5 data could be incorporated into the op-erational data stream, it was necessary to verify the data forthe specific purpose of data assimilation (Kahn et al., 2009)and re-evaluate the procedures developed for C4 for their po-tential to improve the MODIS C5 aerosol products. Insteadof using only one year of data, this paper applies Zhangand Reid’s methods to the C5 over-ocean aerosol data, us-ing ten years of Terra and eight years of Aqua data to ana-lyze the temporal performance differences between C4 andC5 MODIS products. After applying the empirical correc-tions and quality assurance procedures, the more robust newaerosol products were generated for the MODIS data for allthe available time periods.
2 Data
The ground-based aerosol observations from the AErosolRObotic NETwork (AERONET) were used to validateMODIS satellite data. AERONET is a global network ofSun photometers that provides ground-based aerosol opti-cal depth measurements and optical property retrievals (Hol-ben et al., 1998). All available level 2.0 AOD data (cloudscreened and quality assured), which has a reported uncer-tainty of approximately 0.01–0.02 in AOD (wavelength de-pendent) due to calibration (e.g. Holben et al., 1998) wereused. In order to evaluate satellite aerosol products, bothMODIS Terra and Aqua satellite aerosol products were col-located with the ground-based AERONET data. To minimizethe spatial and temporal difference between these data, pairsof AERONET Sun photometer data and MODIS aerosol re-trievals were matched where the spatial distance betweentwo observations were within 0.3◦ (latitude/longitude) andthe difference in observation times were within +/−30 min.AERONET data were averaged temporally within the one-hour collocation time window. However, the satellite ob-servations were not averaged spatially. Many previous stud-ies used averaged satellite data and Sun photometer data toovercome the spatial and temporal differences between thetwo data sets (Remer et al., 2005; Kahn et al., 2009; Hsu etal., 2006). This approach is understandable considering thespatial and temporal differences between the observations.Integrated through the atmosphere column, AERONET pro-vides point observations at a given time, whereas a satelliteretrieval from passive sensors such as MODIS represents acolumn integrated two-dimensional spatial observation at agiven time. Because of the different sampling methods, dif-ferences between the two types of observations can exist.However, in this study, in order to investigate the uncertain-ties in the satellite retrievals due to observing conditions at apixel level, satellite data were not averaged.
Both AERONET and MODIS aerosol data at the 0.55 µmspectral wavelength were used in this study, and discussionsmentioned hereafter refer to the aerosol data at the 0.55 µm,unless specifically mentioned. Note that the AERONET data
do not include observations at the 0.55 µm spectral channel,and therefore, the AERONET observations from 0.50 and0.67 µm were used to estimate aerosol optical depth valuesat the 0.55 µm based on the method by O’Neill et al., (2001).
As satellite over-ocean retrievals were used, onlyAERONET data from coastal or island sites were selected.Three collocated data sets were included in this study. (1)Terra MODIS C5 aerosol products and AERONET level 2.0data from 2000 to 2008; (2) Aqua MODIS C5 aerosol prod-ucts and the AERONET level 2.0 data from 2002 to 2008;and (3) MODIS Terra and Aqua C5 aerosol products andAERONET level 1.5 data for 2009 for independent valida-tion efforts. The level 1.5 AERONET data were used for2009 because the complete set of the quality assured level 2.0AERONET data were not readily available yet. All three datasets were also collocated with the near surface wind speeddata from the Navy Operational Global Analysis and Predic-tion System (NOGAPS) weather forecast model (Hogan andRosmond, 1991). Because the NOGAPS analyzed wind dataare only reported at four fixed times per day (00:00, 06:00,12:00, and 18:00 UTC), aerosol data were coupled with thewind data by matching the observation time with the closestmodel output time.
3 Evaluation of MODIS Collection 5 aerosol products
In Zhang and Reid, (2006), three major sources of uncer-tainties were identified in the over-ocean, C4 MODIS AODretrievals that could affect the accuracy of satellite derivedaerosol properties for aerosol data assimilation/forecastingproblems: (a) lower boundary conditions, such as near sur-face wind, and white caps; (b) cloud contamination and cloudartifacts, and (c) uncertainties related to aerosol microphys-ical properties. A similar analysis was performed for theMODIS C5 over-ocean aerosol products.
A fixed near surface wind speed of 6 m s−1 is used in thecurrent operational MODIS aerosol retrieval scheme (Remer,et al., 2005; 2008). Zhang and Reid, (2006) showed thatin the MODIS C4 products, uncertainties in MODIS AOD(1AOD, difference between the AERONET and MODISAOD) increase as a function of the NOGAPS near surfacewind speeds (u). In the MODIS C5 products, similar1AODandu relationships were also found for both Terra and Aquaaerosol optical depth data. Both Terra and Aqua AOD datahave positive biases as a function ofu throughout the anal-ysis. Also1AOD for Terra are consistently higher than1AOD for Aqua, indicating that the AOD values for Terra(AODTerra) are systematically higher than the AOD valuesfor aqua (AODAqua) on the multi-year global averages. Thisfinding is consistent with what was reported by Remer etal. (2008), where a calibration difference between the Aquaand Terra MODIS instruments was indicated.
Cloud contamination and cloud artifacts are one of thelong lasting issues in satellite aerosol retrievals. Positive
Atmos. Chem. Phys., 11, 557–565, 2011 www.atmos-chem-phys.net/11/557/2011/
Y. Shi et al.: Analysis of the collection 5 MODIS over-ocean aerosol optical depth product 559
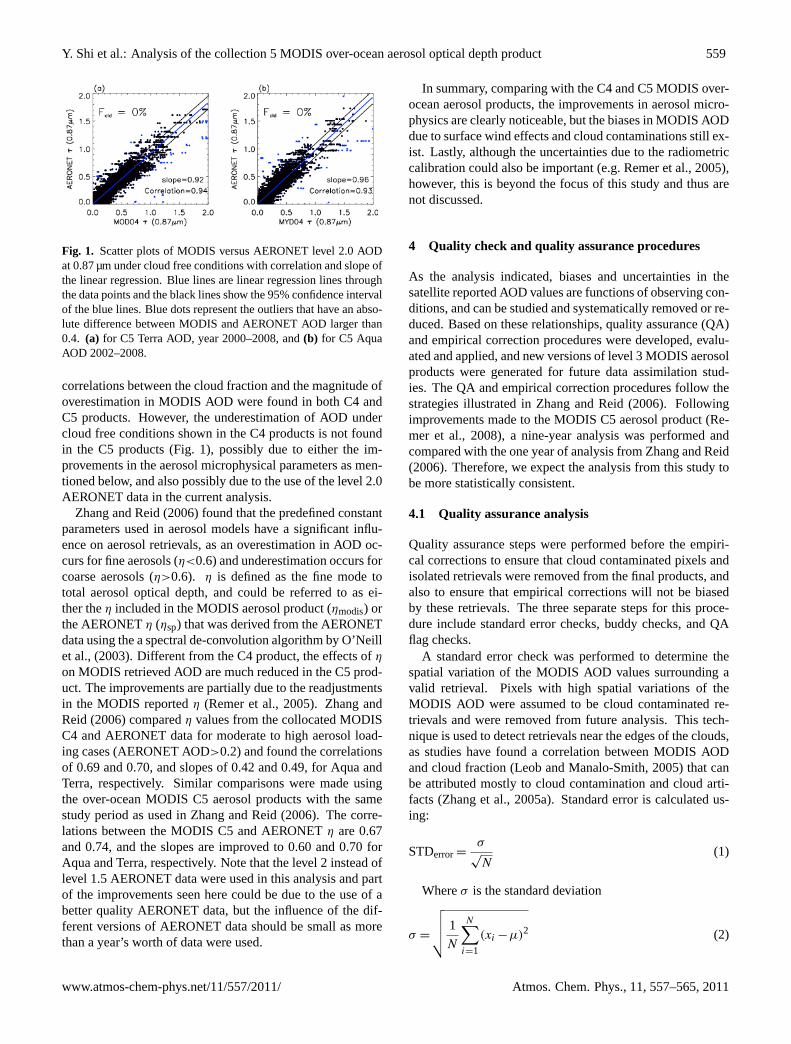
Fig. 1. Scatter plots of MODIS versus AERONET level 2.0 AODat 0.87 µm under cloud free conditions with correlation and slope ofthe linear regression. Blue lines are linear regression lines throughthe data points and the black lines show the 95% confidence intervalof the blue lines. Blue dots represent the outliers that have an abso-lute difference between MODIS and AERONET AOD larger than0.4. (a) for C5 Terra AOD, year 2000–2008, and(b) for C5 AquaAOD 2002–2008.
correlations between the cloud fraction and the magnitude ofoverestimation in MODIS AOD were found in both C4 andC5 products. However, the underestimation of AOD undercloud free conditions shown in the C4 products is not foundin the C5 products (Fig. 1), possibly due to either the im-provements in the aerosol microphysical parameters as men-tioned below, and also possibly due to the use of the level 2.0AERONET data in the current analysis.
Zhang and Reid (2006) found that the predefined constantparameters used in aerosol models have a significant influ-ence on aerosol retrievals, as an overestimation in AOD oc-curs for fine aerosols (η<0.6) and underestimation occurs forcoarse aerosols (η>0.6). η is defined as the fine mode tototal aerosol optical depth, and could be referred to as ei-ther theη included in the MODIS aerosol product (ηmodis) orthe AERONETη (ηsp) that was derived from the AERONETdata using the a spectral de-convolution algorithm by O’Neillet al., (2003). Different from the C4 product, the effects ofη
on MODIS retrieved AOD are much reduced in the C5 prod-uct. The improvements are partially due to the readjustmentsin the MODIS reportedη (Remer et al., 2005). Zhang andReid (2006) comparedη values from the collocated MODISC4 and AERONET data for moderate to high aerosol load-ing cases (AERONET AOD>0.2) and found the correlationsof 0.69 and 0.70, and slopes of 0.42 and 0.49, for Aqua andTerra, respectively. Similar comparisons were made usingthe over-ocean MODIS C5 aerosol products with the samestudy period as used in Zhang and Reid (2006). The corre-lations between the MODIS C5 and AERONETη are 0.67and 0.74, and the slopes are improved to 0.60 and 0.70 forAqua and Terra, respectively. Note that the level 2 instead oflevel 1.5 AERONET data were used in this analysis and partof the improvements seen here could be due to the use of abetter quality AERONET data, but the influence of the dif-ferent versions of AERONET data should be small as morethan a year’s worth of data were used.
In summary, comparing with the C4 and C5 MODIS over-ocean aerosol products, the improvements in aerosol micro-physics are clearly noticeable, but the biases in MODIS AODdue to surface wind effects and cloud contaminations still ex-ist. Lastly, although the uncertainties due to the radiometriccalibration could also be important (e.g. Remer et al., 2005),however, this is beyond the focus of this study and thus arenot discussed.
4 Quality check and quality assurance procedures
As the analysis indicated, biases and uncertainties in thesatellite reported AOD values are functions of observing con-ditions, and can be studied and systematically removed or re-duced. Based on these relationships, quality assurance (QA)and empirical correction procedures were developed, evalu-ated and applied, and new versions of level 3 MODIS aerosolproducts were generated for future data assimilation stud-ies. The QA and empirical correction procedures follow thestrategies illustrated in Zhang and Reid (2006). Followingimprovements made to the MODIS C5 aerosol product (Re-mer et al., 2008), a nine-year analysis was performed andcompared with the one year of analysis from Zhang and Reid(2006). Therefore, we expect the analysis from this study tobe more statistically consistent.
4.1 Quality assurance analysis
Quality assurance steps were performed before the empiri-cal corrections to ensure that cloud contaminated pixels andisolated retrievals were removed from the final products, andalso to ensure that empirical corrections will not be biasedby these retrievals. The three separate steps for this proce-dure include standard error checks, buddy checks, and QAflag checks.
A standard error check was performed to determine thespatial variation of the MODIS AOD values surrounding avalid retrieval. Pixels with high spatial variations of theMODIS AOD were assumed to be cloud contaminated re-trievals and were removed from future analysis. This tech-nique is used to detect retrievals near the edges of the clouds,as studies have found a correlation between MODIS AODand cloud fraction (Leob and Manalo-Smith, 2005) that canbe attributed mostly to cloud contamination and cloud arti-facts (Zhang et al., 2005a). Standard error is calculated us-ing:
STDerror=σ
√N
(1)
Whereσ is the standard deviation
σ =
√√√√ 1
N
N∑i=1
(xi−µ)2 (2)
www.atmos-chem-phys.net/11/557/2011/ Atmos. Chem. Phys., 11, 557–565, 2011

560 Y. Shi et al.: Analysis of the collection 5 MODIS over-ocean aerosol optical depth product
Fig. 2. Scatter plot of standard error threshold of AOD versus AODat 0.55 µm. Dots represent the averaged Standard Error (blue) ofAOD and the 1.5 standard deviation (red) for every 0.05 of AODwhen AOD<0.5 and 0.3 of AOD when AOD>0.5. In small AODcases, light blue lines show the cutoff of 0.01 in standard error. Theblue lines and red lines (for AOD>0.2 only) show the linear fit ofcorresponding dots.(a) for C5 Aqua MODIS AOD.(b) for C5 TerraMODIS AOD.
N is sample size,xi is each sample value,µ is the expectedvalue. Here standard error is calculated for every 3×3 pixelsaround a given retrieval.
Figure 2a and b show the average standard error thresh-old as a function of MODIS Terra and Aqua AOD, respec-tively, estimated using three years (2005–2007) of level 2, C5MODIS data. Linear relationships between the standard errorand AOD were found when standard errors are greater than0.01 while polynomial relationships were found for standarderrors smaller than 0.01. For close to zero AOD values, thereported uncertainty in MODIS AOD is±0.03 (Remer et al.,2005), therefore, a threshold of 0.01 in standard error is givenfor AOD values less than 0.178 (0.195) to avoid removals of“good” data with low AOD values for Terra (Aqua). The lin-ear fit of 1.5 standard deviation points serve as an upper limitfor larger AOD. The relations
STDerror= −0.0025+0.070×AOD (3)
STDerror= −0.0060+0.082×AOD (4)
represent the limits for Terra and Aqua larger AOD situa-tions respectively. Data located above these thresholds wereconsidered to have an unacceptable standard error and wereremoved.
Buddy checks were then performed to remove isolatedpixels. A given pixel is removed if there are no valid re-trievals among its immediate neighbors, which indicates thatthis isolated pixel could be located between clouds. Thequality flag included in the aerosol products is utilized as alast step to filter the data. Only retrievals that are flaggedas “best” and “good” data, with reported cloud fraction lessthan 80%, were used.
4.2 Empirical corrections
Empirical corrections were developed using data that passedthe quality assurance filters and were observed with a cloudfraction of less than 80%. These corrections are aimed toreduce the biases from cloud artifacts, surface wind speedeffects, and aerosol microphysics effects. The procedures fordeveloping the empirical equations for MODIS AOD prod-ucts at the 0.55 µm spectrum were created for two cases:(1) low AOD case (MODIS AOD<0.2), where biases in theaerosol products are highly dependant on the lower boundaryconditions, such as the near surface wind speed and cloud ar-tifacts; and (2) high AOD case (MODIS AOD>0.2), whereaerosol microphysical effects and cloud contamination arecritical (Zhang and Reid, 2005). Obvious outliers were handchecked and removed, and regressions were made from allavailable results to generate coefficients for correction equa-tions. The empirical correction equations were derived fol-lowing Zhang and Reid (2006).
For the low AOD case (AOD<0.2), equations were gen-erated as functions of near surface wind speed (u) and cloudfraction (Fcld).
AODnew= AODold+A−B×u−C×Fcld (5)
A,B andC are calculated separately for different values ofGlint Angle (ψ) with coefficients shown in Table 1. Alsoshown are the parameters from the C4 MODIS for compar-ison. Similar values for parameters B (for wind) and C (forcloud fraction) between the C4 and C5 products suggest thatthe impacts of wind speed and cloud fraction to the MODISAOD retrievals for low AOD cases still exist and are similarin magnitudes to those derived for the C4 products.
For the high AOD case (AOD>0.2), the empirical correc-tions were derived as functions of cloud fraction and finemode fraction (η). Both Zhang and Reid (2006) and thisstudy suggest that biases in the over-ocean MODIS AODdata can be characterized by cloud fraction andη values.Therefore, at first, the valid ranges of cloud fraction andη
were categorized into sub-sections, and the performance ofthe C5 MODIS AOD data was studied for each given sub-section of cloud fraction, andη, and later the regression anal-ysis was applied to estimate the parameters in the empiricalcorrection Eq. (6). Details of the regression analysis can alsobe found in Zhang and Reid, (2006). The investigations ofdata performances as functions of influence factors are sen-sitive to how the observation conditions are divided. Thus,the Monte Carlo method was used to reduce the uncertaintiesbrought in by the variation of thresholds and to generate morerobust parameters. Based on the thresholds of cloud frac-tion (Fcld) and fine mode fraction, which ensure that the dataare equally distributed in all categories of observation con-ditions, small random variations were introduced, and 2187cases were computed. The comparisons with the coefficientsof Eq. (6) for C4 and C5 products are shown in Table 2:
AODnew= AODold×(A−B×Fcld+C×η)+D (6)
Atmos. Chem. Phys., 11, 557–565, 2011 www.atmos-chem-phys.net/11/557/2011/

Y. Shi et al.: Analysis of the collection 5 MODIS over-ocean aerosol optical depth product 561
Table 1. Coefficients from Eq. (5) for Terra and Aqua for different ranges of Glint Angle (ψ) in Eq. (5) AODnew= AODold+A−B×u−
C×Fcld for the MODIS C5 data. The coefficients for the MODIS C4 data are in parenthesis.
A B C
Terra 30◦<ψ <60◦ 0.0184 (0.05) 0.0039 (0.0038) 0.0003 (0.0003)60◦<ψ < 80◦ 0.0042 (0.02) 0.0017 (0.0017) 0.0003 (0.0001)ψ >80◦ 0.0014 (0.02) 0.0011 (0.0007) 0.0002 (0.0001)
Aqua 30◦<ψ < 60◦ 0.0250 (0.05) 0.0045 (0.0069) 0.0003 (0.0003)60◦<ψ < 80◦ 0.0109 (0.03) 0.0021 (0.0026) 0.0002 (0.0000)ψ >80◦ 0.0029 (0.02) 0.0004 (0.0004) 0.0002 (0.0004)
Table 2. Coefficients for Terra and Aqua in Eq. (6) AODnew= AODold×(A−B×Fcld+C×η)+D for C5 and C4 data.
A B C D
Terra C5 0.863 0.0019 0.13 −0.028+0.00036×Fcld+0.062×η
C4 0.673 0.0021 0.46 0.025Aqua C5 0.840 0.0010 0.30 −0.00074−0.00014×Fcld+0.00266×η
C4 0.558 0.0018 0.63 0.020
These equations indicate that cloud fraction andη are ofcritical importance as a 100% change of cloud fraction andη could lead to a 10–20% and 10–30% change in MODISAOD, respectively. Comparing with parameters from the C4products, the impact of cloud contaminations has a similarmagnitude, which is shown as parameter B in Eq. (6), in boththe C4 and C5 products, yet the impact ofη is much reducedin the C5 products, as suggested by the analysis in Sect. 3.Details of the regression analysis can also be found in Zhangand Reid (2006).
5 Validation
Using the empirical corrections and quality assurance pro-cedures developed in the previous section, new over-oceanAOD data sets from the MODIS C5 Terra and Aqua weregenerated for 2000–2008 and 2002–2008, respectively.
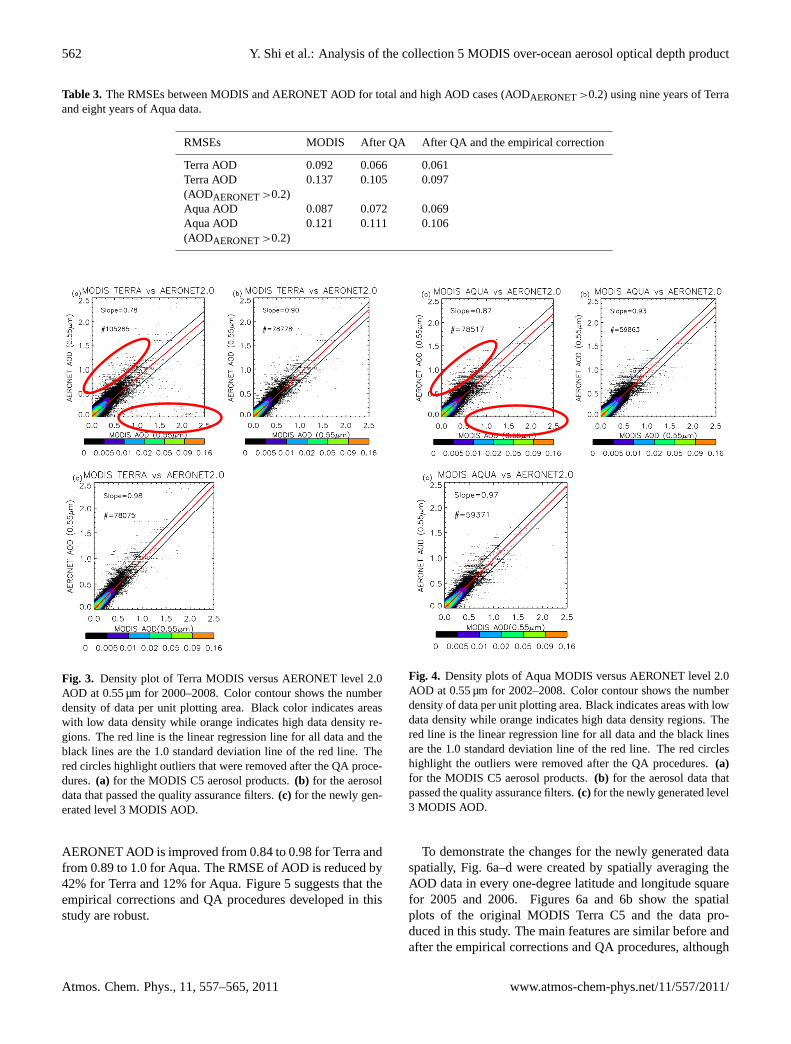
To evaluate the newly developed AOD data sets, inter-comparisons were made using the AOD values from the newdata sets against the AERONET data, as shown in Fig. 3.Figure 3a shows a comparison of AERONET and the originalMODIS Terra AOD, and Fig. 3b and c show the same com-parisons but with the Terra AOD after quality assurance onlyand the newly generated MODIS Terra AOD for nine yearsof data, respectively. Comparing Fig. 3a, b and c, the slope ofMODIS versus AERONET AOD is corrected in the empiri-cal correction steps and most outliers (as indicated by a redcircle) are removed in the quality assurance steps. One im-portant parameter for evaluating the quality of the new dataset is the Root Mean Square Error (RMSE) of AOD betweenMODIS and AERONET, which is calculated using
RMSE=
√1
n
∑n
(AODAERONET−AODMODIS)2 (7)
Table 3 lists the RMSEs between MODIS and AERONETAOD values before and after the QA and the empirical cor-rection procedures. The overall RMSE between MODIS(Terra) and AERONET AOD decreases 34%, from 0.092to 0.061, with 0.066 after quality assurance procedures anddecreases 29%, from 0.137 to 0.097, in high AOD cases(AODAERONET>0.2), with 0.104 after quality assurance pro-cedures. The slope of linear fit line (red line) increases from0.78 to 0.90 to 0.98. A threshold cloud fraction of 80% is ap-plied for these results with a data loss of 25% after quality as-surance steps and 26% after all procedures. Figure 4a, b andc show comparisons of Aqua MODIS and AERONET AODvalues before and after corrections for seven years of data.Results for Terra and Aqua are similar. The overall RMSEbetween Aqua and AERONET AOD decreases by 21% forall AOD cases and decreases 12% for high AOD cases. Theslopes of the linear fit line increase from 0.87 to 0.93 to 0.97,with a data loss of 23.5% after quality assurance steps and24% after all procedures.
The empirical corrections and quality assurance proce-dures were also validated through the study of independentdata sets that are not used in generating Eq. (5) throughEq. (6). Figure 5 is similar to Figs. 3 and 4, except whenusing the collocated MODIS Terra/Aqua and AERONETlevel 1.5 data for 2009. The AERONET level 1.5 insteadof Level 2.0 data were used because the AERONET level 2.0data are reported after yearly round instrumental calibrations(T. Eck, personal communication, 2008), and there were notenough AERONET level 2.0 data available for 2009. Again,most outliers are removed, and the slope of the MODIS and
www.atmos-chem-phys.net/11/557/2011/ Atmos. Chem. Phys., 11, 557–565, 2011
562 Y. Shi et al.: Analysis of the collection 5 MODIS over-ocean aerosol optical depth product
Table 3. The RMSEs between MODIS and AERONET AOD for total and high AOD cases (AODAERONET>0.2) using nine years of Terraand eight years of Aqua data.
RMSEs MODIS After QA After QA and the empirical correction
Terra AOD 0.092 0.066 0.061Terra AOD 0.137 0.105 0.097(AODAERONET>0.2)Aqua AOD 0.087 0.072 0.069Aqua AOD 0.121 0.111 0.106(AODAERONET>0.2)
Figure 3. Fig. 3. Density plot of Terra MODIS versus AERONET level 2.0AOD at 0.55 µm for 2000–2008. Color contour shows the numberdensity of data per unit plotting area. Black color indicates areaswith low data density while orange indicates high data density re-gions. The red line is the linear regression line for all data and theblack lines are the 1.0 standard deviation line of the red line. Thered circles highlight outliers that were removed after the QA proce-dures.(a) for the MODIS C5 aerosol products.(b) for the aerosoldata that passed the quality assurance filters.(c) for the newly gen-erated level 3 MODIS AOD.
AERONET AOD is improved from 0.84 to 0.98 for Terra andfrom 0.89 to 1.0 for Aqua. The RMSE of AOD is reduced by42% for Terra and 12% for Aqua. Figure 5 suggests that theempirical corrections and QA procedures developed in thisstudy are robust.
Figure 4. Fig. 4. Density plots of Aqua MODIS versus AERONET level 2.0AOD at 0.55 µm for 2002–2008. Color contour shows the numberdensity of data per unit plotting area. Black indicates areas with lowdata density while orange indicates high data density regions. Thered line is the linear regression line for all data and the black linesare the 1.0 standard deviation line of the red line. The red circleshighlight the outliers were removed after the QA procedures.(a)for the MODIS C5 aerosol products.(b) for the aerosol data thatpassed the quality assurance filters.(c) for the newly generated level3 MODIS AOD.
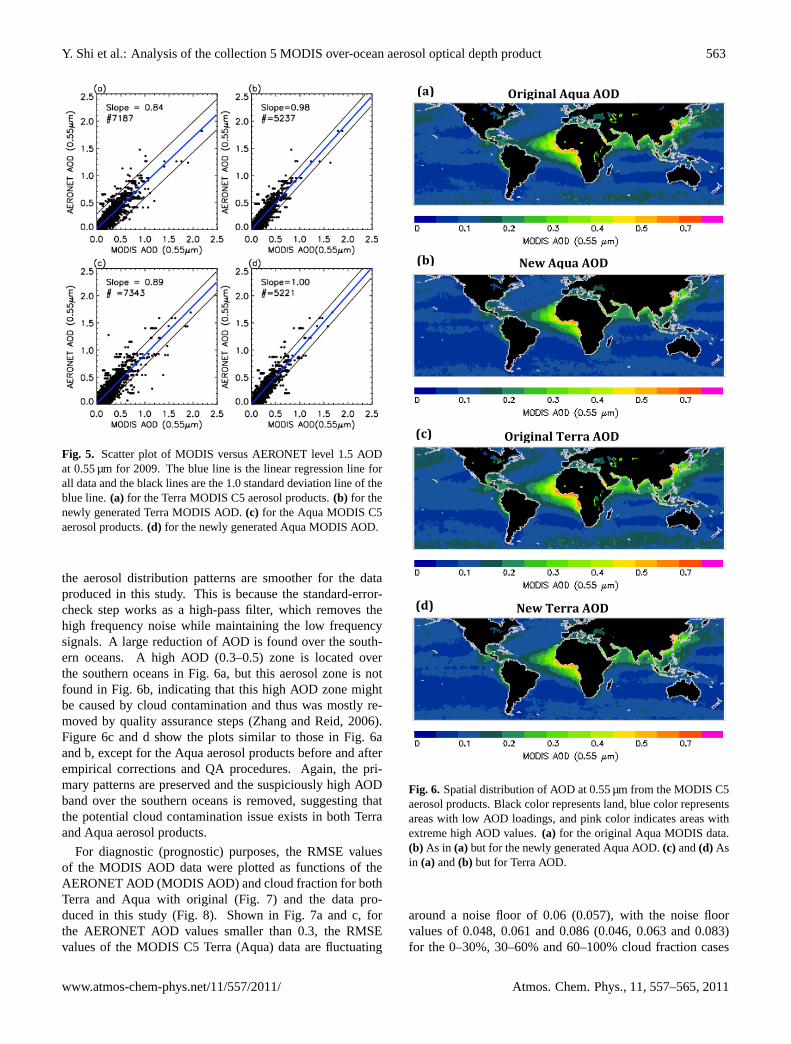
To demonstrate the changes for the newly generated dataspatially, Fig. 6a–d were created by spatially averaging theAOD data in every one-degree latitude and longitude squarefor 2005 and 2006. Figures 6a and 6b show the spatialplots of the original MODIS Terra C5 and the data pro-duced in this study. The main features are similar before andafter the empirical corrections and QA procedures, although
Atmos. Chem. Phys., 11, 557–565, 2011 www.atmos-chem-phys.net/11/557/2011/
Y. Shi et al.: Analysis of the collection 5 MODIS over-ocean aerosol optical depth product 563
Fig. 5. Scatter plot of MODIS versus AERONET level 1.5 AODat 0.55 µm for 2009. The blue line is the linear regression line forall data and the black lines are the 1.0 standard deviation line of theblue line.(a) for the Terra MODIS C5 aerosol products.(b) for thenewly generated Terra MODIS AOD.(c) for the Aqua MODIS C5aerosol products.(d) for the newly generated Aqua MODIS AOD.
the aerosol distribution patterns are smoother for the dataproduced in this study. This is because the standard-error-check step works as a high-pass filter, which removes thehigh frequency noise while maintaining the low frequencysignals. A large reduction of AOD is found over the south-ern oceans. A high AOD (0.3–0.5) zone is located overthe southern oceans in Fig. 6a, but this aerosol zone is notfound in Fig. 6b, indicating that this high AOD zone mightbe caused by cloud contamination and thus was mostly re-moved by quality assurance steps (Zhang and Reid, 2006).Figure 6c and d show the plots similar to those in Fig. 6aand b, except for the Aqua aerosol products before and afterempirical corrections and QA procedures. Again, the pri-mary patterns are preserved and the suspiciously high AODband over the southern oceans is removed, suggesting thatthe potential cloud contamination issue exists in both Terraand Aqua aerosol products.
For diagnostic (prognostic) purposes, the RMSE valuesof the MODIS AOD data were plotted as functions of theAERONET AOD (MODIS AOD) and cloud fraction for bothTerra and Aqua with original (Fig. 7) and the data pro-duced in this study (Fig. 8). Shown in Fig. 7a and c, forthe AERONET AOD values smaller than 0.3, the RMSEvalues of the MODIS C5 Terra (Aqua) data are fluctuating
(a) Original Aqua AOD
New Aqua AOD (b)
Original Terra AOD (c)
New Terra AOD (d)
Figure 6
Fig. 6. Spatial distribution of AOD at 0.55 µm from the MODIS C5aerosol products. Black color represents land, blue color representsareas with low AOD loadings, and pink color indicates areas withextreme high AOD values.(a) for the original Aqua MODIS data.(b) As in (a) but for the newly generated Aqua AOD.(c) and(d) Asin (a) and(b) but for Terra AOD.
around a noise floor of 0.06 (0.057), with the noise floorvalues of 0.048, 0.061 and 0.086 (0.046, 0.063 and 0.083)for the 0–30%, 30–60% and 60–100% cloud fraction cases
www.atmos-chem-phys.net/11/557/2011/ Atmos. Chem. Phys., 11, 557–565, 2011

564 Y. Shi et al.: Analysis of the collection 5 MODIS over-ocean aerosol optical depth product
Fig. 7. RMSE of MODIS Terra and Aqua C5 AOD compared toAERONET AOD as a function of AERONET AOD and MODISAOD. Data under different cloud fraction conditions are indicatedwith different colors. Red, green purple, and black represent datawith cloud fraction between 0—30%, 30–60%, 60–100%, and withtotal clouds.
respectively. For the AERONET AOD values greater than0.3, the second order polynomial relations were estimatedbetween the RMSE of MODIS C5 data the AERONET AOD.Similar relations were also found by performing the prognos-tic analysis using the MODIS AOD instead of AERONETAOD data as shown in Fig. 7b. For all cloud ranges andAOD ranges, the RMSEs of the new MODIS data are re-duced with significant reductions in noise floors (Fig. 8). Thenoise floors are 0.044 (0.044) for total AOD, 0.042 (0.042)for 0–30% cloud, 0.047 (0.047) for 30–60% cloud, and 0.049(0.052) for 60–80% cloud for Terra (Aqua). The noise floorof RMSE values decrease as the percentage of cloud fractiondecreases indicating that the cloud-induced uncertainties arereduced for retrievals with less cloudiness.
As discussed above, the uncertainties in satellite aerosolretrievals are highly influenced by cloud fractions, and oneof the most problematic areas is the high-latitude southernoceans. For example, the averaged cloud fraction over 40◦ S–60◦ S is 45% annually (estimated using the MOD04 cloudfraction data from 2006). And if we assume an AOD value of0.25 (representative value for the high AOD band over south-ern oceans from Fig. 6), and based on Figs. 7 and 8, we esti-mate that over the southern oceans the MODIS AOD data inthis study have 30–35% of RMSE reduction compared withthe original MODIS AOD.
Fig. 8. RMSE of newly generated MODIS Terra and Aqua AODcomparing to AERONET AOD as a function of AERONET AODand MODIS AOD. Data under different cloud fraction conditionsare indicated with different colors. Red, green purple, and blackrepresent data with cloud fraction between 0–30%, 30–60%, 60–80%, and with total clouds.
We also examined the yearly performance of the data pro-duced in this study. Evaluated against the AERONET data,the differences between the RMSEs for MODIS AOD beforeand after corrections were estimated from 2000 to 2008 forTerra and from 2002 to 2008 for Aqua and for three AODregimes: MODIS AOD<0.2; MODIS AOD>0.2; and allavailable AOD retrievals. The percentages of improvementswere calculated for all three AOD ranges, as shown in Fig. 9.In all AOD regimes the RMSEs from the new products areconsistently smaller than the original products for all avail-able years, with the percentages of improvements rangingfrom 15 to 40% for all available AOD retrievals.
6 Conclusions and discussions
This study evaluated uncertainties of satellite over-oceanaerosol products by comparing satellite data with ground-based AERONET data and by using ten years of TerraMODIS C5 data and eight years of Aqua MODIS C5 data.Uncertainties were examined as functions of near surfacewind speed, cloud fraction, and aerosol microphysics in or-der to develop empirical correction procedures. Strong re-lationships were found between uncertainties in the MODISC5 aerosol products and three potential uncertainty sources:near surface wind speed, cloud fraction and microphysics.This is similar to what was shown in the MODIS C4 aerosol
Atmos. Chem. Phys., 11, 557–565, 2011 www.atmos-chem-phys.net/11/557/2011/

Y. Shi et al.: Analysis of the collection 5 MODIS over-ocean aerosol optical depth product 565
Fig. 9. The percentages of improvements for the RMSEs betweenMODIS AOD and AERONET AOD at 0.55 µm before and after cor-rections, for all data (green), data with MODIS AOD greater than0.2 (blue), and data with MODIS AOD smaller than 0.2 (red).(a)for Terra 2000–2008,(b) for Aqua 2002–2008.
products (Zhang and Reid, 2006). Yet the improvementsin MODIS η (fine mode AOD fraction), and the effects ofaerosol microphysics to the retrieved MODIS AOD are no-ticeable in the over-ocean MODIS C5 aerosol product. Qual-ity assurance steps were also established to remove datasamples with possible cloud contamination. New productswith less uncertainty were generated as level 3 over-oceanMODIS aerosol products for future data assimilation andmodel use. This study suggests that, after the QA and em-pirical corrections, the RMSE of the over-ocean operationalMODIS C5 aerosol products is improved by more than 20–30% for Terra and more than 10–20% for Aqua globally, andby 30–35% over the southern oceans. This study will be ex-tended to over-land areas by including products from otherretrievals, such as the Deep Blue products (Hsu et al., 2006).
Acknowledgements.This research was funded by the Office ofNaval Research Code 322, the Office of Naval Research Young In-vestigator Program, and the NASA Interdisciplinary Science Pro-gram. Yingxi Shi is supported by the NASA Earth and Space Sci-ence Fellowship (NESSF) Program. We acknowledge and appreci-ate the AERONET program and their contributing principal inves-tigators and their staff for establishing and maintaining the coastalsites used in this investigation. We thank Lorraine Remer for herconstructive suggestions. We thank William Lahoz and an anony-mous reviewer for their thoughtful comments.
Edited by: W. Lahoz
References
Hogan, T. F., and Rosmond, T. E.: The Description of the Navy Op-erational Global Atmospheric Prediction Systems Spectral Fore-cast Model, Mon. Weather Rev., 119(8), 1786–1815, 1991.
Holben, B. N., Eck, T. F., Slutsker, I., Tanre, D., Buis, J. P., Set-zer, A., Vermote, E., Reagan, J. A., Kaufman, Y. J., Nakajima,T., Lavenu, F., Jankowiak, I., and Smirnov, A.: A ERONET-A Federated Instrument Network and Data Archive for AerosolCharacterization, Remote Sens. Environ. 66, 1–16, 1998.
Hsu, N. C., Tsay, S., King, M. D., and Herman, J. R.: Deep BlueRetrievals of Asian Aerosol Properties During ACE-Asia, IEEEtransactions on geoscience and remote sensing, ISSN 0196-2892CODEN IGRSD2., 44(1), 3180–3195, 2006.
Kahn, R. A., Nelson, D. L., Garay, M. J., Levy, R. C., Bull, M. A.,Diner, D. J., Martonchik, J. V., Paradise, S. R., Hansen, E. G.,and Remer, L. A.: MISR Aerosol Product Attributes and Statisti-cal Comparisons with MODIS, Transactions on Geoscience andRemote Sensing, IEEE T. Geosci. Remote, 47(12), 4095–4114,doi:10.1109/TGRS.2009.2023115, 2009.
Liu, L. and Mishchenko, M. I.: Toward unified satellite climatol-ogy of aerosol properties: Direct comparisons of advanced level2 aerosol products,J. Quant. Spectrosc. Ra. Transf., 109(14),2376–2385, doi:10.1016/j.jqsrt.2008.05.003, 2008.
Loeb, N. G. and Manalo-Smith, N: Top-of-Atmosphere Direct Ra-diative Effect of Aerosols over Global Oceans from MergedCERES and MODIS Observations, J. Climate, 18, 3506–3526,2005.
O’Neill, N. T., Dubovik, O., and Eck, T. F.: A modified AngstromCoefficient for The Characterization of Sub-micron Aerosols,App. Opt., 40(15), 2368–2374, 2001.
O’Neill, N. T., Eck, T. F., Smirnov, A., Holben, B. N., andThulasiraman, S.: Spectral Discrimination of Coarse and FineMode Optical Depth, J. Geophys. Res., 108(D17), 4559,doi:10.1029/2002JD002975, 2003.
Remer, L. A., Kaufman, Y. J., Tanre, D., Matoo, S., Chu, D. A.,Martins, J. V., Li, R.-R., Ichoku, C., Levy, R. C., Kieidman, R.G., Eck, T. F., Vermote, E., and Holben, B. N.: The MODISAerosol Algorithm, Products, and Validation, J. Atmos. Sci.,62(4), 947–973, doi:10.1175/JAS3385.1, 2005.
Remer, L. A., Kleidman, R. G., Levy, R. C., Kaufman, Y. J.,Tanre, D., Mattoo, S., Martins, J. V., Ichoku, C., Koren, I.,Yu, H., and Holben, B. N.: Global aerosol climatology fromthe MODIS satellite sensors. J. Geophys. Res., 113, D14S07,doi:10.1029/2007JD009661, 2008.
Zhang, J. and Reid, J. S.: MODIS Aerosol Product Analysis forData Assimilation: Assessment of Over-Ocean level 2 AerosolOptical Thickness Retrievals, J. Geophys. Res., 111. D22207,doi:10.1029/2005JD006898, 2006.
Zhang, J. and Reid, J. S.: A System for Operational Aerosol OpticalDepth Data Assimilation over Global Oceans, J. Geophys. Res.,113, D10208, doi:10.1029/2007JD009065, 2008.
Zhang, J., Reid, J. S., and Holben, B. N.: An analysis ofpotential cloud artifacts in MODIS over ocean aerosol op-tical thickness products, Geophys. Res. Lett., 32, L15803,doi:10.1029/2005GL023254, 2005.
www.atmos-chem-phys.net/11/557/2011/ Atmos. Chem. Phys., 11, 557–565, 2011