OECD QSAR Toolbox v.4 · OECD QSAR Toolbox v.4.0 Tutorial for using the PBT prioritization scheme...
39
OECD QSAR Toolbox v.4.0 Tutorial for using the PBT prioritization scheme April 2017 1 The OECD QSAR Toolbox for Grouping Chemicals into Categories
Transcript of OECD QSAR Toolbox v.4 · OECD QSAR Toolbox v.4.0 Tutorial for using the PBT prioritization scheme...

OECD QSAR Toolbox v.4.0
Tutorial for using the PBT prioritization scheme
April 2017 1The OECD QSAR Toolbox for Grouping Chemicals into Categories

• Aim
• PBT scheme
• Workflow of the prediction
• Export of the results
2
Outlook
The OECD QSAR Toolbox for Grouping Chemicals into Categories April 2017 2

This is a step-by-step presentation designed to take theuser of Toolbox through the PBT prioritization schemeimplemented in the software.
3
Aim
The OECD QSAR Toolbox for Grouping Chemicals into Categories April 2017 3

• Aim
• PBT scheme
Background
• Workflow of the prediction
• Export of the results
4
Outlook
The OECD QSAR Toolbox for Grouping Chemicals into Categories April 2017 4

April 2017The OECD QSAR Toolbox for Grouping Chemicals into Categories
Background:PBT prioritization scheme
• PBT prioritization scheme is based on experimental data andQSAR models.
• A substance is classified based on thresholds for persistence,bioaccumulation and toxicity, and the following classificationscould be given:
‒ very persistent (vP),‒ persistent (P),‒ very bioaccumulative (vB),‒ bioaccumulative (B),‒ very toxic (vT),‒ toxic (T).
• The thresholds are illustrated in the table on the next slide.
5

April 2017The OECD QSAR Toolbox for Grouping Chemicals into Categories
Background:PBT assessment criteria
Classification Criteria Guidance Data and models
vP BOD ≤ 30% REACH Annex XIII [1] Experimental data only
P 30% < BOD ≤ 40% or
biodegradation probability < 0.5REACH Annex XIII [1] Experimental data and BIOWIN
5 and 6 models
vB BCF ≥ 3.699 log(L/kg wet) REACH Annex XIII [1] Experimental data and BCFWIN
model
B 3.301 ≤ BCF < 3.699 log(L/kg
wet) or log Kow > 4.5 REACH Annex XIII [1] Experimental data and BCFWIN
and KOWWIN models
vT LC50 ≤ 1 mg/l GHS classification [2] Experimental data only
T 1 mg/l < LC50 ≤ 10 mg/l GHS classification [2] Experimental data only
[1] https://echa.europa.eu/documents/10162/13632/information_requirements_r11_en.pdf
[2] https://www.unece.org/fileadmin/DAM/trans/danger/publi/ghs/ghs_rev04/English/ST-SG-AC10-30-Rev4e.pdf
6

April 2017The OECD QSAR Toolbox for Grouping Chemicals into Categories
Background:PBT assessment criteria
PBT priority grouping:
Based on the collected experimental data and resultsprovided by QSAR models, the system applies theworst case scenario to categorize chemicals using thefollowing priority:
• With the highest priority arechemicals with availableexperimental data for P, Bor T assessment.
• In case of unavailableexperimental data for P, B orT, QSAR models are appliedfor making predictions.
vP, vB or vT
P, B or T
notP, notB
notT.PR
IOR
ITY
7

• Aim
• PBT scheme
Background
Implementation
• Workflow of the prediction
• Export of the results
8
Outlook
The OECD QSAR Toolbox for Grouping Chemicals into Categories April 2017 8

April 2017The OECD QSAR Toolbox for Grouping Chemicals into Categories 9
• PBT prioritizationscheme is a graph oflogically connectednodes.• The nodes are dividedinto three groups basedon the P, B or Tclassification for hazardassessment.
B
(Bioaccumulation)
T
(Acute Aquatic
Toxicity)
P
(Persistence)
Implementation of PBT prioritization scheme

• Each node (1) contains a
data or parametric (model)
boundary (2) where the
criteria for PBT assessment
are set.
• Data query is depicted here.
April 2017The OECD QSAR Toolbox for Grouping Chemicals into Categories 10
Implementation of PBT prioritization scheme
Data
query
BOD<=30%
1
2

• Aim
• PBT scheme
Background
Implementation
• Workflow of the prediction
• Export of the results
11
Outlook
The OECD QSAR Toolbox for Grouping Chemicals into Categories April 2017 11

April 2017The OECD QSAR Toolbox for Grouping Chemicals into Categories
Workflow of the prediction:Steps
• Input of target chemical(s)
• Profiling: PBT Example prioritization scheme (PBT)
• Report
12

• Aim
• PBT scheme
Background
Implementation
• Workflow of the prediction
Chemical input
• Export of the results
13
Outlook
The OECD QSAR Toolbox for Grouping Chemicals into Categories April 2017 13

• This module provides the user with several means ofentering the chemical of interest or the target chemical.
• Since all subsequent functions are based on chemicalstructure, the goal here is to make sure the molecularstructure assigned to the target chemical is the correctone.
14
Chemical Input
14April 2017The OECD QSAR Toolbox for Grouping Chemicals into Categories

I. Single target chemical:• Chemical Name• Chemical Abstract Services (CAS) number (#)• SMILES (simplified molecular information line entry
system) notation• Chemical with defined composition• Drawing chemical structure• Select from User List/Inventory/Databases
II. Group of chemicals:• User’s List• Inventory/Database
15
Chemical InputWays of Entering a Chemical
15April 2017The OECD QSAR Toolbox for Grouping Chemicals into Categories
• Open the Toolbox.
• Click on “Input” (see next screen shot).
16
Chemical Input:Single chemical
16April 2017The OECD QSAR Toolbox for Grouping Chemicals into Categories
17
Chemical InputSingle chemical
1
2
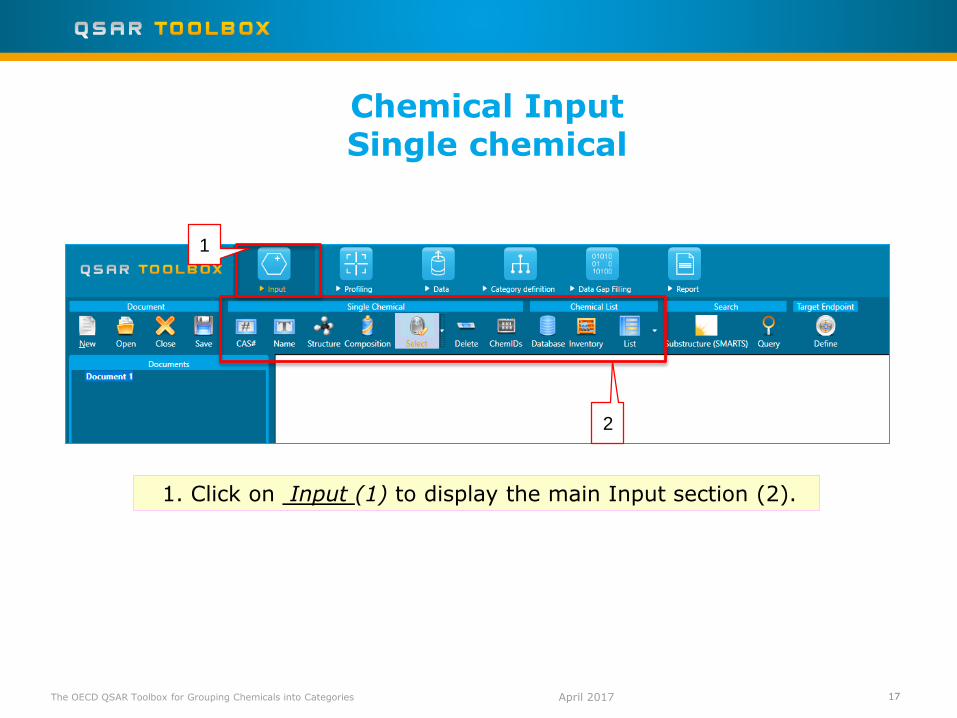
1. Click on Input (1) to display the main Input section (2).
17April 2017The OECD QSAR Toolbox for Grouping Chemicals into Categories

1. Press CAS# (1); 2. Type in the CAS # (2) ; 3. Click on Search (3);4. Press OK (4).
18
Chemical InputSingle chemical: CAS RN
18
1
43
2
April 2017The OECD QSAR Toolbox for Grouping Chemicals into Categories

The chemical is displayed in the data matrix (1).
19
Chemical InputSingle chemical: CAS RN
19
1
April 2017The OECD QSAR Toolbox for Grouping Chemicals into Categories

• Aim
• PBT scheme
Background
Implementation
• Workflow of the prediction
Chemical input
Profiling
• Export of the results
20
Outlook
The OECD QSAR Toolbox for Grouping Chemicals into Categories April 2017 20
ProfilingOverview
• “Profiling” refers to the electronic process of retrieving relevant information on a compound which is stored in the Toolbox, other than its fate and (eco)toxicity data.
• Toolbox has many predefined profilers but it also allows the user to develop new profilers.
April 2017The OECD QSAR Toolbox for Grouping Chemicals into Categories 21

April 2017The OECD QSAR Toolbox for Grouping Chemicals into Categories
Profiling
1. Select Profiling tab (1);
2. Click on Unselect All (2);
3. Tick Example prioritization Scheme (PBT) (3);
4. Click on Apply (4).5. Expand the cell to
see the results: P, vB, vT.
6. The results are explained in the next slides.
3
2
4
1
5P
vB
vT
22

April 2017The OECD QSAR Toolbox for Grouping Chemicals into Categories
Profiling:explanation of “P” prediction
1. Left click on “P”(1) 2. Click on the pop-
up window Explain (2);
3. The PBT scheme is displayed and the query, which gives the prediction is shown (see next slide)
1
23

April 2017The OECD QSAR Toolbox for Grouping Chemicals into Categories
Profiling:explanation of “P” prediction
1. The node, which criteria are fulfilled is colored green and marked with “V” sign (1).
2. The nodes, which criteria are not fulfilled are colored in red and marked with “X” sign (2).
3. A yellow border around the node (1) indicates that it is selected and its queries are displayed in the definition panel (3).
2
1
2
3
24

April 2017The OECD QSAR Toolbox for Grouping Chemicals into Categories
Profiling:explanation of “P” prediction
4. A red circle around the query indicates that it is selected (4).
5. Here it is a parameter query (5), which content is shown in the Parameter query tab (5)
6. Biodegradation probability (Biowin 5 model) is implemented (6). The predicted outcome has to be below 0.5 (7) in order for the requirements to be fulfilled.
7. The calculated biodegradation probability for the target chemical, by Biowin 5 model, is -0.23.
4
6
5
7
Biodeg
probability= -0.23
25

April 2017The OECD QSAR Toolbox for Grouping Chemicals into Categories
Profiling:explanation of “vB” prediction
1. Left click on “vB”(1) 2. Click on the pop-up
window Explain (2);3. The PBT scheme is
displayed and the query, which gives the prediction is shown (see next slide)
1 2
26

April 2017The OECD QSAR Toolbox for Grouping Chemicals into Categories
Profiling:explanation of “vB” prediction
1
1. The node, which criteria are fulfilled is colored green and marked with “V” sign (1).
2. Here it is a node with experimental data. The logic implemented in the PBT scheme implies that if the target chemical has experimental data (in this case vB) then the consecutive nodes from the bioaccumulation assessment are not run. Hence they are colored in grey (2).
3. All experimental data available for the target chemical is listed in the Explanation panel(3). The unit is L/kg bdwt.
12
1
3
27

1. As the endpoint is bioaccumulation, the highest value is taken into account(1).
2. Expand the prediction from the arrow next to the digits (2).3. By moving the scroll bar (3) , you can see all details of the measured
data (4).
April 2017The OECD QSAR Toolbox for Grouping Chemicals into Categories
Profiling:explanation of “vB” prediction
3
2
14
28

April 2017The OECD QSAR Toolbox for Grouping Chemicals into Categories
Profiling:explanation of “vT” prediction
1. Left click on “vT”(1) 2. Click on the pop-up
window Explain (2);3. The PBT scheme is
displayed and the query, which gives the prediction is shown (see next slide).
21
29

April 2017The OECD QSAR Toolbox for Grouping Chemicals into Categories
Profiling:explanation of “vT” prediction
1
1. The node, which criteria are fulfilled is colored green and marked with “V” sign (1).
2. Here it is a node with experimental data. The logic implemented in the PBT scheme implies that if the target chemical has experimental data (in this case vT) then the consecutive nodes from the toxicity assessment are not run. Hence they are colored in grey (2).
3. All experimental data available for the target chemical is listed in the Explanation panel(3). The unit is mg/L or ppb. However only mg/L is considered (see next two slides).
12
1
3
30

April 2017The OECD QSAR Toolbox for Grouping Chemicals into Categories
Profiling:explanation of “vT” prediction
1
12
1
3
1
2
3
1. The details of the Data query (1), are shown in the Query details panel (2).
2. By moving the scrollbar , you can see the type of metadata included in the query.
3. In this example , the type of experimental data is Any meaning different unit/scales are included, e.g. mg/L and ppb (see slide 30)
31

April 2017The OECD QSAR Toolbox for Grouping Chemicals into Categories
Profiling:explanation of “vT” prediction
3
1. As the endpoint is acute aquatic toxicity, the lowest value is taken into account(1).
2. Expand the prediction from the arrow next to the digits (2).
3. By moving the scroll bar (3) , you can see all details of the measured data .
2
1
32

April 2017 33The OECD QSAR Toolbox for Grouping Chemicals into Categories
Profiling:common features of PBT interface
1. A view finder window (1) is displayed by clicking on the cross sign (2).2. It contains navigation options for viewing the PBT scheme (3).
3
1
2

April 2017 34The OECD QSAR Toolbox for Grouping Chemicals into Categories
Profiling:common features of PBT interface
Properties, Literature and Scheme tabs gives more information about the query (properties), the node(literature) and the developer (scheme) (1).
1

• Aim
• PBT scheme
Background
Implementation
• Workflow of the prediction
Chemical input
Profiling
• Export of the results
35
Outlook
The OECD QSAR Toolbox for Grouping Chemicals into Categories April 2017 35

April 2017 36The OECD QSAR Toolbox for Grouping Chemicals into Categories
Export of the results
1
2
1. Right click next to the name of the scheme (1)
2. Select Export Data matrix (2)

April 2017 37The OECD QSAR Toolbox for Grouping Chemicals into Categories
Export of the results
1. Expand structure info to add Chemical name(s) (1).
2. Example Prioritization Scheme (PBT) is selected by default (2).
3. Click on Export (3).
1
2
3

April 2017 38The OECD QSAR Toolbox for Grouping Chemicals into Categories
Export of the results
1. Type in the name of the file (1).2. The files are only saved in csv format(2).3. Click on Save (3).4. Click on OK the confirmation message (4).
1
2
3
4

April 2017 39The OECD QSAR Toolbox for Grouping Chemicals into Categories
Export of the results
The file can be open as an Excel sheet.