
OECD QSAR Toolbox v.4 · OECD QSAR Toolbox v.4.1 Tutorial on how to predict Skin sensitization...
79
OECD QSAR Toolbox v.4.1 Tutorial on how to predict Skin sensitization potential taking into account alert performance
Transcript of OECD QSAR Toolbox v.4 · OECD QSAR Toolbox v.4.1 Tutorial on how to predict Skin sensitization...

OECD QSAR Toolbox v.4.1
Tutorial on how to predict Skin sensitization potential taking into account alert performance
• Background
• Objectives
• Specific Aims
• Read across and analogue approach
• The exercise
• Workflow
Outlook
The OECD QSAR Toolbox for Grouping Chemicals into Categories 2 July, 2017
• This is a step-by-step presentation designed to take the Toolbox user through the workflow of a data filling exercise accounting alert performance.
Background
The OECD QSAR Toolbox for Grouping Chemicals into Categories 3 July, 2017
• Background
• Objectives
• Specific Aims
• Alert performance
• The exercise
• Workflow
Outlook
The OECD QSAR Toolbox for Grouping Chemicals into Categories 4 July, 2017
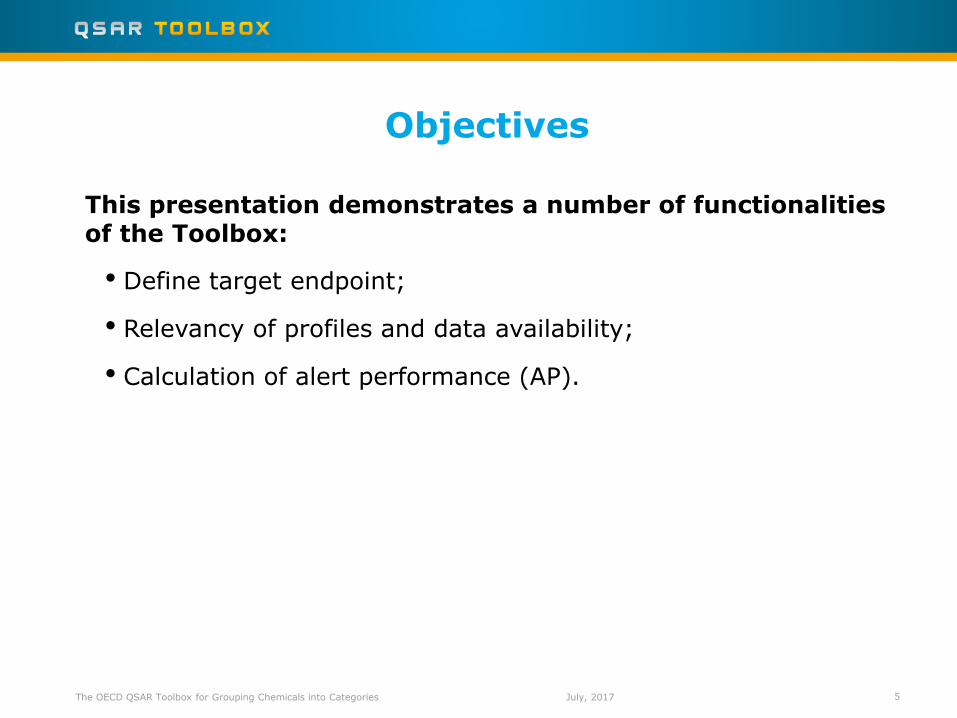
• Define target endpoint;
• Relevancy of profiles and data availability;
• Calculation of alert performance (AP).
Objectives
The OECD QSAR Toolbox for Grouping Chemicals into Categories 5
This presentation demonstrates a number of functionalities of the Toolbox:
July, 2017
• Background
• Objectives
• Specific Aims
• Alert performance
• The exercise
• Workflow
Outlook
The OECD QSAR Toolbox for Grouping Chemicals into Categories 6 July, 2017
• To introduce to the Toolbox user the workflow of the defining target endpoint;
• To familiarize the user with the new interface of the Toolbox;
• To familiarize the user with the coloring of the profiles and databases;
• To familiarize the user with the calculation of alert performance;
• To explain to the Toolbox user the rationale behind each step of the exercise.
Specific Aims
The OECD QSAR Toolbox for Grouping Chemicals into Categories 7 July, 2017
• Background
• Objectives
• Specific Aims
• Alert performance
• The exercise
• Workflow
Outlook
The OECD QSAR Toolbox for Grouping Chemicals into Categories 8 July, 2017
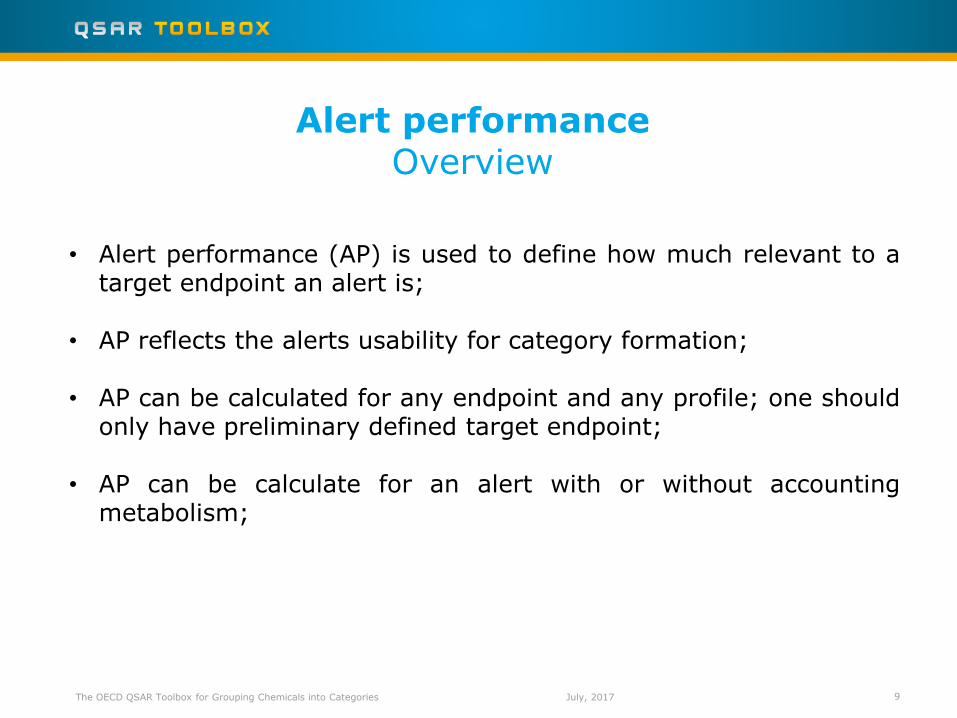
• Alert performance (AP) is used to define how much relevant to a target endpoint an alert is;
• AP reflects the alerts usability for category formation;
• AP can be calculated for any endpoint and any profile; one should only have preliminary defined target endpoint;
• AP can be calculate for an alert with or without accounting metabolism;
Alert performance Overview
The OECD QSAR Toolbox for Grouping Chemicals into Categories 9 July, 2017
• Background
• Objectives
• Specific Aims
• Alert performance
• The exercise
• Workflow
Outlook
The OECD QSAR Toolbox for Grouping Chemicals into Categories 10 July, 2017
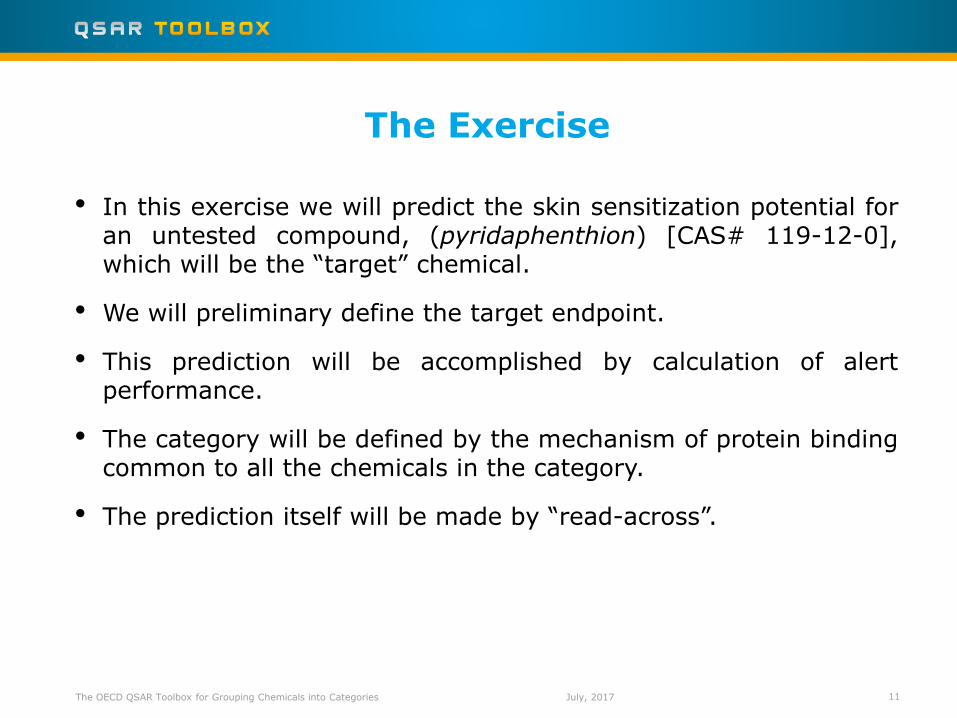
• In this exercise we will predict the skin sensitization potential for an untested compound, (pyridaphenthion) [CAS# 119-12-0], which will be the “target” chemical.
• We will preliminary define the target endpoint.
• This prediction will be accomplished by calculation of alert performance.
• The category will be defined by the mechanism of protein binding common to all the chemicals in the category.
• The prediction itself will be made by “read-across”.
The Exercise
The OECD QSAR Toolbox for Grouping Chemicals into Categories 11 July, 2017

• Allergic contact dermatitis that results from skin sensitization is a significant health concern.
• Skin sensitization is a toxicological endpoint that is complex and conceptually difficult.
• However, there is growing agreement that most organic chemicals must react covalently with skin proteins in order to behave as skin sensitizers.
• Therefore, mechanisms by which organic chemicals bind with proteins are relevant to grouping chemicals that may be skin sensitizing agents.
The OECD QSAR Toolbox for Grouping Chemicals into Categories 12
The Exercise Sidebar On Sensitization
July, 2017
• Background
• Objectives
• Specific Aims
• Alert performance
• The exercise
• Workflow
Outlook
The OECD QSAR Toolbox for Grouping Chemicals into Categories 13 July, 2017
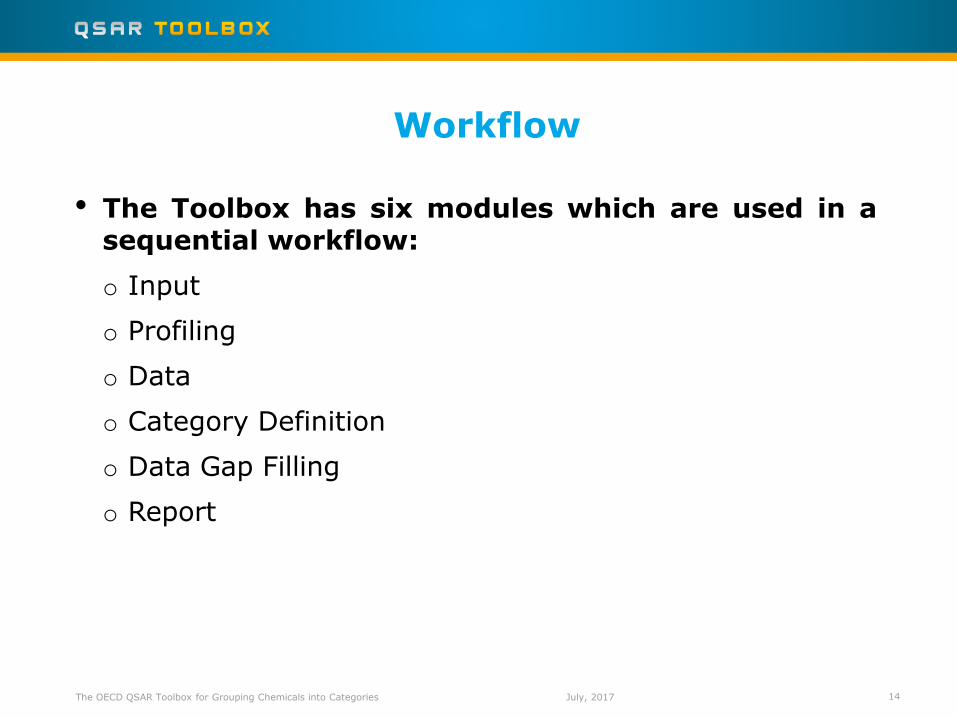
• The Toolbox has six modules which are used in a sequential workflow:
o Input
o Profiling
o Data
o Category Definition
o Data Gap Filling
o Report
Workflow
The OECD QSAR Toolbox for Grouping Chemicals into Categories 14 July, 2017
• Background
• Objectives
• Specific Aims
• Alert performance
• The exercise
• Workflow
o Input
Outlook
The OECD QSAR Toolbox for Grouping Chemicals into Categories 15 July, 2017
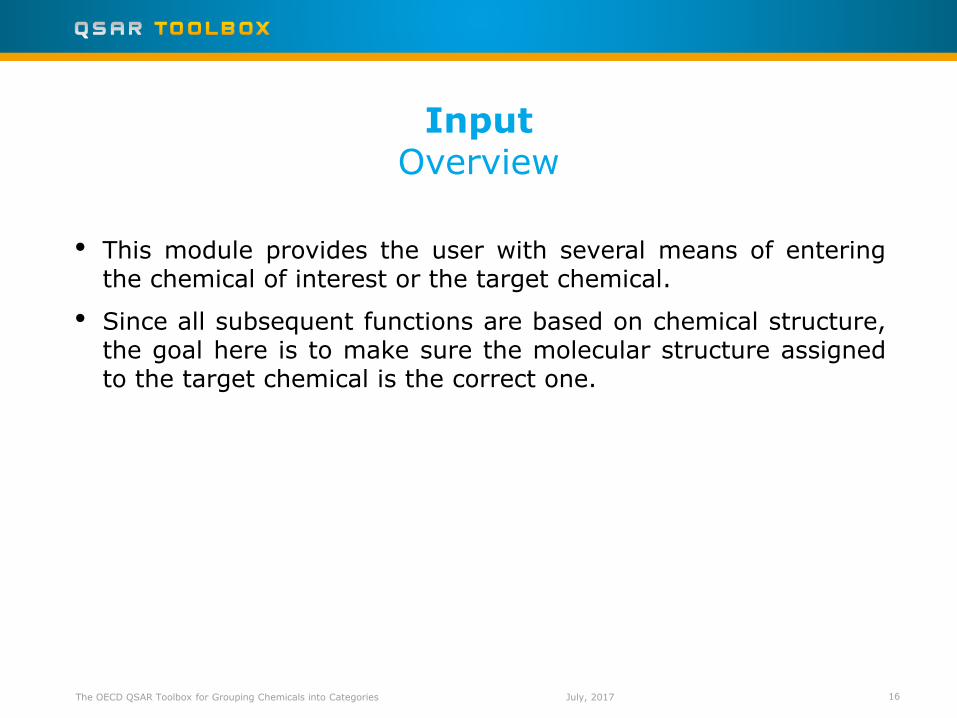
• This module provides the user with several means of entering the chemical of interest or the target chemical.
• Since all subsequent functions are based on chemical structure, the goal here is to make sure the molecular structure assigned to the target chemical is the correct one.
Input Overview
The OECD QSAR Toolbox for Grouping Chemicals into Categories 16 July, 2017
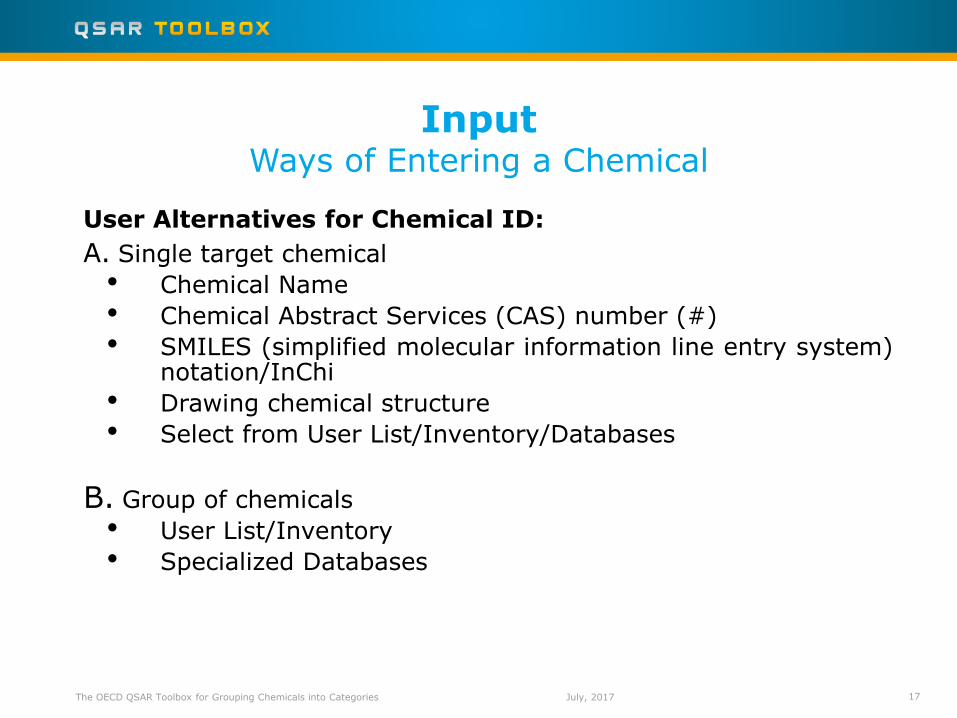
Input Ways of Entering a Chemical
User Alternatives for Chemical ID:
A. Single target chemical
• Chemical Name
• Chemical Abstract Services (CAS) number (#)
• SMILES (simplified molecular information line entry system) notation/InChi
• Drawing chemical structure
• Select from User List/Inventory/Databases
B. Group of chemicals
• User List/Inventory
• Specialized Databases
17 The OECD QSAR Toolbox for Grouping Chemicals into Categories July, 2017
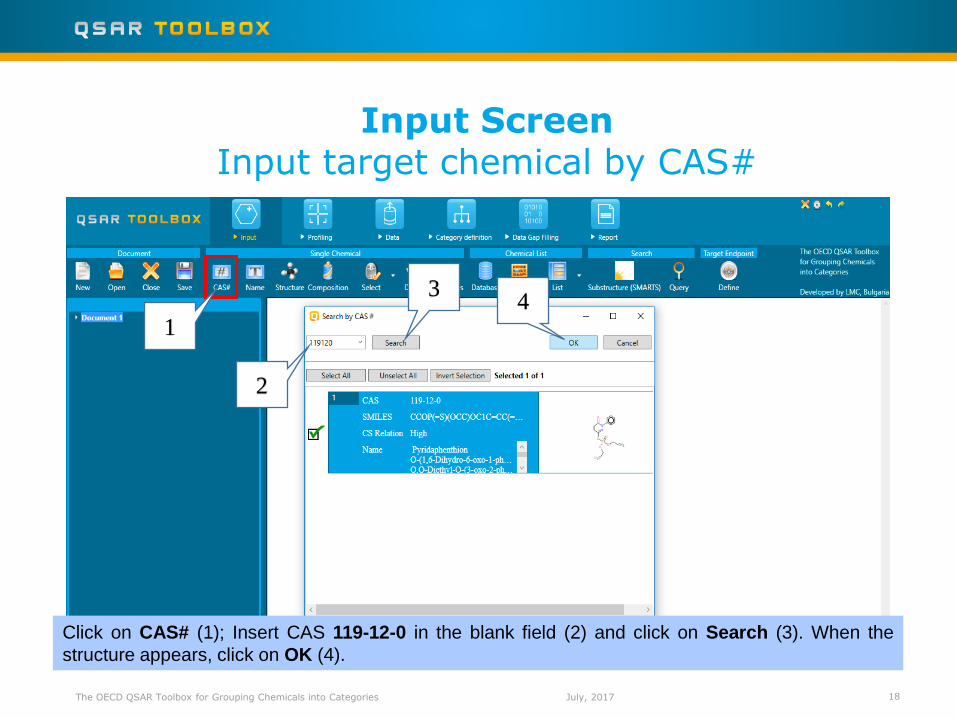
Input Screen Input target chemical by CAS#
The OECD QSAR Toolbox for Grouping Chemicals into Categories 18
1
2
3 4
Click on CAS# (1); Insert CAS 119-12-0 in the blank field (2) and click on Search (3). When the
structure appears, click on OK (4).
July, 2017
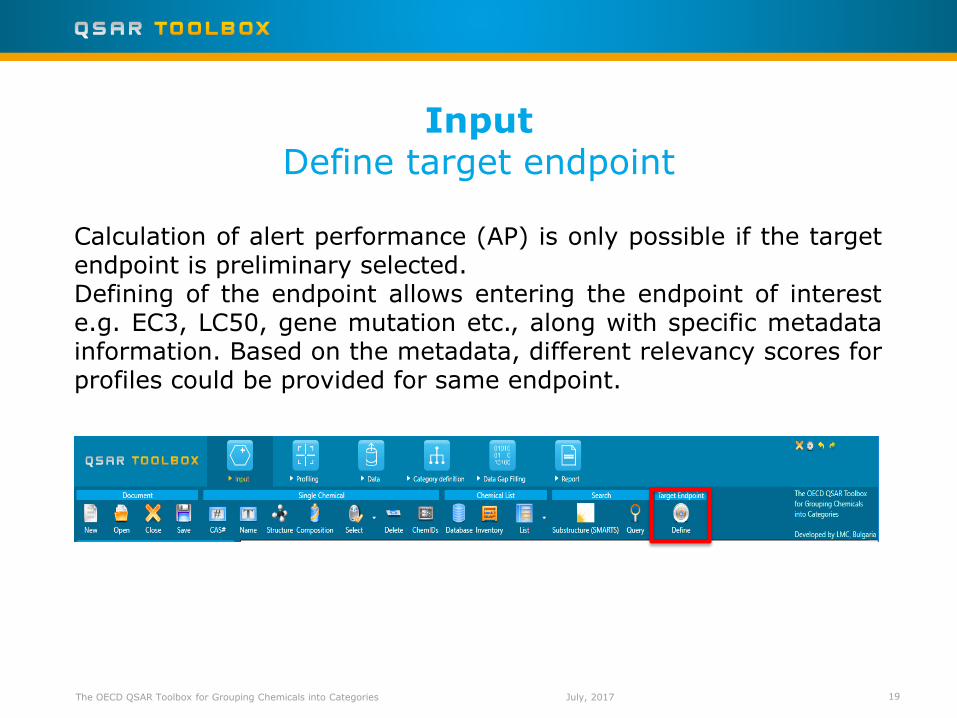
Input Define target endpoint
The OECD QSAR Toolbox for Grouping Chemicals into Categories 19
Calculation of alert performance (AP) is only possible if the target endpoint is preliminary selected. Defining of the endpoint allows entering the endpoint of interest e.g. EC3, LC50, gene mutation etc., along with specific metadata information. Based on the metadata, different relevancy scores for profiles could be provided for same endpoint.
July, 2017
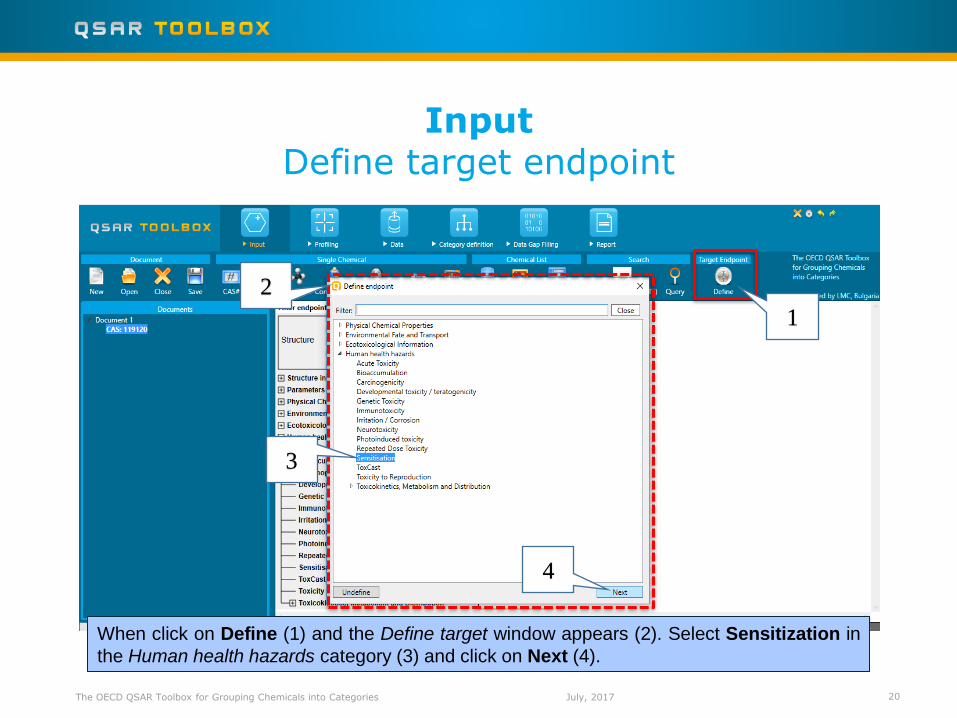
The OECD QSAR Toolbox for Grouping Chemicals into Categories 20
When click on Define (1) and the Define target window appears (2). Select Sensitization in
the Human health hazards category (3) and click on Next (4).
Input Define target endpoint
1
2
3
4
July, 2017
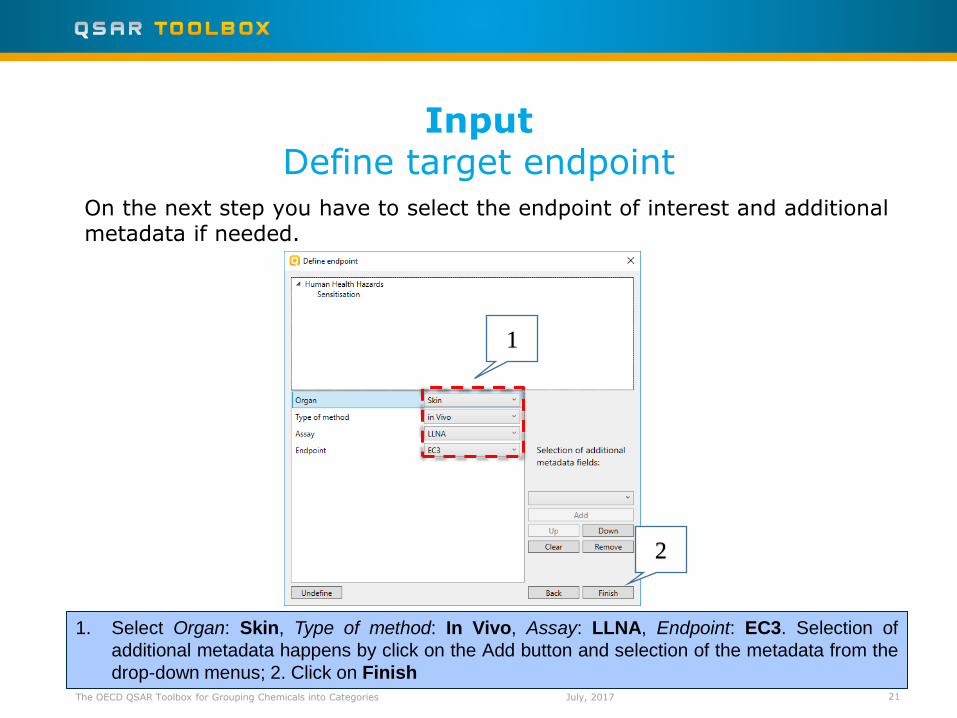
The OECD QSAR Toolbox for Grouping Chemicals into Categories 21
On the next step you have to select the endpoint of interest and additional metadata if needed.
Input Define target endpoint
1. Select Organ: Skin, Type of method: In Vivo, Assay: LLNA, Endpoint: EC3. Selection of
additional metadata happens by click on the Add button and selection of the metadata from the
drop-down menus; 2. Click on Finish
1
2
July, 2017
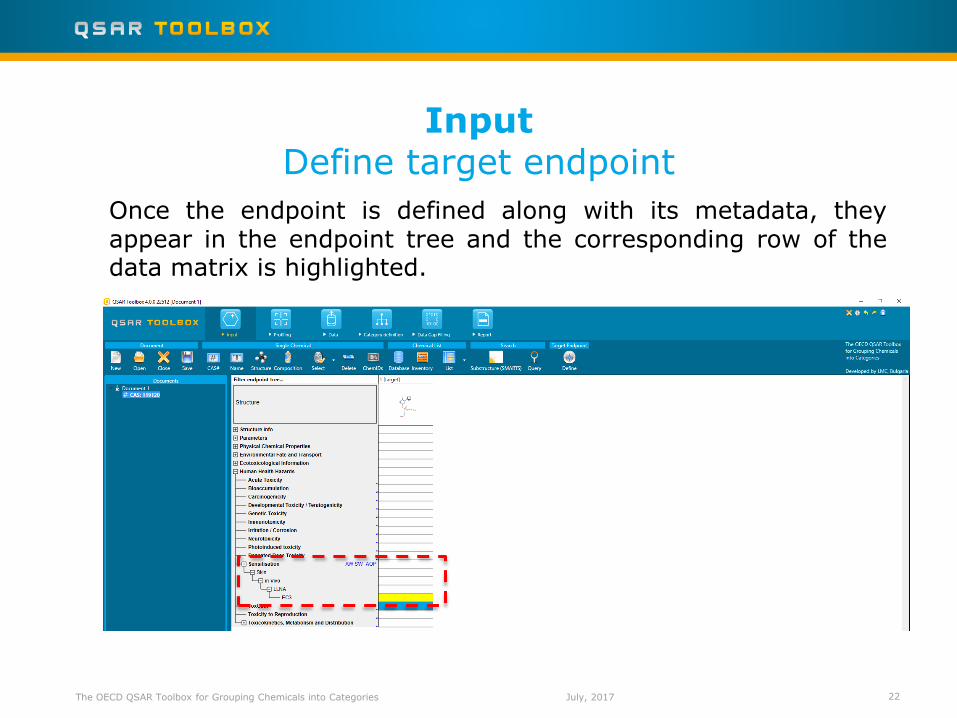
The OECD QSAR Toolbox for Grouping Chemicals into Categories 22
Input Define target endpoint
Once the endpoint is defined along with its metadata, they appear in the endpoint tree and the corresponding row of the data matrix is highlighted.
July, 2017
• Background
• Objectives
• Specific Aims
• Alert performance
• The exercise
• Workflow
o Input
o Profiling
Outlook
The OECD QSAR Toolbox for Grouping Chemicals into Categories 23 July, 2017
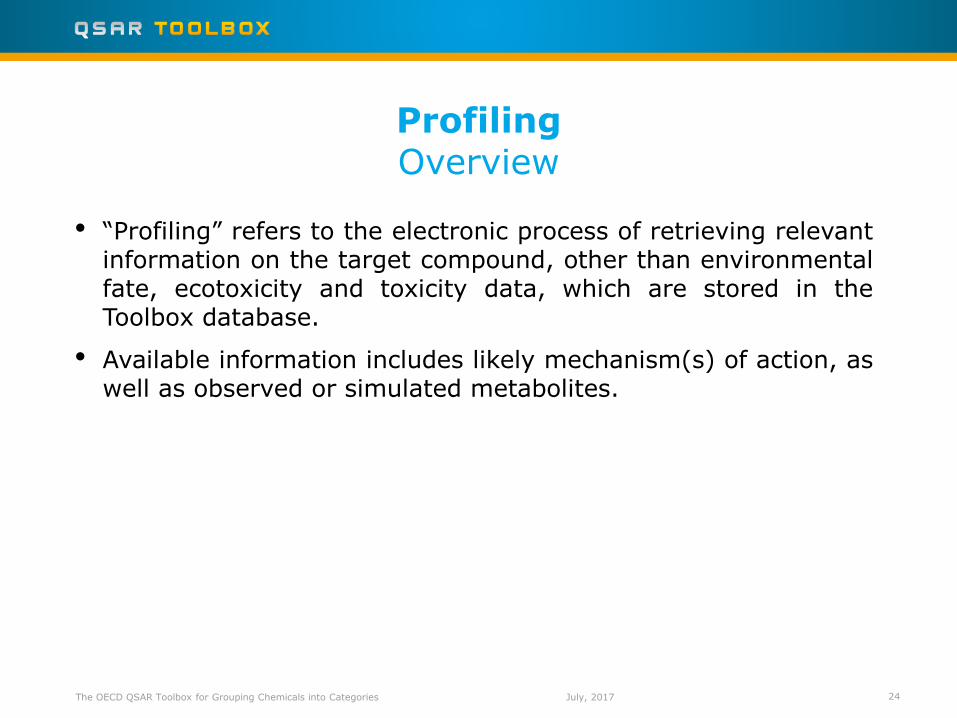
• “Profiling” refers to the electronic process of retrieving relevant information on the target compound, other than environmental fate, ecotoxicity and toxicity data, which are stored in the Toolbox database.
• Available information includes likely mechanism(s) of action, as well as observed or simulated metabolites.
The OECD QSAR Toolbox for Grouping Chemicals into Categories 24
Profiling Overview
July, 2017
25 The OECD QSAR Toolbox for Grouping Chemicals into Categories
Profiling Sidebar to profiles` relevancy
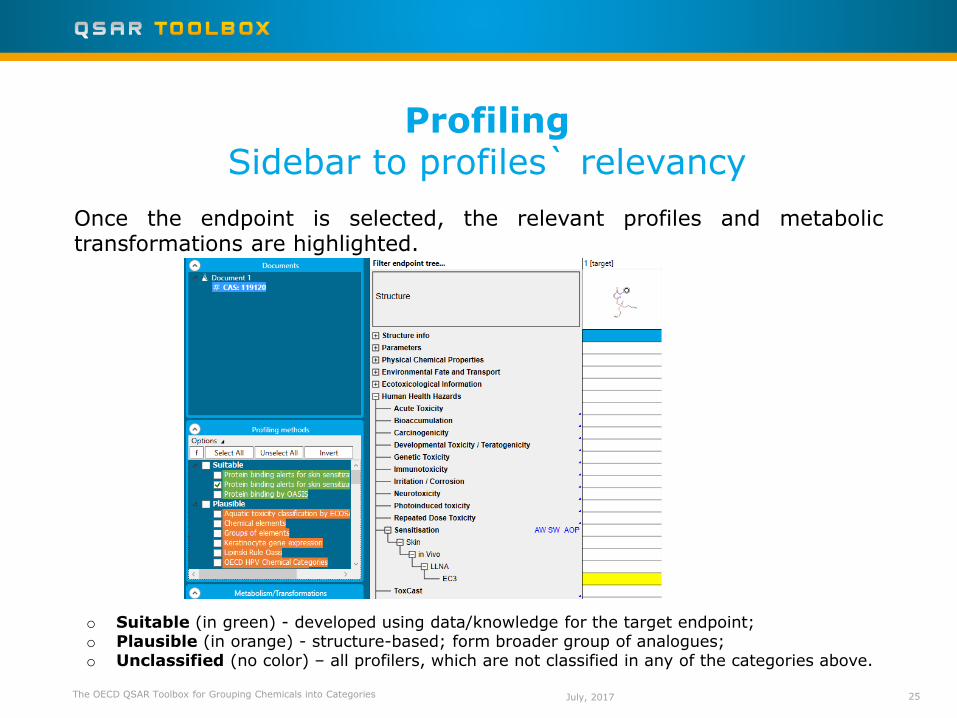
Once the endpoint is selected, the relevant profiles and metabolic transformations are highlighted.
o Suitable (in green) - developed using data/knowledge for the target endpoint; o Plausible (in orange) - structure-based; form broader group of analogues; o Unclassified (no color) – all profilers, which are not classified in any of the categories above.
July, 2017
26 The OECD QSAR Toolbox for Grouping Chemicals into Categories
Profiling Profiling the target chemical
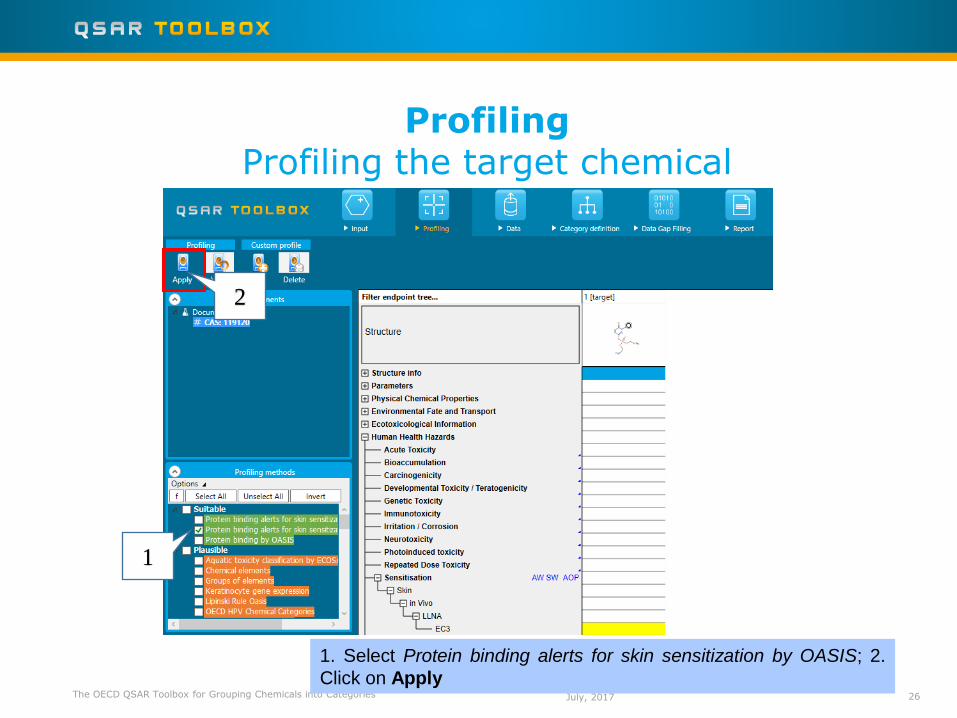
1. Select Protein binding alerts for skin sensitization by OASIS; 2.
Click on Apply
2
1
July, 2017
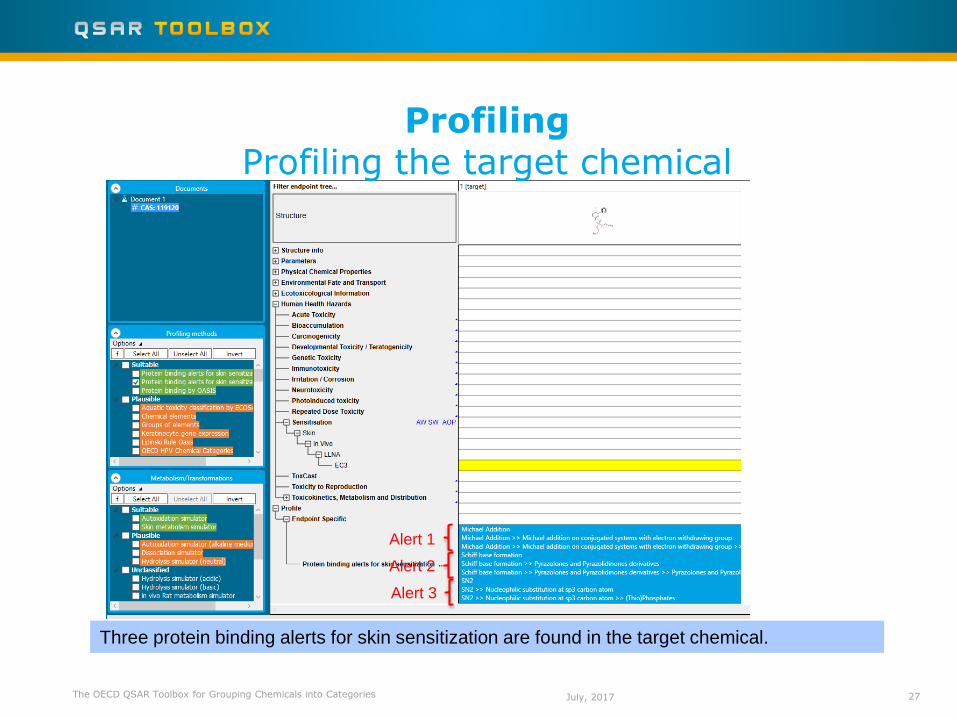
27 The OECD QSAR Toolbox for Grouping Chemicals into Categories
Profiling Profiling the target chemical
Three protein binding alerts for skin sensitization are found in the target chemical.
Alert 1
Alert 2
Alert 3
July, 2017
28 The OECD QSAR Toolbox for Grouping Chemicals into Categories
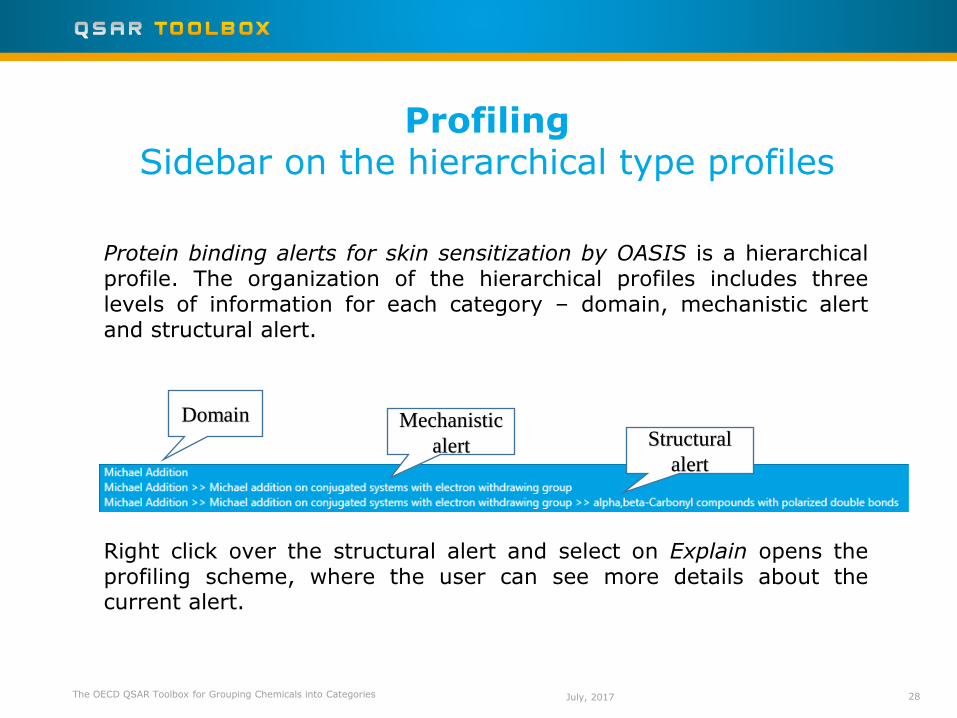
Profiling Sidebar on the hierarchical type profiles
Protein binding alerts for skin sensitization by OASIS is a hierarchical profile. The organization of the hierarchical profiles includes three levels of information for each category – domain, mechanistic alert and structural alert.
Domain
Right click over the structural alert and select on Explain opens the profiling scheme, where the user can see more details about the current alert.
Mechanistic
alert Structural
alert
July, 2017

• Background
• Objectives
• Specific Aims
• Read across and analogue approach
• The exercise
• Workflow
o Input
o Profiling
o Data
Outlook
The OECD QSAR Toolbox for Grouping Chemicals into Categories 29 July, 2017
• “Data” refers to the electronic process of retrieving the environmental fate, ecotoxicity and toxicity data that are stored in the Toolbox.
• Data gathering can be executed in a global fashion (i.e., collecting all data for all endpoints) or on a more narrowly defined basis (e.g., collecting data for a single or limited number of endpoints).
Data Overview
The OECD QSAR Toolbox for Grouping Chemicals into Categories 30 July, 2017
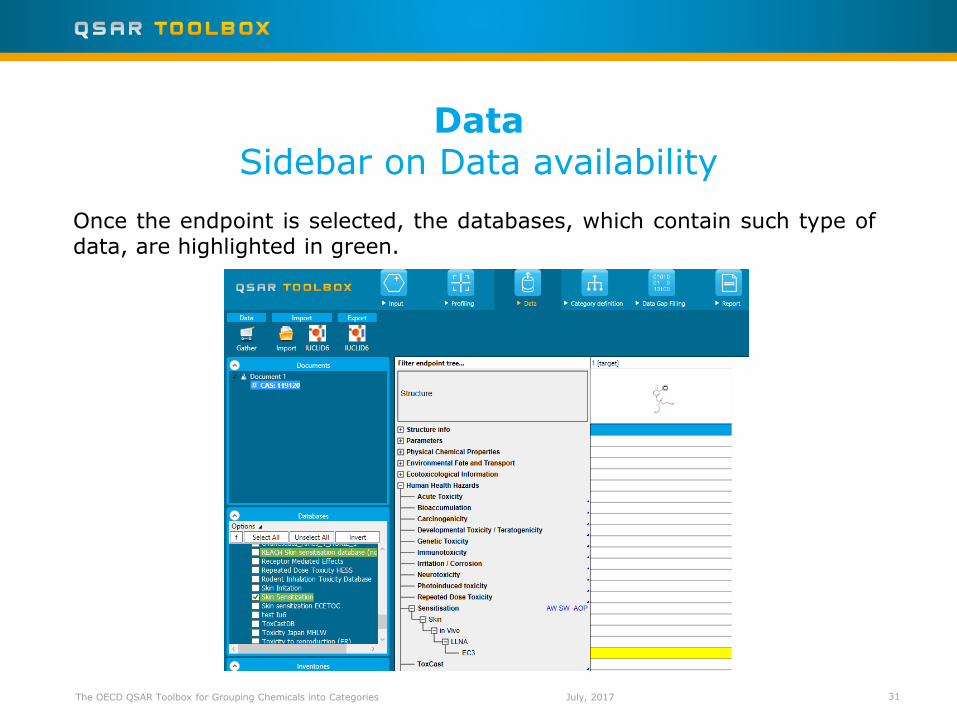
Once the endpoint is selected, the databases, which contain such type of data, are highlighted in green.
Data Sidebar on Data availability
The OECD QSAR Toolbox for Grouping Chemicals into Categories 31 July, 2017
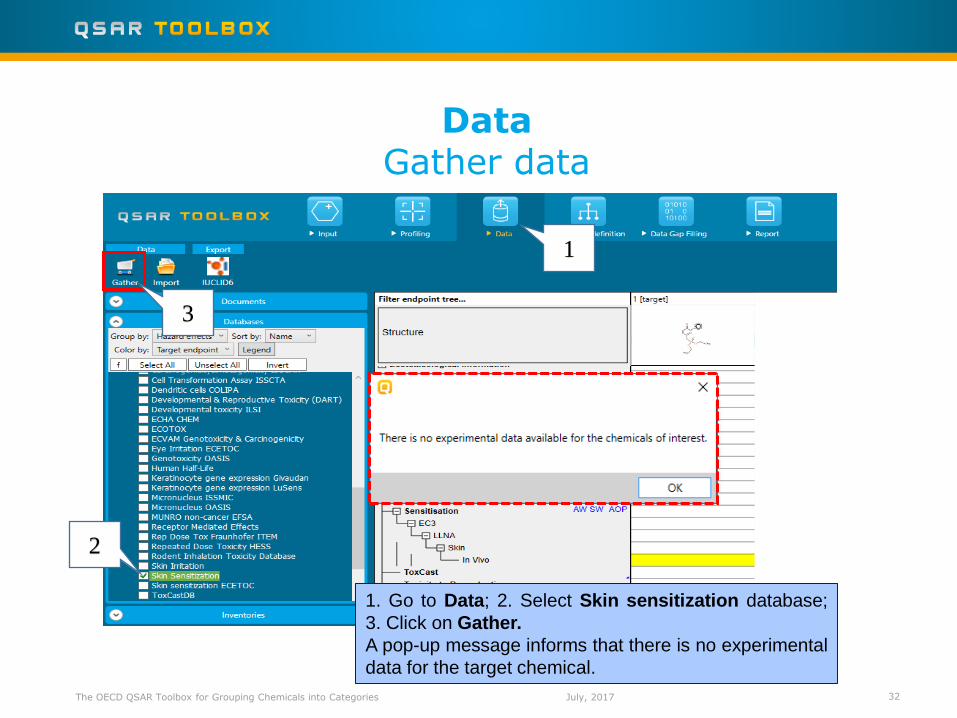
Data Gather data
The OECD QSAR Toolbox for Grouping Chemicals into Categories 32
3
2
1. Go to Data; 2. Select Skin sensitization database;
3. Click on Gather.
A pop-up message informs that there is no experimental
data for the target chemical.
1
July, 2017
• Toxicity information on the target chemical is electronically collected from the selected dataset(s).
• It should be kept in mind that the search for data and analogues (and therefore calculation of AP) is performed only among the chemicals which are listed in the selected databases. In this example only the Skin sensitization database is selected.
• In this example, an insert window appears stating there was “no data found” for the target chemical.
The OECD QSAR Toolbox for Grouping Chemicals into Categories 33
Data Gather data
July, 2017
• Background
• Objectives
• Specific Aims
• Read across and analogue approach
• The exercise
• Workflow
o Input
o Profiling
o Data
o Category definition
Outlook
The OECD QSAR Toolbox for Grouping Chemicals into Categories 34 July, 2017
• In module one, you have entered the target chemical and define the target endpoint.
• In the second module, you have profiled the target chemical with profiling scheme, which is suitable for the selected target endpoint.
• In the third module, you have seen the database corresponding to the defined target endpoint. You have found that no experimental data is currently available in the database for the structure.
• In other words, you have identified a data gap which you would like to fill.
• Click on “Category Definition” to move to the next module.
Recap
The OECD QSAR Toolbox for Grouping Chemicals into Categories 35 July, 2017
• This module provides the user with several means of grouping chemicals into a toxicologically meaningful category that includes the target molecule.
• This is the critical step in the workflow.
• Several options are available in the Toolbox to assist the user in refining the category definition.
Category Definition Overview
The OECD QSAR Toolbox for Grouping Chemicals into Categories 36 July, 2017
• The different grouping methods allow the user to group chemicals into chemical categories according to different measures of “similarity” so that within a category data gaps can be filled by read-across.
• For example, starting from a target chemical for which a specific protein binding mechanism is identified, analogues can be found which can bind by the same mechanism and for which experimental results are available.
The OECD QSAR Toolbox for Grouping Chemicals into Categories 37
Category Definition Grouping methods
July, 2017
• This is one of the best grouping methods in the Toolbox. It is built on conventional organic chemical reactions and as such is qualitative in character.
• This method is particularly relevant for respiratory and skin sensitization and acute aquatic toxicity, but also for chromosomal aberration and acute inhalation toxicity.
The OECD QSAR Toolbox for Grouping Chemicals into Categories 38
Category Definition Protein binding by OASIS grouping method
July, 2017
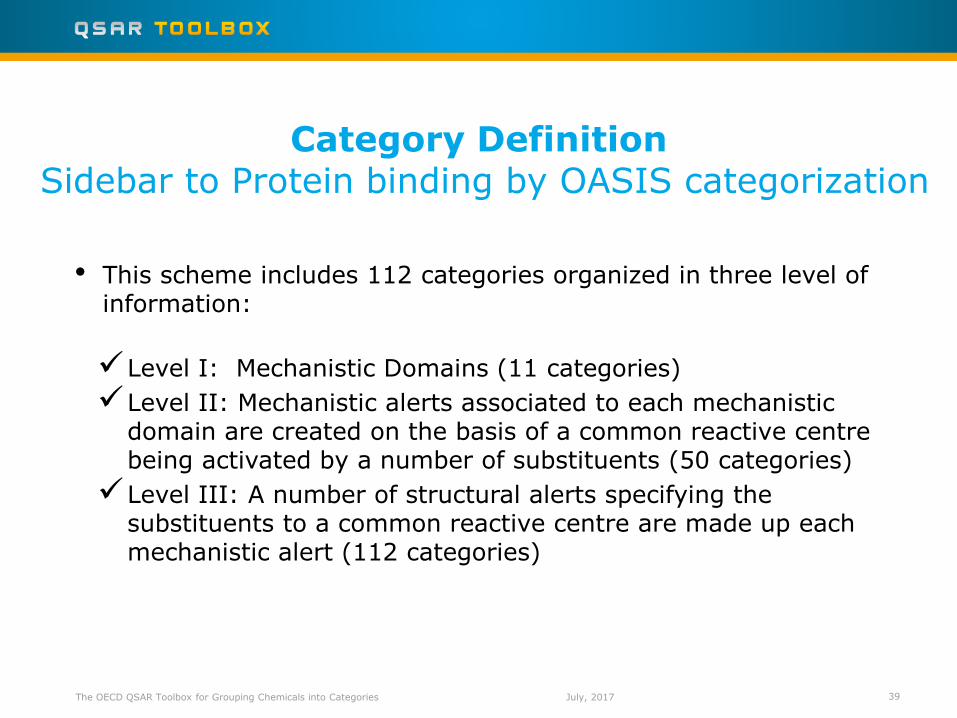
• This scheme includes 112 categories organized in three level of information:
Level I: Mechanistic Domains (11 categories)
Level II: Mechanistic alerts associated to each mechanistic domain are created on the basis of a common reactive centre being activated by a number of substituents (50 categories)
Level III: A number of structural alerts specifying the substituents to a common reactive centre are made up each mechanistic alert (112 categories)
The OECD QSAR Toolbox for Grouping Chemicals into Categories 39
Category Definition Sidebar to Protein binding by OASIS categorization
July, 2017
• Each category from level III is presented by defined 2-dimensional structural alerts that is responsible for the eliciting toxic effects, such as skin sensitization which are a result of protein binding.
• The associated chemical reactions are in accordance with existing knowledge on electrophilic interaction mechanisms of various structural functionalities.
The OECD QSAR Toolbox for Grouping Chemicals into Categories 40
Category Definition Sidebar to Protein binding by OASIS categorization
July, 2017
• There is an agreement that most organic chemicals must react covalently with skin proteins in order to behave as skin sensitizers.
• Therefore, chemical reactions by which organic chemicals bind with proteins are relevant to grouping chemicals that may be skin sensitizing agents. So you have mechanistic plausibility for defining your category based on similar protein-binding mechanism.
The OECD QSAR Toolbox for Grouping Chemicals into Categories 41
Category Definition Sidebar to Protein binding by OASIS categorization
July, 2017
• When more than one alert is found in the target structure before or after metabolic activation, Alert performance could be used to define which of them is the most suitable for primary categorization
The OECD QSAR Toolbox for Grouping Chemicals into Categories 42
Category Definition
July, 2017
The performance of an alert represents the number of chemicals
with data related to the predefined scale across all chemicals
from the selected databases, which have the same alert. It
provides and distribution of data according to a given effect (e.g.
positive, negative) in percentages.
Alert performance Overview
The OECD QSAR Toolbox for Grouping Chemicals into Categories 43 July, 2017
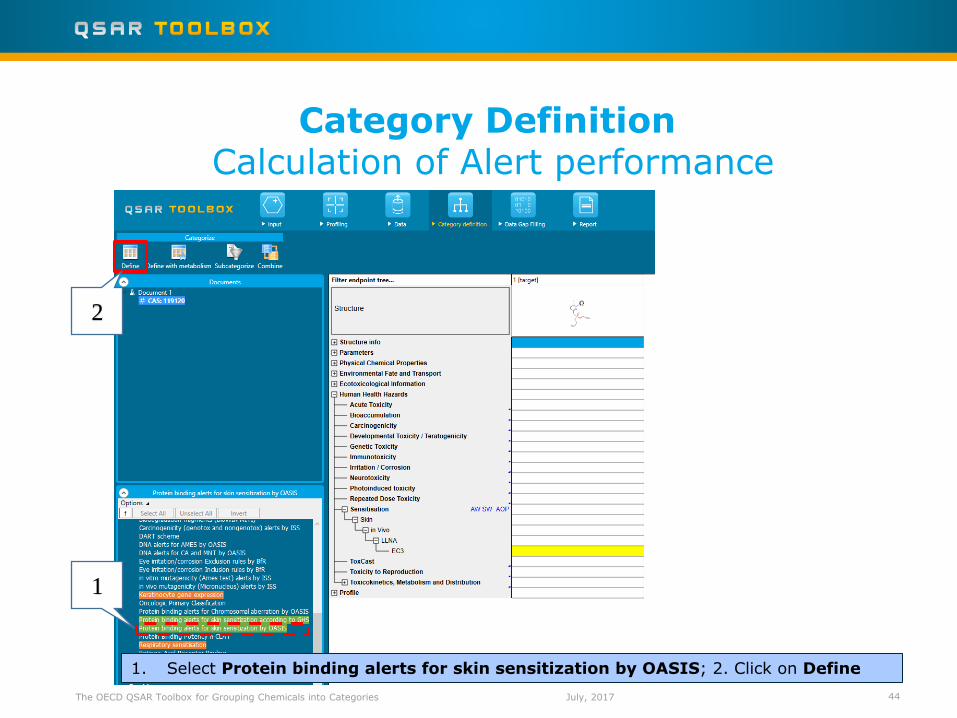
Category Definition Calculation of Alert performance
The OECD QSAR Toolbox for Grouping Chemicals into Categories 44
1. Select Protein binding alerts for skin sensitization by OASIS; 2. Click on Define
1
July, 2017
2
Category Definition Calculation of Alert performance
The OECD QSAR Toolbox for Grouping Chemicals into Categories 45
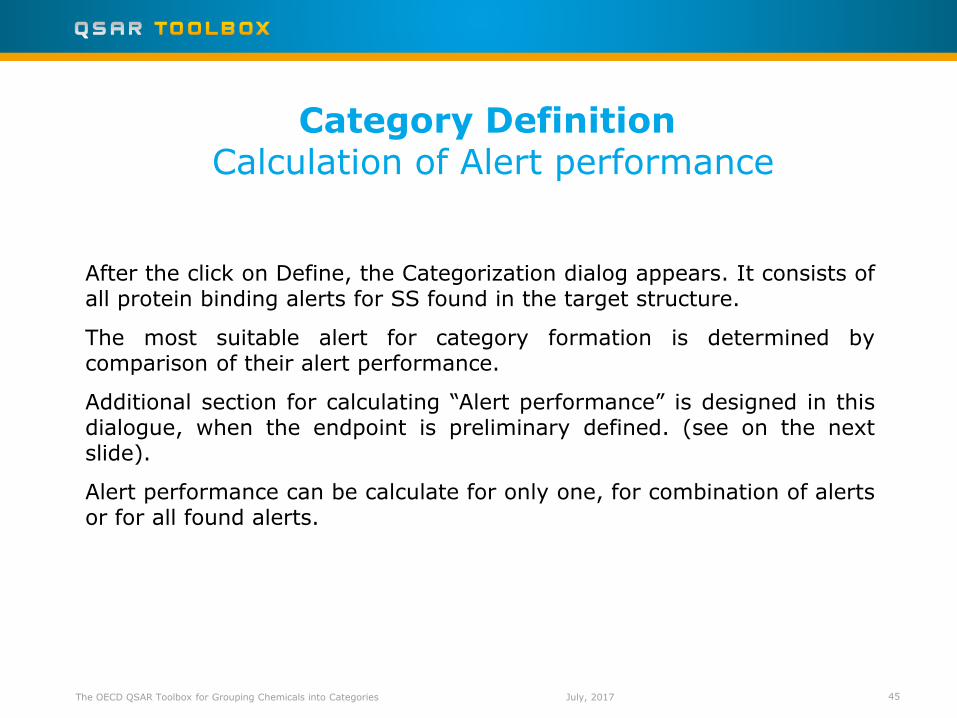
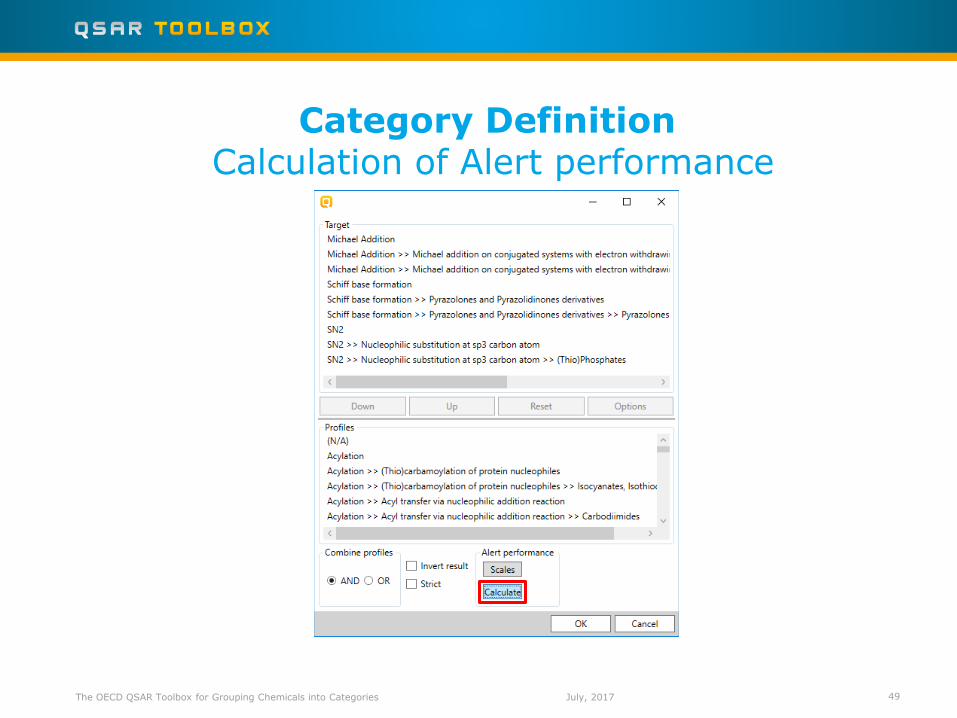
After the click on Define, the Categorization dialog appears. It consists of all protein binding alerts for SS found in the target structure.
The most suitable alert for category formation is determined by comparison of their alert performance.
Additional section for calculating “Alert performance” is designed in this dialogue, when the endpoint is preliminary defined. (see on the next slide).
Alert performance can be calculate for only one, for combination of alerts or for all found alerts.
July, 2017
Category Definition Calculation of Alert performance
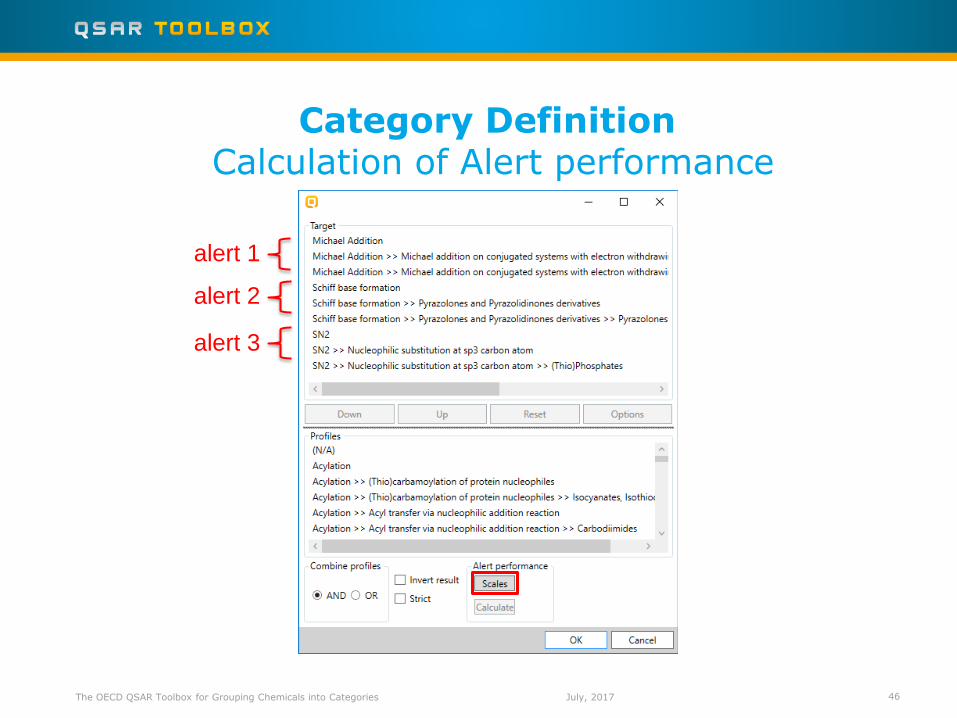
The OECD QSAR Toolbox for Grouping Chemicals into Categories 46
alert 1
alert 2
alert 3
July, 2017
Category Definition Calculation of Alert performance
The OECD QSAR Toolbox for Grouping Chemicals into Categories 47
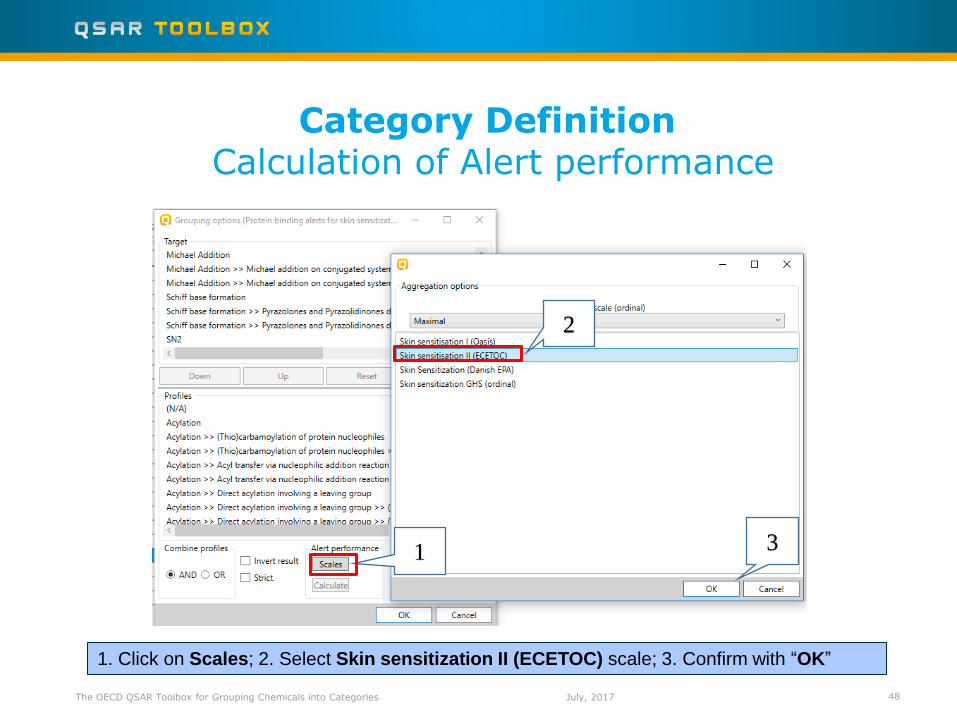
In order to calculate the performance of an alert, first of all you have to click on Scales.
The main purpose of the scales is to unify all data available in the Toolbox databases for a certain endpoint. Therefore, the most appropriate scale is “Skin Sensitisation II (ECETOC)”. It is a dichotomous scale that converts all skin data into: Positive and Negative.
Additional option for applying different weight of the data that is available is also provided. Worst case scenario have been taken into account, i.e. “Maximal” data is set as default.
July, 2017
Category Definition Calculation of Alert performance
The OECD QSAR Toolbox for Grouping Chemicals into Categories 48
1
1. Click on Scales; 2. Select Skin sensitization II (ECETOC) scale; 3. Confirm with “OK”
July, 2017
2
3
Category Definition Calculation of Alert performance
The OECD QSAR Toolbox for Grouping Chemicals into Categories 49 July, 2017
Category Definition Calculation of Alert performance
The OECD QSAR Toolbox for Grouping Chemicals into Categories 50 July, 2017
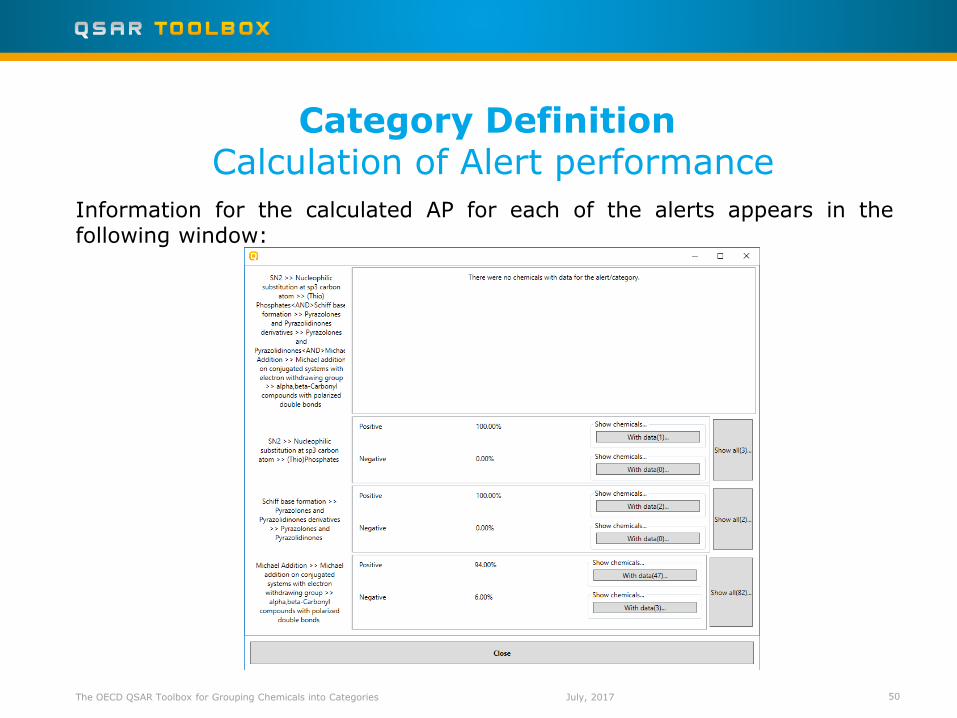
Information for the calculated AP for each of the alerts appears in the following window:
Category Definition Calculation of Alert performance for one alert
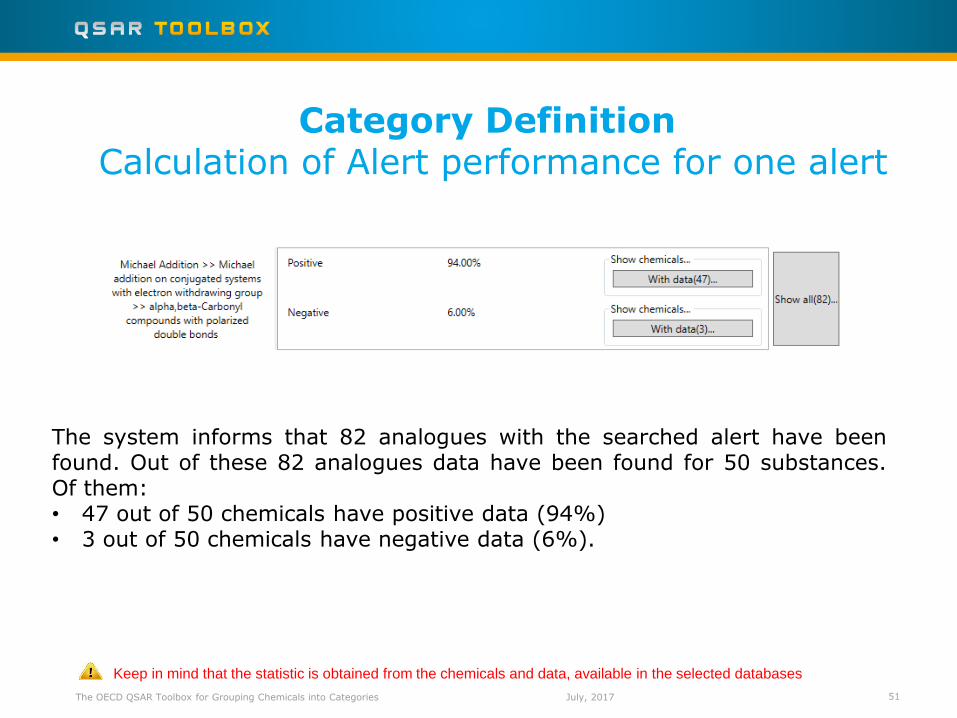
The OECD QSAR Toolbox for Grouping Chemicals into Categories 51 July, 2017
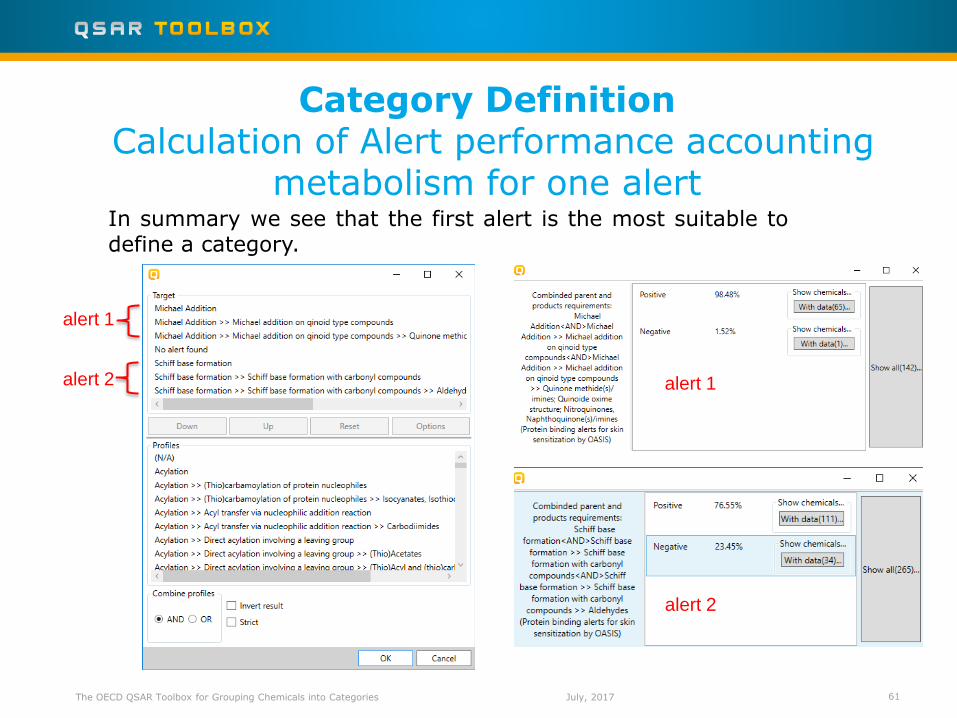
The system informs that 82 analogues with the searched alert have been found. Out of these 82 analogues data have been found for 50 substances. Of them: • 47 out of 50 chemicals have positive data (94%) • 3 out of 50 chemicals have negative data (6%).
Keep in mind that the statistic is obtained from the chemicals and data, available in the selected databases
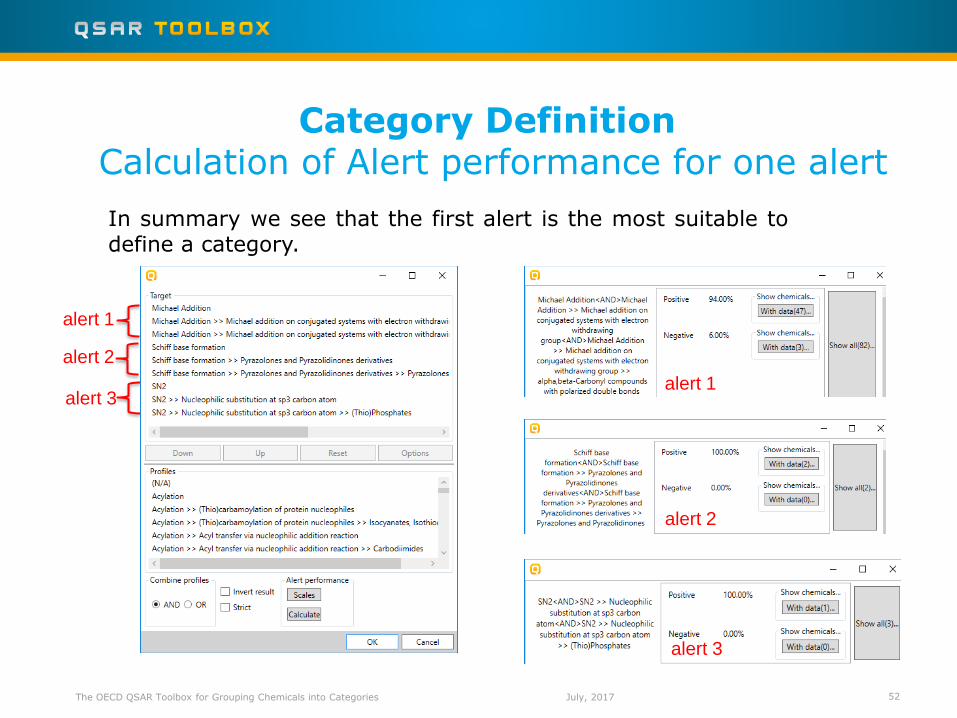
Category Definition Calculation of Alert performance for one alert
The OECD QSAR Toolbox for Grouping Chemicals into Categories 52
In summary we see that the first alert is the most suitable to define a category.
alert 1
alert 2
alert 3
alert 2
alert 3
alert 1
July, 2017
Category Definition Sidebar on Alert performance accounting
metabolism
The OECD QSAR Toolbox for Grouping Chemicals into Categories 53
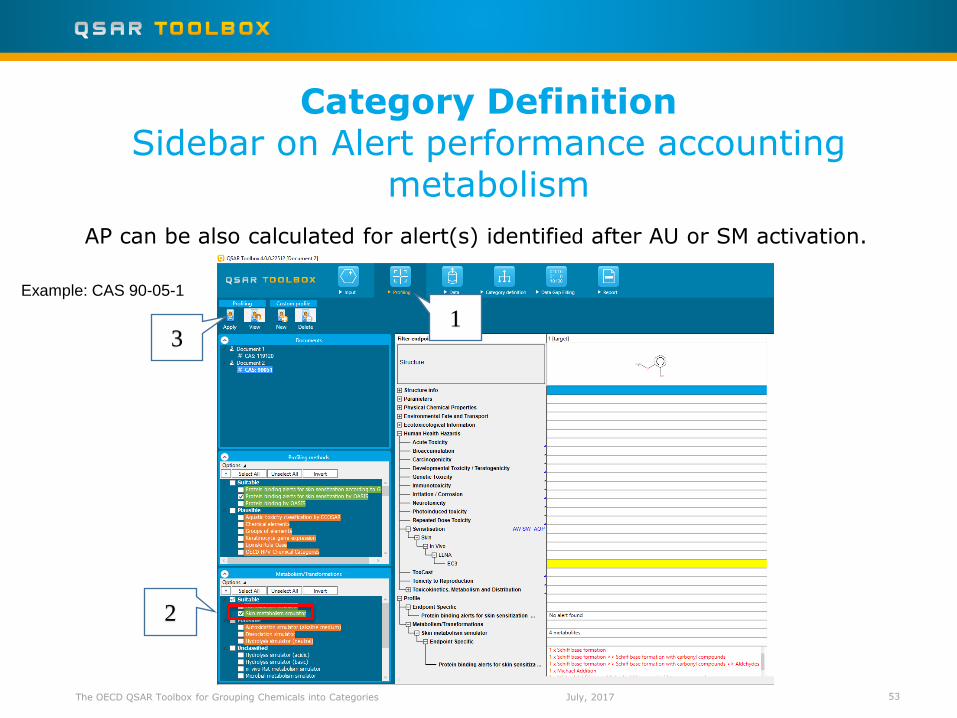
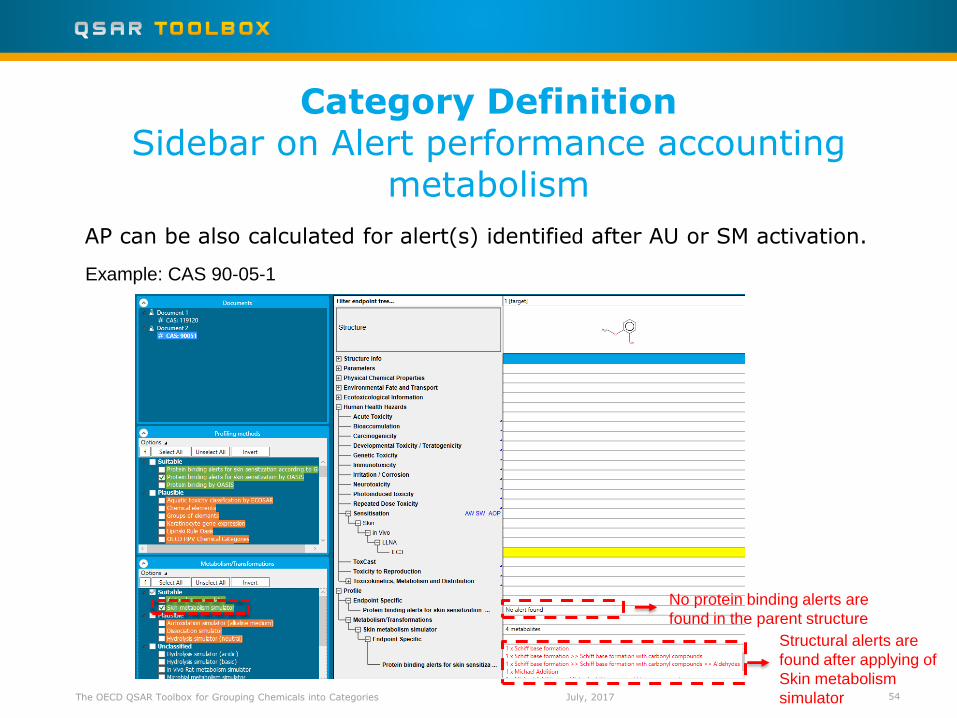
AP can be also calculated for alert(s) identified after AU or SM activation.
Example: CAS 90-05-1
1
2
3
July, 2017
Category Definition Sidebar on Alert performance accounting
metabolism
The OECD QSAR Toolbox for Grouping Chemicals into Categories 54
AP can be also calculated for alert(s) identified after AU or SM activation.
No protein binding alerts are
found in the parent structure
Structural alerts are
found after applying of
Skin metabolism
simulator
Example: CAS 90-05-1
July, 2017
The OECD QSAR Toolbox for Grouping Chemicals into Categories 55
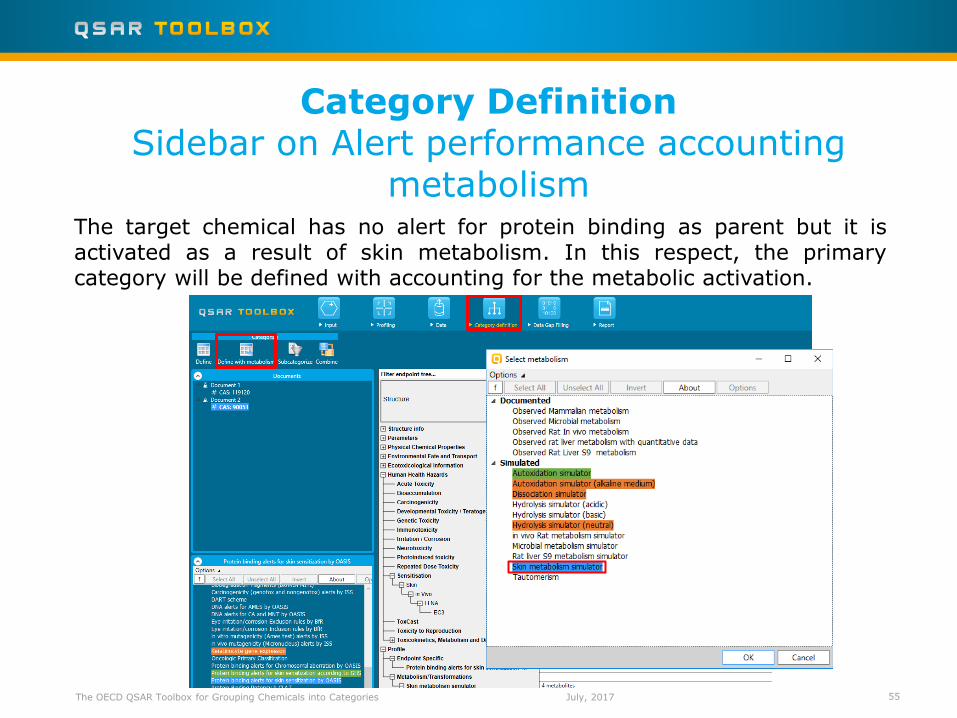
The target chemical has no alert for protein binding as parent but it is activated as a result of skin metabolism. In this respect, the primary category will be defined with accounting for the metabolic activation.
Category Definition Sidebar on Alert performance accounting
metabolism
July, 2017
The OECD QSAR Toolbox for Grouping Chemicals into Categories 56
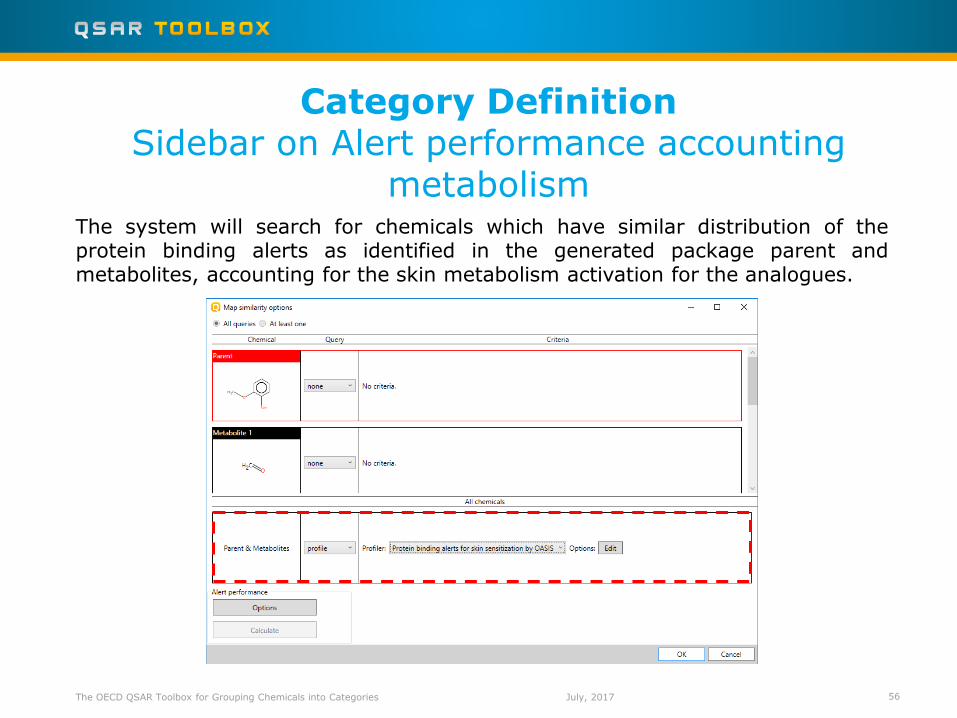
The system will search for chemicals which have similar distribution of the protein binding alerts as identified in the generated package parent and metabolites, accounting for the skin metabolism activation for the analogues.
Category Definition Sidebar on Alert performance accounting
metabolism
July, 2017
The OECD QSAR Toolbox for Grouping Chemicals into Categories 57
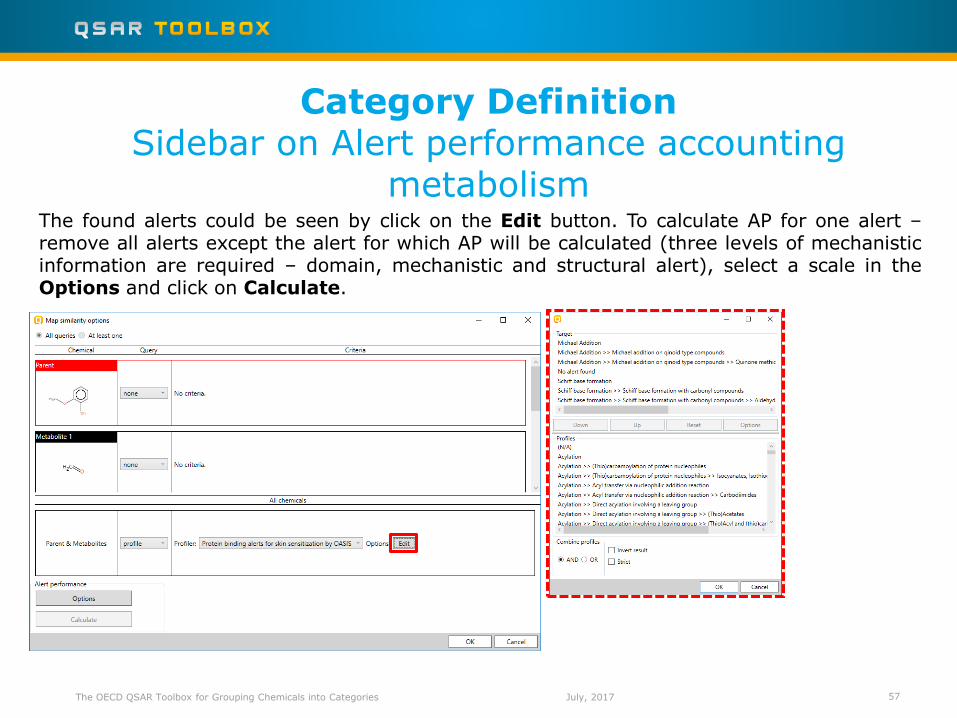
The found alerts could be seen by click on the Edit button. To calculate AP for one alert – remove all alerts except the alert for which AP will be calculated (three levels of mechanistic information are required – domain, mechanistic and structural alert), select a scale in the Options and click on Calculate.
Category Definition Sidebar on Alert performance accounting
metabolism
July, 2017
Category Definition Calculation of Alert performance accounting
metabolism for one alert
The OECD QSAR Toolbox for Grouping Chemicals into Categories 58
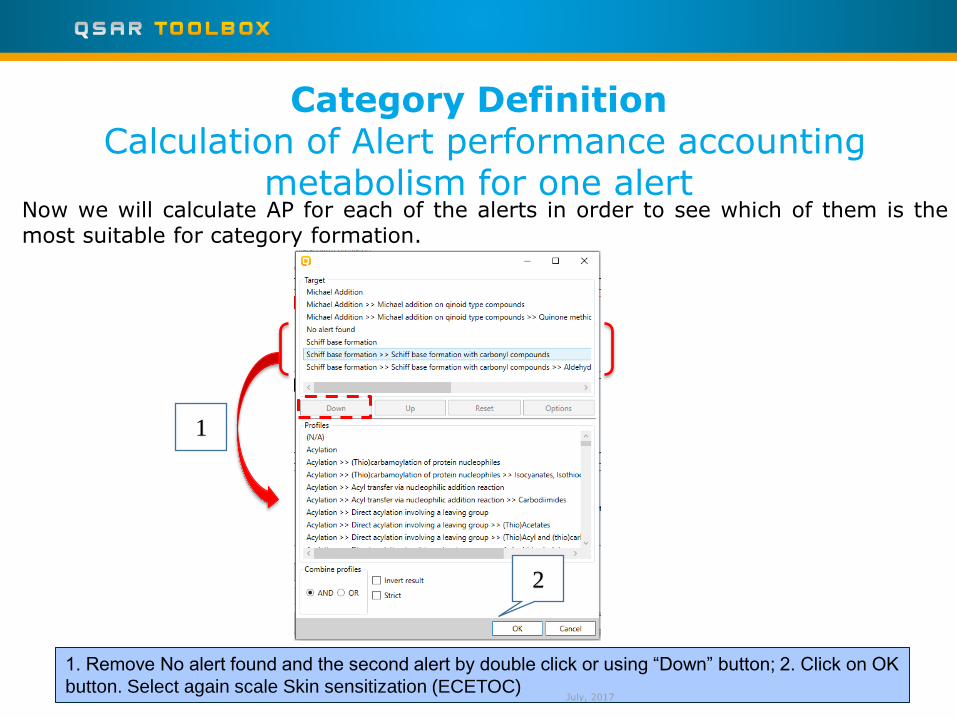
Now we will calculate AP for each of the alerts in order to see which of them is the most suitable for category formation.
1. Remove No alert found and the second alert by double click or using “Down” button; 2. Click on OK
button. Select again scale Skin sensitization (ECETOC)
1
2
July, 2017
Category Definition Calculation of Alert performance accounting
metabolism for one alert
The OECD QSAR Toolbox for Grouping Chemicals into Categories 59
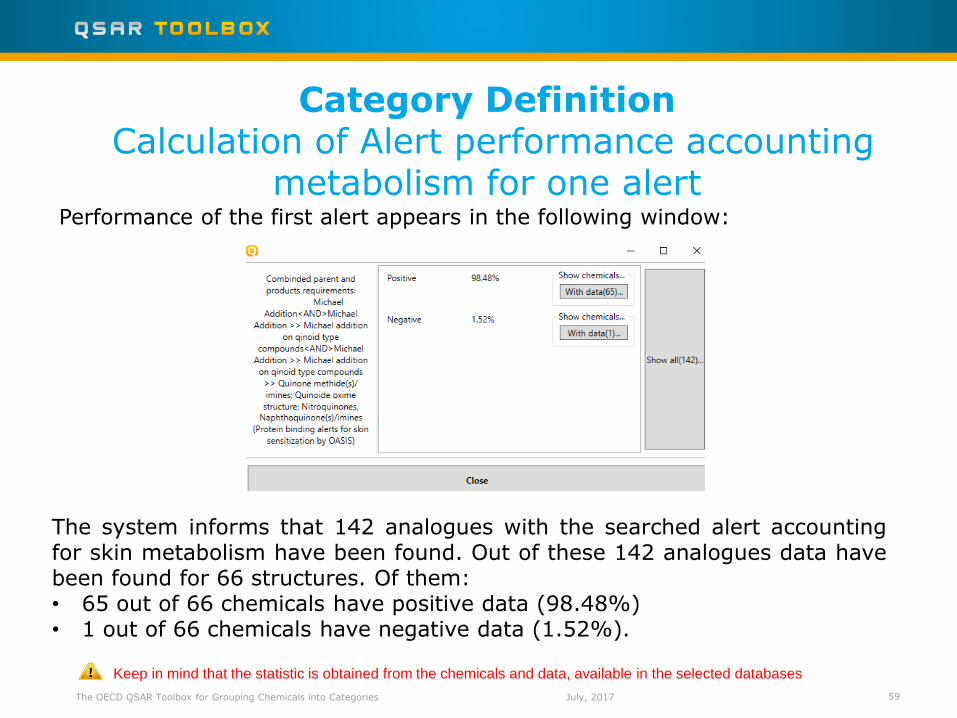
Performance of the first alert appears in the following window:
July, 2017
The system informs that 142 analogues with the searched alert accounting for skin metabolism have been found. Out of these 142 analogues data have been found for 66 structures. Of them: • 65 out of 66 chemicals have positive data (98.48%) • 1 out of 66 chemicals have negative data (1.52%).
Keep in mind that the statistic is obtained from the chemicals and data, available in the selected databases
Category Definition Calculation of Alert performance accounting
metabolism for one alert
The OECD QSAR Toolbox for Grouping Chemicals into Categories 60
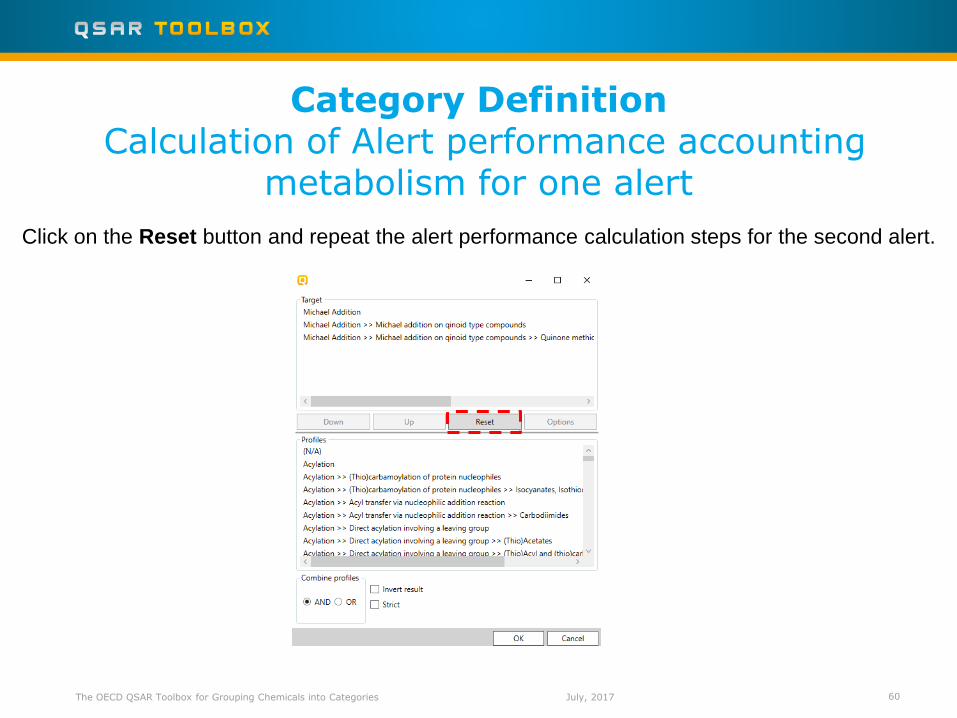
Click on the Reset button and repeat the alert performance calculation steps for the second alert.
July, 2017
Category Definition Calculation of Alert performance accounting
metabolism for one alert
The OECD QSAR Toolbox for Grouping Chemicals into Categories 61
In summary we see that the first alert is the most suitable to define a category.
alert 1
alert 2
alert 2
alert 1
July, 2017
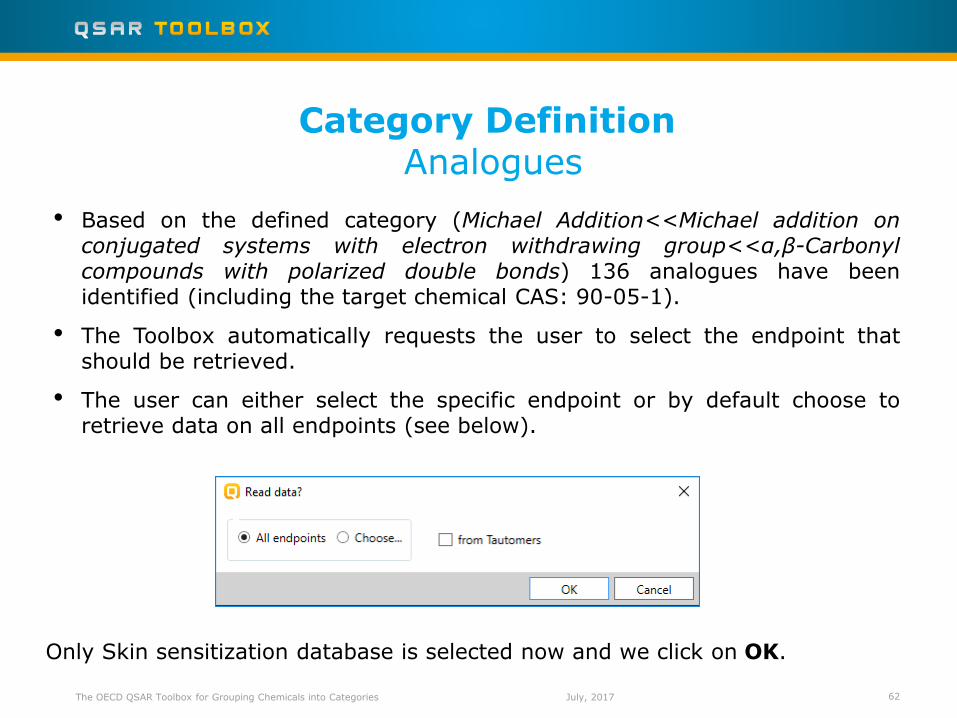
• Based on the defined category (Michael Addition<<Michael addition on conjugated systems with electron withdrawing group<<α,β-Carbonyl compounds with polarized double bonds) 136 analogues have been identified (including the target chemical CAS: 90-05-1).
• The Toolbox automatically requests the user to select the endpoint that should be retrieved.
• The user can either select the specific endpoint or by default choose to retrieve data on all endpoints (see below).
The OECD QSAR Toolbox for Grouping Chemicals into Categories 62
Category Definition Analogues
Only Skin sensitization database is selected now and we click on OK.
July, 2017
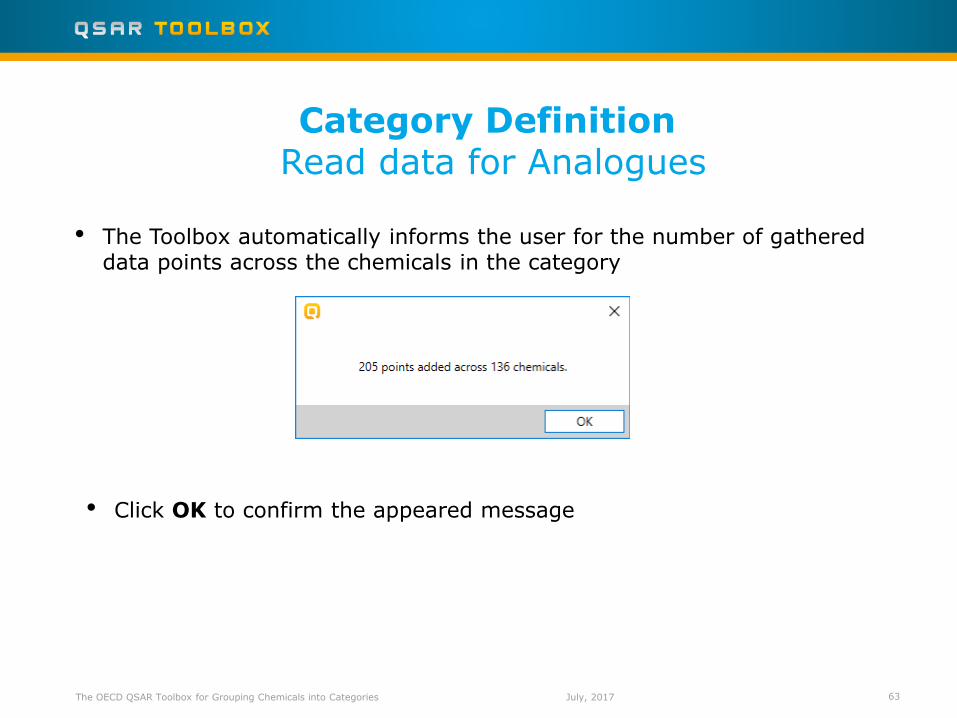
• The Toolbox automatically informs the user for the number of gathered data points across the chemicals in the category
The OECD QSAR Toolbox for Grouping Chemicals into Categories 63
Category Definition Read data for Analogues
• Click OK to confirm the appeared message
July, 2017
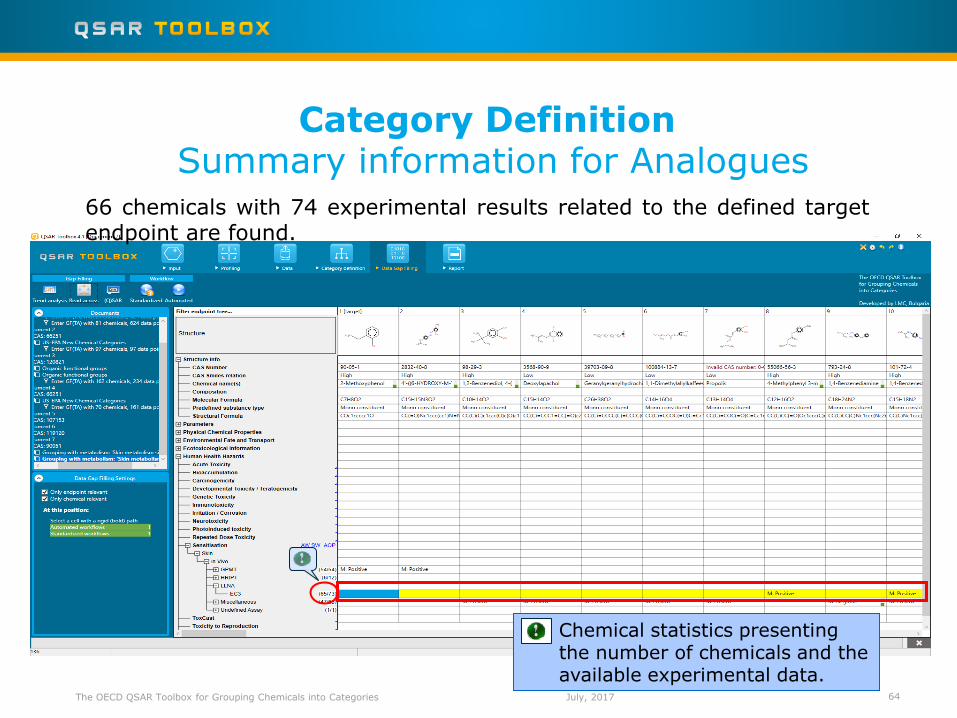
66 chemicals with 74 experimental results related to the defined target endpoint are found.
The OECD QSAR Toolbox for Grouping Chemicals into Categories 64
Category Definition Summary information for Analogues
Chemical statistics presenting the number of chemicals and the available experimental data.
July, 2017
• Background
• Objectives
• Specific Aims
• Read across and analogue approach
• The exercise
• Workflow
o Input
o Profiling
o Data
o Category definition
o Data Gap Filling
Outlook
The OECD QSAR Toolbox for Grouping Chemicals into Categories 65 July, 2017
• You have identified three protein binding alerts for the target chemical (pyridaphenthion).
• You have calculated and compare the alert performance for each of the alerts.
• You have now retrieved in the available experimental results on skin sensitisation (EC3) values for 65 chemicals with the same mechanism of protein binding as the target compound, which were found in the “Skin Sensitisation” database.
• The user can now proceed to the next module; click on ”Data Gap Filling”.
66 The OECD QSAR Toolbox for Grouping Chemicals into Categories
Recap
July, 2017
The OECD QSAR Toolbox for Grouping Chemicals into Categories 67
Data Gap Filling Overview
• “Data Gap Filling” module give access to five different data gap filling tools:
o Read-across
o Trend analysis
o (Q)SAR models
o Standardized workflow
o Automated workflow
• Depending on the situation, the most relevant data gap mechanism should be chosen, taking into account the following considerations:
o Read-across is the appropriate data-gap filling method for “qualitative” endpoints like skin sensitisation
or mutagenicity for which a limited number of results are possible (e.g. positive, negative, equivocal).
Furthermore read-across is recommended for “quantitative endpoints” (e.g., 96h-LC50 for fish) if only a
low number of analogues with experimental results are identified.
o Trend analysis is the appropriate data-gap filling method for “quantitative endpoints” (e.g., 96h-LC50 for
fish) if a high number of analogues with experimental results are identified.
o “(Q)SAR models” can be used to fill a data gap if no adequate analogues are found for a target chemical.
o Standardized and Automated workflows are developed to facilitate the users work. Once started, they
follow the implemented logic and finish with prediction. The general differences between the two type of
workflows are represented on the next slide.
In this example we will use the manual read-across approach. July, 2017
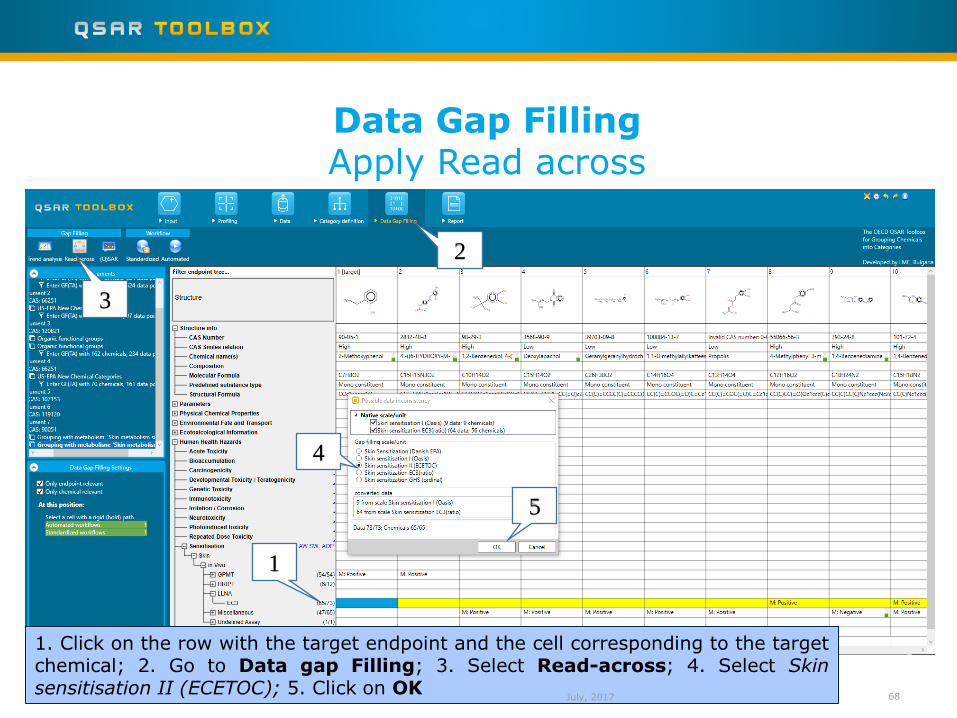
The OECD QSAR Toolbox for Grouping Chemicals into Categories 68
Data Gap Filling Apply Read across
1. Click on the row with the target endpoint and the cell corresponding to the target chemical; 2. Go to Data gap Filling; 3. Select Read-across; 4. Select Skin sensitisation II (ECETOC); 5. Click on OK
3
July, 2017
2
1
4
5
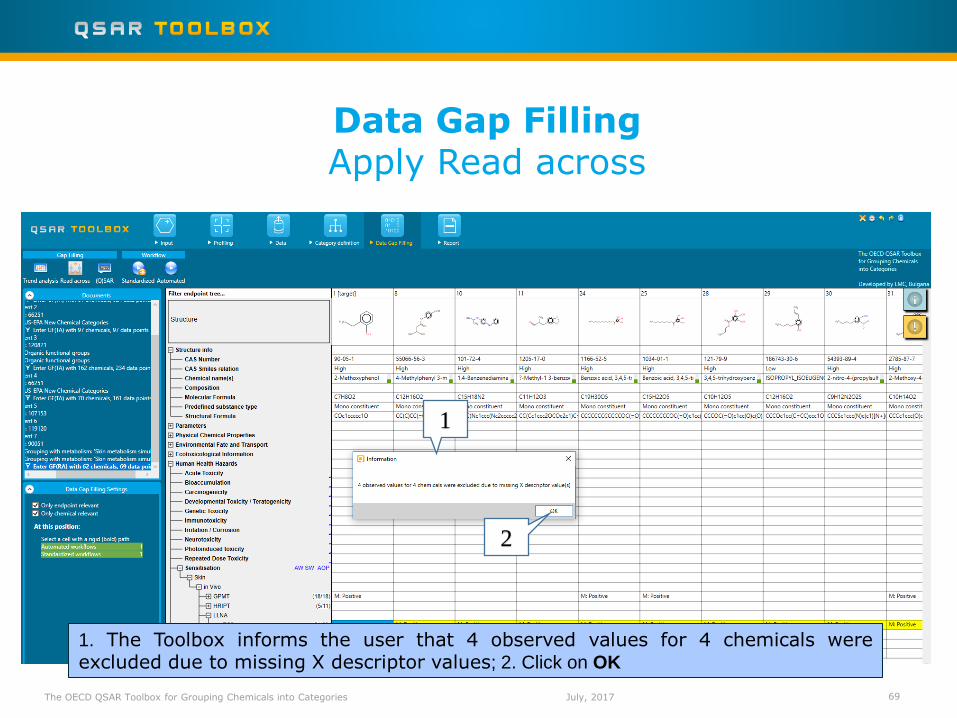
The OECD QSAR Toolbox for Grouping Chemicals into Categories 69
Data Gap Filling Apply Read across
1. The Toolbox informs the user that 4 observed values for 4 chemicals were excluded due to missing X descriptor values; 2. Click on OK
1
2
July, 2017
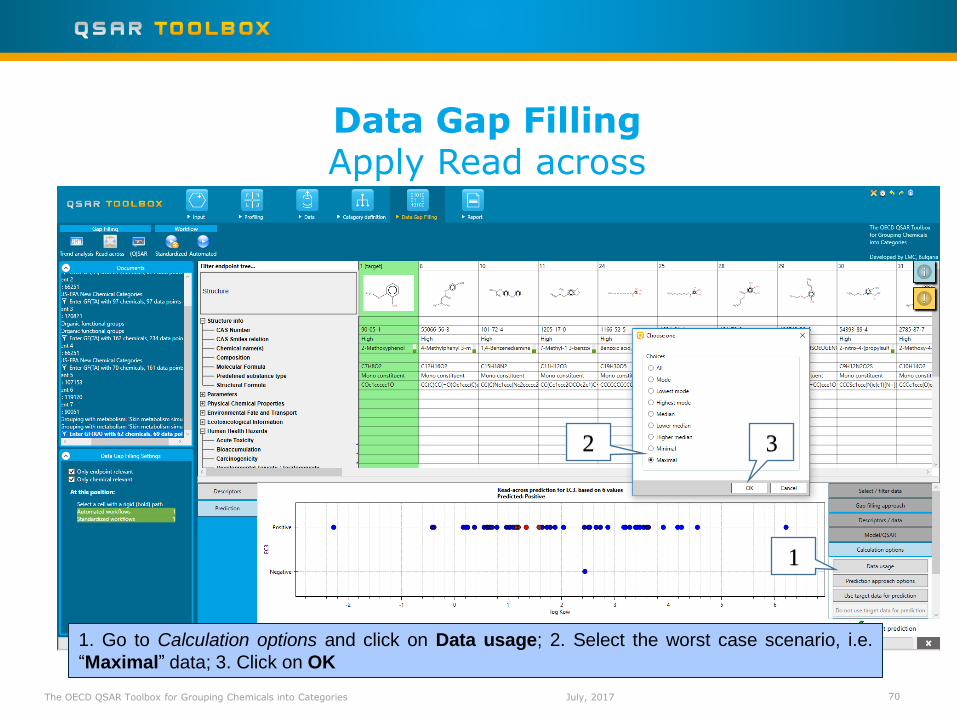
The OECD QSAR Toolbox for Grouping Chemicals into Categories 70
Data Gap Filling Apply Read across
1. Go to Calculation options and click on Data usage; 2. Select the worst case scenario, i.e.
“Maximal” data; 3. Click on OK
1
2 3
July, 2017
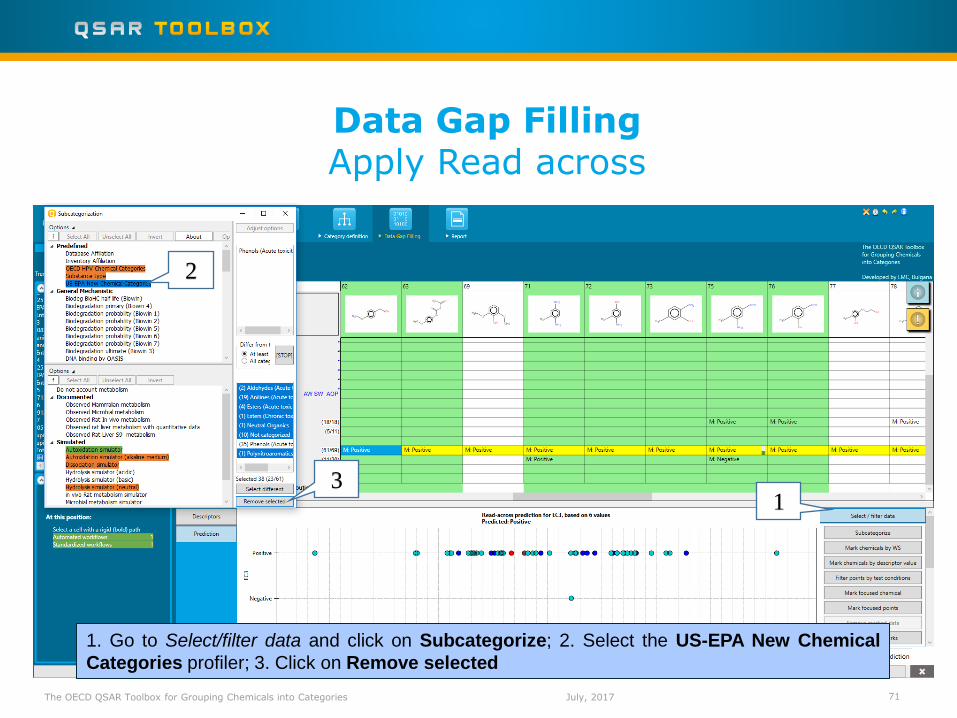
The OECD QSAR Toolbox for Grouping Chemicals into Categories 71
Data Gap Filling Apply Read across
1. Go to Select/filter data and click on Subcategorize; 2. Select the US-EPA New Chemical
Categories profiler; 3. Click on Remove selected
1
2
3
July, 2017
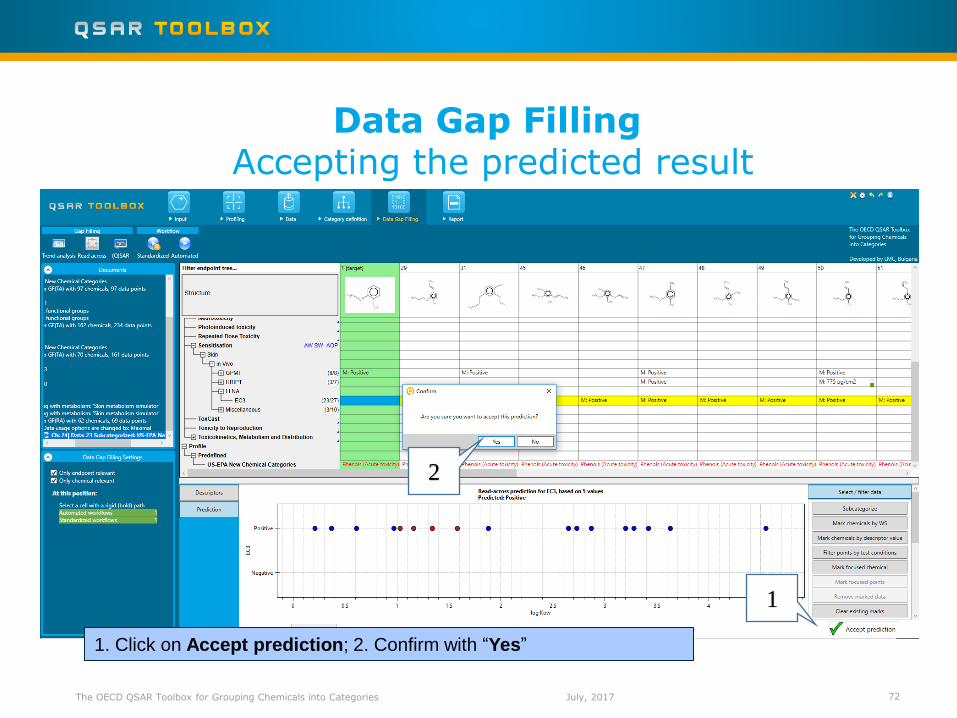
The OECD QSAR Toolbox for Grouping Chemicals into Categories 72
Data Gap Filling Accepting the predicted result
1. Click on Accept prediction; 2. Confirm with “Yes”
1
2
July, 2017
• Read-across is the appropriate data-gap filling method for “qualitative” endpoints like skin sensitisation. Since the most of the analogues and all five neighbouring tested chemicals in the category were positive, it was easy to accepting the prediction of positive for the target chemical.
• You are now ready to complete the final module and to create the report.
• Click on “Report” to proceed to the last module.
Recap
The OECD QSAR Toolbox for Grouping Chemicals into Categories 73 July, 2017
• Background
• Objectives
• Specific Aims
• Read across and analogue approach
• The exercise
• Workflow
o Chemical Input
o Profiling
o Endpoint
o Category definition
o Data Gap Filling
o Report
Outlook
The OECD QSAR Toolbox for Grouping Chemicals into Categories 74 July, 2017
Report Overview
The OECD QSAR Toolbox for Grouping Chemicals into Categories 75
• Report module could generate report on any of predictions performed with the Toolbox.
• Report module contains predefined report template which users can customize.
• Two type of report files are generated:
- Prediction report – containing information for the target
- Data matrix – containing information for the analogues used for the prediction.
July, 2017
The OECD QSAR Toolbox for Grouping Chemicals into Categories 76
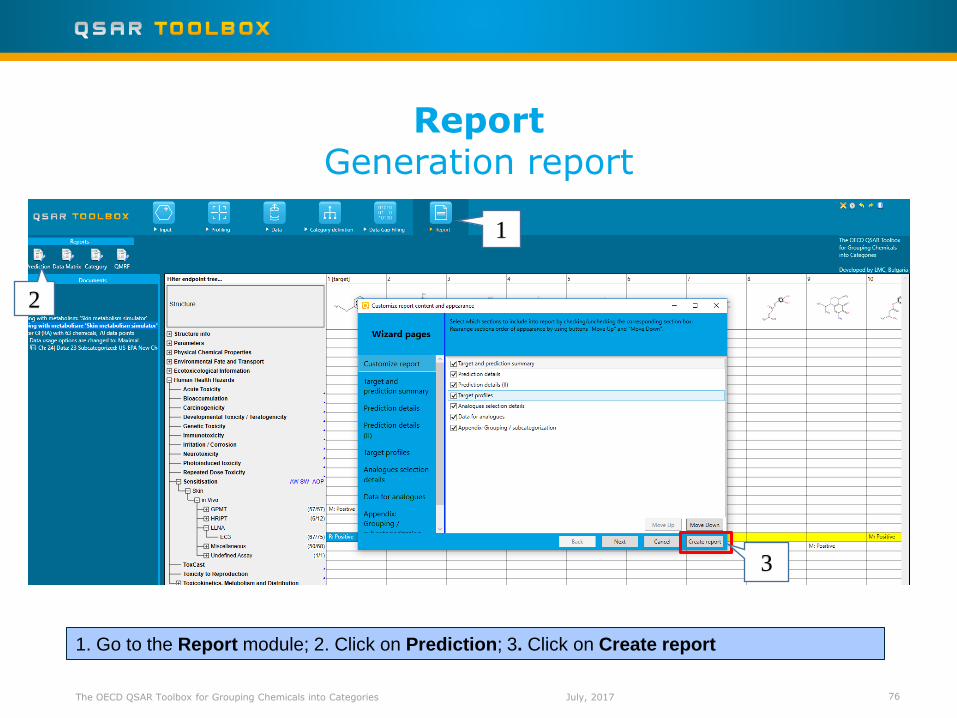
Report Generation report
1. Go to the Report module; 2. Click on Prediction; 3. Click on Create report
1
2
3
July, 2017
Report Generation report
77 The OECD QSAR Toolbox for Grouping Chemicals into Categories
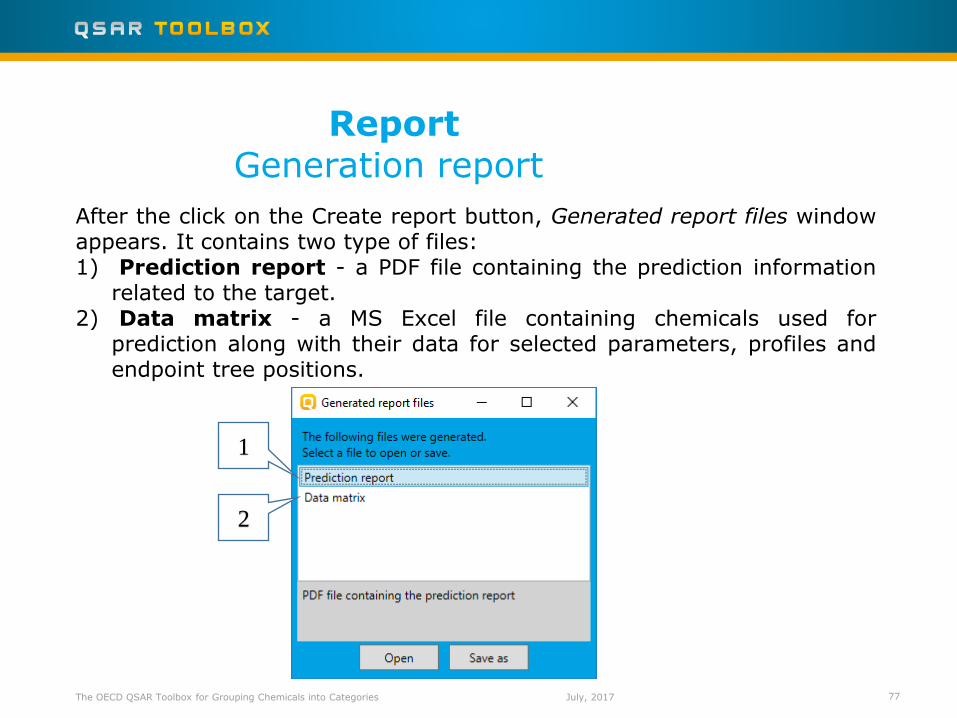
After the click on the Create report button, Generated report files window appears. It contains two type of files: 1) Prediction report - a PDF file containing the prediction information
related to the target. 2) Data matrix - a MS Excel file containing chemicals used for
prediction along with their data for selected parameters, profiles and endpoint tree positions.
1
2
July, 2017
The OECD QSAR Toolbox for Grouping Chemicals into Categories 78
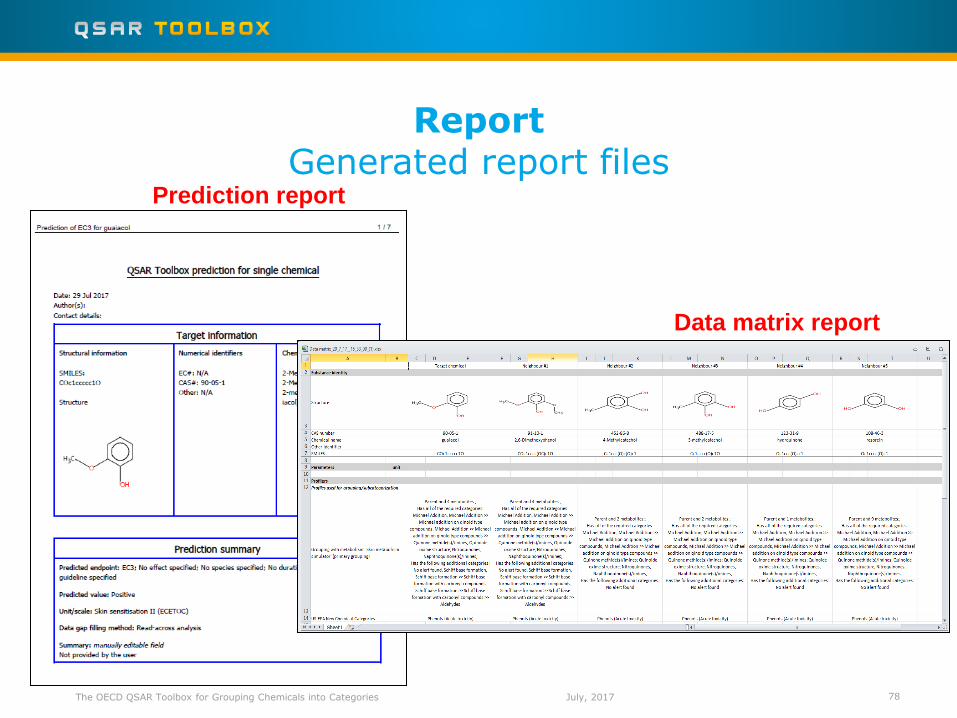
Report Generated report files
Prediction report
July, 2017
Data matrix report
• You have now been introduced to the defining of target endpoint;
• You have now been introduced to the coloring of profilers and databases.
• You have now been introduced to the consecutive steps of the calculation of alert performance.
• Note proficiency comes with practice.
The OECD QSAR Toolbox for Grouping Chemicals into Categories 79
Congratulation
July, 2017