OECD QSAR Toolbox v.3 Background • Objectives • Specific Aims • Trend analysis •...
67
OECD QSAR Toolbox v.3.3 Step-by-step example of how to categorize an inventory by mechanistic behaviour of the chemicals which it consists
Transcript of OECD QSAR Toolbox v.3 Background • Objectives • Specific Aims • Trend analysis •...

OECD QSAR Toolbox v.3.3 Step-by-step example of how to categorize an inventory by mechanistic behaviour of the chemicals which it consists

Outlook
• Background
• Objectives
• Specific Aims
• Trend analysis
• The exercise
• Workflow
• Save the prediction result
23.02.2015 The OECD QSAR Toolbox for Grouping Chemicals into Categories 2

Background
• This is a step-by-step presentation designed to take Toolbox users through the workflow of categorizing an inventory using mechanistic similarity.
23.02.2015 The OECD QSAR Toolbox for Grouping Chemicals into Categories 3

Outlook
• Background
• Objectives
• Specific Aims
• Trend analysis
• The exercise
• Workflow
• Save the prediction result
23.02.2015 The OECD QSAR Toolbox for Grouping Chemicals into Categories 4

Objectives
This presentation demonstrates a number of
functionalities of the Toolbox including:
• Clustering chemicals from an imported inventory (chemical list).
• Selecting a cluster and place it into separate data matrix for later analyses.
• And, apply a trend analysis for aquatic toxicity to the selected cluster.
23.02.2015 The OECD QSAR Toolbox for Grouping Chemicals into Categories 5

Outlook
• Background
• Objectives
• Specific Aims
• Trend analysis
• The exercise
• Workflow
• Save the prediction result
23.02.2015 The OECD QSAR Toolbox for Grouping Chemicals into Categories 6

Specific Aims
• To examine the workflow of clustering an inventory.
• To introduce the user to new functionalities within selected modules.
• To explain the rationale behind each step of the exercise.
23.02.2015 The OECD QSAR Toolbox for Grouping Chemicals into Categories 7

Outlook
• Background
• Objectives
• Specific Aims
• Trend analysis
• The exercise
• Workflow
• Save the prediction result
23.02.2015 The OECD QSAR Toolbox for Grouping Chemicals into Categories 8

Trend analysis
• For a given toxicological endpoint, the members of a category are often related by a trend (e.g. increasing, decreasing or constant). The trend could be related to structural or chemical property.
• A demonstration of consistent trends in the behavior of a group of chemicals is one of the desirable attributes of a chemical category and an indicator that there is a common mechanism of action. When a consistent trend is observed and some chemicals in the category have measured values, missing values can be estimated by simple scaling from the measured values.
23.02.2015 The OECD QSAR Toolbox for Grouping Chemicals into Categories 9

Outlook
• Background
• Objectives
• Specific Aims
• Trend analysis
• The exercise
• Workflow
• Save the prediction result
23.02.2015 The OECD QSAR Toolbox for Grouping Chemicals into Categories 10

The Exercise Part I
• In this part of the exercise we will import a chemical list containing 300 substances, representing a typical inventory of chemicals used by a down stream user.
• The inventory will be loaded into the Toolbox data matrix.
• The inventory will be profiled by the “Aquatic toxicity classification by ECOSAR Classification” profiling scheme.
• This inventory will be clustered by the ECOSAR Classification grouping method.
23.02.2015 The OECD QSAR Toolbox for Grouping Chemicals into Categories 11

The Exercise Part II
• In this part of the exercise an example cluster or defined category will be examined.
• Data on the chemicals which belong to selected cluster will be gathered.
• A data gap will be filled by trend analysis - In this exercise we will predict the toxicity towards mortality of the Pimephales promelas (LC50 for 24h).
• A report of the prediction will be generated.
23.02.2015 The OECD QSAR Toolbox for Grouping Chemicals into Categories 12

• The inventory is stored in the following smi file: OECD Mock Inventory.smi*
• This file contains a list of Chemical Abstract Service (CAS) numbers, which can be opened with Notepad.
*OECD Mock Inventory.smi - file is packed in the zip file with all power point tutorials posted on LMC website
23.02.2015 The OECD QSAR Toolbox for Grouping Chemicals into Categories 13
The Exercise Necessary to download the file

Outlook
• Background
• Objectives
• Specific Aims
• Trend analysis
• The exercise
• Workflow
• Save the prediction result
23.02.2015 The OECD QSAR Toolbox for Grouping Chemicals into Categories 14

Workflow
• The Toolbox has six modules which are used in a sequential workflow: •Chemical Input
• Profiling
•Endpoints
•Category Definition
• Filling Data Gaps
•Report
Part I
Part II
23.02.2015 The OECD QSAR Toolbox for Grouping Chemicals into Categories 15

Outlook
• Background
• Objectives
• Specific Aims
• Trend analysis
• The exercise
• Workflow • Chemical Input
23.02.2015 The OECD QSAR Toolbox for Grouping Chemicals into Categories 16

Chemical Input Overview
• This module provides the user with several means of entering the chemical of interest or the target chemical.
• Since all subsequent functions are based on chemical structure, the goal here is to make sure the molecular structure assigned is the correct one.
23.02.2015 The OECD QSAR Toolbox for Grouping Chemicals into Categories 17

Chemical Input Ways of Entering a Chemical
23.02.2015 18 The OECD QSAR Toolbox for Grouping Chemicals into Categories
User Alternatives for Chemical ID: A.Single target chemical
• Chemical Name • Chemical Abstract Services (CAS) number (#) • SMILES (simplified molecular information line entry
system) notation/InChi • Drawing chemical structure • Select from User List/Inventory/Databases • Chemical IDs such as EC number, Einecs number
B.Group of chemicals • User List/Inventory • Specialized Databases

Chemical Input Screen Input target chemical by CAS#
1
23.02.2015 19 The OECD QSAR Toolbox for Grouping Chemicals into Categories

Chemical Input Screen Input target chemical by CAS#
1
23.02.2015 20 The OECD QSAR Toolbox for Grouping Chemicals into Categories
1. Click on List 2. Select OECD Mock Inventory.smi 3. Click Open
2
3

Chemical Input Screen Missing SMILES
• Since in the entered list there are CAS numbers for which there are no SMILES in the Toolbox, the user will be asked if he/she wants the Toolbox to search for in the databases. In this example select NO.
23.02.2015 The OECD QSAR Toolbox for Grouping Chemicals into Categories 21

1. Click NO in dropdown box.
Chemical Input Screen Missing SMILES
23.02.2015 The OECD QSAR Toolbox for Grouping Chemicals into Categories 22
1

• The structures of the 300 chemicals are displayed with 2D image. The missing SMILES are displayed with empty window - for example chemical #110 (see next screen shot).
• These empty windows remind the user where are the gaps in the inventory.
• Remember all subsequent functions are based on chemical structure, so the chemicals with blank windows will not be placed in a cluster or category.
Chemical Input Screen Displaying structures
23.02.2015 The OECD QSAR Toolbox for Grouping Chemicals into Categories 23

Chemical Input Screen Displaying structures
23.02.2015 The OECD QSAR Toolbox for Grouping Chemicals into Categories 24

Chemical Input Chemical Identity
• Double click “Substance Identity”; this displays the chemical identification information.
• Note that existing in the Toolbox names of target chemical are in different colors.
• The workflow on the first module is now complete, and the user can proceed to the next module.
23.02.2015 The OECD QSAR Toolbox for Grouping Chemicals into Categories 25

Chemical Input Chemical Identity
23.02.2015 The OECD QSAR Toolbox for Grouping Chemicals into Categories 26
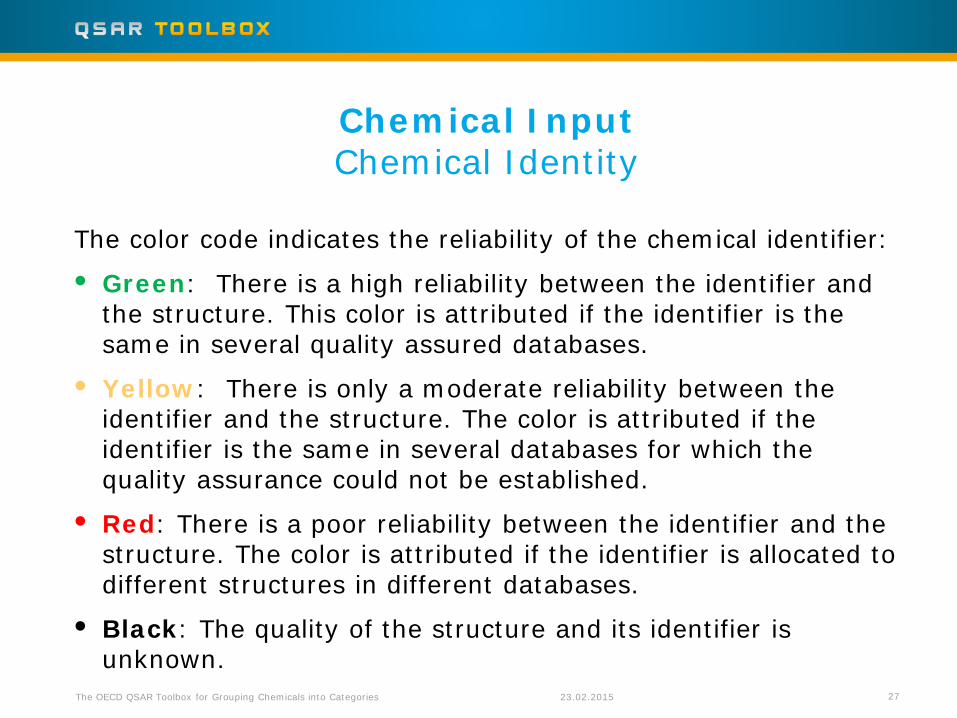
The color code indicates the reliability of the chemical identifier:
• Green: There is a high reliability between the identifier and the structure. This color is attributed if the identifier is the same in several quality assured databases.
• Yellow: There is only a moderate reliability between the identifier and the structure. The color is attributed if the identifier is the same in several databases for which the quality assurance could not be established.
• Red: There is a poor reliability between the identifier and the structure. The color is attributed if the identifier is allocated to different structures in different databases.
• Black: The quality of the structure and its identifier is unknown.
Chemical Input Chemical Identity
23.02.2015 The OECD QSAR Toolbox for Grouping Chemicals into Categories 27

Outlook
• Background
• Objectives
• Specific Aims
• Trend analysis
• The exercise
• Workflow •Chemical Input • Profiling
23.02.2015 The OECD QSAR Toolbox for Grouping Chemicals into Categories 28

Profiling Overview
• As you are aware the “profiling” refers to the electronic process of retrieving relevant information on the target compound(s), which are stored in the Toolbox other than fate and toxicity data.
• Key to this exercise is the information on likely mechanism(s) of action.
23.02.2015 The OECD QSAR Toolbox for Grouping Chemicals into Categories 29

• Remember detailed explanation of the different profilers is available in the in Manual for getting started (Chapter 4). http://www.oecd.org/dataoecd/58/56/46210452.pdf
• Background information can be retrieved by highlighting a profiler and a click on the button “View”.
• For grouping chemicals into meaningful categories for aquatic toxicity the “Aquatic toxicity classification by ECOSAR” is one of the most adequate scheme.
Profiling Side-Bar of Profilers
23.02.2015 The OECD QSAR Toolbox for Grouping Chemicals into Categories 30

2
Profiling Side-Bar of Profilers
23.02.2015 The OECD QSAR Toolbox for Grouping Chemicals into Categories 31
1
1. Highlight the “Aquatic toxicity classification by ECOSAR” profiler; 2. Click View to see the drop-down box.

1
2
23.02.2015 The OECD QSAR Toolbox for Grouping Chemicals into Categories 32
Profiling Side-Bar of Profilers
1. Select the ECOSAR profiler by clicking on the box next to it (a green tick mark appears); 2. Click Apply.

• The actual profiling will take several seconds depending on the number and type of selected profilers.
• The results of profiling automatically appear as a dropdown box (see next screen shot).
• Please note the specific profiling results of Aquatic toxicity classification by ECOSAR.
• These results will be used to division chemicals from the inventory into suitable clusters in the next steps of the exercise.
Profiling Profiling results
23.02.2015 The OECD QSAR Toolbox for Grouping Chemicals into Categories 33

Profiling Profiling results
23.02.2015 The OECD QSAR Toolbox for Grouping Chemicals into Categories 34
Outlook
• Background
• Objectives
• Specific Aims
• Trend analysis
• The exercise
• Workflow •Chemical Input • Profiling • Endpoint
23.02.2015 The OECD QSAR Toolbox for Grouping Chemicals into Categories 35

Endpoints Overview
• “Endpoint” refers to the electronic process of retrieving the environmental fate and toxicity data stored in the Toolbox database.
• Data gathering can be executed in a global fashion (i.e., collecting all data of all endpoints) or on a more narrowly defined basis (e.g., collecting data for a single or limited number of endpoints).
23.02.2015 The OECD QSAR Toolbox for Grouping Chemicals into Categories 36

• In this example, since we categorize an inventory for later analysis we do not need of data gathering.
• In this module we need only to select the Aquatic ECETOC, Aquatic OASIS and Aquatic US-EPA ECOTOX databases.
• These databases contain results on aquatic toxicity for various species, and durations.
• Click on the “Category Definition” to move to the next module.
Endpoints Case study
23.02.2015 The OECD QSAR Toolbox for Grouping Chemicals into Categories 37

Endpoints Case study
23.02.2015 The OECD QSAR Toolbox for Grouping Chemicals into Categories 38
1. Expand Ecotoxicological information section 2. Select the databases listed in the previous slide both databases mentioned in the previous slide databases 2. Click Gather. The data appears on data matrix
3
1
2

Outlook
• Background
• Objectives
• Specific Aims
• Trend analysis
• The exercise
• Workflow •Chemical Input • Profiling •Endpoint • Category definition
23.02.2015 The OECD QSAR Toolbox for Grouping Chemicals into Categories 39

Category Definition Overview
• This module provides the user with several means of grouping chemicals into a toxicologically meaningful category that includes the target molecule.
• This is the critical step in the workflow.
• Several options are available in the Toolbox to assist the user to define a category.
23.02.2015 The OECD QSAR Toolbox for Grouping Chemicals into Categories 40

Category Definition Grouping methods
• The different grouping methods allow the user to group chemicals into chemical categories according to different measures of “similarity” so that within a category data gaps can be filled by trend-analysis.
• Detailed information about grouping chemical (Chapter 4) could be downloaded from:
http://www.oecd.org/dataoecd/58/56/46210452.pdf
23.02.2015 The OECD QSAR Toolbox for Grouping Chemicals into Categories 41

Category Definition Side bar to ECOSAR category
• ECOSAR has been used by the U.S. Environmental Protection Agency to predict the aquatic toxicity of new industrial chemicals in the absence of test data.
• SARs are developed for chemical classes (e.g. phenols) based on measured test data which have been submitted by industry or they were taken from other sources.
• The ECOSAR classification in the Toolbox is used for grouping chemicals by structural (and in some cases mechanistic) similarity.
23.02.2015 The OECD QSAR Toolbox for Grouping Chemicals into Categories 42

Category Definition Clustering
The chemicals in the inventory can be clustered in to 56 clusters based on EcoSAR Categories.
•66 are neutral organics •30 are esters •28 are phenols •23 are anilines (unhindered) •14 are aldehydes (mono) •10 are aliphatic amines •Other clusters consist of less than 10 compounds
23.02.2015 The OECD QSAR Toolbox for Grouping Chemicals into Categories 43

Category Definition Clustering
1
2
23.02.2015 The OECD QSAR Toolbox for Grouping Chemicals into Categories 44
1. Highlight the “Aquatic toxicity classification by ECOSAR”; 2. Click Clustering.

Category Definition Select working cluster
1. Highlight specific cluster to select it as working- in this example select “Phenols”.
1
23.02.2015 The OECD QSAR Toolbox for Grouping Chemicals into Categories 45

Category Definition Select working cluster
Chemical statistics presets the number of chemicals and the available experimental data. This is statistics for the current row on data matrix.
23.02.2015 The OECD QSAR Toolbox for Grouping Chemicals into Categories 46

Category Definition Navigation through the endpoint tree
• The user can navigate through the data tree by closing or opening the nodes of the tree.
• In this example, the LC50-96h Mortality for Pimephales promelas is the target endpoint.
23.02.2015 The OECD QSAR Toolbox for Grouping Chemicals into Categories 47

1. Type “LC50” in the filter box; 2. By double clicking on the specific nodes open the endpoint tree go to the target endpoint- Ecotoxicological information; Aquatic toxicity; Mortality; LC50; 96h; Animalia; Chordata(Vertabrates); Actinopterygii(fish); Pimephales promelas
23.02.2015 The OECD QSAR Toolbox for Grouping Chemicals into Categories 48
1
2
Category Definition Navigation through the endpoint tree-use filter

Category Definition Navigation through the endpoint tree-target
endpoint
23.02.2015 The OECD QSAR Toolbox for Grouping Chemicals into Categories 49

The Exercise - Part I Recap
• We have loaded in the Toolbox data matrix a user predefined list of 300 chemicals.
• The inventory has been profiled by the “Aquatic toxicity classification by ECOSAR” scheme.
• The inventory has been clustered by the ECOSAR categorization method.
• The “Phenols” cluster has been selected as the working cluster and experimental data have been gathered for all its members.
• Now we are ready to proceed with the Part II of the exercise.
23.02.2015 The OECD QSAR Toolbox for Grouping Chemicals into Categories 50

Outlook
• Background
• Objectives
• Specific Aims
• Trend analysis
• The exercise
• Workflow •Chemical Input • Profiling •Endpoint •Category definition • Data Gap Filling
23.02.2015 The OECD QSAR Toolbox for Grouping Chemicals into Categories 51

23.02.2015 The OECD QSAR Toolbox for Grouping Chemicals into Categories 52
• “Data Gap Filling” module give access to three different data gap filling tools: • Read-across • Trend analysis • (Q)SAR models
• Select the most relevant data gap method: • Read-across is the appropriate data-gap filling method for
“qualitative” endpoints where possible results are positive, negative or equivocal. Read-across is also recommended for “quantitative endpoints” (e.g., 96h-LC50 for fish) when there are few analogues with experimental results.
• Trend analysis is the appropriate data-gap filling method for “quantitative endpoints” (e.g., 96h-LC50 for fish) when a high number of analogues with experimental results.
• “(Q)SAR models” can be used to fill a data gap if no adequate analogues are found for a target chemical.
• In this example we will use trend analysis.
Data gap filling Overview

1. Highlight the data endpoint box corresponding to the target endpoint under 4-bromo-2,6-dimethylphenol; 2. Select Trend analysis; 3. Click Apply.
1
2
3
Data gap filling Apply Trend analysis
23.02.2015 The OECD QSAR Toolbox for Grouping Chemicals into Categories 53

Data gap filling Trend analysis
23.02.2015 The OECD QSAR Toolbox for Grouping Chemicals into Categories 54

• The resulting plot outlines the experimental LC50 results of all analogues (Y axis) according to a descriptor (X axis) with Log Kow being the default descriptor.
• The RED dot represents the estimated result for the target chemical.
• The BLUE dots represent the experimental results available for the analogues.
Data gap filling Interpreting Trend analysis
23.02.2015 The OECD QSAR Toolbox for Grouping Chemicals into Categories 55

• The resulting trend analysis reveals a consistent trend in results with toxicity increase linearly with log Kow.
• It can be used to fill the data gap. • By extension it can be used to fill data gaps for this
endpoint for all chemicals in this cluster (i.e., category). • See also the presentation “How to build user defined
QSAR model” available at the OECD/LMC websites. • Accept the prediction (see next screen shot).
Data gap filling Analysis of the results
23.02.2015 The OECD QSAR Toolbox for Grouping Chemicals into Categories 56

1.Click Accept prediction and after that 2. Return to the data matrix
1
Data gap filling Accepting the prediction result
23.02.2015 The OECD QSAR Toolbox for Grouping Chemicals into Categories 57
2

Data gap filling Accepting the prediction result
23.02.2015 The OECD QSAR Toolbox for Grouping Chemicals into Categories 58

• By accepting the prediction the data gap was filled (see next screen shot).
• You are now ready to complete the final module and to download the report.
• Click on “Report” to proceed to next module.
Filled data gap
23.02.2015 The OECD QSAR Toolbox for Grouping Chemicals into Categories 59

23.02.2015 The OECD QSAR Toolbox for Grouping Chemicals into Categories 60
Outlook
• Background
• Objectives
• Specific Aims
• Trend analysis
• The exercise
• Workflow •Chemical Input • Profiling •Endpoint •Category definition •Data Gap Filling • Report

Report Overview
• The Report module can generate a report on any of predictions performed with the Toolbox.
• This module contains predefined report templates as well as a template editor which allows for development of user defined templates.
• The report can be printed or saved in different formats.
23.02.2015 The OECD QSAR Toolbox for Grouping Chemicals into Categories 61

1. Double click on “Prediction” in the window Available data to report; 2. Select the prediction for the target chemical; 3. Click Create.
2
1
3
Report Generate report
23.02.2015 The OECD QSAR Toolbox for Grouping Chemicals into Categories 62

23.02.2015 The OECD QSAR Toolbox for Grouping Chemicals into Categories 63
Outlook
• Background
• Objectives
• Specific Aims
• Trend analysis
• The exercise
• Workflow
• Save the prediction result

Saving the prediction result
23.02.2015 64 The OECD QSAR Toolbox for Grouping Chemicals into Categories
• This functionality allow storing/restoring the current state of Toolbox documents including loaded chemicals, experimental data, profiles, predictions etc, on the same computer. The functionality is implemented based on saving the sequence of actions that led to the current state of the Toolbox document and later executing these actions in the same sequence in order to get the same result(s).
• Saving/Loading the file with TB prediction is shown on next screenshots

Saving the prediction result
23.02.2015 65 The OECD QSAR Toolbox for Grouping Chemicals into Categories
1. Click on Save button; 2. Define name of the file; 3. Click Save button
1
2 3

Open saved file
23.02.2015 66 The OECD QSAR Toolbox for Grouping Chemicals into Categories
Once the file has been saved 1. Go to Input; 2. Click Open; 3. Find and select file; 4. Click Open
1 2
3
4

Congratulation
• You have used the Toolbox to categorize an inventory by mechanistic behavior.
• You now know another useful tool in the Toolbox.
• Continue to practice with this and other tool and soon you will be comfortable dealing with many situations where the Toolbox is useful.
23.02.2015 The OECD QSAR Toolbox for Grouping Chemicals into Categories 67