OECD QSAR Toolbox v.4 is a step-by-step presentation designed to take the user of Toolbox through...
44
OECD QSAR Toolbox v.4.0 Tutorial of how to use Automated workflow for ecotoxicological prediction
-
Upload
nguyenmien -
Category
Documents
-
view
227 -
download
1
Transcript of OECD QSAR Toolbox v.4 is a step-by-step presentation designed to take the user of Toolbox through...

OECD QSAR Toolbox v.4.0
Tutorial of how to use Automated workflow for ecotoxicological prediction

• Aim
• Ecotoxicological prediction
• Workflow of the exercise
• Report
2
Outlook
The OECD QSAR Toolbox for Grouping Chemicals into Categories April 2017

This is a step-by-step presentation designed to take the user of Toolbox through the automated workflow for ecotoxicity prediction.
3
Aim
The OECD QSAR Toolbox for Grouping Chemicals into Categories April 2017
• Aim
• Ecotoxicological prediction
• Workflow of the prediction
• Report
4
Outlook
The OECD QSAR Toolbox for Grouping Chemicals into Categories April 2017

Ecotoxicological prediction:
- Acute aquatic toxicity
- mortality
- LC50 (EC50)
- 96 h
- Pimephales promelas
5
Outlook
The OECD QSAR Toolbox for Grouping Chemicals into Categories April 2017

• Aims
• Ecotoxicological prediction
• Workflow of the prediction
• Report
6
Outlook
The OECD QSAR Toolbox for Grouping Chemicals into Categories April 2017
• Input of target chemical(s)
• Data gap filling: Automated workflow
single chemical mode
batch mode
• Report
7
Workflow: Steps
The OECD QSAR Toolbox for Grouping Chemicals into Categories April 2017

8
Outlook
The OECD QSAR Toolbox for Grouping Chemicals into Categories April 2017
• Aims
• Ecotoxicological prediction
• Workflow of the prediction
• Chemical input
• Automated workflow in Data-gap filling section
• Report

• This module provides the user with several means of entering the chemical of interest or the target chemical.
• Since all subsequent functions are based on chemical structure, the goal here is to make sure the molecular structure assigned to the target chemical is the correct one.
9
Chemical Input
The OECD QSAR Toolbox for Grouping Chemicals into Categories April 2017

I. Single target chemical • Chemical Name • Chemical Abstract Services (CAS) number (#) • SMILES (simplified molecular information line entry
system) notation • Chemical with defined composition • Drawing chemical structure • Select from User’s List/Inventory/Databases
II. Group of chemicals • User’s List • Inventory/Database
10
Chemical Input Ways of Entering a Chemical
The OECD QSAR Toolbox for Grouping Chemicals into Categories April 2017

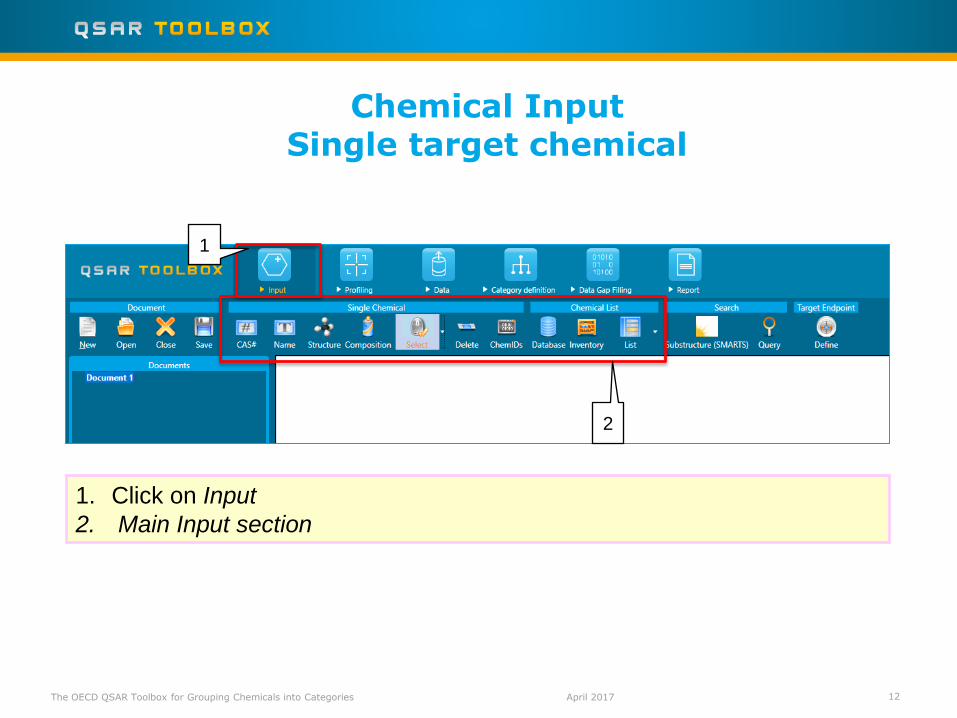
• Open the Toolbox.
• Click on “Input” (see next screen shot).
11
Chemical Input: Single target chemical
The OECD QSAR Toolbox for Grouping Chemicals into Categories April 2017
12
Chemical Input Single target chemical
The OECD QSAR Toolbox for Grouping Chemicals into Categories April 2017
1
2
1. Click on Input
2. Main Input section

1. Click on CAS # ; 2. Type in the CAS #; 3. Click on Search;
4. Select the chemical; 5. Click on OK.
13
Single target chemical by CAS RN
The OECD QSAR Toolbox for Grouping Chemicals into Categories April 2017
2 1
3 5
4

14
Outlook
The OECD QSAR Toolbox for Grouping Chemicals into Categories April 2017
• Aims
• Ecotoxicological prediction
• Workflow of the prediction
• Chemical input
• Automated workflow in Data-gap filling section
• Report
15
Data gap filling An overview
The OECD QSAR Toolbox for Grouping Chemicals into Categories April 2017
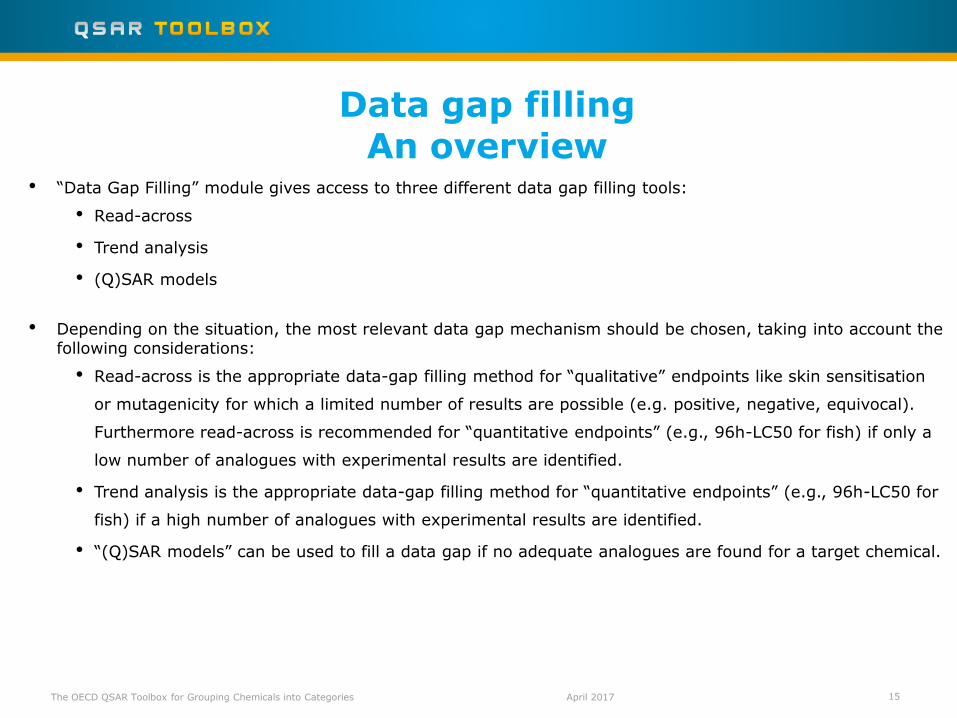
• “Data Gap Filling” module gives access to three different data gap filling tools:
• Read-across
• Trend analysis
• (Q)SAR models
• Depending on the situation, the most relevant data gap mechanism should be chosen, taking into account the following considerations:
• Read-across is the appropriate data-gap filling method for “qualitative” endpoints like skin sensitisation
or mutagenicity for which a limited number of results are possible (e.g. positive, negative, equivocal).
Furthermore read-across is recommended for “quantitative endpoints” (e.g., 96h-LC50 for fish) if only a
low number of analogues with experimental results are identified.
• Trend analysis is the appropriate data-gap filling method for “quantitative endpoints” (e.g., 96h-LC50 for
fish) if a high number of analogues with experimental results are identified.
• “(Q)SAR models” can be used to fill a data gap if no adequate analogues are found for a target chemical.
April 2017 The OECD QSAR Toolbox for Grouping Chemicals into Categories
• Algorithms for automated and standardized data gap filling have been developed for skin sensitization (LLNA and GPMT data) and acute aquatic toxicity to fish (Pimephales promelas, Mortality, LC50, 96 h).
• Once started, the automated workflows (AWs) follow the implemented logic and finished with prediction without interaction by the user.
• In this tutorial only the acute aquatic toxicity to fish is discussed.
• The Automated workflow can be used for a single chemical mode or in a batch mode.
Data gap filling Automated workflow: An overview

17
Outlook
The OECD QSAR Toolbox for Grouping Chemicals into Categories April 2017
• Aims
• Ecotoxicological prediction
• Workflow of the prediction
• Chemical input
• Automated workflow in Data-gap filling section
Single chemical
Batch mode
• Report
The OECD QSAR Toolbox for Grouping Chemicals into Categories
Data Gap Filling Overview
April, 2017 18
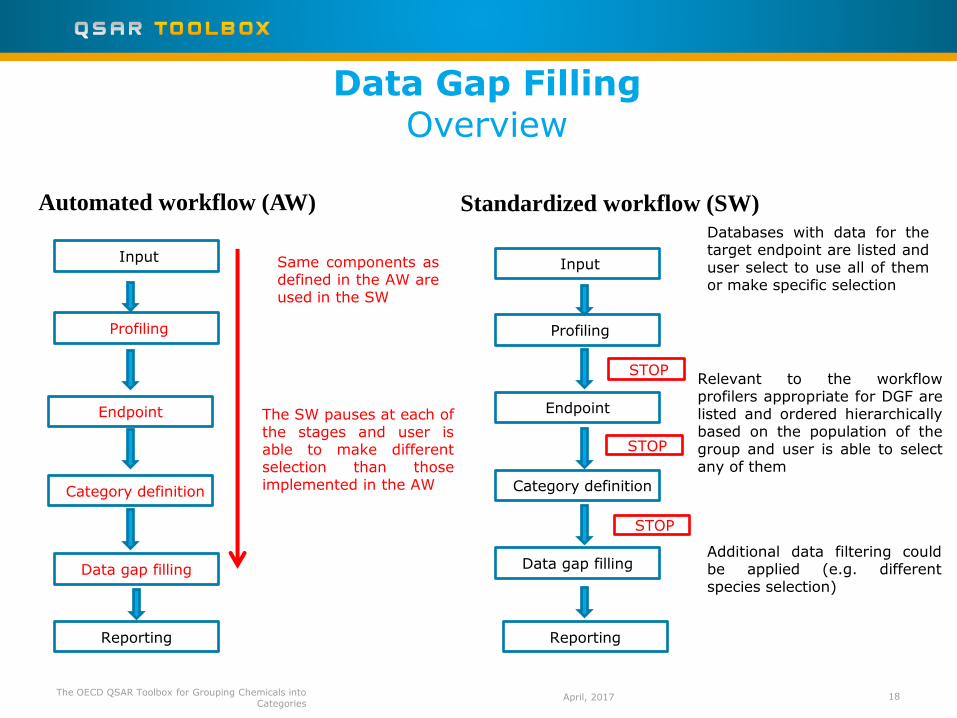
Automated workflow (AW)
Databases with data for the target endpoint are listed and user select to use all of them or make specific selection
Input
Profiling
Endpoint
Category definition
Data gap filling
Reporting
Relevant to the workflow profilers appropriate for DGF are listed and ordered hierarchically based on the population of the group and user is able to select any of them
Additional data filtering could be applied (e.g. different species selection)
Same components as defined in the AW are used in the SW
The SW pauses at each of the stages and user is able to make different selection than those implemented in the AW
Input
Profiling
Endpoint
Category definition
Data gap filling
STOP
STOP
Reporting
STOP
Standardized workflow (SW)

April 2017 The OECD QSAR Toolbox for Grouping Chemicals into Categories
Algorithm of Ecotoxicological workflow
Data Gap Filling
19

20
Data Gap Filling Automated workflow: single chemical
The OECD QSAR Toolbox for Grouping Chemicals into Categories April 2017
1. Select Data gap filling tab (1); 2. Press Automated (2); 3. Select Ecotoxicological endpoint (3)from the pop-
up window (4); 4. Press OK (5).
3
4
2
1
5

21
Data Gap Filling Automated workflow: single chemical
The OECD QSAR Toolbox for Grouping Chemicals into Categories April 2017
• A dialogue window gives the user a choice to select the end-point (1); • Then select OK (2).
1
2

A workflow controller window is displayed throughout the automated workflow procedure. It includes: • Workflow name (1); • General task (2); • Active task (this is subtask of the general task, which is currently being performed)(3); • Navigation options (4); • Activity log (5).
22
Data Gap Filling Automated workflow: single chemical
The OECD QSAR Toolbox for Grouping Chemicals into Categories April 2017
1 2
3
5
4

23
Data Gap Filling Automated workflow: single chemical
2
3
• When the workflow finishes a message is displayed that the prediction is accepted (1). •Also the progress bar is completely filled (2). •The user has to press OK (3). • Then close the workflow window by pressing X button (4).
4
1

April 2017 The OECD QSAR Toolbox for Grouping Chemicals into Categories
• The prediction is displayed on the matrix labeled with “T”, which stands for trend analysis; •“M” stands for measured data.
Data Gap Filling Automated workflow: single chemical
April 2017 The OECD QSAR Toolbox for Grouping Chemicals into Categories
Data Gap Filling Automated workflow: single chemical
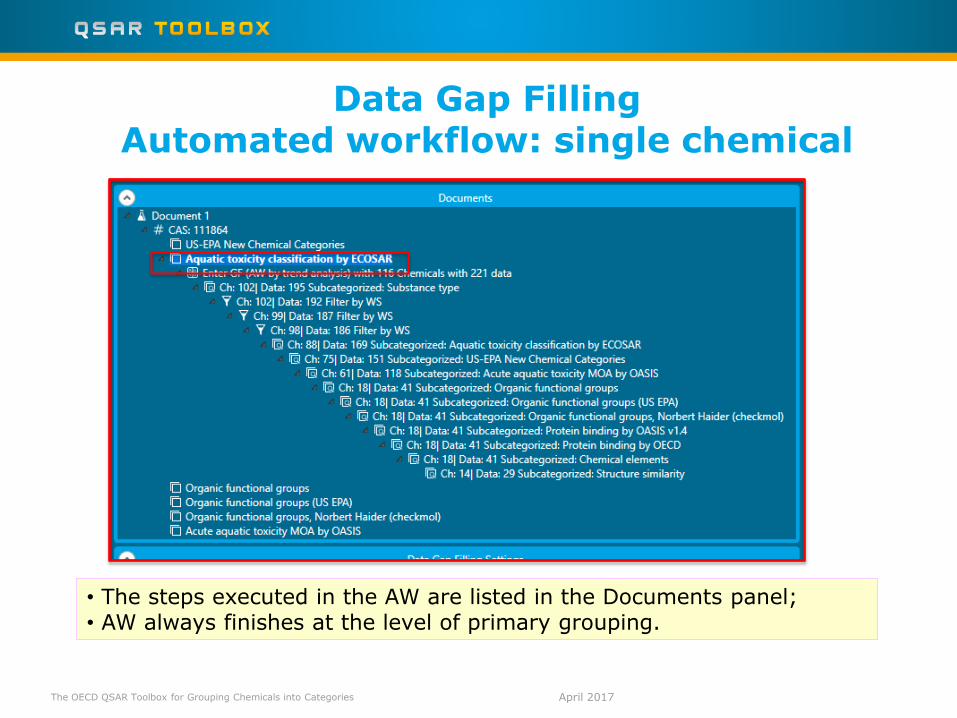
• The steps executed in the AW are listed in the Documents panel; • AW always finishes at the level of primary grouping.

26
Data Gap Filling Automated workflow: single chemical
The OECD QSAR Toolbox for Grouping Chemicals into Categories April 2017
In case the prediction does not answer the criteria for acceptance of the prediction (1) or not enough data is collected for primary grouping then the corresponding messages appears, such as: “No enough data to build primary group” or Couldn’t find a valid answer”(1)
2
1
• Click OK (1);
• Then close the workflow controller window (2)

27
Outlook
The OECD QSAR Toolbox for Grouping Chemicals into Categories April 2017
• Aims
• Ecotoxicological prediction
• Workflow of the prediction
• Chemical input
• Automated workflow in Data-gap filling section
Single chemical
Batch mode
• Report

28
Data Gap Filling
Automated workflow: Batch mode
The OECD QSAR Toolbox for Grouping Chemicals into Categories April 2017
There are several ways to load a batch of chemicals amongst which:
- Selection of chemicals from databases/inventories; - Loading of chemicals from user’s file. In this tutorial, Query tool functionality is used to load
chemicals with known CAS RNs.

29
Data Gap Filling
Automated workflow: Batch mode
The OECD QSAR Toolbox for Grouping Chemicals into Categories April 2017
Input 1. Go to Data
panel(1) 2. Then to
Database (2) 3. Select Aquatic
OASIS database(3)
1
3
2

30
Data Gap Filling
Automated workflow: Batch mode
The OECD QSAR Toolbox for Grouping Chemicals into Categories April 2017
1.Go to Input panel; 2.Click on Query; 3. A dialogue window pops up; 4. Click on Yes.
1
3
2
4

31
Data Gap Filling
Automated workflow: Batch mode
The OECD QSAR Toolbox for Grouping Chemicals into Categories April 2017
1. Go to CAS tab(1); 2. Type in the CAS RN in
the cell (2) 3. Click on Add (3) to add
all 4 CAS RNs. 4. Click on Add (4)to
create the query (5) ; 5. Click on Execute (6).
2 3
1
4
6
5

32
Data Gap Filling Automated workflow: Batch mode
The OECD QSAR Toolbox for Grouping Chemicals into Categories April 2017
2
1
3
5
1. Select Data gap filling tab (1); 2. Click on Automated (2); 3. Select Ecotoxicological endpoint (3) from the pop-up window (4); 4. Click on OK (5).
4

33
Data Gap Filling Automated workflow:Batch mode
The OECD QSAR Toolbox for Grouping Chemicals into Categories April 2017
2
1
• A dialogue window gives the user a choice to select the end-point (1); • Then select OK (2).
34
Data Gap Filling Automated workflow: Batch mode
The OECD QSAR Toolbox for Grouping Chemicals into Categories April 2017
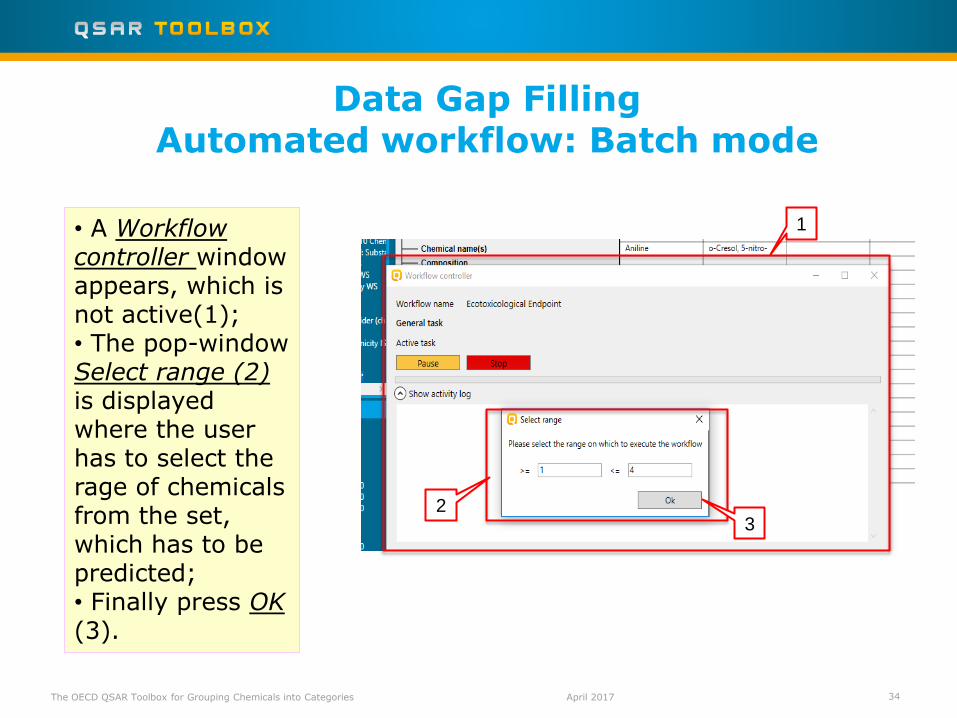
• A Workflow controller window appears, which is not active(1); • The pop-window Select range (2) is displayed where the user has to select the rage of chemicals from the set, which has to be predicted; • Finally press OK (3).
2
1
3

35
Data Gap Filling Automated workflow: Batch mode
The OECD QSAR Toolbox for Grouping Chemicals into Categories April 2017
2
4
3
1
• When the workflow finishes, there is an indication in the workflow controller(1). • Also the progress bar is completely filled (2). •The predictions are displayed on the matrix(3). There is also an indication that 4 out of 4 chemicals are predicted • Finally close the workflow window by pressing X button (4).

36
Outlook
The OECD QSAR Toolbox for Grouping Chemicals into Categories April 2017
• Aims
• Ecotoxicological prediction
• Workflow of the prediction
• Chemical input
• Automated workflow in Data-gap filling section
Single chemical
Batch mode
• Report

Report Overview
• Report module could generate report of any of predictions performed with the Toolbox.
• Report module contains Wizard pages which navigate you through predefined and user-editable report templates.
37 The OECD QSAR Toolbox for Grouping Chemicals into Categories April 2017
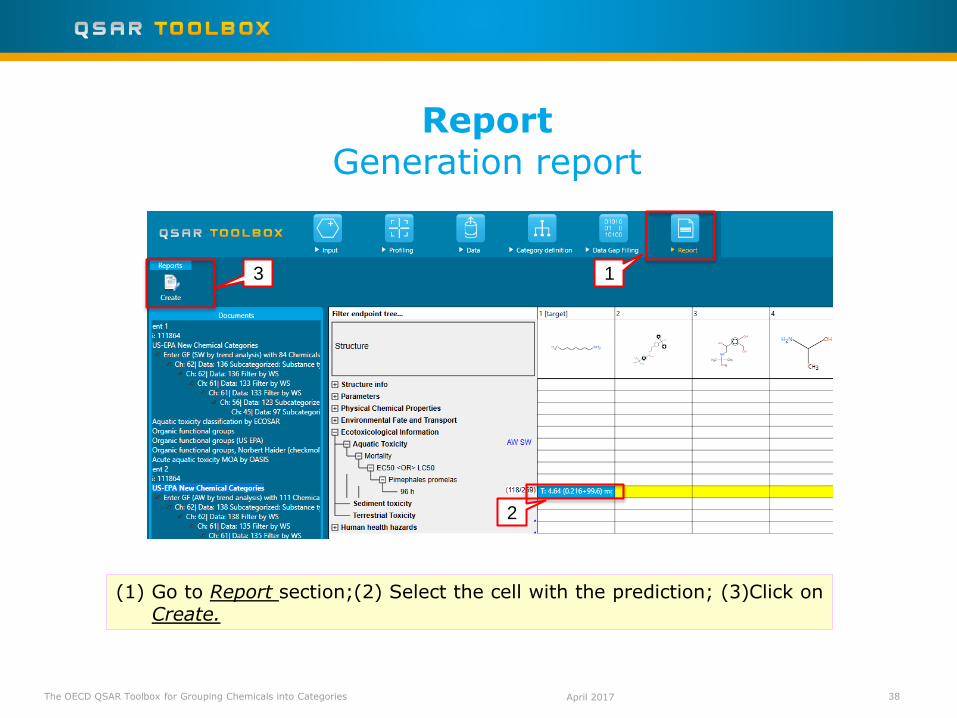
(1) Go to Report section;(2) Select the cell with the prediction; (3)Click on Create.
The OECD QSAR Toolbox for Grouping Chemicals into Categories
Report Generation report
38 April 2017
1 3
2

The OECD QSAR Toolbox for Grouping Chemicals into Categories
Report Generation report
39 April 2017
1
2
• Select different levels to customize the information that is going to be shown in the report1) • Select Create report (2) to display the report
The OECD QSAR Toolbox for Grouping Chemicals into Categories
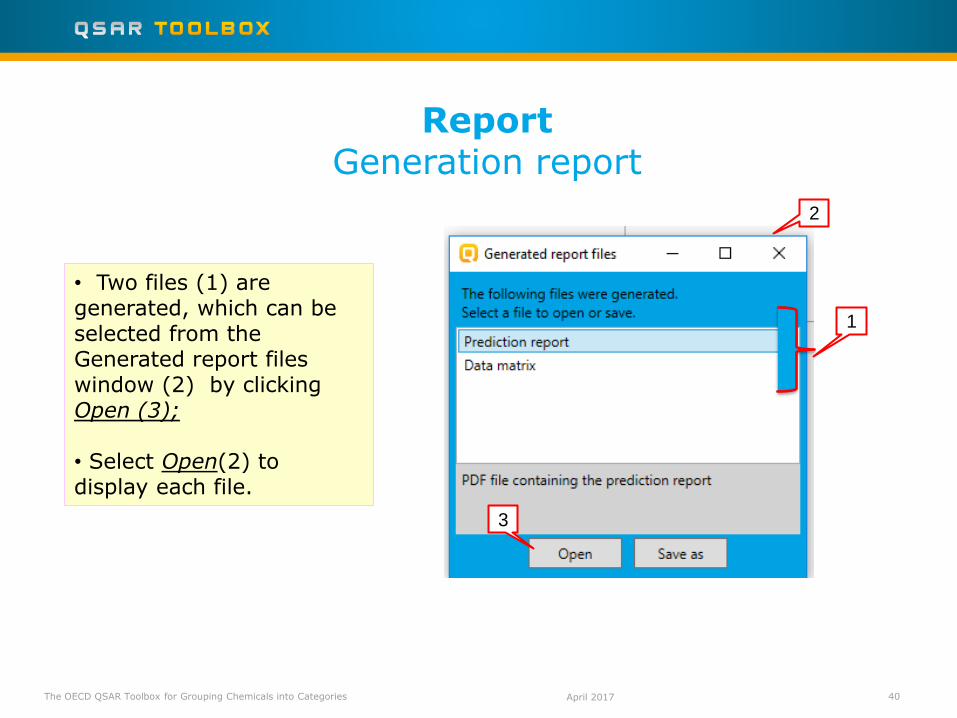
Report Generation report
40 April 2017
• Two files (1) are generated, which can be selected from the Generated report files window (2) by clicking Open (3); • Select Open(2) to display each file.
1
2
3

41
Report Overview
The OECD QSAR Toolbox for Grouping Chemicals into Categories April 2017
• The prediction report (1) is a PDF file; • The execution of AW “Ecotoxicological Endpoint” (2) is included in the Prediction summary.
1
2

42
Report Overview
The OECD QSAR Toolbox for Grouping Chemicals into Categories April 2017
• The data matrix (1) is an Excel file, which contains information about the
analogues.
1
1

43
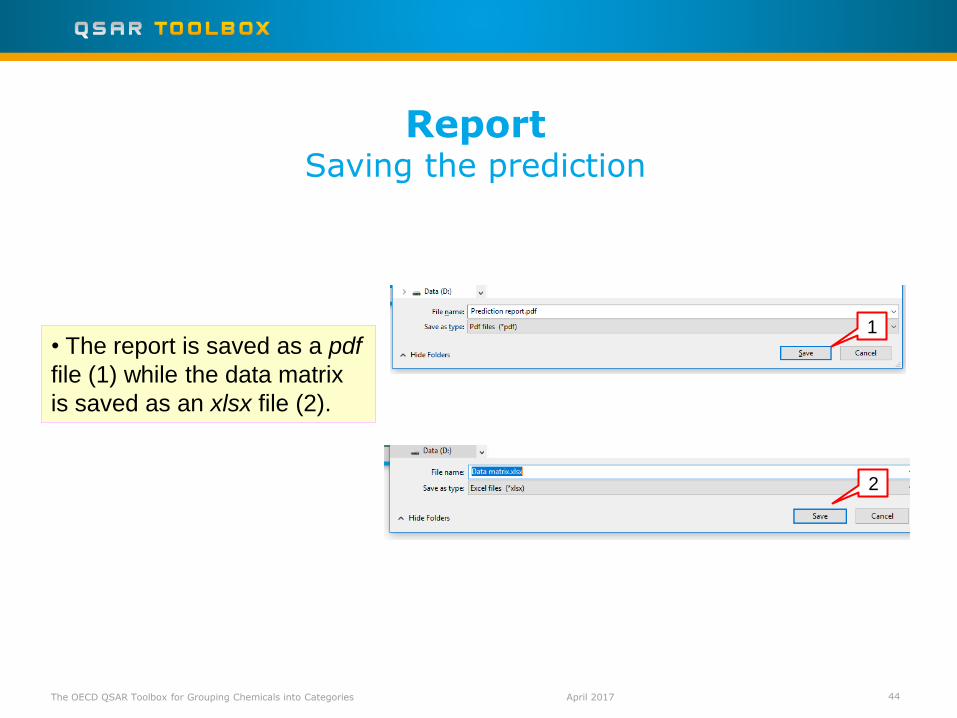
Report Saving the prediction
The OECD QSAR Toolbox for Grouping Chemicals into Categories April 2017
• To save any of the two files, select the file (1) and then click on Save as (2).
1
2
44
Report Saving the prediction
The OECD QSAR Toolbox for Grouping Chemicals into Categories April 2017
• The report is saved as a pdf
file (1) while the data matrix
is saved as an xlsx file (2).
1
2
2