NTP Technical Report on the Toxicity Studies of p-tert-Butylcatechol
119
National Toxicology Program Toxicity Report Series Number 70 NTP Technical Report on the Toxicity Studies of p-tert-Butylcatechol (CAS No. 98-29-3) Administered in Feed to F344/N Rats and B6C3F 1 Mice November 2002 U.S. Department of Health and Human Services Public Health Service National Institutes of Health
Transcript of NTP Technical Report on the Toxicity Studies of p-tert-Butylcatechol

National Toxicology Program Toxicity Report Series Number 70
NTP Technical Report on the Toxicity Studies of
p-tert-Butylcatechol
(CAS No. 98-29-3)
Administered in Feed to F344/N Rats and B6C3F1 Mice
November 2002
U.S. Department of Health and Human Services Public Health Service
National Institutes of Health
FOREWORD
The National Toxicology Program (NTP) is made up of four charter agencies of the U.S. Department of Health and Human Services (DHHS): the National Cancer Institute (NCI), National Institutes of Health; the National Institute of Environmental Health Sciences (NIEHS), National Institutes of Health; the National Center for Toxicological Research (NCTR), Food and Drug Administration; and the National Institute for Occupational Safety and Health (NIOSH), Centers for Disease Control and Prevention. In July 1981, the Carcinogenesis Bioassay Testing Program, NCI, was transferred to the NIEHS. The NTP coordinates the relevant programs, staff, and resources from these Public Health Service agencies relating to basic and applied research and to biological assay development and validation.
The NTP develops, evaluates, and disseminates scientific information about potentially toxic and hazardous chemicals. This knowledge is used for protecting the health of the American people and for the primary prevention of disease.
The studies described in this Toxicity Study Report were performed under the direction of the NIEHS and were conducted in compliance with NTP laboratory health and safety requirements and must meet or exceed all applicable federal, state, and local health and safety regulations. Animal care and use were in accordance with the Public Health Service Policy on Humane Care and Use of Animals.
These studies are designed and conducted to characterize and evaluate the toxicologic potential of selected chemicals in laboratory animals (usually two species, rats and mice). Chemicals selected for NTP toxicology studies are chosen primarily on the bases of human exposure, level of production, and chemical structure. The interpretive conclusions presented in this Toxicity Study Report are based only on the results of these NTP studies. Extrapolation of these results to other species and quantitative risk analyses for humans require wider analyses beyond the purview of these studies. Selection per se is not an indicator of a chemical’s toxic potential.
Details about ongoing and completed NTP studies are available at the NTP’s World Wide Web site: http://ntp-server.niehs.nih.gov. Abstracts of all NTP Toxicity Study Reports and full versions of the most recent reports and other publications are available from the NIEHS’ Environmental Health Perspectives (EHP) http://ehp.niehs.nih.gov (800-315-3010 or 919-541-3841). In addition, printed copies of these reports are available from EHP as supplies last. A listing of all the NTP Toxicity Study Reports printed since 1991 appears on the inside back cover.

National Toxicology Program Toxicity Report Series
Number 70
NTP Technical Report on the Toxicity Studies of
p-tert-Butylcatechol (CAS No. 98-29-3)
Administered in Feed to F344/N Rats and B6C3F1 Mice
June K. Dunnick, Ph.D., Study Scientist
National Toxicology Program Post Office Box 12233
Research Triangle Park, NC 27709
U.S. Department of Health and Human Services Public Health Service
National Institutes of Health

2
CONTRIBUTORS
National Toxicology Program Evaluated and interpreted results and reported findings
J.K. Dunnick, Ph.D., Study Scientist
J.R. Bucher, Ph.D. L.T. Burka, Ph.D. R.S. Chhabra, Ph.D. J. Mahler, D.V.M. C.S. Smith, Ph.D. G.S. Travlos, D.V.M. M.K. Vallant, B.S., M.T. K.L. Witt, M.S., ILS, Inc.
Microbiological Associates, Inc. Conducted 15-day studies and evaluated pathology findings
M.L. Wenk, Ph.D., Principal Investigator
L.L. Pippin, D.V.M.
Battelle Columbus Laboratories Conducted 14-week studies and evaluated pathology findings
M.R. Hejtmancik, Ph.D., Principal Investigator
J.D. Johnson, Ph.D. J.D. Toft II, D.V.M., M.S. J.T. Yarrington, D.V.M., Ph.D.
Experimental Pathology Laboratories, Inc. Provided pathology quality assurance
J.F. Hardisty, D.V.M., Principal Investigator
NTP Pathology Review Evaluated slides and prepared pathology report (September 2, 1998)
M.P. Jokinen, D.V.M. Pathology Associates International
J. Mahler, D.V.M. National Toxicology Program
R.O.W. Sciences, Inc. Provided sperm count and vaginal cytology evaluations
L.B. Kaiser, B.S. Y. Wang, M.S. G.W. Wolfe, Ph.D.
Analytical Sciences, Inc. Provided statistical analyses
P.W. Crockett, Ph.D., Principal Investigator
L.J. Betz, M.S. K.P. McGowan, M.B.A. J.T. Scott, M.S.
Biotechnical Services, Inc. Prepared Toxicity Study Report
S.R. Gunnels, M.A., Principal Investigator
M.P. Barker, B.A. E.S. Paal, M.S.J. D.C. Serbus, Ph.D. W.D. Sharp, B.A., B.S. R.A. Willis, B.A., B.S.

3
PEER REVIEW
The draft report on the toxicity studies of p-tert-butylcatechol was evaluated by the reviewers listed below. These reviewers serve as independent scientists, not as representatives of any institution, company, or governmental agency. In this capacity, reviewers determine if the design and conditions of these NTP studies are appropriate and ensure that this Toxicity Study Report presents the experimental results and conclusions fully and clearly.
Norman R. Drinkwater, Ph.D. David B. Carlson, Ph.D. McArdle Laboratory for Cancer Research Center for Food Safety and Applied Nutrition University of Wisconsin-Madison Office of Food Additive Safety Madison, WI U.S. Public Health Service
Department of Health and Human Services College Park, MD
4
ABSTRACT . . . . . . . . . . . . . . . . . . . . . .
INTRODUCTION . . . . . . . . . . . . . . . . . Chemical and Physical Properties . . . Production, Use, and Human ExposureAbsorption, Distribution, Metabolism, aToxicity . . . . . . . . . . . . . . . . . . . . . . . Reproductive and Developmental ToxicCarcinogenicity . . . . . . . . . . . . . . . . . Genetic Toxicity . . . . . . . . . . . . . . . . Study Rationale . . . . . . . . . . . . . . . . .
MATERIALS AND METHODS . . . . . . Procurement and Characterization of p-Preparation and Analysis of Dose Form15-Day Studies . . . . . . . . . . . . . . . . . 14-Week Studies . . . . . . . . . . . . . . . . Statistical Methods . . . . . . . . . . . . . . Quality Assurance Methods . . . . . . . . Genetic Toxicology . . . . . . . . . . . . . .
RESULTS . . . . . . . . . . . . . . . . . . . . . . . . Rats . . . . . . . . . . . . . . . . . . . . . . . . . . Mice . . . . . . . . . . . . . . . . . . . . . . . . . Absorption, Distribution, Metabolism, aGenetic Toxicology . . . . . . . . . . . . . .
DISCUSSION . . . . . . . . . . . . . . . . . . . . .
REFERENCES . . . . . . . . . . . . . . . . . . . .
APPENDIXES Appendix A Summary of Nonneop
Appendix B Clinical Pathology Re
Appendix C Organ Weights and O
Appendix D Reproductive Tissue
Appendix E Genetic Toxicology
Appendix F Chemical Characteriz
Appendix G Absorption, Distribut
CONTENTS
. . . . . . . . . . . . . . . . . . . . . . . . . . . . . . . . . . . . . . . . . . . . . . . . . . . 5
. . . . . . . . . . . . . . . . . . . . . . . . . . . . . . . . . . . . . . . . . . . . . . . . . . . 9
. . . . . . . . . . . . . . . . . . . . . . . . . . . . . . . . . . . . . . . . . . . . . . . . . . . 9 . . . . . . . . . . . . . . . . . . . . . . . . . . . . . . . . . . . . . . . . . . . . . . . . . . 9 nd Excretion . . . . . . . . . . . . . . . . . . . . . . . . . . . . . . . . . . . . . . . . 10
. . . . . . . . . . . . . . . . . . . . . . . . . . . . . . . . . . . . . . . . . . . . . . . . . . . 10 ity . . . . . . . . . . . . . . . . . . . . . . . . . . . . . . . . . . . . . . . . . . . . . . . . 11 . . . . . . . . . . . . . . . . . . . . . . . . . . . . . . . . . . . . . . . . . . . . . . . . . . . 12 . . . . . . . . . . . . . . . . . . . . . . . . . . . . . . . . . . . . . . . . . . . . . . . . . . . 13 . . . . . . . . . . . . . . . . . . . . . . . . . . . . . . . . . . . . . . . . . . . . . . . . . . . 13
. . . . . . . . . . . . . . . . . . . . . . . . . . . . . . . . . . . . . . . . . . . . . . . . . . . 15 tert-Butylcatechol . . . . . . . . . . . . . . . . . . . . . . . . . . . . . . . . . . . . 15 ulations . . . . . . . . . . . . . . . . . . . . . . . . . . . . . . . . . . . . . . . . . . . . 15 . . . . . . . . . . . . . . . . . . . . . . . . . . . . . . . . . . . . . . . . . . . . . . . . . . . 16 . . . . . . . . . . . . . . . . . . . . . . . . . . . . . . . . . . . . . . . . . . . . . . . . . . . 17 . . . . . . . . . . . . . . . . . . . . . . . . . . . . . . . . . . . . . . . . . . . . . . . . . . . 22 . . . . . . . . . . . . . . . . . . . . . . . . . . . . . . . . . . . . . . . . . . . . . . . . . . . 22 . . . . . . . . . . . . . . . . . . . . . . . . . . . . . . . . . . . . . . . . . . . . . . . . . . . 23
. . . . . . . . . . . . . . . . . . . . . . . . . . . . . . . . . . . . . . . . . . . . . . . . . . . 25
. . . . . . . . . . . . . . . . . . . . . . . . . . . . . . . . . . . . . . . . . . . . . . . . . . . 25
. . . . . . . . . . . . . . . . . . . . . . . . . . . . . . . . . . . . . . . . . . . . . . . . . . . 35 nd Excretion Studies . . . . . . . . . . . . . . . . . . . . . . . . . . . . . . . . . 40
. . . . . . . . . . . . . . . . . . . . . . . . . . . . . . . . . . . . . . . . . . . . . . . . . . . 40
. . . . . . . . . . . . . . . . . . . . . . . . . . . . . . . . . . . . . . . . . . . . . . . . . . . 41
. . . . . . . . . . . . . . . . . . . . . . . . . . . . . . . . . . . . . . . . . . . . . . . . . . . 45
lastic Lesions in Rats and Mice . . . . . . . . . . . . . . . . . . . . . . . . . A-1
sults . . . . . . . . . . . . . . . . . . . . . . . . . . . . . . . . . . . . . . . . . . . . . . B-1
rgan-Weight-to-Body-Weight Ratios . . . . . . . . . . . . . . . . . . . . . . C-1
Evaluations and Estrous Cycle Characterization . . . . . . . . . . . . . . D-1
. . . . . . . . . . . . . . . . . . . . . . . . . . . . . . . . . . . . . . . . . . . . . . . . . . . E-1
ation and Dose Formulation Studies . . . . . . . . . . . . . . . . . . . . . . F-1
ion, Metabolism, and Excretion Studies . . . . . . . . . . . . . . . . . . . . G-1
5
Chemical Fo
Synonyms: 1,2-Benzenediol, 4-(1,1-dimethylethyl1,2-dihydroxybenzene; 1,2-dihydroxy
p-tert-Butylcatechol is used as an antio
neoprene, and other olefins and reactive
Institute and the U.S. Food and Drug Adm
and use and to compare the toxicity of p-te
and butylated hydroxytoluene, which are
exposed to p-tert-butylcatechol (greater th
were conducted in Salmonella typhimuriu
In the 15-day studies, groups of five male
12,500, 25,000, or 50,000 ppm p-tert-bu
2,470 mg p-tert-butylcatechol/kg body w
50,000 ppm groups were killed moribund
rats exposed to 6,250 ppm or greater were
mice exposed to 12,500 or 25,000 ppm a
controls. Female rats, male and female mi
ABSTRACT
C(CH3)3
OH
OH
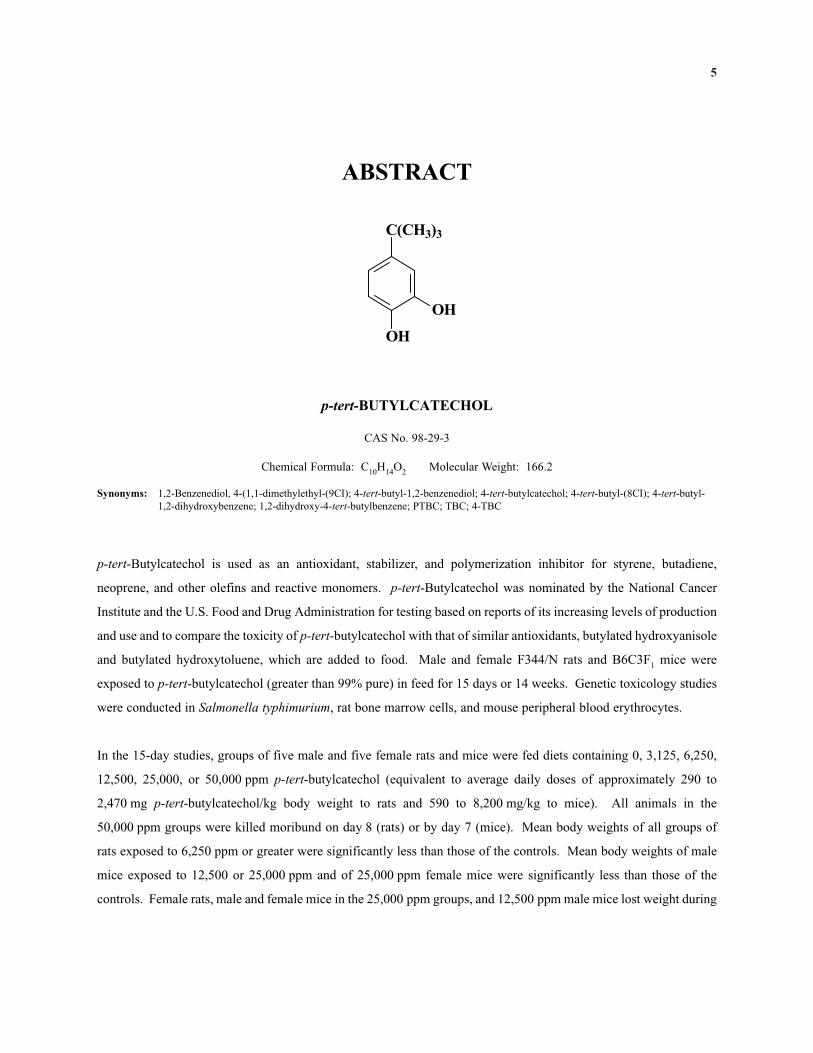
p-tert-BUTYLCATECHOL
CAS No. 98-29-3
rmula: C H O Molecular Weight: 166.210 14 2
-(9CI); 4-tert-butyl-1,2-benzenediol; 4-tert-butylcatechol; 4-tert-butyl-(8CI); 4-tert-butyl-4-tert-butylbenzene; PTBC; TBC; 4-TBC
xidant, stabilizer, and polymerization inhibitor for styrene, butadiene,
monomers. p-tert-Butylcatechol was nominated by the National Cancer
inistration for testing based on reports of its increasing levels of production
rt-butylcatechol with that of similar antioxidants, butylated hydroxyanisole
added to food. Male and female F344/N rats and B6C3F1 mice were
an 99% pure) in feed for 15 days or 14 weeks. Genetic toxicology studies
m, rat bone marrow cells, and mouse peripheral blood erythrocytes.
and five female rats and mice were fed diets containing 0, 3,125, 6,250,
tylcatechol (equivalent to average daily doses of approximately 290 to
eight to rats and 590 to 8,200 mg/kg to mice). All animals in the
on day 8 (rats) or by day 7 (mice). Mean body weights of all groups of
significantly less than those of the controls. Mean body weights of male
nd of 25,000 ppm female mice were significantly less than those of the
ce in the 25,000 ppm groups, and 12,500 ppm male mice lost weight during

6 p-tert-Butylcatechol, NTP TOX 70
the studies. Feed consumption by exposed rats generally decreased with increasing exposure concentration; feed
consumption by exposed mice was similar to that by the controls.
Thymus weights of 25,000 ppm rats and mice were significantly less than those of the controls. Gross findings noted
at necropsy included thin carcasses for three male and all female rats in the 12,500 ppm groups and all male and
female rats and mice in the 25,000 and 50,000 ppm groups. No exposure-related lesions were observed
microscopically.
In the 14-week studies, groups of 10 male and 10 female rats and mice were fed diets containing 0, 781, 1,562, 3,125,
6,250, or 12,500 ppm p-tert-butylcatechol (equivalent to average daily doses of approximately 70 to 1,030 mg/kg to
rats and 135 to 2,815 mg/kg to mice). All animals survived to the end of the studies. Mean body weights of male
rats exposed to 1,562 ppm or greater, female rats exposed to 3,125 ppm or greater, male mice exposed to 12,500 ppm,
and female mice exposed to 6,250 or 12,500 ppm were significantly less than those of the controls. Feed
consumption by male and female rats in the 6,250 and 12,500 ppm groups at week 1 and the 12,500 ppm groups at
week 14 was less than that by the controls; feed consumption by exposed and control mice was similar.
An erythrocytosis, indicated by increased hematocrit values, hemoglobin concentrations, and erythrocyte counts, was
observed in 6,250 and 12,500 ppm rats on day 4 and in 12,500 ppm rats on day 22. At these time points, a transient
hepatic effect was demonstrated by increases in alanine aminotransferase activities and bile salt concentrations in
exposed rats.
In 12,500 ppm male rats, absolute left cauda epididymis, epididymis, and testis weights were decreased by 15%,
10%, and 9%, respectively, compared to the controls. The number of spermatid heads per testis and epididymal
sperm motility of male rats in the 12,500 ppm group were significantly less than those of the controls. The numbers
of cycling female rats and females with regular estrous cycles were decreased in the 6,250 and 12,500 ppm groups.
Exposed groups of females had significantly fewer estrous cycles than did the controls. Estrous cycle length
increased with increasing exposure concentration; female rats in the 6,250 and 12,500 ppm groups had significantly
longer cycles and spent more time in diestrus and less time in proestrus, estrus, and metestrus than did the controls.
Female mice in the 12,500 ppm group had a significantly longer estrous cycle than did the controls.
The incidences of hyperkeratosis of the forestomach epithelium were significantly increased in male and female rats
in all exposed groups and in 12,500 ppm female mice. The incidences of hyperplasia of the forestomach epithelium
were significantly increased in male and female rats exposed to 3,125 ppm or greater, male mice exposed to
12,500 ppm, and female mice exposed to 6,250 or 12,500 ppm. The severities of the forestomach lesions were

7 p-tert-Butylcatechol, NTP TOX 70
minimal to moderate in male rats and minimal to mild in female rats and in mice. All male rats exposed to 6,250 or
12,500 ppm had minimal cytoplasmic alteration in the liver.
The absorption, distribution, metabolism, and excretion of p-tert-butylcatechol following intravenous injection,
gavage dosing, or dermal application were determined in male F344/N rats and B6C3F1 mice. The absorption of
[14C]-p-tert-butylcatechol following gavage dosing or dermal application was high. The percent absorption following
dermal application increased with increasing dose. Peak concentrations of [14C]-p-tert-butylcatechol equivalents in
plasma were reached 1 hour after gavage dosing (200 mg/kg) and 2 hours after dermal application (60 mg/kg); no
parent compound was detected in the plasma extracts. Regardless of route of administration, p-tert-butylcatechol
derived radioactivity was readily excreted in the urine and was markedly nonpersistent in the tissues. p-tert-
Butylcatechol was excreted as p-tert-butylcatechol sulfate and other polar metabolites that included predominately
sulfate conjugates; it was not excreted as the parent compound. One metabolite was determined to be an O-methyl
ON-sulfate of p-tert-butylcatechol.
p-tert-Butylcatechol (10 to 1,000 µg/plate) was not mutagenic in any of several strains of S. typhimurium with or
without rat or hamster liver S9. Bone marrow micronucleus tests in which 125 to 500 mg/kg p-tert-butylcatechol
was administered three times by intraperitoneal injection to male rats gave negative results. No increases in the
frequencies of micronucleated normochromatic erythrocytes were observed in the peripheral blood of male or female
mice administered p-tert-butylcatechol in feed for 14 weeks. No significant alteration in the percentage of
polychromatic erythrocytes in mouse bone marrow was observed.
In summary, the primary toxicity of p-tert-butylcatechol was to the forestomach of rats and mice. In the 14-week
study in rats, forestomach toxicity was observed at all exposure concentrations, and the no-observed-adverse-effect
level (NOAEL) was not reached for this effect. In the 14-week study in mice, the NOAEL for forestomach toxicity
was 1,562 ppm.

8 p-tert-Butylcatechol, NTP TOX 70

9
p-tert-Butylcatechol, a tertiary alcoh
285° C, a melting point ranging from
Lewis, 1997; Fluka Chemika-Biochem
slightly soluble in water (Verschuere
combustible when exposed to heat or
Lewis, 1989).
p-tert-Butylcatechol is manufactured
(Kirk-Othmer, 1980). It is sold as a po
is 3,5-di-tert-butylpyrocatechol (Ried
plant and production database indica
were imported and 10,000 to 100,000
(TSCAPP, 1983). For 1989, consump
be 1.5 million pounds (Chemical Mar
p-tert-Butylcatechol is used as an
neoprene, and other olefins and reac
insecticides, a clay strengthener in bu
emulsion breaker, a pour-point depres
adhesives (Patty’s, 1981). Coconut
concentrations of 1,3-butadiene in am
in commercial products such as rub
photoprocessing, and phototypesettin
melanogenesis-interrupting phenolic
Fardal and Curphey, 1983; Gellin, 19
INTRODUCTION
CHEMICAL AND PHYSICAL PROPERTIES
ol, is a colorless to white, crystalline or waxy solid with a boiling point of
53° to 58° C, and a vapor pressure of 0.0028 mm at 25° C (Verschueren, 1983;
ika, 2001). It is soluble in ether, alcohol, acetone, and trifluoroacetic acid and
n, 1983; Lewis, 1997). p-tert-Butylcatechol has a flash point of 129° C; it is
flame and emits acrid, irritating fumes when heated to decomposition (Sax and
PRODUCTION, USE, AND HUMAN EXPOSURE
by reacting isobutylene with catechol in the presence of ion exchange resins
wder or in a solution with 85% methanol or water. The only reported impurity
el-de Haën, 1984). For 1975 through 1977, the Toxic Substance Control Act
ted that approximately 0.1 million to 1 million pounds of p-tert-butylcatechol
pounds were produced by companies providing import and production volumes
tion of p-tert-butylcatechol by industries in the United States was estimated to
keting Reporter, 1989).
antioxidant, stabilizer, and polymerization inhibitor for styrene, butadiene,
tive monomers. Additionally, p-tert-butylcatechol is used as an activator for
ilding materials, a corrosion and radical inhibitor, an antiskinning additive, an
sant, a chemical intermediate for organic syntheses, and a component of shoe
shell charcoal coated with 10% p-tert-butylcatechol is used to analyze low
bient air (Hendricks and Schultz, 1986). p-tert-Butylcatechol may be present
ber gloves; polyester- or polyacrylic-based medical prostheses; duplicating,
g chemicals; fiberglass-reinforced polyester products; shoe adhesives; and
germicides and synthetic detergents (Patty’s, 1981; Foussereau et al., 1982;
83; Macfarlane et al., 1990).
10 p-tert-Butylcatechol, NTP TOX 70
Surveys by the National Institute for Occupational Safety and Health (1990) indicated that approximately
27,460 workers in the United States were potentially exposed to p-tert-butylcatechol between 1981 and 1983. No
threshold limit value has been recommended for p-tert-butylcatechol (ACGIH, 2001).
ABSORPTION, DISTRIBUTION, METABOLISM, AND EXCRETION
No metabolism studies of p-tert-butylcatechol were reported in the literature at the time the studies described in this
report were designed. Hirose et al. (1989) cited results of in vitro studies in which derivatives of catechol were found
to undergo perioxidative oxidation, which proceeds through oxidation-reduction cycling to produce the
corresponding quinone metabolites or active oxygen species that interact with cellular macromolecules. Picardo
et al. (1987) reported that p-tert-butylcatechol decomposed within 24 hours in an in vitro study. p-tert-Butylcatechol,
present as an antioxidant and polymerization inhibitor, was microbially degraded before styrene in soil and
enrichment cultures (Sielicki et al., 1978). In a study by Marchesini et al. (1977), p-tert-butylcatechol was
determined to yield the corresponding o-quinone via a secondary catecholoxidase activity of ascorbate oxidase,
which is found in fruits and vegetables. The metabolism and disposition studies of p-tert-butylcatechol in mice and
rats described in Appendix G have recently been published (Black and Mathews, 2000).
TOXICITY
Experimental Animals
Acute LD50 values reported for p-tert-butylcatechol were 2,820 mg per kilogram body weight orally for rats,
32 mg/kg by intravenous injection for mice, and 630 mg/kg by dermal application for rabbits (Smyth et al., 1954;
Sax and Lewis, 1989). Guinea pigs exposed dermally to 1% p-tert-butylcatechol for 3 weeks had moderate irritation;
guinea pigs exposed to 0.1% had mild irritation after three weeks (Smyth et al., 1954; Sax and Lewis, 1989). In
additional studies of p-tert-butylcatechol by the same authors, rabbits exhibited severe dermal irritation when
exposed to 500 mg for 24 hours and severe eye irritation when exposed to 50 mg.
Yonemoto et al. (1983a) administered three successive topical applications (0.3 mL) of a solution of 1 M p-tert
butylcatechol in dimethyl sulfoxide (30:70) at 48-hour intervals to the ear skin of hairless mice. An increase in
glutathione reductase activity was observed along with pheomelanogenesis (development of melanosomes with
altered ultrastructure); these effects preceded melanocyte degeneration and pigment loss in the skin.
11 p-tert-Butylcatechol, NTP TOX 70
Humans
As well as being a skin and eye irritant, p-tert-butylcatechol is moderately toxic when ingested or absorbed dermally.
Systemic toxic effects similar to those induced by phenols might be expected to occur, as with the parent compound
catechol (Patty’s, 1981).
Polyvinylchloride chemical plant workers exposed to p-tert-butylcatechol had allergic dermatitis with
depigmentation. Subsequently, one sensitized worker developed lesions after contact with free p-tert-butylcatechol
present in polyvinylchloride in shoes (Laurell, 1984). A polyester resin plant worker who handled p-tert
butylcatechol powder developed leukoderma on the hands, arms, and face; the depigmentation that accompanied
allergic dermatitis was still present, although reduced in size, 3 years after exposure (Horio et al., 1977). In other
studies, exposure to p-tert-butylcatechol from contact with rubber gloves, assembly lubricating oil, duplicating and
phototypesetting papers, and other p-tert-butylcatechol-containing products has been associated with allergic
dermatitis and depigmentation (Gellin et al., 1970; McGuire and Hendee, 1971; Foussereau et al., 1982; Hirosawa
et al., 1982; Fardal and Curphey, 1983; Gellin, 1983; Macfarlane et al., 1990).
To determine substrate stability and oxidative mechanisms relative to their toxicity on different cell lines, Picardo
et al. (1987) compared p-tert-butylcatechol and other diphenolic derivatives that act as tyrosinase substrates with
analogs that do not. The in vitro study used Raji and K562 cell lines, which lack tyrosinase, and 1RE 1 and 1RE 2
human melanoma cell lines. Catechols such as p-tert-butylcatechol that are tyrosinase substrates were found to be
equally toxic to melanoma and nonmelanoma cell lines. Usami et al. (1980) suggested that tyrosinase activity is
inhibited by p-tert-butylcatechol at the second step of melanogenesis. A selective melanocytotoxic action on
functional melanocytes has resulted in chemically induced leukoderma; a competitive inhibition of tyrosinase may
be involved (Gellin and Maibach, 1983). In a study of the effects of p-tert-butylcatechol on enzyme activity and
eumelanin and sulfur content in cultured human melanoma cells, Yonemoto et al. (1983a,b) concluded that the
chemical alters the types of melanin formed by modulation of glutathione reductase and (-glutamyl transpeptidase
activity. A study in a tissue-cultured B16 melanoma cell line was performed to determine the mechanism of
depigmentation; elevation of glutathione-metabolizing enzyme activity at a 10-4 M concentration of p-tert
butylcatechol was considered evidence that the chemical stimulates pheomelanogenesis in melanocytes (Kawashima
et al., 1984).
REPRODUCTIVE AND DEVELOPMENTAL TOXICITY
No studies or reports of reproductive or developmental toxicity of p-tert-butylcatechol in animals or humans were
found in a review of the literature.

12 p-tert-Butylcatechol, NTP TOX 70
CARCINOGENICITY
Experimental Animals
Results of a 1-year tumor promotion study indicate that p-tert-butylcatechol and other catechol derivatives may be
weak, nongenotoxic stomach carcinogens with promoting activity (Hirose et al., 1989). In this study, a group of
16 six-week-old F344 rats was administered a single intragastric dose of 150 mg/kg N-methyl-NN-nitro
N-nitrosoguanidine (MNNG) in dimethyl sulfoxide; from 1 week after the intragastric dose was administered until
week 52, the rats were fed a powdered diet containing 0% or 1.5% p-tert-butylcatechol ad libitum. An additional
group of 15 rats was maintained on the same diet as the pretreated rats but did not receive MNNG. Groups of
15 MNNG-pretreated rats and 10 untreated rats were maintained as controls. All 16 pretreated rats exposed to 1.5%
p-tert-butylcatechol had hyperplasia of the forestomach; additionally, 15 had papilloma, four had carcinoma in situ,
and 12 had squamous cell carcinoma. Forestomach hyperplasia also occurred in the rats that received p-tert
butylcatechol without the MNNG pretreatment. One rat administered p-tert-butylcatechol without MNNG
pretreatment also had a papilloma. In additional groups of 10 to 16 F344 rats in the same studies, the analogs
p-methylcatechol, hydroquinone, and resorcinol induced a less pronounced degree of hyperplasia (Hirose et al.,
1989). The analogs caffeic acid and butylated hydroxyanisole (BHA) were weak carcinogens in the rat forestomach
epithelium; butylated hydroxytoluene (BHT) was not carcinogenic (Hirose et al., 1988).
In the tumor promotion study by Hirose et al. (1989), the incidence of adenomatous hyperplasia in the pyloric region
of the glandular stomach was significantly greater in rats pretreated with MNNG and then administered 1.5% p-tert
butylcatechol in the diet than in the MNNG-pretreated controls. Adenomatous hyperplasia occurred in five of
16 exposed rats, and three rats developed adenocarcinoma. No lesions were observed in the fundic region of the
glandular stomach. Exposure to p-tert-butylcatechol without MNNG pretreatment did not result in lesions in either
the fundic or the pyloric region of the glandular stomach. No lesions were observed in control rats.
The carcinogenicity of hydroquinone, resorcinol, and t-butylhydroquinone, chemicals structurally related to p-tert
butylcatechol, in rats and mice has been studied by the National Toxicology Program (1989, 1992, 1997). There was
some evidence of carcinogenicity for hydroquinone administered by gavage for 2 years to male and female rats and
female mice, based on increased incidences of renal tubule cell adenoma in male rats, mononuclear cell leukemia in
female rats, and hepatocellular neoplasms in female mice. However, there was no evidence of carcinogenicity for
resorcinol administered by gavage or t-butylhydroquinone administered in feed for 2 years to male or female rats or
mice.
Humans
No epidemiology studies or case reports associating p-tert-butylcatechol exposure with cancer risk in humans were
found in the literature.
13 p-tert-Butylcatechol, NTP TOX 70
GENETIC TOXICITY
Few mutagenicity studies of p-tert-butylcatechol have been published. Negative results were reported for p-tert
butylcatechol in a battery of short-term mutagenicity tests including bacterial gene mutation assays with Salmonella
typhimurium strains TA98, TA100, TA1535, TA1537, and TA1538 and Escherichia coli strains WP2 and WP2 uvrA;
a test for mitotic gene conversion in Saccharomyces cerevisiae JD1; and an assay for induced chromosomal
aberrations in metabolically competent cultured rat liver cells (Dean et al., 1985). In contrast to these negative
results, significant dose-dependent increases in mutant frequencies were observed in L5178Y mouse lymphoma cells
incubated with 0.08 to 5.0 µg/mL p-tert-butylcatechol in the absence of S9 activation enzymes (McGregor et al.,
1988).
STUDY RATIONALE
p-tert-Butylcatechol was nominated by the National Cancer Institute and the U.S. Food and Drug Administration for
testing based on reports of its increasing levels of production and use. The toxicity studies were conducted to
compare the toxicity of p-tert-butylcatechol with that of similar antioxidants, BHA and BHT, which are added to
food. p-tert-Butylcatechol was administered in feed to F344/N rats and B6C3F1 mice in 15-day and 14-week studies.
In addition, genetic toxicology studies were conducted in S. typhimurium, rat bone marrow cells, and mouse
peripheral blood erythrocytes. Absorption, distribution, metabolism, and excretion studies were also conducted in
male F344/N rats and B6C3F1 mice.

14 p-tert-Butylcatechol, NTP TOX 70

15
p-tert-Butylcatechol was
19115EN); lot 03404 MF
Identity, purity, and stabi
support of the p-tert-buty
The chemical, a whitish,
carbon-13 nuclear magne
liquid chromatography (H
with HPLC. For lot 0340
major impurity peak had
than 0.1%. For lot 19115
with areas of 0.26% and 0
greater than 99%. Major
between the two lots.
Accelerated stability stud
indicated that p-tert-buty
headspace, protected from
studies and on informatio
in amber glass bottles, in
Dose formulations were
with irradiated feed appro
bags at –20° C for up to 3
during the 14-week studie
MATERIALS AND METHODS
PROCUREMENT AND CHARACTERIZATION OF P-TERT-BUTYLCATECHOL
obtained from Aldrich Chemical Company (Milwaukee, WI) in two lots (03404 MF and
was used during the 15-day studies and lot 19115EN was used during the 14-week studies.
lity analyses were conducted by the study laboratories. Reports on analyses performed in
lcatechol studies are on file at the National Institute of Environmental Health Sciences.
flaky solid, was identified as p-tert-butylcatechol by infrared spectroscopy and proton and
tic resonance spectroscopy. The purity of each lot was determined by high-performance
PLC). Major peak comparisons of lot 03404 MF with lot 19115EN were also performed
4 MF, results of HPLC analyses indicated the major product peak and three impurities. One
an area of 0.3% relative to the major peak; two minor impurities had relative areas of less
EN, results of HPLC analyses indicated the major product peak and two impurity peaks
.20% relative to the major peak area. The overall purity of each lot was determined to be
peak comparisons indicated nearly identical purity profiles and impurity concentrations
ies of lot 03404 MF of the bulk chemical were conducted with HPLC. These studies
lcatechol is stable as a bulk chemical for at least 14 days when stored under a nitrogen
strong oxidizers, at temperatures up to approximately 60° C. Based on the results of these
n in the literature, the bulk chemical was stored under a nitrogen headspace (lot 03404 MF)
the dark, at room temperature. No degradation of the bulk chemical was detected.
PREPARATION AND ANALYSIS OF DOSE FORMULATIONS
prepared by mixing p-tert-butylcatechol with nonirradiated feed once (15-day studies) or
ximately every 4 weeks (14-week studies) (Table F2). Formulations were stored in plastic
weeks during the 15-day studies and in plastic bags inside buckets at 5° C for up to 42 days
s.
16 p-tert-Butylcatechol, NTP TOX 70
Homogeneity studies of 3,125 and 50,000 ppm dose formulations in nonirradiated feed (15-day studies) and 781 and
12,500 ppm dose formulations in irradiated feed (14-week studies) and stability studies of the 781 and 3,125 ppm
dose formulations were performed by the study laboratories using HPLC. Homogeneity was confirmed. Stability of
the 3,125 ppm dose formulation was confirmed for 35 days for samples stored at approximately –20° C. Stability of
the 781 ppm dose formulation was confirmed for 42 days for samples stored in plastic bags at temperatures up to
5° C; samples subjected to animal room conditions showed declines of up to 37 percent in p-tert-butylcatechol
concentrations with time.
Periodic analyses of the dose formulations of p-tert-butylcatechol were conducted by the study laboratories using
HPLC. For the 15-day studies, dose formulations were analyzed once; all were within 10% of the target
concentrations (Table F3). Animal room samples of these dose formulations were also analyzed; the concentrations
of all samples were less than 90% of the target concentrations. For the 14-week studies, dose formulations were
analyzed at the beginning, midpoint, and end of the studies; all dose formulations analyzed and used for dosing were
within 10% of the target concentrations (Table F4). Animal room samples of these dose formulations were also
analyzed; the concentrations of nine of 15 animal room samples for rats and 13 of 15 for mice were less than 90% of
the target concentrations. The low concentrations of animal room samples were attributed to chemical degradation,
oxidation, evaporation, or binding with feed.
15-DAY STUDIES
Male and female F344/N rats and B6C3F1 mice were obtained from Taconic Farms (Germantown, NY). On receipt,
the rats and mice were 5 weeks old. Animals were quarantined for 11 (rats) or 12 (mice) days and were 6 (rats) or
7 (mice) weeks old on the first day of the studies. Groups of five male and five female rats and mice were fed diets
containing 0, 3,125, 6,250, 12,500, 25,000, or 50,000 ppm p-tert-butylcatechol for 15 days. Feed and water were
available ad libitum. Rats and female mice were housed five per cage; male mice were housed individually. Feed
consumption was recorded weekly by cage. The animals were weighed initially, weekly, and at the end of the studies;
clinical findings were recorded weekly and at the end of the studies. Before the studies began, two male and two
female rats and mice were randomly selected for parasite evaluation and gross observation for evidence of disease.
Details of the study design and animal maintenance are summarized in Table 1.
Necropsies were performed on all rats and mice. The heart, right kidney, liver, lungs, right testis, and thymus were
weighed. Histopathologic examinations were performed on all rats and mice in the 0, 25,000, and 50,000 ppm
groups. Table 1 lists the tissues and organs examined.
17 p-tert-Butylcatechol, NTP TOX 70
14-WEEK STUDIES
Male and female F344/N rats and B6C3F1 mice were obtained from Taconic Laboratory Animals and Services
(Germantown, NY). On receipt, the rats and mice were 4 weeks old. Rats were quarantined for 11 (males) or
12 (females) days and were 6 weeks old on the first day of the studies; mice were quarantined for 14 (females) or
15 (males) days and were 6 weeks old on the first day of the studies. Before the studies began, five male and five
female rats and mice were randomly selected for parasite evaluation and gross observation for evidence of disease.
Blood samples were collected from five male and five female rats and mice at 4 weeks and at the end of the studies.
The sera were analyzed for antibody titers to rodent viruses (Boorman et al., 1986; Rao et al., 1989a,b). All results
were negative.
Groups of 10 male and 10 female rats and mice were fed diets containing 0, 781, 1,562, 3,125, 6,250, or 12,500 ppm
p-tert-butylcatechol 7 days per week for 14 weeks. Additional groups of 10 male and 10 female rats designated for
clinical pathology testing were exposed to the same concentrations for 22 days. Feed and water were available
ad libitum. Animals were given irradiated feed; the feed was irradiated to reduce potential microbial contamination.
Rats and female mice were housed five per cage; male mice were housed individually. Clinical findings and feed
consumption were recorded weekly for core study rats and mice. Core study animals were weighed initially, weekly,
and at the end of the studies. Details of the study design and animal maintenance are summarized in Table 1.
Blood was collected from the retroorbital sinus of clinical pathology study rats on days 4 and 22 and from all core
study rats and mice at the end of the studies for hematology and clinical chemistry (rats) analyses. The animals were
anesthetized with a mixture of carbon dioxide and oxygen. Samples for hematology analysis were placed in micro
collection tubes (Sarstedt, Inc., Nümbrecht, Germany) coated with potassium EDTA and inverted by hand to prevent
clotting; samples for clinical chemistry evaluations were placed in similar tubes devoid of anticoagulant and
centrifuged for collection of serum. Hematocrit; hemoglobin concentration; erythrocyte, platelet, and leukocyte
counts; mean cell volume; mean cell hemoglobin; and mean cell hemoglobin concentration were determined with a
Cell-Dyn7 3500 hematology analyzer (Abbott Diagnostics, Santa Clara, CA). Differential leukocyte counts and
erythrocyte and platelet morphologies were determined microscopically from blood smears stained with a modified
Wright-Giemsa stain. A Miller Disc was used to determine reticulocyte counts from smears prepared with blood
stained with new methylene blue. For clinical chemistry analyses, serum samples were analyzed using a Hitachi 9117
chemistry analyzer (Boehringer Mannheim, Indianapolis, IN) using commercially available reagents. The
parameters evaluated are listed in Table 1.
At the end of the 14-week studies, samples were collected for sperm count and motility and vaginal cytology
evaluations of core study rats and mice exposed to 0, 3,125, 6,250, and 12,500 ppm. The parameters evaluated are
18 p-tert-Butylcatechol, NTP TOX 70
listed in Table 1. For 12 consecutive days prior to scheduled terminal sacrifice, the vaginal vaults of the females were
moistened with saline, if necessary, and samples of vaginal fluid and cells were stained. Relative numbers of
leukocytes, nucleated epithelial cells, and large squamous epithelial cells were determined and used to ascertain
estrous cycle stage (i.e., diestrus, proestrus, estrus, and metestrus). Male animals were evaluated for sperm count and
motility. The left testis and left epididymis were isolated and weighed. The tail of the epididymis (cauda epididymis)
was then removed from the epididymal body (corpus epididymis) and weighed. Test yolk (rats) or modified Tyrode’s
buffer (mice) was applied to slides, and a small incision was made at the distal border of the cauda epididymis. The
sperm effluxing from the incision were dispersed in the buffer on the slides, and the numbers of motile and nonmotile
spermatozoa were counted for five fields per slide by two observers.
Necropsies were performed on all core study animals. The heart, right kidney, liver, lungs, right testis, and thymus
were weighed. Tissues for microscopic examination were fixed and preserved in 10% neutral buffered formalin,
processed and trimmed, embedded in paraffin, sectioned to a thickness of 4 to 6 µm, and stained with hematoxylin
and eosin. Complete histopathologic examinations were performed on rats and mice in the 0 and 12,500 ppm groups.
The forestomach was identified as a target organ in rats and mice and was microscopically examined in all core study
animals. The liver was examined in all groups of male rats. Table 1 lists the tissues and organs routinely examined.
Upon completion of the laboratory pathologist’s histopathologic evaluation, the slides, paraffin blocks, and residual
wet tissues were sent to the NTP archives for inventory, slide/block match, and wet tissue audit. The slides,
individual animal data records, and pathology tables were sent to an independent pathology laboratory where quality
assessment was performed. Results were reviewed and evaluated by the NTP. Details of these review procedures
have been described by Maronpot and Boorman (1982) and Boorman et al. (1985).

19 p-tert-Butylcatechol, NTP TOX 70
TABLE 1 Experimental Design and Materials and Methods in the Feed Studies of p-tert-Butylcatechol
15-Day Studies 14-Week Studies
Study Laboratory Microbiological Associates, Inc. (Bethesda, MD)
Strain and Species F344/N rats B6C3F mice1
Animal Source Taconic Farms (Germantown, NY)
Time Held Before Studies Rats: 11 days Mice: 12 days
Average Age When Studies Began Rats: 6 weeks Mice: 7 weeks
Date of First Exposure Rats: March 20, 1995 Mice: March 21, 1995
Duration of Exposure 15 days
Date of Last Exposure Rats: April 3, 1995 Mice: April 4, 1995
Necropsy Dates Rats: April 3, 1995 Mice: April 4, 1995
Average Age at Necropsy Rats: 8 weeks Mice: 9 week
Size of Study Groups 5 males and 5 females
Method of Distribution Animals were distributed randomly into groups of approximately equal initial mean body weights.
Animals per Cage Rats: 5 Mice: 1 (males) or 5 (females)
Method of Animal Identification Tail tattoo
Battelle Columbus Laboratories (Columbus, OH)
F344/N rats B6C3F mice1
Taconic Laboratory Animals and Services (Germantown, NY)
Rats: 11 (males) or 12 (females) days Mice: 14 (females) or 15 (males) days
6 weeks
Rats: August 26 (males) or 27 (females), 1996 Mice: September 5 (females) or 6 (males), 1996
14 weeks
Rats: November 25 (males) or 26 (females), 1996 Mice: December 5 (females) or 6 (males), 1996
Rats: November 25 (males) or 26 (females), 1996 Mice: December 5 (females) or 6 (males), 1996
19 weeks
10 males and 10 females
Same as 15-day studies
Rats: 5 Mice: 1 (males) or 5 (females)
Tail tattoo
20 p-tert-Butylcatechol, NTP TOX 70
TABLE 1 Experimental Design and Materials and Methods in the Feed Studies of p-tert-Butylcatechol
15-Day Studies 14-Week Studies
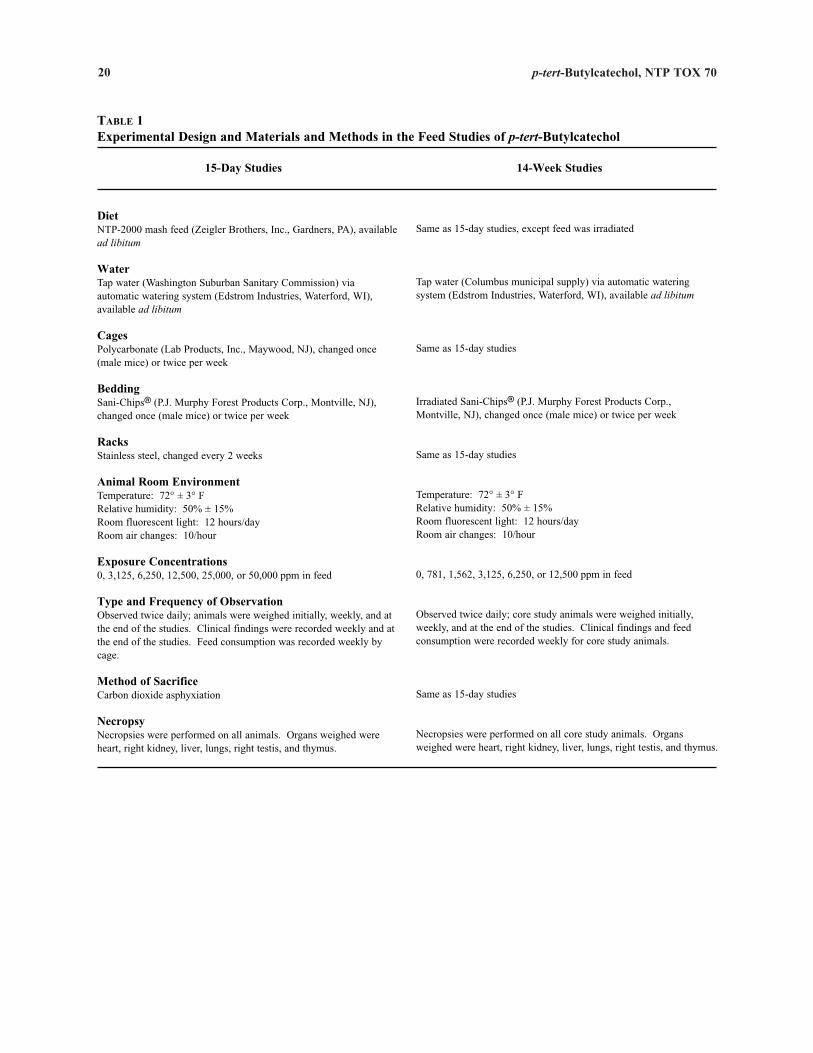
Diet NTP-2000 mash feed (Zeigler Brothers, Inc., Gardners, PA), available ad libitum
Water Tap water (Washington Suburban Sanitary Commission) via automatic watering system (Edstrom Industries, Waterford, WI), available ad libitum
Cages Polycarbonate (Lab Products, Inc., Maywood, NJ), changed once (male mice) or twice per week
Bedding Sani-Chips7 (P.J. Murphy Forest Products Corp., Montville, NJ), changed once (male mice) or twice per week
Racks Stainless steel, changed every 2 weeks
Animal Room Environment Temperature: 72° ± 3° F Relative humidity: 50% ± 15% Room fluorescent light: 12 hours/day Room air changes: 10/hour
Exposure Concentrations 0, 3,125, 6,250, 12,500, 25,000, or 50,000 ppm in feed
Type and Frequency of Observation Observed twice daily; animals were weighed initially, weekly, and at the end of the studies. Clinical findings were recorded weekly and at the end of the studies. Feed consumption was recorded weekly by cage.
Method of Sacrifice Carbon dioxide asphyxiation
Necropsy Necropsies were performed on all animals. Organs weighed were heart, right kidney, liver, lungs, right testis, and thymus.
Same as 15-day studies, except feed was irradiated
Tap water (Columbus municipal supply) via automatic watering system (Edstrom Industries, Waterford, WI), available ad libitum
Same as 15-day studies
Irradiated Sani-Chips7 (P.J. Murphy Forest Products Corp., Montville, NJ), changed once (male mice) or twice per week
Same as 15-day studies
Temperature: 72° ± 3° F Relative humidity: 50% ± 15% Room fluorescent light: 12 hours/day Room air changes: 10/hour
0, 781, 1,562, 3,125, 6,250, or 12,500 ppm in feed
Observed twice daily; core study animals were weighed initially, weekly, and at the end of the studies. Clinical findings and feed consumption were recorded weekly for core study animals.
Same as 15-day studies
Necropsies were performed on all core study animals. Organs weighed were heart, right kidney, liver, lungs, right testis, and thymus.
21 p-tert-Butylcatechol, NTP TOX 70
TABLE 1 Experimental Design and Materials and Methods in the Feed Studies of p-tert-Butylcatechol
15-Day Studies 14-Week Studies
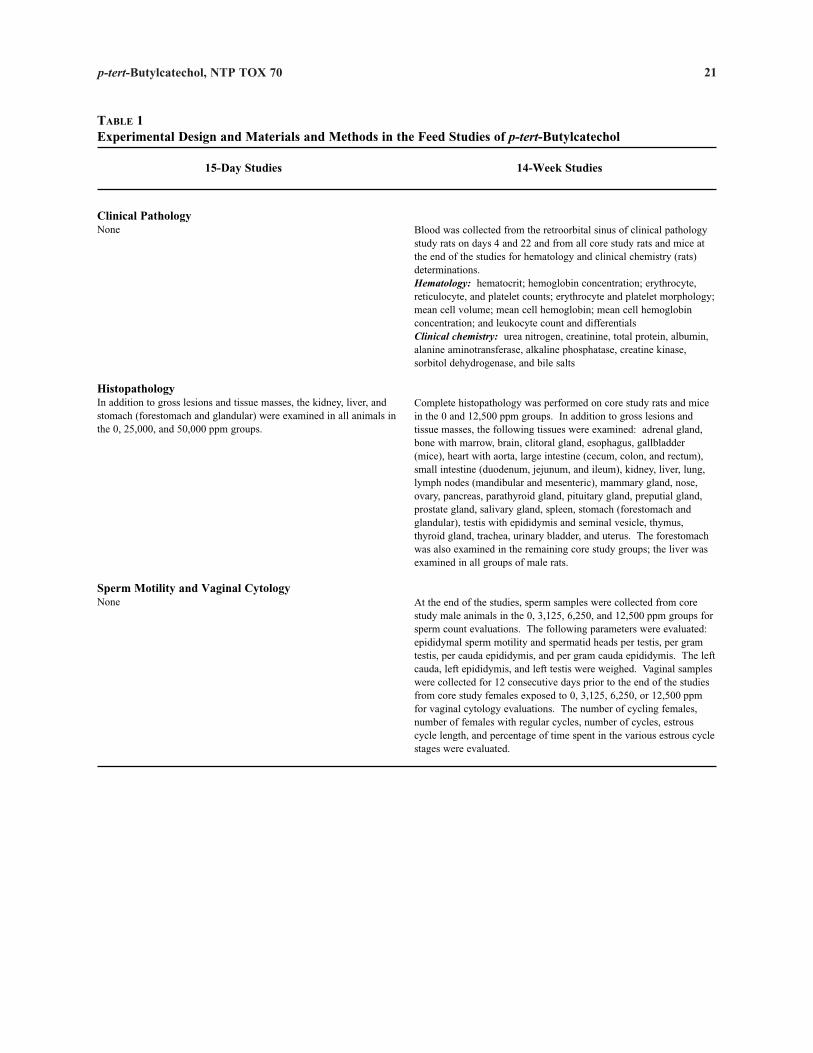
Clinical Pathology None
Histopathology In addition to gross lesions and tissue masses, the kidney, liver, and stomach (forestomach and glandular) were examined in all animals in the 0, 25,000, and 50,000 ppm groups.
Sperm Motility and Vaginal Cytology None
Blood was collected from the retroorbital sinus of clinical pathology study rats on days 4 and 22 and from all core study rats and mice at the end of the studies for hematology and clinical chemistry (rats) determinations. Hematology: hematocrit; hemoglobin concentration; erythrocyte, reticulocyte, and platelet counts; erythrocyte and platelet morphology; mean cell volume; mean cell hemoglobin; mean cell hemoglobin concentration; and leukocyte count and differentials Clinical chemistry: urea nitrogen, creatinine, total protein, albumin, alanine aminotransferase, alkaline phosphatase, creatine kinase, sorbitol dehydrogenase, and bile salts
Complete histopathology was performed on core study rats and mice in the 0 and 12,500 ppm groups. In addition to gross lesions and tissue masses, the following tissues were examined: adrenal gland, bone with marrow, brain, clitoral gland, esophagus, gallbladder (mice), heart with aorta, large intestine (cecum, colon, and rectum), small intestine (duodenum, jejunum, and ileum), kidney, liver, lung, lymph nodes (mandibular and mesenteric), mammary gland, nose, ovary, pancreas, parathyroid gland, pituitary gland, preputial gland, prostate gland, salivary gland, spleen, stomach (forestomach and glandular), testis with epididymis and seminal vesicle, thymus, thyroid gland, trachea, urinary bladder, and uterus. The forestomach was also examined in the remaining core study groups; the liver was examined in all groups of male rats.
At the end of the studies, sperm samples were collected from core study male animals in the 0, 3,125, 6,250, and 12,500 ppm groups for sperm count evaluations. The following parameters were evaluated: epididymal sperm motility and spermatid heads per testis, per gram testis, per cauda epididymis, and per gram cauda epididymis. The left cauda, left epididymis, and left testis were weighed. Vaginal samples were collected for 12 consecutive days prior to the end of the studies from core study females exposed to 0, 3,125, 6,250, or 12,500 ppm for vaginal cytology evaluations. The number of cycling females, number of females with regular cycles, number of cycles, estrous cycle length, and percentage of time spent in the various estrous cycle stages were evaluated.

22 p-tert-Butylcatechol, NTP TOX 70
STATISTICAL METHODS
Calculation and Analysis of Lesion Incidences
The incidences of lesions are presented in Appendix A as the numbers of animals bearing such lesions at a specific
anatomic site and the numbers of animals with that site examined microscopically. The Fisher exact test (Gart et al.,
1979), a procedure based on the overall proportion of affected animals, was used to determine significance.
Analysis of Continuous Variables
Two approaches were employed to assess the significance of pairwise comparisons between exposed and control
groups in the analysis of continuous variables. Organ and body weight data, which historically have approximately
normal distributions, were analyzed with the parametric multiple comparison procedures of Dunnett (1955) and
Williams (1971, 1972). Hematology, clinical chemistry, spermatid, and epididymal spermatozoal data, which have
typically skewed distributions, were analyzed using the nonparametric multiple comparison methods of Shirley
(1977) and Dunn (1964). Jonckheere’s test (Jonckheere, 1954) was used to assess the significance of the dose-related
trends and to determine whether a trend-sensitive test (Williams’ or Shirley’s test) was more appropriate for pairwise
comparisons than a test that does not assume a monotonic dose-related trend (Dunnett’s or Dunn’s test). Prior to
statistical analysis, extreme values identified by the outlier test of Dixon and Massey (1951) were examined by NTP
personnel, and implausible values were eliminated from the analysis. Average severity values were analyzed for
significance with the Mann-Whitney U test (Hollander and Wolfe, 1973). Because vaginal cytology data are
proportions (the proportion of the observation period that an animal was in a given estrous stage), an arcsine
transformation was used to bring the data into closer conformance with a normality assumption. Treatment effects
were investigated by applying a multivariate analysis of variance (Morrison, 1976) to the transformed data to test for
simultaneous equality of measurements across exposure concentrations.
QUALITY ASSURANCE METHODS
The 14-week studies were conducted in compliance with Food and Drug Administration Good Laboratory Practice
Regulations (21 CFR, Part 58). The Quality Assurance Units of Microbiological Associates, Inc., and Battelle
Columbus Laboratories performed audits and inspections of protocols, procedures, data, and reports throughout the
course of the studies.
23 p-tert-Butylcatechol, NTP TOX 70
GENETIC TOXICOLOGY
Salmonella typhimurium Mutagenicity Test Protocol
Testing was performed as reported by Zeiger et al. (1992). p-tert-Butylcatechol was sent to the laboratory as a coded
aliquot from Radian Corporation (Austin, TX). It was incubated with the S. typhimurium tester strains TA97, TA98,
TA100, TA102, TA104, and TA1535 either in buffer or S9 mix (metabolic activation enzymes and cofactors from
Aroclor 1254-induced male Sprague-Dawley rat or Syrian hamster liver) for 20 minutes at 37° C. Top agar
supplemented with L-histidine and d-biotin was added, and the contents of the tubes were mixed and poured onto the
surfaces of minimal glucose agar plates. Histidine-independent mutant colonies arising on these plates were counted
following incubation for 2 days at 37° C.
Each trial consisted of triplicate plates of concurrent positive and negative controls and of five doses of p-tert
butylcatechol. The high dose was limited by toxicity.
In this assay, a positive response is defined as a reproducible, dose-related increase in histidine-independent
(revertant) colonies in any one strain/activation combination. An equivocal response is defined as an increase in
revertants that is not dose related, is not reproducible, or is not of sufficient magnitude to support a determination of
mutagenicity. A negative response is obtained when no increase in revertant colonies is observed following chemical
treatment. There is no minimum percentage or fold increase required for a chemical to be judged positive or weakly
positive.
Rat Bone Marrow Micronucleus Test Protocol
The standard three-exposure protocol is described in detail by Shelby et al. (1993). Male F344/N rats were injected
intraperitoneally three times at 24-hour intervals with p-tert-butylcatechol dissolved in corn oil. Vehicle control
animals were injected with corn oil only. The positive control rats received injections of 10 mg/kg
cyclophosphamide. The rats were killed 24 hours after the third injection, and blood smears were prepared from bone
marrow cells obtained from the femurs. Air-dried smears were fixed and stained; 2,000 polychromatic erythrocytes
(PCEs) were scored for frequency of micronucleated cells in up to five animals per dose group.
The results were tabulated as the mean of the pooled results from all animals within a treatment group plus or minus
the standard error of the mean. The frequency of micronucleated cells among PCEs was analyzed by a statistical
software package that tested for increasing trend over dose groups with a one-tailed Cochran-Armitage trend test,
followed by pairwise comparisons between each dosed group and the control group (ILS, 1990). In the presence of
excess binomial variation, as detected by a binomial dispersion test, the binomial variance of the Cochran-Armitage
test was adjusted upward in proportion to the excess variation. In the micronucleus test, an individual trial is
24 p-tert-Butylcatechol, NTP TOX 70
considered positive if the trend test P value was less than or equal to 0.025 or if the P value for any single dose group
was less than or equal to 0.025 divided by the number of dose groups. A final call of positive for micronucleus
induction is preferably based on reproducibly positive trials (as noted above). Ultimately, the final call is determined
by the scientific staff after considering the results of statistical analyses, reproducibility of any effects observed, and
the magnitudes of those effects.
Mouse Peripheral Blood Micronucleus Test Protocol
A detailed discussion of this assay is presented by MacGregor et al. (1990). At the end of the 14-week study,
peripheral blood samples were obtained from male and female mice. Smears were immediately prepared and fixed
in absolute methanol. The methanol-fixed slides were stained with a chromatic-specific fluorescent dye mixture of
Hoechst 33258/pyronin Y (MacGregor et al., 1983) and coded. Slides were scanned to determine the frequency of
micronuclei in 10,000 normochromatic erythrocytes (NCEs) in each of 10 animals per exposure group. The results
for NCEs in mouse peripheral blood were tabulated as described for PCEs in the rat bone marrow micronucleus test
protocol. In addition, the percentage of PCEs among the total erythrocyte population in the peripheral blood was
scored for each dose group as a measure of toxicity.
Evaluation Protocol
These are the basic guidelines for arriving at an overall assay result for assays performed by the National Toxicology
Program. Statistical as well as biological factors are considered. For an individual assay, the statistical procedures
for data analysis have been described in the preceding protocols. There have been instances, however, in which
multiple aliquots of a chemical were tested in the same assay, and different results were obtained among aliquots
and/or among laboratories. Results from more than one aliquot or from more than one laboratory are not simply
combined into an overall result. Rather, all the data are critically evaluated, particularly with regard to pertinent
protocol variations, in determining the weight of evidence for an overall conclusion of chemical activity in an assay.
In addition to multiple aliquots, the in vitro assays have another variable that must be considered in arriving at an
overall test result. In vitro assays are conducted with and without exogenous metabolic activation. Results obtained
in the absence of activation are not combined with results obtained in the presence of activation; each testing
condition is evaluated separately. The results presented in the Abstract of this Toxicity Study Report represent a
scientific judgement of the overall evidence for activity of the chemical in an assay.

25
15-DAY STUDY
All rats in the 50,000 ppm groups were killed
groups exposed to 6,250 ppm or greater and the
than those of the controls; females in the 25,000
generally decreased with increasing exposure
25,000, and 50,000 ppm resulted in average d
p-tert-butylcatechol/kg body weight to males an
males and females exhibited abnormal posture
was also lethargic. One 50,000 ppm female an
Absolute and relative thymus weights of 25,00
the absolute thymus weight of 12,500 ppm m
reflected decreases in body weights.
Gross findings noted at necropsy included thin
and all males and females in the 25,000 and 5
groups examined (0, 25,000, and 50,000 ppm
mortality in the 50,000 ppm groups, the hig
12,500 ppm.
RESULTS
RATS
moribund on day 8 (Table 2). The final mean body weights of all
mean body weight gains of all exposed groups were significantly less
ppm group lost weight during the study (Table 2). Feed consumption
concentration. Exposure concentrations of 3,125, 6,250, 12,500,
aily doses of approximately 290, 525, 1,000, 1,650, and 1,700 mg
d 290, 520, 930, 1,440, and 2,470 mg/kg to females. All 50,000 ppm
, ataxia, ruffled fur, and thinness; one female exposed to 50,000 ppm
d one 25,000 ppm male had nasal/eye discharge.
0 ppm rats were significantly less than those of the controls, as was
ales (Table C1). Other organ weight differences in exposed rats
carcasses for three males and all females in the 12,500 ppm groups
0,000 ppm groups. No lesions were observed microscopically in the
). Based on the body weight effects in the 25,000 ppm groups and
hest exposure concentration selected for the 14-week study was
26
c
p-tert-Butylcatechol, NTP TOX 70
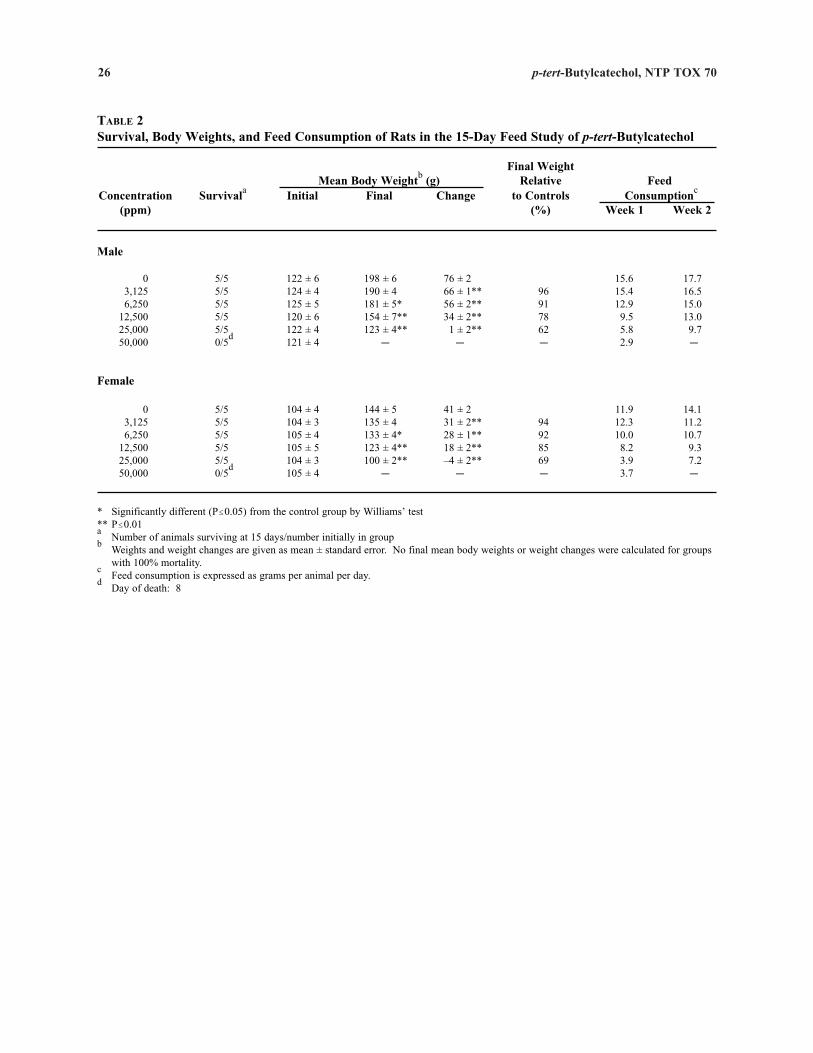
TABLE 2 Survival, Body Weights, and Feed Consumption of Rats in the 15-Day Feed Study of p-tert-Butylcatechol
Final Weight Mean Body Weightb (g) Relative Feed
Concentration Survivala Initial Final Change to Controls Consumptionc
(ppm) (%) Week 1 Week 2
Male
0 5/5 122 ± 6 198 ± 6 76 ± 2 15.6 17.7 3,125 5/5 124 ± 4 190 ± 4 66 ± 1** 96 15.4 16.5 6,250 5/5 125 ± 5 181 ± 5* 56 ± 2** 91 12.9 15.0
12,500 5/5 120 ± 6 154 ± 7** 34 ± 2** 78 9.5 13.0 25,000 50,000
5/5 0/5
d 122 ± 4 121 ± 4
123 ± 4** C
1 ± 2** C
62 C
5.8 2.9
9.7 C
Female
0 5/5 104 ± 4 144 ± 5 41 ± 2 11.9 14.1 3,125 5/5 104 ± 3 135 ± 4 31 ± 2** 94 12.3 11.2 6,250 5/5 105 ± 4 133 ± 4* 28 ± 1** 92 10.0 10.7
12,500 5/5 105 ± 5 123 ± 4** 18 ± 2** 85 8.2 9.3 25,000 50,000
5/5 0/5
d 104 ± 3 105 ± 4
100 ± 2** C
–4 ± 2** C
69 C
3.9 3.7
7.2 C
* Significantly different (P#0.05) from the control group by Williams’ test ** P#0.01 a
Number of animals surviving at 15 days/number initially in groupb
Weights and weight changes are given as mean ± standard error. No final mean body weights or weight changes were calculated for groups with 100% mortality. Feed consumption is expressed as grams per animal per day.
d Day of death: 8
27
c
p-tert-Butylcatechol, NTP TOX 70
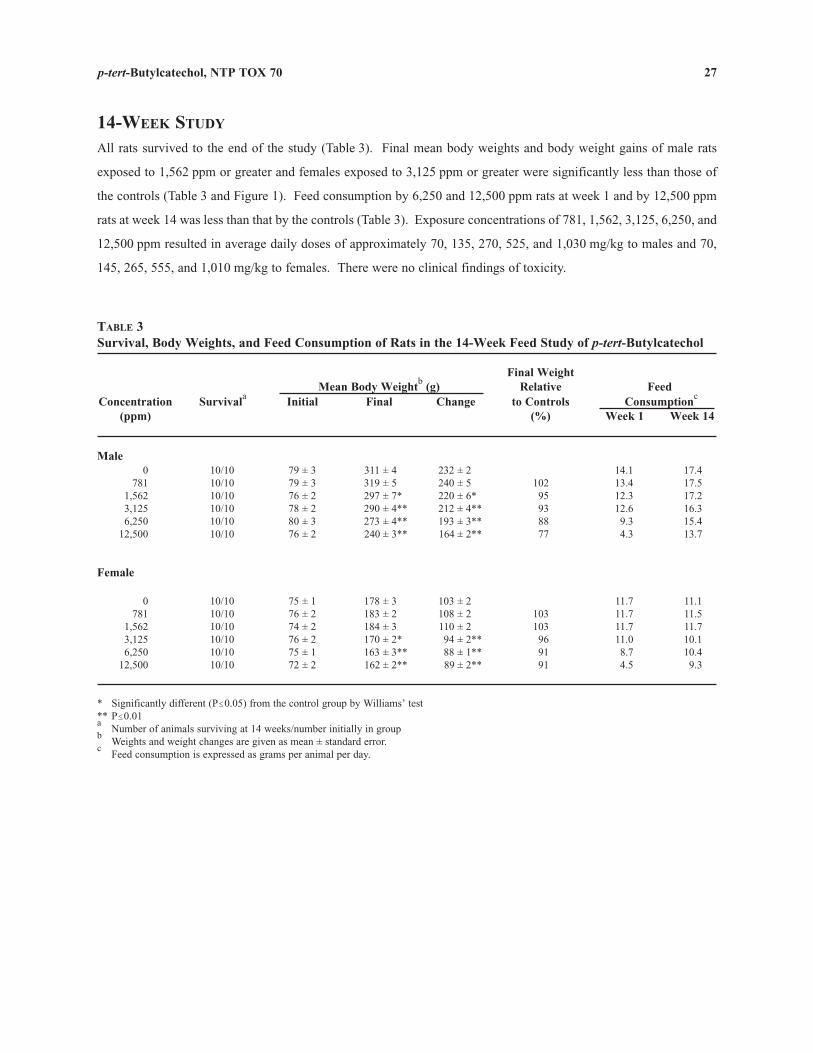
14-WEEK STUDY
All rats survived to the end of the study (Table 3). Final mean body weights and body weight gains of male rats
exposed to 1,562 ppm or greater and females exposed to 3,125 ppm or greater were significantly less than those of
the controls (Table 3 and Figure 1). Feed consumption by 6,250 and 12,500 ppm rats at week 1 and by 12,500 ppm
rats at week 14 was less than that by the controls (Table 3). Exposure concentrations of 781, 1,562, 3,125, 6,250, and
12,500 ppm resulted in average daily doses of approximately 70, 135, 270, 525, and 1,030 mg/kg to males and 70,
145, 265, 555, and 1,010 mg/kg to females. There were no clinical findings of toxicity.
TABLE 3 Survival, Body Weights, and Feed Consumption of Rats in the 14-Week Feed Study of p-tert-Butylcatechol
Final Weight Mean Body Weightb (g) Relative Feed
Concentration Survivala Initial Final Change to Controls Consumptionc
(ppm) (%) Week 1 Week 14
Male 0 10/10 79 ± 3 311 ± 4 232 ± 2 14.1 17.4
781 10/10 79 ± 3 319 ± 5 240 ± 5 102 13.4 17.5 1,562 10/10 76 ± 2 297 ± 7* 220 ± 6* 95 12.3 17.2 3,125 10/10 78 ± 2 290 ± 4** 212 ± 4** 93 12.6 16.3 6,250 10/10 80 ± 3 273 ± 4** 193 ± 3** 88 9.3 15.4
12,500 10/10 76 ± 2 240 ± 3** 164 ± 2** 77 4.3 13.7
Female
0 10/10 75 ± 1 178 ± 3 103 ± 2 11.7 11.1 781 10/10 76 ± 2 183 ± 2 108 ± 2 103 11.7 11.5
1,562 10/10 74 ± 2 184 ± 3 110 ± 2 103 11.7 11.7 3,125 10/10 76 ± 2 170 ± 2* 94 ± 2** 96 11.0 10.1 6,250 10/10 75 ± 1 163 ± 3** 88 ± 1** 91 8.7 10.4
12,500 10/10 72 ± 2 162 ± 2** 89 ± 2** 91 4.5 9.3
* Significantly different (P#0.05) from the control group by Williams’ test ** P#0.01 a
Number of animals surviving at 14 weeks/number initially in groupb
Weights and weight changes are given as mean ± standard error. Feed consumption is expressed as grams per animal per day.
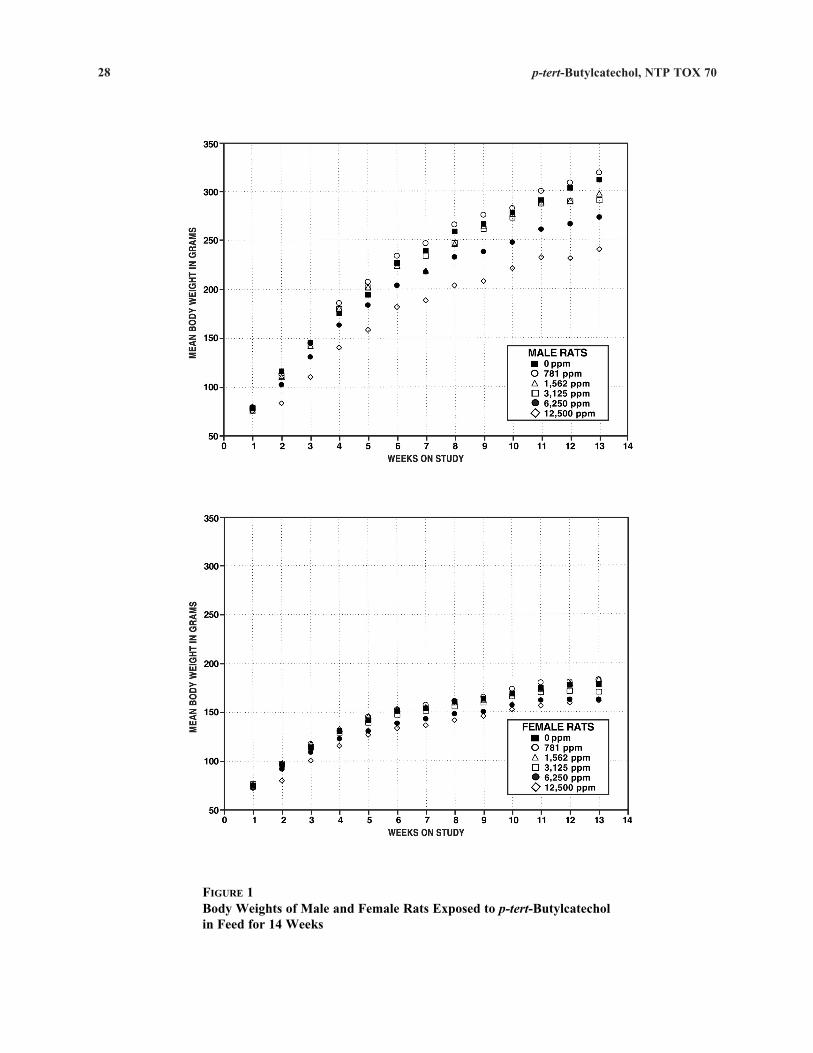
28 p-tert-Butylcatechol, NTP TOX 70
FIGURE 1 Body Weights of Male and Female Rats Exposed to p-tert-Butylcatechol in Feed for 14 Weeks
29 p-tert-Butylcatechol, NTP TOX 70
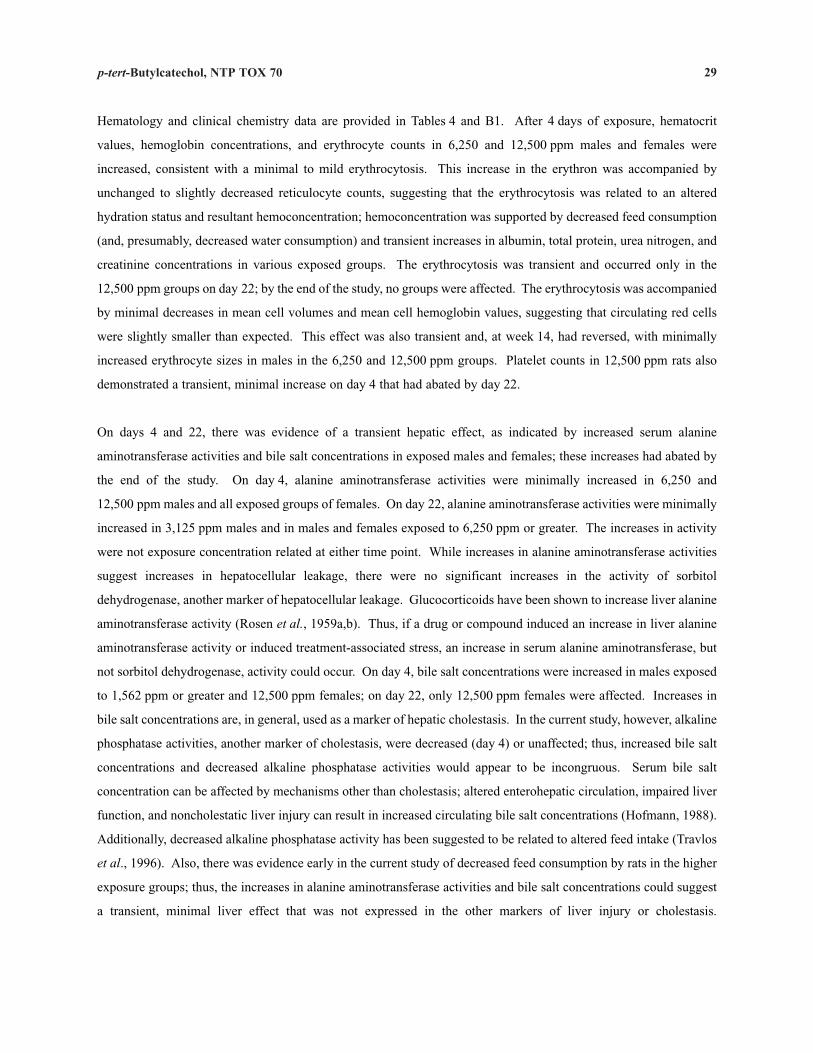
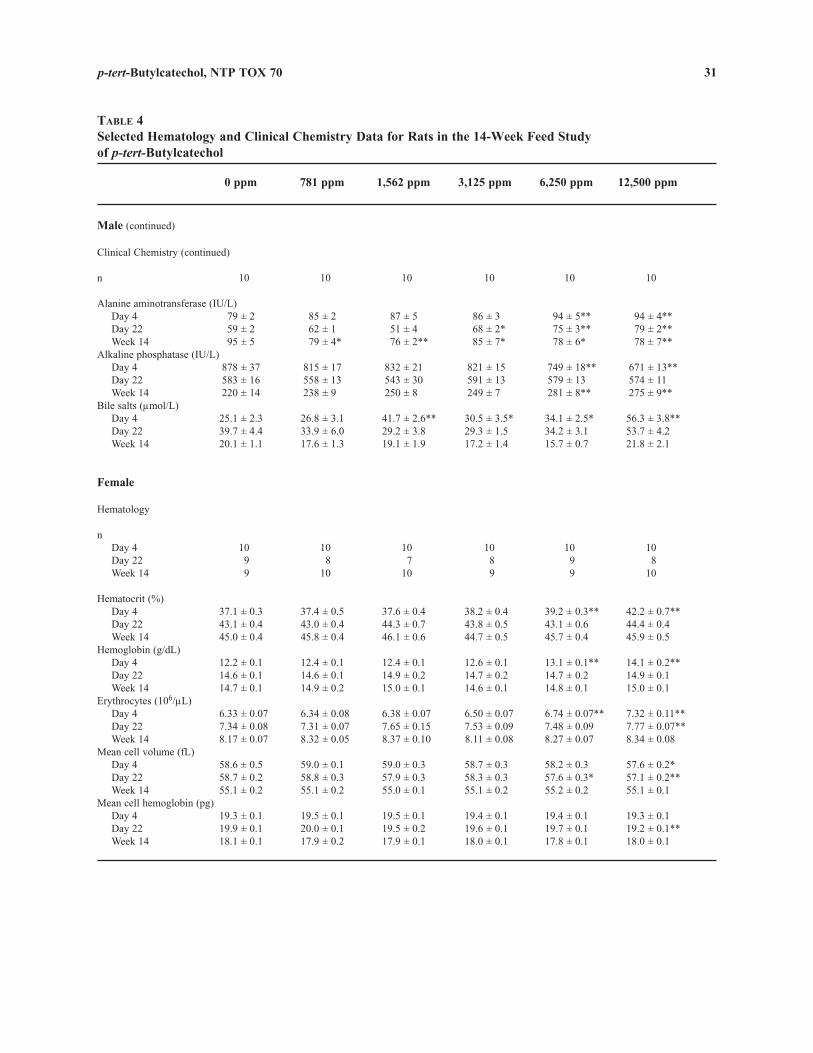
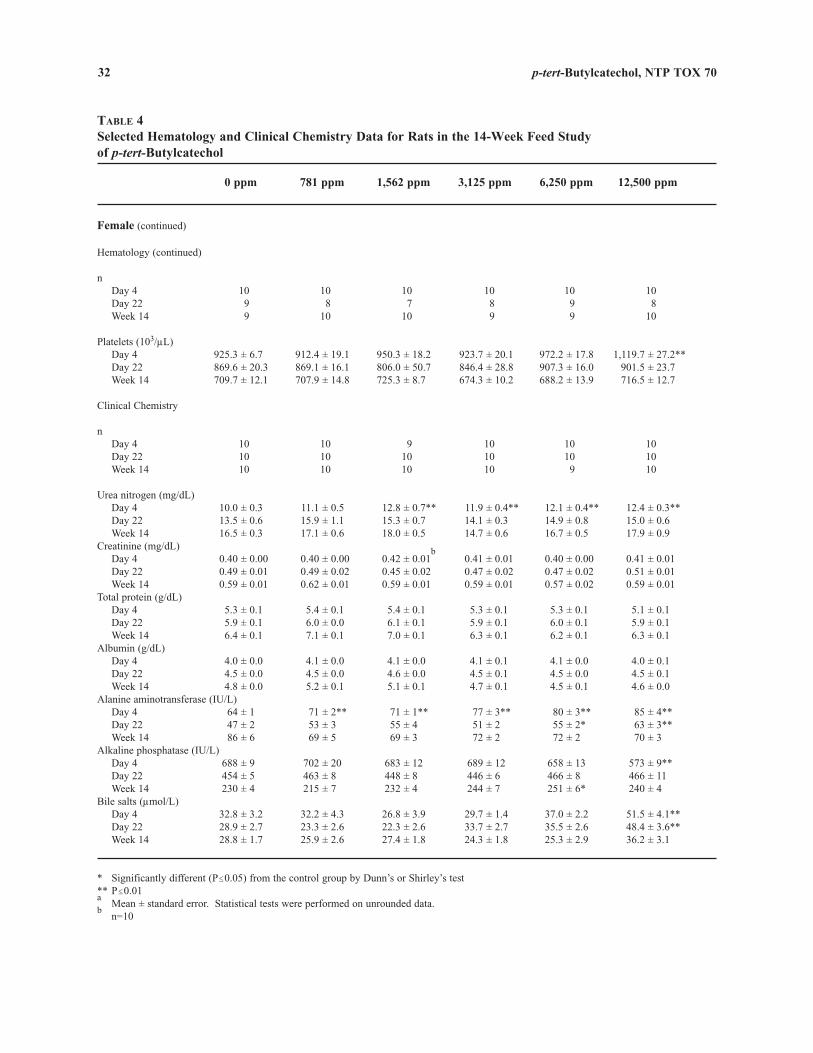
Hematology and clinical chemistry data are provided in Tables 4 and B1. After 4 days of exposure, hematocrit
values, hemoglobin concentrations, and erythrocyte counts in 6,250 and 12,500 ppm males and females were
increased, consistent with a minimal to mild erythrocytosis. This increase in the erythron was accompanied by
unchanged to slightly decreased reticulocyte counts, suggesting that the erythrocytosis was related to an altered
hydration status and resultant hemoconcentration; hemoconcentration was supported by decreased feed consumption
(and, presumably, decreased water consumption) and transient increases in albumin, total protein, urea nitrogen, and
creatinine concentrations in various exposed groups. The erythrocytosis was transient and occurred only in the
12,500 ppm groups on day 22; by the end of the study, no groups were affected. The erythrocytosis was accompanied
by minimal decreases in mean cell volumes and mean cell hemoglobin values, suggesting that circulating red cells
were slightly smaller than expected. This effect was also transient and, at week 14, had reversed, with minimally
increased erythrocyte sizes in males in the 6,250 and 12,500 ppm groups. Platelet counts in 12,500 ppm rats also
demonstrated a transient, minimal increase on day 4 that had abated by day 22.
On days 4 and 22, there was evidence of a transient hepatic effect, as indicated by increased serum alanine
aminotransferase activities and bile salt concentrations in exposed males and females; these increases had abated by
the end of the study. On day 4, alanine aminotransferase activities were minimally increased in 6,250 and
12,500 ppm males and all exposed groups of females. On day 22, alanine aminotransferase activities were minimally
increased in 3,125 ppm males and in males and females exposed to 6,250 ppm or greater. The increases in activity
were not exposure concentration related at either time point. While increases in alanine aminotransferase activities
suggest increases in hepatocellular leakage, there were no significant increases in the activity of sorbitol
dehydrogenase, another marker of hepatocellular leakage. Glucocorticoids have been shown to increase liver alanine
aminotransferase activity (Rosen et al., 1959a,b). Thus, if a drug or compound induced an increase in liver alanine
aminotransferase activity or induced treatment-associated stress, an increase in serum alanine aminotransferase, but
not sorbitol dehydrogenase, activity could occur. On day 4, bile salt concentrations were increased in males exposed
to 1,562 ppm or greater and 12,500 ppm females; on day 22, only 12,500 ppm females were affected. Increases in
bile salt concentrations are, in general, used as a marker of hepatic cholestasis. In the current study, however, alkaline
phosphatase activities, another marker of cholestasis, were decreased (day 4) or unaffected; thus, increased bile salt
concentrations and decreased alkaline phosphatase activities would appear to be incongruous. Serum bile salt
concentration can be affected by mechanisms other than cholestasis; altered enterohepatic circulation, impaired liver
function, and noncholestatic liver injury can result in increased circulating bile salt concentrations (Hofmann, 1988).
Additionally, decreased alkaline phosphatase activity has been suggested to be related to altered feed intake (Travlos
et al., 1996). Also, there was evidence early in the current study of decreased feed consumption by rats in the higher
exposure groups; thus, the increases in alanine aminotransferase activities and bile salt concentrations could suggest
a transient, minimal liver effect that was not expressed in the other markers of liver injury or cholestasis.

30 p-tert-Butylcatechol, NTP TOX 70
TABLE 4 Selected Hematology and Clinical Chemistry Data for Rats in the 14-Week Feed Study of p-tert-Butylcatechola
0 ppm 781 ppm 1,562 ppm 3,125 ppm 6,250 ppm 12,500 ppm
Male
Hematology
n Day 4 9 10 10 10 10 9 Day 22 10 9 9 8 9 10 Week 14 10 10 9 10 10 9
Hematocrit (%) Day 4 35.7 ± 0.4 35.5 ± 0.2 35.7 ± 0.5 37.0 ± 0.7 39.1 ± 0.4** 41.5 ± 0.4** Day 22 40.4 ± 0.4 40.2 ± 0.4 45.4 ± 1.4** 41.3 ± 0.6* 41.9 ± 0.6* 42.5 ± 0.5** Week 14 45.8 ± 0.5 45.8 ± 0.3 44.3 ± 0.6 46.9 ± 0.4 46.8 ± 0.3 47.1 ± 0.3*
Hemoglobin (g/dL) Day 4 11.7 ± 0.2 11.8 ± 0.1 11.9 ± 0.2 12.2 ± 0.2* 13.0 ± 0.2** 13.8 ± 0.1** Day 22 13.7 ± 0.1 13.6 ± 0.1 15.3 ± 0.5* 13.9 ± 0.3 14.0 ± 0.2 14.3 ± 0.2 Week 14 15.0 ± 0.2 14.9 ± 0.1 14.7 ± 0.1 15.3 ± 0.1 15.3 ± 0.1 15.3 ± 0.1*
Erythrocytes (106/µL) Day 4 6.13 ± 0.05 6.10 ± 0.05 6.25 ± 0.08 6.42 ± 0.11 6.81 ± 0.06** 7.28 ± 0.07** Day 22 6.98 ± 0.09 6.96 ± 0.07 7.87 ± 0.27** 7.12 ± 0.13 7.23 ± 0.12 7.52 ± 0.10** Week 14 8.93 ± 0.12 8.83 ± 0.10 8.62 ± 0.13 9.03 ± 0.09 8.96 ± 0.09 8.96 ± 0.06
Mean cell volume (fL) Day 4 58.2 ± 0.4 58.2 ± 0.3 57.2 ± 0.5 57.6 ± 0.4 57.4 ± 0.4 57.0 ± 0.3* Day 22 57.8 ± 0.3 57.7 ± 0.2 57.8 ± 0.3 58.1 ± 0.4 58.0 ± 0.3 56.5 ± 0.2* Week 14 51.4 ± 0.2 51.9 ± 0.3* 51.4 ± 0.2 51.9 ± 0.4* 52.3 ± 0.4** 52.6 ± 0.2**
Mean cell hemoglobin (pg) Day 4 19.2 ± 0.1 19.3 ± 0.1 19.0 ± 0.2 19.0 ± 0.2 19.0 ± 0.1 18.9 ± 0.1 Day 22 19.6 ± 0.2 19.5 ± 0.1 19.5 ± 0.1 19.6 ± 0.1 19.4 ± 0.1 19.0 ± 0.1* Week 14 16.8 ± 0.1 16.9 ± 0.1 17.1 ± 0.2 16.9 ± 0.1 17.1 ± 0.2* 17.1 ± 0.0*
Platelets (103/µL) Day 4 997.7 ± 15.4 977.3 ± 21.5 916.1 ± 36.1 955.8 ± 43.8 1,035.9 ± 18.0 1,116.8 ± 48.9* Day 22 910.0 ± 35.4 1,002.1 ± 15.0 870.6 ± 73.1 869.5 ± 72.2 847.1 ± 62.1 886.5 ± 38.2 Week 14 729.4 ± 7.1 723.4 ± 17.7 679.6 ± 12.9* 743.3 ± 14.5 702.2 ± 14.5 719.1 ± 17.8
Clinical Chemistry
n 10 10 10 10 10 10
Urea nitrogen (mg/dL) Day 4 11.7 ± 0.5 13.0 ± 0.5 13.4 ± 0.4* 14.1 ± 0.5** 14.3 ± 0.4** 14.5 ± 0.4** Day 22 13.8 ± 0.3 13.6 ± 0.6 15.5 ± 1.2 13.0 ± 0.4 13.8 ± 0.6 13.6 ± 0.4 Week 14 16.6 ± 0.4 14.0 ± 0.3* 15.2 ± 0.6 16.0 ± 0.6 17.6 ± 0.6 17.2 ± 0.5
Creatinine (mg/dL) Day 4 0.43 ± 0.02 0.47 ± 0.02 0.47 ± 0.02 0.48 ± 0.01 0.47 ± 0.02 0.49 ± 0.01* Day 22 0.47 ± 0.02 0.46 ± 0.02 0.50 ± 0.02 0.56 ± 0.04 0.50 ± 0.00 0.49 ± 0.01 Week 14 0.58 ± 0.01 0.61 ± 0.04 0.55 ± 0.02 0.57 ± 0.02 0.57 ± 0.02 0.59 ± 0.02
Total protein (g/dL) Day 4 5.1 ± 0.1 5.1 ± 0.1 5.2 ± 0.1 5.3 ± 0.1* 5.4 ± 0.1** 5.4 ± 0.1** Day 22 6.3 ± 0.1 6.2 ± 0.0 6.9 ± 0.2* 6.4 ± 0.1 6.3 ± 0.1 6.3 ± 0.1 Week 14 6.6 ± 0.1 6.6 ± 0.0 6.5 ± 0.0 6.7 ± 0.1 6.7 ± 0.1 6.7 ± 0.1
Albumin (g/dL) Day 4 3.8 ± 0.0 3.9 ± 0.1 3.9 ± 0.0 4.0 ± 0.1** 4.1 ± 0.0** 4.1 ± 0.1** Day 22 4.5 ± 0.1 4.5 ± 0.0 5.0 ± 0.1** 4.6 ± 0.0 4.5 ± 0.1 4.7 ± 0.0 Week 14 4.6 ± 0.1 4.6 ± 0.0 4.6 ± 0.0 4.7 ± 0.0* 4.8 ± 0.0* 4.8 ± 0.0*
31 p-tert-Butylcatechol, NTP TOX 70
TABLE 4 Selected Hematology and Clinical Chemistry Data for Rats in the 14-Week Feed Study of p-tert-Butylcatechol
0 ppm 781 ppm 1,562 ppm 3,125 ppm 6,250 ppm 12,500 ppm
Male (continued)
Clinical Chemistry (continued)
n 10 10 10 10 10 10
Alanine aminotransferase (IU/L) Day 4 79 ± 2 85 ± 2 87 ± 5 86 ± 3 94 ± 5** 94 ± 4** Day 22 59 ± 2 62 ± 1 51 ± 4 68 ± 2* 75 ± 3** 79 ± 2** Week 14 95 ± 5 79 ± 4* 76 ± 2** 85 ± 7* 78 ± 6* 78 ± 7**
Alkaline phosphatase (IU/L) Day 4 878 ± 37 815 ± 17 832 ± 21 821 ± 15 749 ± 18** 671 ± 13** Day 22 583 ± 16 558 ± 13 543 ± 30 591 ± 13 579 ± 13 574 ± 11 Week 14 220 ± 14 238 ± 9 250 ± 8 249 ± 7 281 ± 8** 275 ± 9**
Bile salts (µmol/L) Day 4 25.1 ± 2.3 26.8 ± 3.1 41.7 ± 2.6** 30.5 ± 3.5* 34.1 ± 2.5* 56.3 ± 3.8** Day 22 39.7 ± 4.4 33.9 ± 6.0 29.2 ± 3.8 29.3 ± 1.5 34.2 ± 3.1 53.7 ± 4.2 Week 14 20.1 ± 1.1 17.6 ± 1.3 19.1 ± 1.9 17.2 ± 1.4 15.7 ± 0.7 21.8 ± 2.1
Female
Hematology
n Day 4 10 10 10 10 10 10 Day 22 9 8 7 8 9 8 Week 14 9 10 10 9 9 10
Hematocrit (%) Day 4 37.1 ± 0.3 37.4 ± 0.5 37.6 ± 0.4 38.2 ± 0.4 39.2 ± 0.3** 42.2 ± 0.7** Day 22 43.1 ± 0.4 43.0 ± 0.4 44.3 ± 0.7 43.8 ± 0.5 43.1 ± 0.6 44.4 ± 0.4 Week 14 45.0 ± 0.4 45.8 ± 0.4 46.1 ± 0.6 44.7 ± 0.5 45.7 ± 0.4 45.9 ± 0.5
Hemoglobin (g/dL) Day 4 12.2 ± 0.1 12.4 ± 0.1 12.4 ± 0.1 12.6 ± 0.1 13.1 ± 0.1** 14.1 ± 0.2** Day 22 14.6 ± 0.1 14.6 ± 0.1 14.9 ± 0.2 14.7 ± 0.2 14.7 ± 0.2 14.9 ± 0.1 Week 14 14.7 ± 0.1 14.9 ± 0.2 15.0 ± 0.1 14.6 ± 0.1 14.8 ± 0.1 15.0 ± 0.1
Erythrocytes (106/µL) Day 4 6.33 ± 0.07 6.34 ± 0.08 6.38 ± 0.07 6.50 ± 0.07 6.74 ± 0.07** 7.32 ± 0.11** Day 22 7.34 ± 0.08 7.31 ± 0.07 7.65 ± 0.15 7.53 ± 0.09 7.48 ± 0.09 7.77 ± 0.07** Week 14 8.17 ± 0.07 8.32 ± 0.05 8.37 ± 0.10 8.11 ± 0.08 8.27 ± 0.07 8.34 ± 0.08
Mean cell volume (fL) Day 4 58.6 ± 0.5 59.0 ± 0.1 59.0 ± 0.3 58.7 ± 0.3 58.2 ± 0.3 57.6 ± 0.2* Day 22 58.7 ± 0.2 58.8 ± 0.3 57.9 ± 0.3 58.3 ± 0.3 57.6 ± 0.3* 57.1 ± 0.2** Week 14 55.1 ± 0.2 55.1 ± 0.2 55.0 ± 0.1 55.1 ± 0.2 55.2 ± 0.2 55.1 ± 0.1
Mean cell hemoglobin (pg) Day 4 19.3 ± 0.1 19.5 ± 0.1 19.5 ± 0.1 19.4 ± 0.1 19.4 ± 0.1 19.3 ± 0.1 Day 22 19.9 ± 0.1 20.0 ± 0.1 19.5 ± 0.2 19.6 ± 0.1 19.7 ± 0.1 19.2 ± 0.1** Week 14 18.1 ± 0.1 17.9 ± 0.2 17.9 ± 0.1 18.0 ± 0.1 17.8 ± 0.1 18.0 ± 0.1
32 p-tert-Butylcatechol, NTP TOX 70
TABLE 4 Selected Hematology and Clinical Chemistry Data for Rats in the 14-Week Feed Study of p-tert-Butylcatechol
0 ppm 781 ppm 1,562 ppm 3,125 ppm 6,250 ppm 12,500 ppm
Female (continued)
Hematology (continued)
n Day 4 10 10 10 10 10 10 Day 22 9 8 7 8 9 8 Week 14 9 10 10 9 9 10
Platelets (103/µL) Day 4 925.3 ± 6.7 912.4 ± 19.1 950.3 ± 18.2 923.7 ± 20.1 972.2 ± 17.8 1,119.7 ± 27.2** Day 22 869.6 ± 20.3 869.1 ± 16.1 806.0 ± 50.7 846.4 ± 28.8 907.3 ± 16.0 901.5 ± 23.7 Week 14 709.7 ± 12.1 707.9 ± 14.8 725.3 ± 8.7 674.3 ± 10.2 688.2 ± 13.9 716.5 ± 12.7
Clinical Chemistry
n Day 4 10 10 9 10 10 10 Day 22 10 10 10 10 10 10 Week 14 10 10 10 10 9 10
Urea nitrogen (mg/dL) Day 4 10.0 ± 0.3 11.1 ± 0.5 12.8 ± 0.7** 11.9 ± 0.4** 12.1 ± 0.4** 12.4 ± 0.3** Day 22 13.5 ± 0.6 15.9 ± 1.1 15.3 ± 0.7 14.1 ± 0.3 14.9 ± 0.8 15.0 ± 0.6 Week 14 16.5 ± 0.3 17.1 ± 0.6 18.0 ± 0.5 14.7 ± 0.6 16.7 ± 0.5 17.9 ± 0.9
Creatinine (mg/dL) b Day 4 0.40 ± 0.00 0.40 ± 0.00 0.42 ± 0.01 0.41 ± 0.01 0.40 ± 0.00 0.41 ± 0.01 Day 22 0.49 ± 0.01 0.49 ± 0.02 0.45 ± 0.02 0.47 ± 0.02 0.47 ± 0.02 0.51 ± 0.01 Week 14 0.59 ± 0.01 0.62 ± 0.01 0.59 ± 0.01 0.59 ± 0.01 0.57 ± 0.02 0.59 ± 0.01
Total protein (g/dL) Day 4 5.3 ± 0.1 5.4 ± 0.1 5.4 ± 0.1 5.3 ± 0.1 5.3 ± 0.1 5.1 ± 0.1 Day 22 5.9 ± 0.1 6.0 ± 0.0 6.1 ± 0.1 5.9 ± 0.1 6.0 ± 0.1 5.9 ± 0.1 Week 14 6.4 ± 0.1 7.1 ± 0.1 7.0 ± 0.1 6.3 ± 0.1 6.2 ± 0.1 6.3 ± 0.1
Albumin (g/dL) Day 4 4.0 ± 0.0 4.1 ± 0.0 4.1 ± 0.0 4.1 ± 0.1 4.1 ± 0.0 4.0 ± 0.1 Day 22 4.5 ± 0.0 4.5 ± 0.0 4.6 ± 0.0 4.5 ± 0.1 4.5 ± 0.0 4.5 ± 0.1 Week 14 4.8 ± 0.0 5.2 ± 0.1 5.1 ± 0.1 4.7 ± 0.1 4.5 ± 0.1 4.6 ± 0.0
Alanine aminotransferase (IU/L) Day 4 64 ± 1 71 ± 2** 71 ± 1** 77 ± 3** 80 ± 3** 85 ± 4** Day 22 47 ± 2 53 ± 3 55 ± 4 51 ± 2 55 ± 2* 63 ± 3** Week 14 86 ± 6 69 ± 5 69 ± 3 72 ± 2 72 ± 2 70 ± 3
Alkaline phosphatase (IU/L) Day 4 688 ± 9 702 ± 20 683 ± 12 689 ± 12 658 ± 13 573 ± 9** Day 22 454 ± 5 463 ± 8 448 ± 8 446 ± 6 466 ± 8 466 ± 11 Week 14 230 ± 4 215 ± 7 232 ± 4 244 ± 7 251 ± 6* 240 ± 4
Bile salts (µmol/L) Day 4 32.8 ± 3.2 32.2 ± 4.3 26.8 ± 3.9 29.7 ± 1.4 37.0 ± 2.2 51.5 ± 4.1** Day 22 28.9 ± 2.7 23.3 ± 2.6 22.3 ± 2.6 33.7 ± 2.7 35.5 ± 2.6 48.4 ± 3.6** Week 14 28.8 ± 1.7 25.9 ± 2.6 27.4 ± 1.8 24.3 ± 1.8 25.3 ± 2.9 36.2 ± 3.1
* Significantly different (P#0.05) from the control group by Dunn’s or Shirley’s test ** P#0.01 a
Mean ± standard error. Statistical tests were performed on unrounded data.b
n=10

33 p-tert-Butylcatechol, NTP TOX 70
Sporadic differences occurred in other clinical chemistry parameters at varying time points; these differences, which
generally did not demonstrate a treatment relationship and/or were inconsistent between males and females, were not
considered to be toxicologically relevant.
Organ weight differences in exposed rats reflected decreases in body weights (Table C2). The absolute left cauda
epididymis, epididymis, and testis weights, number of spermatid heads per testis, and epididymal sperm motility of
males in the 12,500 ppm group were significantly less than those of the controls (Table D1). The numbers of cycling
females and females with regular estrous cycles were decreased in the 6,250 and 12,500 ppm groups (Table D2).
Exposed groups of females had significantly fewer estrous cycles than did the controls. Estrous cycle length
increased with increasing exposure concentration; females in the 6,250 and 12,500 ppm groups had significantly
longer cycles and spent more time in diestrus and less time in proestrus, estrus, and metestrus than did the controls.
There were no exposure-related gross lesions. The incidences of hyperkeratosis of the forestomach epithelium were
significantly increased in males and females in all exposed groups (Tables 5, A1, and A2). Forestomach epithelial
hyperplasia also occurred in males exposed to 1,562 ppm or greater and females exposed to 3,125 ppm or greater,
and the incidences in these groups were significantly increased except for the 1,562 ppm group. The severity of the
forestomach lesions generally increased with increasing exposure concentration. Morphologically, forestomach
hyperplasia consisted of thickening of the epithelium due to increased numbers of cell layers. Hyperkeratosis was a
thickening of the keratin layer overlying the epithelium (Plates 1 and 2). All 6,250 and 12,500 ppm males had
minimal cytoplasmic alteration in the liver. Cytoplasmic alteration of the liver was a tinctorial change characterized
by pallor of centrilobular hepatocytes.

34
c
p-tert-Butylcatechol, NTP TOX 70
TABLE 5 Incidences of Selected Nonneoplastic Lesions in Rats in the 14-Week Feed Study of p-tert-Butylcatechol
0 ppm 781 ppm 1,562 ppm 3,125 ppm 6,250 ppm 12,500 ppm
Male
Forestomacha
Epithelium, Hyperkeratosisb
10 0
10 4* (1.0)
c 10 8** (2.0)
10 9** (1.8)
10 10** (2.2)
10 10** (3.1)
Epithelium, Hyperplasia 0 0 2 (1.0) 8** (1.8) 8** (2.0) 10** (2.6)
Liver 10 10 10 10 10 10 Cytoplasmic Alteration 0 0 0 0 10** (1.0) 10** (1.0)
Female
Forestomach 10 10 10 10 10 10 Epithelium, Hyperkeratosis 0 6** (1.0) 7** (1.4) 9** (1.6) 10** (2.0) 10** (2.2) Epithelium, Hyperplasia 0 0 0 5* (1.6) 8** (1.8) 10** (2.2)
* Significantly different (P#0.05) from the control group by the Fisher exact test ** P#0.01 a
Number of animals with tissue examined microscopicallyb
Number of animals with lesion Average severity grade of lesions in affected animals: 1=minimal, 2=mild, 3=moderate, 4=marked
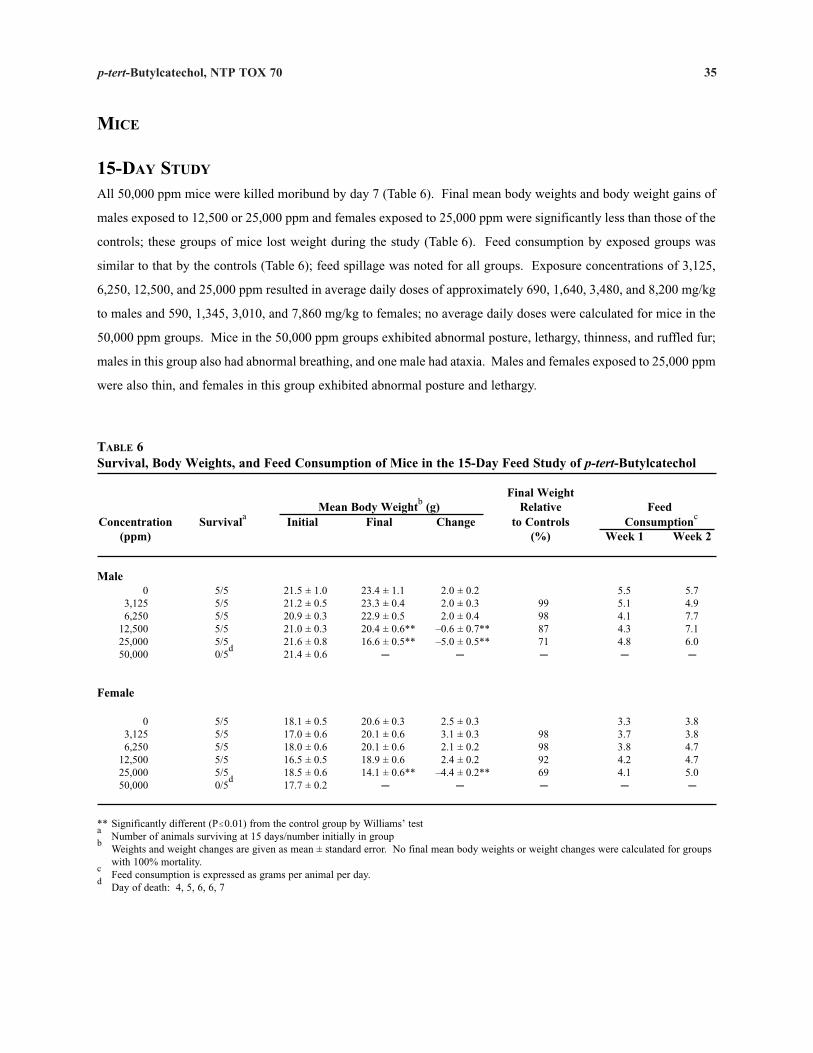
35 p-tert-Butylcatechol, NTP TOX 70
MICE
15-DAY STUDY
All 50,000 ppm mice were killed moribund by day 7 (Table 6). Final mean body weights and body weight gains of
males exposed to 12,500 or 25,000 ppm and females exposed to 25,000 ppm were significantly less than those of the
controls; these groups of mice lost weight during the study (Table 6). Feed consumption by exposed groups was
similar to that by the controls (Table 6); feed spillage was noted for all groups. Exposure concentrations of 3,125,
6,250, 12,500, and 25,000 ppm resulted in average daily doses of approximately 690, 1,640, 3,480, and 8,200 mg/kg
to males and 590, 1,345, 3,010, and 7,860 mg/kg to females; no average daily doses were calculated for mice in the
50,000 ppm groups. Mice in the 50,000 ppm groups exhibited abnormal posture, lethargy, thinness, and ruffled fur;
males in this group also had abnormal breathing, and one male had ataxia. Males and females exposed to 25,000 ppm
were also thin, and females in this group exhibited abnormal posture and lethargy.
TABLE 6 Survival, Body Weights, and Feed Consumption of Mice in the 15-Day Feed Study of p-tert-Butylcatechol
Final Weight Mean Body Weightb (g) Relative Feed
Concentration Survivala Initial Final Change to Controls Consumptionc
(ppm) (%) Week 1 Week 2
Male 0 5/5 21.5 ± 1.0 23.4 ± 1.1 2.0 ± 0.2 5.5 5.7
3,125 5/5 21.2 ± 0.5 23.3 ± 0.4 2.0 ± 0.3 99 5.1 4.9 6,250 5/5 20.9 ± 0.3 22.9 ± 0.5 2.0 ± 0.4 98 4.1 7.7
12,500 5/5 21.0 ± 0.3 20.4 ± 0.6** –0.6 ± 0.7** 87 4.3 7.1 25,000 50,000
5/5 0/5
d 21.6 ± 0.8 21.4 ± 0.6
16.6 ± 0.5** C
–5.0 ± 0.5** C
71 C
4.8 C
6.0 C
Female
0 5/5 18.1 ± 0.5 20.6 ± 0.3 2.5 ± 0.3 3.3 3.8 3,125 5/5 17.0 ± 0.6 20.1 ± 0.6 3.1 ± 0.3 98 3.7 3.8 6,250 5/5 18.0 ± 0.6 20.1 ± 0.6 2.1 ± 0.2 98 3.8 4.7
12,500 5/5 16.5 ± 0.5 18.9 ± 0.6 2.4 ± 0.2 92 4.2 4.7 25,000 50,000
5/5 0/5
d 18.5 ± 0.6 17.7 ± 0.2
14.1 ± 0.6** C
–4.4 ± 0.2** C
69 C
4.1 C
5.0 C
** Significantly different (P#0.01) from the control group by Williams’ test a
Number of animals surviving at 15 days/number initially in groupb
Weights and weight changes are given as mean ± standard error. No final mean body weights or weight changes were calculated for groups with 100% mortality. Feed consumption is expressed as grams per animal per day.
d Day of death: 4, 5, 6, 6, 7
c

36 p-tert-Butylcatechol, NTP TOX 70
The absolute and relative thymus weights of 25,000 ppm male and female mice were significantly less than those of
the controls (Table C3). Other organ weight changes reflected the decreased body weights of exposed mice.
At necropsy, all mice in the 25,000 and 50,000 ppm groups were noted to have thin carcasses. No exposure-related
lesions were observed microscopically in the groups examined (0, 25,000, and 50,000 ppm). Based on the body
weight effects in the 25,000 ppm groups and mortality in the 50,000 ppm groups, the highest exposure concentration
selected for the 14-week study was 12,500 ppm.

37 p-tert-Butylcatechol, NTP TOX 70
14-WEEK STUDY
All mice survived to the end of the study (Table 7). Final mean body weights and body weight gains of 12,500 ppm
males and 6,250 and 12,500 ppm females, as well as the mean body weight gains of 3,125 and 6,250 ppm males, were
significantly less than those of the controls (Table 7 and Figure 2). Feed consumption by exposed groups was similar
to that by the controls (Table 7). Exposure concentrations of 781, 1,562, 3,125, 6,250, and 12,500 ppm resulted in
average daily doses of approximately 150, 300, 635, 1,300, and 2,815 mg/kg to males and 135, 300, 610, 1,400, and
2,440 mg/kg to females. There were no clinical findings of toxicity.
No alterations in hematology data for mice were attributed to exposure to p-tert-butylcatechol (Table B2). Organ
weight differences in exposed mice reflected decreases in body weights (Table C4).
TABLE 7 Survival, Body Weights, and Feed Consumption of Mice in the 14-Week Feed Study of p-tert-Butylcatechol
Final Weight Mean Body Weightb (g) Relative Feed
Concentration Survivala Initial Final Change to Controls Consumptionc
(ppm) (%) Week 1 Week 14
Male 0 10/10 21.3 ± 0.3 33.0 ± 0.5 11.7 ± 0.4 3.7 5.8
781 10/10 21.3 ± 0.4 32.2 ± 0.8 10.9 ± 0.6 98 5.1 6.0 1,562 10/10 21.8 ± 0.5 33.7 ± 0.9 11.9 ± 0.6 102 4.1 5.6 3,125 10/10 21.4 ± 0.3 30.6 ± 1.1 9.1 ± 1.1** 93 3.6 6.1 6,250 10/10 22.1 ± 0.4 31.1 ± 0.6 9.0 ± 0.3** 94 4.2 6.1
12,500 10/10 21.3 ± 0.4 26.6 ± 0.5** 5.3 ± 0.3** 81 4.2 7.7
Female
0 10/10 17.2 ± 0.4 25.3 ± 0.7 8.1 ± 0.4 2.0 5.4 781 10/10 17.7 ± 0.2 27.3 ± 0.5 9.6 ± 0.5 108 2.9 4.9
1,562 10/10 17.0 ± 0.3 25.9 ± 0.5 8.8 ± 0.4 102 2.8 6.4 3,125 10/10 17.2 ± 0.3 24.2 ± 0.4 7.0 ± 0.3 96 2.8 5.0 6,250 10/10 17.3 ± 0.3 23.6 ± 0.4* 6.4 ± 0.3** 94 3.0 6.3
12,500 10/10 17.7 ± 0.4 19.7 ± 0.2** 2.0 ± 0.3** 78 2.0 5.6
* Significantly different (P#0.05) from the control group by Williams’ test ** P#0.01 a
Number of animals surviving at 14 weeks/number initially in groupb
Weights and weight changes are given as mean ± standard error Feed consumption is expressed as grams per animal per day.
c
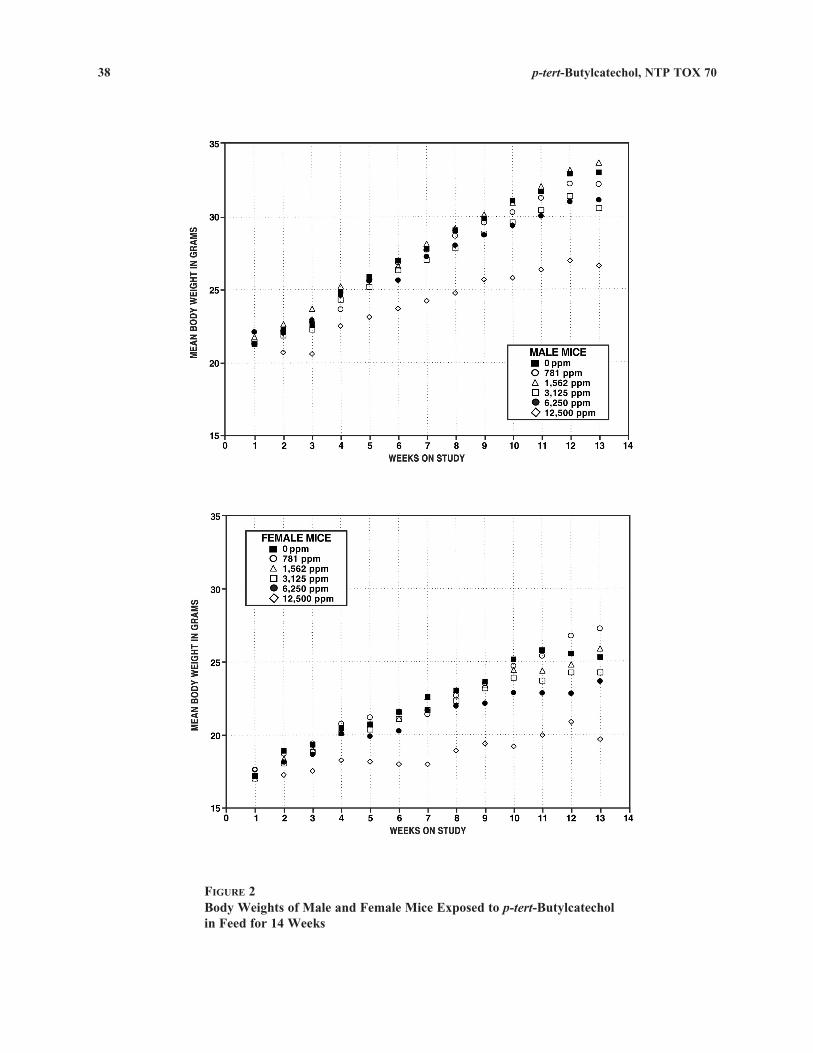
38 p-tert-Butylcatechol, NTP TOX 70
FIGURE 2 Body Weights of Male and Female Mice Exposed to p-tert-Butylcatechol in Feed for 14 Weeks

39
c
p-tert-Butylcatechol, NTP TOX 70
There were no biologically significant differences in reproductive tissue parameters between exposed and control
male mice (Table D3). Females in the 12,500 ppm group had a significantly longer estrous cycle than did the controls
(Table D4).
There were no exposure-related gross lesions. Forestomach epithelial hyperplasia occurred in males and females
exposed to 3,125 ppm or greater, and the incidences in 12,500 ppm males and females and females in the 6,250 ppm
group were significantly greater than those in the controls (Tables 8, A3, and A4). The incidence of hyperkeratosis
of the forestomach epithelium was significantly increased in 12,500 ppm females; hyperkeratosis was also observed
in males in the 12,500 ppm group and females in the 6,250 ppm group. The severity of the forestomach lesions was
minimal to mild. Histologically, forestomach hyperplasia and hyperkeratosis in mice was seen as an increased
thickness of the epithelium, similar to the lesions in rats (Plates 3 and 4).
TABLE 8 Incidences of Selected Nonneoplastic Lesions in Mice in the 14-Week Feed Study of p-tert-Butylcatechol
0 ppm 781 ppm 1,562 ppm 3,125 ppm 6,250 ppm 12,500 ppm
Male
Forestomacha
Epithelium, Hyperplasiab
Epithelium, Hyperkeratosis
10 0 0
10 0 0
10 0 0
10 3 0
(1.0)c
10 3 0
(1.0) 10 6** (1.3) 3 (1.3)
Female
Forestomach Epithelium, Hyperplasia Epithelium, Hyperkeratosis
10 0 0
10 0 0
9 0 0
10 2 0
(1.0) 10
4* 2
(1.3) (1.5)
10 7** (1.7) 6** (1.3)
* Significantly different (P#0.05) from the control group by the Fisher exact test ** P#0.01 a
Number of animals with forestomach examined microscopicallyb
Number of animals with lesion Average severity grade of lesions in affected animals: 1=minimal, 2=mild, 3=moderate, 4=marked

40 p-tert-Butylcatechol, NTP TOX 70
ABSORPTION, DISTRIBUTION, METABOLISM, AND EXCRETION STUDIES
The absorption, distribution, metabolism, and excretion of p-tert-butylcatechol following intravenous injection,
gavage dosing, or dermal application were determined in male F344/N rats and B6C3F1 mice (Appendix G). The
absorption of [14C]-p-tert-butylcatechol following gavage dosing or dermal application was high. The percent
absorption following dermal application increased with increasing dose. Peak concentrations of [14C]-p-tert
butylcatechol equivalents in plasma were reached 1 hour after gavage dosing (200 mg/kg) and 2 hours after dermal
application (60 mg/kg); no parent compound was detected in the plasma extracts. Regardless of route of
administration, p-tert-butylcatechol-derived radioactivity was readily excreted in the urine and was markedly
nonpersistent in the tissues. p-tert-Butylcatechol was excreted as p-tert-butylcatechol sulfate and other polar
metabolites that included predominately sulfate conjugates; it was not excreted as the parent compound. One
metabolite was determined to be an O-methyl-ON-sulfate of p-tert-butylcatechol.
GENETIC TOXICOLOGY
p-tert-Butylcatechol (10 to 1,000 µg/plate) was tested for mutagenicity in Salmonella typhimurium strains TA97,
TA98, TA100, TA102, TA104, and TA1535, with and without rat and hamster liver S9 metabolic activation enzymes;
no mutagenicity was detected in any strain under any of the test conditions (Table E1). p-tert-Butylcatechol induced
micronuclei in bone marrow cells of rats in a trial with doses of 125 and 250 mg/kg (the highest dose, 500 mg/kg,
was lethal) administered by intraperitoneal injection; however, results of a second trial with doses of 125 to
300 mg/kg were negative (Table E2). Due to the lack of reproducibility of the initial response, the overall results of
this test were judged to be negative. p-tert-Butylcatechol administered in feed at concentrations up to 12,500 ppm
for 14 weeks did not increase the frequency of micronucleated normochromatic erythrocytes in the peripheral blood
of male or female mice (Table E3). In addition, no significant alteration in the percentage of polychromatic
erythrocytes was seen in dosed mice, indicating a lack of bone marrow toxicity.
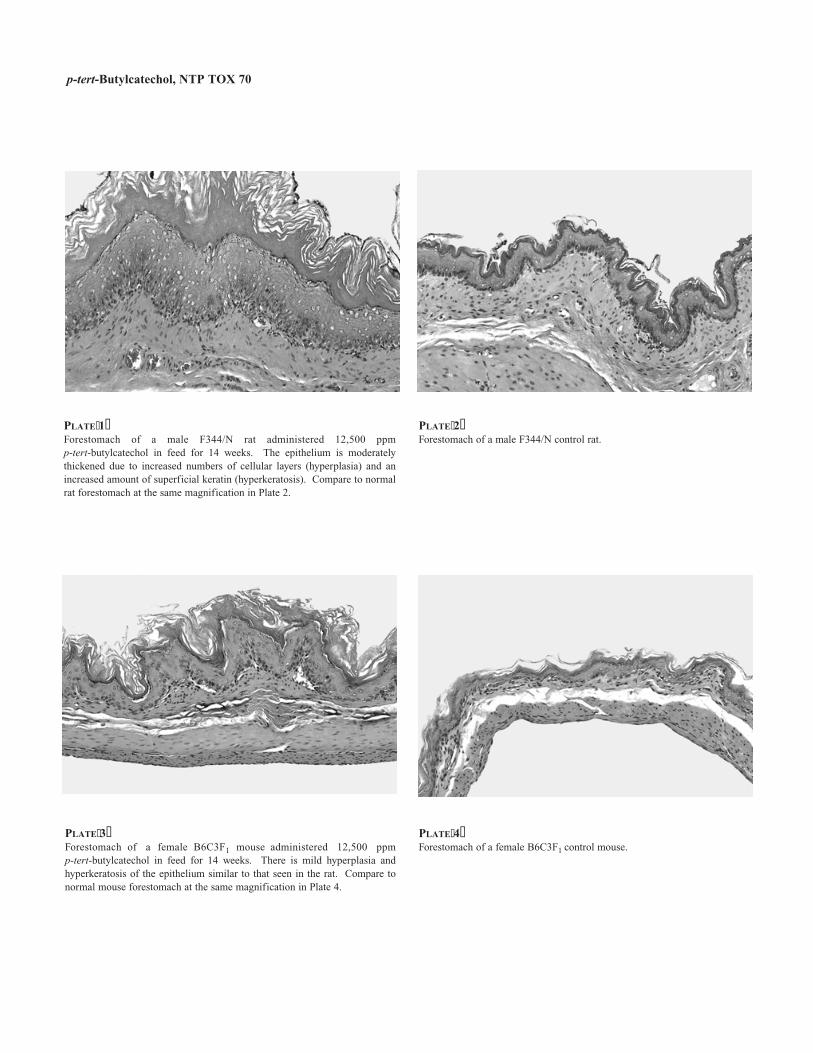
p-tert-Butylcatechol, NTP TOX 70
PLATE 1 Forestomach of a male F344/N rat administered 12,500 ppmp-tert-butylcatechol in feed for 14 weeks. The epithelium is moderatelythickened due to increased numbers of cellular layers (hyperplasia) and an increased amount of superficial keratin (hyperkeratosis). Compare to normal rat forestomach at the same magnification in Plate 2.
PLATE 2 Forestomach of a male F344/N control rat.
PLATE 3 Forestomach of a female B6C3F1 mouse administered 12,500 ppm p-tert-butylcatechol in feed for 14 weeks. There is mild hyperplasia and hyperkeratosis of the epithelium similar to that seen in the rat. Compare to normal mouse forestomach at the same magnification in Plate 4.
PLATE 4 Forestomach of a female B6C3F1 control mouse.

OH
C(CH3)3
OCH3
41
The catechol compounds have been used
stabilizer, and polymerization inhibitor for
p-tert-Butylcatechol was nominated for stu
considering its use as a replacement antio
hydroxytoluene (BHT) in foods (Figure 3).
Butylated Hydroxyanisole
Figure 3 Structures of Butylated Hydroxy
The Joint Food and Agriculture Organiza
established acceptable daily intake guide
0.125 mg/kg for BHT). Maximum BHA an
breakfast cereals, potato shreds, and poultry
In a 2-year study in which F344 rats were
or 2% (1,250 to 20,000 ppm, estimated dai
observed in groups exposed to 0.25% or gr
DISCUSSION
C(CH3)3
OH
OH
OH
(CH3)3C C(CH3)3
CH3
as antioxidants in food. p-tert-Butylcatechol is used as an antioxidant,
styrene, butadiene, neoprene, and other olefins and reactive monomers.
dy, in part, because the U.S. Food and Drug Administration (FDA) was
xidant for the catechols butylated hydroxyanisole (BHA) and butylated
Butylated Hydroxytoluene p-tert-Butylcatechol
anisole, Butylated Hydroxytoluene, and p-tert-Butylcatechol
tion/World Health Organization Expert Committee on Food Additives
lines for antioxidants (up to 0.5 mg/kg body weight for BHA; up to
d BHT usage levels permitted by the FDA for a variety of foods, such as
products, range from 50 to 1,000 ppm (Shahidi and Wanasundara, 1992).
exposed to BHA in feed at concentrations of 0.125%, 0.25%, 0.5%, 1%,
ly dose 55 to 1,322 mg/kg), proliferative lesions of the forestomach were
eater (Ito et al., 1986). Forestomach papillomas occurred in the 1% and

42 p-tert-Butylcatechol, NTP TOX 70
2% groups, and squamous cell carcinoma of the forestomach occurred in the 2% group. B6C3F1 mice exposed to
0.5% or 1% BHA for 2 years had hyperplasia of the forestomach but no significantly increased incidences of
forestomach papilloma or carcinoma; forestomach papilloma did occur in one 1% mouse (Ito et al., 1986). BHA had
no toxicity in the glandular stomach.
Catechol has also been found to induce forestomach papillomas and glandular stomach adenocarcinomas (Tanaka
et al., 1995). BHT administered in feed for 2 years was not carcinogenic in Wistar rats (Hirose et al., 1981) or
B6C3F1 mice (Shirai et al., 1982). The relevance of the forestomach tumors in the BHA rodent studies to humans
has not been established. The FDA continues to maintain BHA and BHT on the Generally Recognized As Safe list
of chemicals (21 CFR 182.3169, 182.3173).
The current studies were performed to determine the toxicity of p-tert-butylcatechol in F344/N rats and B6C3F1 mice.
The chemical was administered in feed to compare its toxicity to that of similar antioxidants, for which the primary
target organ of toxicity after administration in feed is the rodent forestomach. Absorption, distribution, metabolism,
and excretion studies determined that p-tert-butylcatechol was readily absorbed when administered orally or
dermally. p-tert-Butylcatechol is not expected to bioaccumulate; only approximately 0.2% of the administered dose
remained in the tissues 3 days after dosing. Metabolism led to conjugation and methylation products as would be
expected for a catechol derivative. There was no evidence in the metabolites for the formation of reactive
intermediates.
In the 15-day studies, rats and mice received p-tert-butylcatechol in the feed at concentrations of 3,125, 6,250,
12,500, 25,000, or 50,000 ppm. All 50,000 ppm rats and mice died before the end of the studies. The final mean
body weights of 25,000 ppm rats and mice were 29% to 38% less than those of the controls. No exposure-related
microscopic lesions were observed in the rat or mouse groups examined (0, 25,000, and 50,000 ppm). The decreased
body weights or mortalities in the 25,000 and 50,000 ppm groups were the primary factors in selecting exposure
concentrations for the 14-week feed studies.
In the 14-week studies, rats and mice received 0, 781, 1,562, 3,125, 6,250, or 12,500 ppm p-tert-butylcatechol in
feed. The forestomach was examined histologically at all exposure concentrations. Hyperkeratosis of the
forestomach occurred in all exposed groups of rats, and rats exposed to 3,125 ppm or greater also had significantly
increased incidences of forestomach hyperplasia. In mice, forestomach hyperkeratosis occurred in the 12,500 ppm
males and females and in 6,250 ppm females, and forestomach hyperplasia occurred in groups exposed to 3,125 ppm
or greater. The forestomach lesions were more severe in rats than in mice.

43 p-tert-Butylcatechol, NTP TOX 70
Forestomach hyperplasia and hyperkeratosis are common and nonspecific treatment-related lesions in rodents. A
basic distinction is whether the response is regenerative (reparative) following epithelial damage or mitogenic. The
absence of associated ulceration and inflammation would suggest a primary proliferative effect as opposed to an
irritant effect. This would be consistent with the known hyperplasiogenic effect of analogs such as BHA and BHT
(Ito et al., 1986). The hyperplasia in rats and mice exposed to p-tert-butylcatechol had no atypical histologic features
that were suggestive of a preneoplastic lesion.
In the 14-week studies, complete histopathologic examinations were conducted only on the 0 and 12,500 ppm
groups; the only other exposure-related lesion observed was cytoplasmic alteration in the liver of male rats in the
12,500 ppm group. The livers of male rats in the lower exposure groups were also examined; the no-observed
adverse-effect level for cytoplasmic alteration was 3,125 ppm.
In rats in the 14-week study, hematocrit values, hemoglobin concentrations, and bile salt concentrations were
generally elevated in the 6,250 and 12,500 ppm groups on day 4 and in the 12,500 ppm groups on day 22 but were
not affected at week 14. In mice, there were no treatment-related changes in hematology parameters.
Sperm motility and vaginal cytology evaluations were conducted in rats and mice in the 0, 3,125, 6,250, and
12,500 ppm groups at the end of the 14-week studies. In 12,500 ppm male rats, absolute left cauda epididymis,
epididymis, and testis weights were decreased by 15%, 10%, and 9%, respectively, compared to the controls. The
epididymal sperm motility and number of spermatid heads per testis were also decreased by 7% and 17%,
respectively. Although necropsy body weights were decreased in the exposed groups (7%, 13%, and 23%), these
decreases were no greater than those in Sprague-Dawley rats in feed restriction studies in which reproductive tissue
indices were largely unchanged (Chapin et al., 1993a). These results suggest that p-tert-butylcatechol may have a
mild effect on sperm parameters in the male rat. p-tert-Butylcatechol had no adverse effects on sperm motility of
mice in the 14-week study.
In the 14-week study, female rats exposed to 6,250 or 12,500 ppm spent more time in diestrus and less time in
proestrus, estrus, and metestrus than did the control females; the cycle lengths of these two groups were increased
31% and 47%, respectively, relative to the controls. The numbers of estrous cycles were decreased by 28%, 44%,
and 44% in the 3,125, 6,250, and 12,500 ppm groups, respectively, and the numbers of cycling females were
decreased by 50% in the 6,250 ppm group and 60% in the 12,500 ppm group. Decreases in body weights of the
exposed groups (5%, 8%, and 12%) relative to the controls may explain some of these differences in reproductive
parameters; however, the changes are greater than those which would be expected from decreased body weights alone
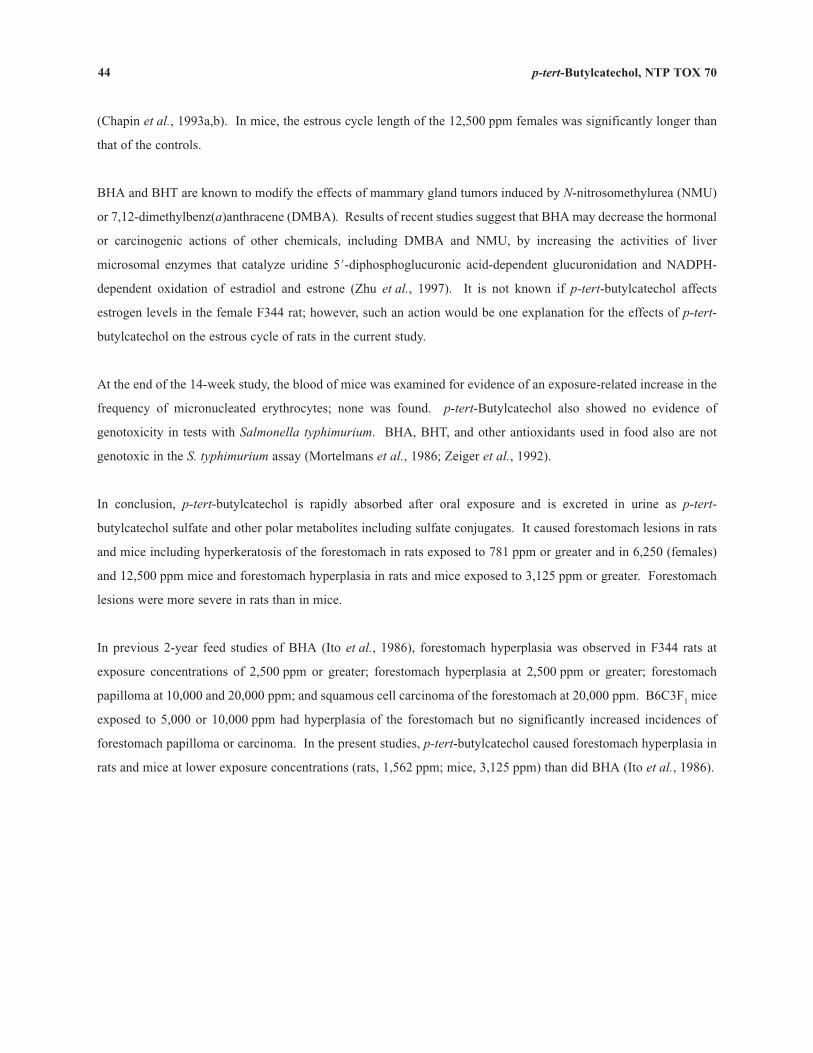
44 p-tert-Butylcatechol, NTP TOX 70
(Chapin et al., 1993a,b). In mice, the estrous cycle length of the 12,500 ppm females was significantly longer than
that of the controls.
BHA and BHT are known to modify the effects of mammary gland tumors induced by N-nitrosomethylurea (NMU)
or 7,12-dimethylbenz(a)anthracene (DMBA). Results of recent studies suggest that BHA may decrease the hormonal
or carcinogenic actions of other chemicals, including DMBA and NMU, by increasing the activities of liver
microsomal enzymes that catalyze uridine 5N-diphosphoglucuronic acid-dependent glucuronidation and NADPH
dependent oxidation of estradiol and estrone (Zhu et al., 1997). It is not known if p-tert-butylcatechol affects
estrogen levels in the female F344 rat; however, such an action would be one explanation for the effects of p-tert
butylcatechol on the estrous cycle of rats in the current study.
At the end of the 14-week study, the blood of mice was examined for evidence of an exposure-related increase in the
frequency of micronucleated erythrocytes; none was found. p-tert-Butylcatechol also showed no evidence of
genotoxicity in tests with Salmonella typhimurium. BHA, BHT, and other antioxidants used in food also are not
genotoxic in the S. typhimurium assay (Mortelmans et al., 1986; Zeiger et al., 1992).
In conclusion, p-tert-butylcatechol is rapidly absorbed after oral exposure and is excreted in urine as p-tert
butylcatechol sulfate and other polar metabolites including sulfate conjugates. It caused forestomach lesions in rats
and mice including hyperkeratosis of the forestomach in rats exposed to 781 ppm or greater and in 6,250 (females)
and 12,500 ppm mice and forestomach hyperplasia in rats and mice exposed to 3,125 ppm or greater. Forestomach
lesions were more severe in rats than in mice.
In previous 2-year feed studies of BHA (Ito et al., 1986), forestomach hyperplasia was observed in F344 rats at
exposure concentrations of 2,500 ppm or greater; forestomach hyperplasia at 2,500 ppm or greater; forestomach
papilloma at 10,000 and 20,000 ppm; and squamous cell carcinoma of the forestomach at 20,000 ppm. B6C3F1 mice
exposed to 5,000 or 10,000 ppm had hyperplasia of the forestomach but no significantly increased incidences of
forestomach papilloma or carcinoma. In the present studies, p-tert-butylcatechol caused forestomach hyperplasia in
rats and mice at lower exposure concentrations (rats, 1,562 ppm; mice, 3,125 ppm) than did BHA (Ito et al., 1986).

45
The Aldrich Library of Infrared Spectra (1
Company, Inc., Milwaukee, WI.
American Conference of Governmental In
Limit Values for Chemical Substances and
Black, S.R., and Mathews, J.M. (2000).
Metab. Dispos. 28, 1-4.
Boorman, G.A., Montgomery, C.A., Jr.,
Quality assurance in pathology for rode
Milman and E.K. Weisburger, Eds.), pp. 3
Boorman, G.A., Hickman, R.L., Davis, G.
(1986). Serological titers to murine v
Mycoplasmal Infections in Rodents to
Hemisphere Publishing Corporation, Wash
Chapin, R.E., Gulati, D.K., Barnes, L.H.,
function in Sprague-Dawley rats. Fundam
Chapin, R.E., Gulati, D.K., Fail, P.A., H
Teague, J.L. (1993b). The effects of feed
Toxicol. 20, 15-22.
Chemical Marketing Reporter (1989). Jan
Code of Federal Regulations (CFR) 21, P
Code of Federal Regulations (CFR) 21, P
REFERENCES
981). Spectrum No. 662F. 3rd ed. (C. Pouchert, Ed.). Aldrich Chemical
dustrial Hygienists (ACGIH) (2001). 2001 TLVs7 and BEIs7. Threshold
Physical Agents and Biological Exposure Indices, p. 21. Cincinnati, OH.
Metabolism and disposition of 4-t-butylcatechol in rats and mice. Drug.
Eustis, S.L., Wolfe, M.J., McConnell, E.E., and Hardisty, J.F. (1985).
nt carcinogenicity studies. In Handbook of Carcinogen Testing (H.A.
45-357. Noyes Publications, Park Ridge, NJ.
W., Rhodes, L.S., White, N.W., Griffin, T.A., Mayo, J., and Hamm, T.E., Jr.
iruses in 90-day and 2-year studies. In Complications of Viral and
Toxicology Research and Testing (T.E. Hamm, Jr., Ed.), pp. 11-23.
ington, DC.
and Teague, J.L. (1993a). The effects of feed restriction on reproductive
. Appl. Toxicol. 20, 23-29.
ope, E., Russell, S.R., Heindel, J.J., George, J.D., Grizzle, T.B., and
restriction on reproductive function in Swiss CD-1 mice. Fundam. Appl.
uary 23, 1989. Schnell Publishing Company, New York.
art 58.
arts 182.3169 and 182.3173.
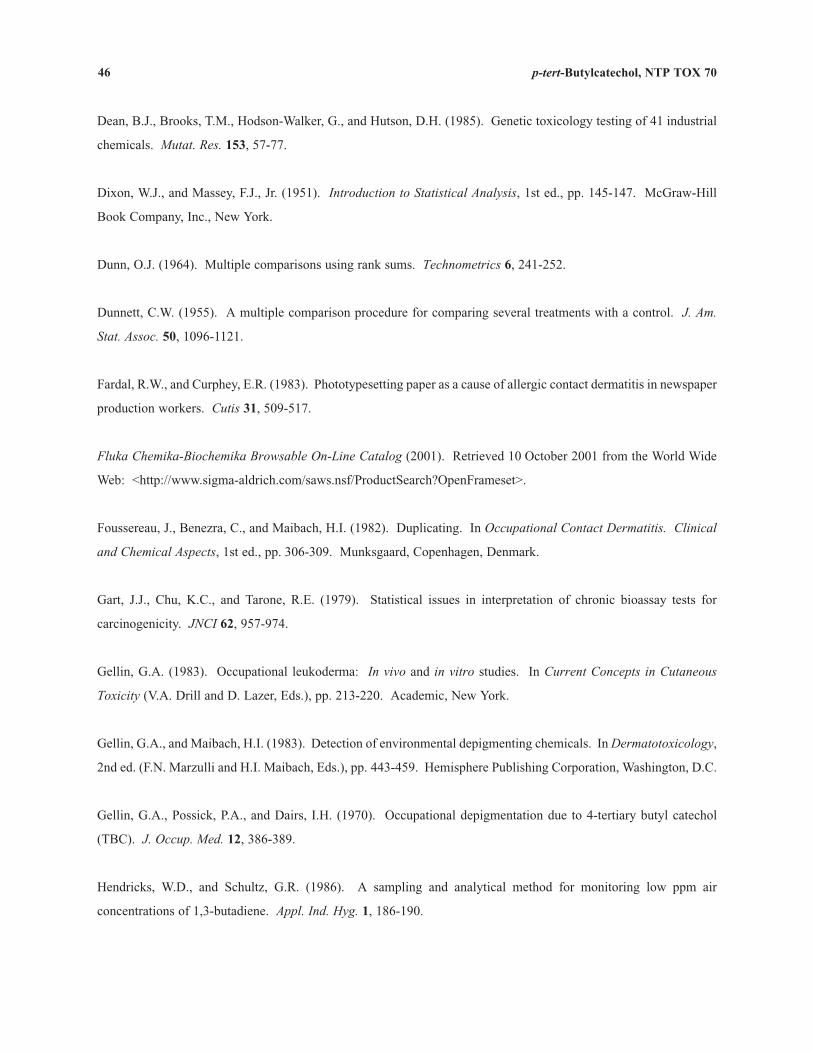
46 p-tert-Butylcatechol, NTP TOX 70
Dean, B.J., Brooks, T.M., Hodson-Walker, G., and Hutson, D.H. (1985). Genetic toxicology testing of 41 industrial
chemicals. Mutat. Res. 153, 57-77.
Dixon, W.J., and Massey, F.J., Jr. (1951). Introduction to Statistical Analysis, 1st ed., pp. 145-147. McGraw-Hill
Book Company, Inc., New York.
Dunn, O.J. (1964). Multiple comparisons using rank sums. Technometrics 6, 241-252.
Dunnett, C.W. (1955). A multiple comparison procedure for comparing several treatments with a control. J. Am.
Stat. Assoc. 50, 1096-1121.
Fardal, R.W., and Curphey, E.R. (1983). Phototypesetting paper as a cause of allergic contact dermatitis in newspaper
production workers. Cutis 31, 509-517.
Fluka Chemika-Biochemika Browsable On-Line Catalog (2001). Retrieved 10 October 2001 from the World Wide
Web: <http://www.sigma-aldrich.com/saws.nsf/ProductSearch?OpenFrameset>.
Foussereau, J., Benezra, C., and Maibach, H.I. (1982). Duplicating. In Occupational Contact Dermatitis. Clinical
and Chemical Aspects, 1st ed., pp. 306-309. Munksgaard, Copenhagen, Denmark.
Gart, J.J., Chu, K.C., and Tarone, R.E. (1979). Statistical issues in interpretation of chronic bioassay tests for
carcinogenicity. JNCI 62, 957-974.
Gellin, G.A. (1983). Occupational leukoderma: In vivo and in vitro studies. In Current Concepts in Cutaneous
Toxicity (V.A. Drill and D. Lazer, Eds.), pp. 213-220. Academic, New York.
Gellin, G.A., and Maibach, H.I. (1983). Detection of environmental depigmenting chemicals. In Dermatotoxicology,
2nd ed. (F.N. Marzulli and H.I. Maibach, Eds.), pp. 443-459. Hemisphere Publishing Corporation, Washington, D.C.
Gellin, G.A., Possick, P.A., and Dairs, I.H. (1970). Occupational depigmentation due to 4-tertiary butyl catechol
(TBC). J. Occup. Med. 12, 386-389.
Hendricks, W.D., and Schultz, G.R. (1986). A sampling and analytical method for monitoring low ppm air
concentrations of 1,3-butadiene. Appl. Ind. Hyg. 1, 186-190.

47 p-tert-Butylcatechol, NTP TOX 70
Hirosawa, I., Dodo, H., and Hara, I. (1982). An enzymatic approach to occupational leukomelanodermatosis due to
synthetic detergents. Ind. Health 20, 117-127.
Hirose, M., Shibata, M., Hagiwara, A., Imaida, K., and Ito, N. (1981). Chronic toxicity of butylated hydroxytoluene
in Wistar rats. Food Cosmet. Toxicol. 19, 147-151.
Hirose, M., Fukushima, S., Kurata, Y., Tsuda, H., Tatematsu, M., and Ito, N. (1988). Modification of N-methyl
NN-nitro-N-nitrosoguanidine-induced forestomach and glandular stomach carcinogenesis by phenolic antioxidants in
rats. Cancer Res. 48, 5310-5315.
Hirose, M., Yamaguchi, S., Fukushima, S., Hasegawa, R., Takahashi, S., and Ito, N. (1989). Promotion by
dihydroxybenzene derivatives of N-methyl-NN-nitro-N-nitrosoguanidine-induced F344 rat forestomach and glandular
stomach carcinogenesis. Cancer Res. 49, 5143-5147.
Hofmann, A.F. (1988). Bile acids. In The Liver: Biology and Pathobiology (I.M. Arias, W.B. Jakoby, H. Popper,
D. Schachter, and D.A. Shafritz, Eds.), pp. 553-572. Raven Press, Ltd., New York.
Hollander, M., and Wolfe, D.A. (1973). Nonparametric Statistical Methods, pp. 120-123. John Wiley and Sons,
New York.
Horio, T., Tanaka, K., and Komura, J. (1977). Depigmentation due to para tertiary butylcatechol. Int. Arch. Occup.
Environ. Health 39, 127-133.
Integrated Laboratory Systems (ILS) (1990). Micronucleus Data Management and Statistical Analysis Software,
Version 1.4. ILS, P.O. Box 13501, Research Triangle Park, NC 27707.
Ito, N., Hirose, M., Fukushima, S., Tsuda, H., Shirai, T., and Tatematsu, M. (1986). Studies on antioxidants: Their
carcinogenic and modifying effects on chemical carcinogenesis. Food Chem. Toxicol. 24, 1071-1082.
Jonckheere, A.R. (1954). A distribution-free k-sample test against ordered alternatives. Biometrika 41, 133-145.
Kawashima, T., Yonemoto, K., Gellin, G.A., Epstein, W.L., and Fukuyama, K. (1984). Effects of 4-tertiary butyl
catechol on glutathione-metabolizing enzymes in vivo and in vitro. J. Invest. Dermatol. 82, 53-56.
48 p-tert-Butylcatechol, NTP TOX 70
Kirk-Othmer Encyclopedia of Chemical Technology (1980). Hydroquinone, resorcinol, and catechol. 3rd ed.
(M. Grayson, Ed.), pp. 39-69. John Wiley and Sons, Inc., New York.
Laurell, H. (1984). Contact allergy to tertiary-butylcatechol. Contact Dermatitis 10, 115.
Lewis, R.J., Sr. (1997). Hawley’s Condensed Chemical Dictionary, 13th ed., p. 177. John Wiley and Sons,
New York.
Macfarlane, A.W., Yu, R.C., and King, C.M. (1990). Contact sensitivity to para-tertiary-butylcatechol in an artificial
limb. Contact Dermatitis 22, 56-57.
McGregor, D.B., Riach, C.G., Brown, A., Edwards, I., Reynolds, D., West, K., and Willington, S. (1988). Reactivity
of catecholamines and related substances in the mouse lymphoma L5178Y cell assay for mutagens. Environ. Mol.
Mutagen. 11, 523-544.
MacGregor, J.T., Wehr, C.M., and Langlois, R.G. (1983). A simple fluorescent staining procedure for micronuclei
and RNA in erythrocytes using Hoescht 33258 and pyronin Y. Mutat. Res. 120, 269-275.
MacGregor, J.T., Wehr, C.M., Henika, P.R., and Shelby, M.D. (1990). The in vivo erythrocyte micronucleus test:
Measurement at steady state increases assay efficiency and permits integration with toxicity studies. Fundam. Appl.
Toxicol. 14, 513-522.
McGuire, J., and Hendee, J. (1971). Biochemical basis for depigmentation of skin by phenolic germicides. J. Invest.
Dermatol. 57, 256-261.
Marchesini, A., Capelletti, P., Canonica, L., Danieli, B., and Tollari, S. (1977). Evidence about the catecholoxidase
activity of the enzyme ascorbate oxidase extracted from Cucurbita pepo medullosa. Biochim. Biophys. Acta 484,
290-300.
Maronpot, R.R., and Boorman, G.A. (1982). Interpretation of rodent hepatocellular proliferative alterations and
hepatocellular tumors in chemical safety assessment. Toxicol. Pathol. 10, 71-80.
Morrison, D.F. (1976). Multivariate Statistical Methods, 2nd ed., pp. 170-179. McGraw-Hill Book Company,
New York.

49 p-tert-Butylcatechol, NTP TOX 70
Mortelmans, K., Haworth, S., Lawlor, T., Speck, W., Tainer, B., and Zeiger, E. (1986). Salmonella mutagenicity tests:
II. Results from the testing of 270 chemicals. Environ. Mutagen. 8 (Suppl. 7), 1-119.
National Institute for Occupational Safety and Health (1990). National Occupational Exposure Survey (1981-1983),
unpublished provisional data as of July 1, 1990. Cincinnati, OH.
National Toxicology Program (NTP) (1989). Toxicology and Carcinogenesis Studies of Hydroquinone (CAS
No. 123-31-9) in F344/N Rats and B6C3F1 Mice (Gavage Studies). Technical Report Series No. 366. NIH
Publication No. 90-2821. U.S. Department of Health and Human Services, Public Health Service, National Institutes
of Health, Research Triangle Park, NC.
National Toxicology Program (NTP) (1992). Toxicology and Carcinogenesis Studies of Resorcinol (CAS
No. 108-46-3) in F344/N Rats and B6C3F1 Mice (Gavage Studies). Technical Report Series No. 403. NIH
Publication No. 92-2858. U.S. Department of Health and Human Services, Public Health Service, National Institutes
of Health, Research Triangle Park, NC.
National Toxicology Program (NTP) (1997). Toxicology and Carcinogenesis Studies of t-Butylhydroquinone (CAS
No. 1948-33-0) in F344/N Rats and B6C3F1 Mice (Feed Studies). Technical Report Series No. 459. NIH Publication
No. 97-3375. U.S. Department of Health and Human Services, Public Health Service, National Institutes of Health,
Research Triangle Park, NC.
Patty’s Industrial Hygiene and Toxicology (1981). Phenols and Phenolic Compounds 3rd revised ed. (G.D. Clayton
and F.E. Clayton, Eds.), Vol. 2A, pp. 2583-2586, 2617-2618. John Wiley and Sons, Inc., New York.
Picardo, M., Passi, S., Nazzaro-Porro, M., Breathnach, A., Zompetta, C., Faggioni, A., and Riley, P. (1987).
Mechanism of antitumoral activity of catechols in culture. Biochem. Pharmacol. 36, 417-425.
Rao, G.N., Haseman, J.K., and Edmondson, J. (1989a). Influence of viral infections on body weight, survival, and
tumor prevalence in Fischer 344/NCr rats on two-year studies. Lab. Anim. Sci. 39, 389-393.
Rao, G.N., Piegorsch, W.W., Crawford, D.D., Edmondson, J., and Haseman, J.K. (1989b). Influence of viral
infections on body weight, survival, and tumor prevalence of B6C3F1 (C57BL/6N × C3H/HeN) mice in
carcinogenicity studies. Fundam. Appl. Toxicol. 13, 156-164.
Riedel-de Haën® Laboratory Chemicals (1984). pp. 174-175. Crescent Chemical Company, Inc., Hauppauge, NY.

50 p-tert-Butylcatechol, NTP TOX 70
Rosen, F., Roberts, N.R., Budrick, L.E., and Nichol, C.A. (1959a). Corticosteroids and transaminase activity: The
specificity of the glutamic pyruvic transaminase response. Endocrinology 65, 256-264.
Rosen, F., Roberts, N.R., and Nichol, C.A. (1959b). Glucocorticosteroids and transaminase activity. I. Increased
activity of glutamic-pyruvic transaminase in four conditions associated with gluconeogenesis. J. Biol. Chem. 234,
476-480.
Sax, N.I., and Lewis, R.J., Sr. (1989). Dangerous Properties of Industrial Materials, 7th ed., Vol. 2, pp. 651-652.
Van Nostrand Reinhold Company, New York.
Shahidi, F., and Wanasundara, P.K.J.P.D. (1992). Phenolic antioxidants. Crit. Rev. Food Sci. Nutr. 32, 67-103.
Shelby, M.D., Erexson, G.L., Hook, G.J., and Tice, R.R. (1993). Evaluation of a three-exposure mouse bone marrow
micronucleus protocol: Results with 49 chemicals. Environ. Mol. Mutagen. 21, 160-179.
Shirai, T., Hagiwara, A., Kurata, Y., Shibata, M., Fukushima, S., and Ito, N. (1982). Lack of carcinogenicity of
butylated hydroxytoluene on long-term administration to B6C3F1 mice. Food Chem. Toxicol. 20, 861-865.
Shirley, E. (1977). A non-parametric equivalent of Williams’ test for contrasting increasing dose levels of a
treatment. Biometrics 33, 386-389.
Sielicki, M., Focht, D.D., and Martin, J.P. (1978). Microbial transformations of styrene and [14C] styrene in soil and
enrichment cultures. Appl. Environ. Microbiol. 35, 124-128.
Smyth, H.F., Jr., Carpenter, C.P., Weil, C.S., and Pozzani, U.C. (1954). Range-finding toxicity data. List V. Arch.
Ind. Hyg. Occup. Med. 10, 61-68.
Tanaka, H., Hirose, M., Hagiwara, A., Imaida, K., Shirai, T., and Ito, N. (1995). Rat strain differences in catechol
carcinogenicity to the stomach. Food Chem. Toxicol. 33, 93-98.
Travlos, G.S., Morris, R.W., Elwell, M.R., Duke, A., Rosenblum, S., and Thompson, M.B. (1996). Frequency and
relationships of clinical chemistry and liver and kidney histopathology findings in 13-week toxicity studies in rats.
Toxicology 107, 17-29.
51 p-tert-Butylcatechol, NTP TOX 70
TSCAPP (1993). EPA Toxic Substances Control Act plant and production database, maintained by Chemical
Information System, National Information Services Corporation, Baltimore.
Usami, Y., Landau, A.B., Fukuyama, K., and Gellin, G.A. (1980). Inhibition of tyrosinase activity by 4-tert
butylcatechol and other depigmenting agents. J. Toxicol. Environ. Health 6, 559-567.
Verschueren, K. (1983). Handbook of Environmental Data on Organic Chemicals, 2nd ed., p. 314. Van Nostrand
Reinhold Company, New York.
Williams, D.A. (1971). A test for differences between treatment means when several dose levels are compared with
a zero dose control. Biometrics 27, 103-117.
Williams, D.A. (1972). The comparison of several dose levels with a zero dose control. Biometrics 28, 519-531.
Yonemoto, K., Gellin, G.A., Epstein, W.L., and Fukuyama, K. (1983a). Glutathione reductase activity in skin
exposed to 4-tertiary butyl catechol. Int. Arch. Occup. Environ. Health 51, 341-345.
Yonemoto, K., Gellin, G.A., Epstein, W.L., and Fukuyama, K. (1983b). Reduction in eumelanin by the activation of
glutathione reductase and (-glutamyl transpeptidase after exposure to a depigmenting chemical. Biochem.
Pharmacol. 32, 1379-1382.
Zeiger, E., Anderson, B., Haworth, S., Lawlor, T., and Mortelmans, K. (1992). Salmonella mutagenicity tests:
V. Results from the testing of 311 chemicals. Environ. Mol. Mutagen. 19 (Suppl. 21), 2-141.
Zhu, B.T., Lech, J., Rosen, R.T., and Conney, A.H. (1997). Effect of dietary 2(3)-tert-butyl-4-hydroxyanisole on the
metabolism and action of estradiol and estrone in female CD-1 mice. Cancer Res. 57, 2419-2427.

52 p-tert-Butylcatechol, NTP TOX 70

A-1
TABLE A1
TABLE A2
TABLE A3
TABLE A4
APPENDIX A SUMMARY OF NONNEOPLASTIC LESIONS
IN RATS AND MICE
Summary of the Incidence of Nonneoplastic Lesions in Male Rats in the 14-Week Feed Study of p-tert-Butylcatechol . . . . . . . . . . . . . . . . . . . . . . . . . . . . . . . . A-2
Summary of the Incidence of Nonneoplastic Lesions in Female Rats in the 14-Week Feed Study of p-tert-Butylcatechol . . . . . . . . . . . . . . . . . . . . . . . . . . . . . . . . A-4
Summary of the Incidence of Nonneoplastic Lesions in Male Mice in the 14-Week Feed Study of p-tert-Butylcatechol . . . . . . . . . . . . . . . . . . . . . . . . . . . . . . . . A-6
Summary of the Incidence of Nonneoplastic Lesions in Female Mice in the 14-Week Feed Study of p-tert-Butylcatechol . . . . . . . . . . . . . . . . . . . . . . . . . . . . . . . . A-8
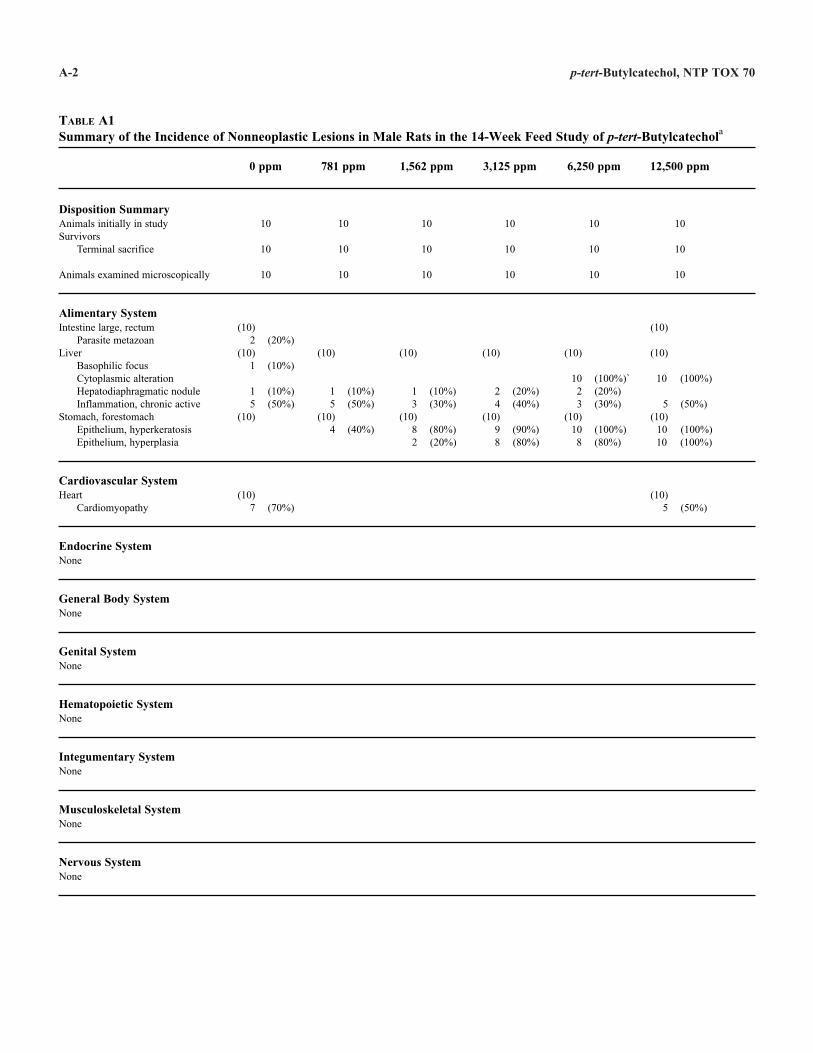
A-2 p-tert-Butylcatechol, NTP TOX 70
TABLE A1 Summary of the Incidence of Nonneoplastic Lesions in Male Rats in the 14-Week Feed Study of p-tert-Butylcatechola
0 ppm 781 ppm 1,562 ppm 3,125 ppm 6,250 ppm 12,500 ppm
Disposition Summary Animals initially in study Survivors
Terminal sacrifice
10
10
10
10
10
10
10
10
10
10
10
10
Animals examined microscopically 10 10 10 10 10 10
Alimentary System Intestine large, rectum
Parasite metazoan Liver
Basophilic focus Cytoplasmic alteration Hepatodiaphragmatic nodule Inflammation, chronic active
Stomach, forestomach Epithelium, hyperkeratosis Epithelium, hyperplasia
(10) 2
(10) 1
1 5
(10)
(20%)
(10%)
(10%) (50%)
(10)
1 5
(10) 4
(10%) (50%)
(40%)
(10)
1 3
(10) 8 2
(10%) (30%)
(80%) (20%)
(10)
2 4
(10) 9 8
(20%) (40%)
(90%) (80%)
(10)
10 2 3
(10) 10 8
(100%)` (20%) (30%)
(100%) (80%)
(10)
(10)
10
5 (10)
10 10
(100%)
(50%)
(100%) (100%)
Cardiovascular System Heart
Cardiomyopathy (10)
7 (70%) (10)
5 (50%)
Endocrine System None
General Body System None
Genital System None
Hematopoietic System None
Integumentary System None
Musculoskeletal System None
Nervous System None
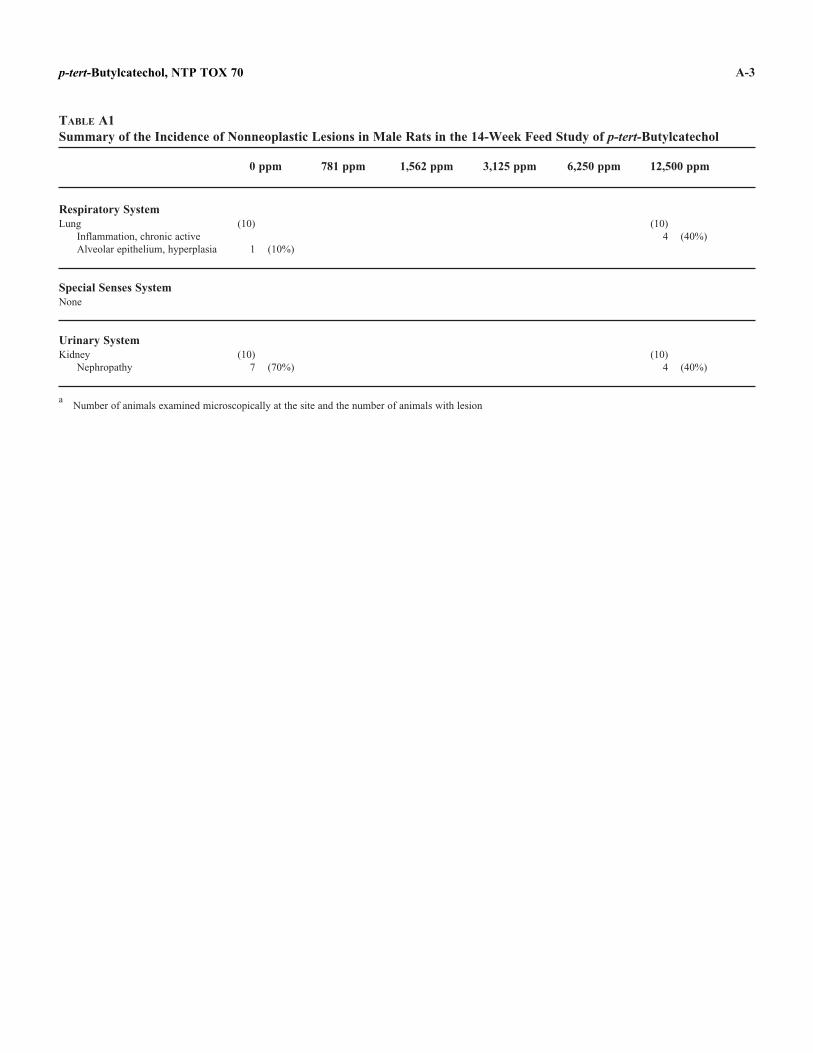
A-3 p-tert-Butylcatechol, NTP TOX 70
TABLE A1 Summary of the Incidence of Nonneoplastic Lesions in Male Rats in the 14-Week Feed Study of p-tert-Butylcatechol
0 ppm 781 ppm 1,562 ppm 3,125 ppm 6,250 ppm 12,500 ppm
Respiratory System Lung (10) (10)
Inflammation, chronic active 4 (40%) Alveolar epithelium, hyperplasia 1 (10%)
Special Senses System None
Urinary System Kidney (10) (10)
Nephropathy 7 (70%) 4 (40%)
a Number of animals examined microscopically at the site and the number of animals with lesion

A-4 p-tert-Butylcatechol, NTP TOX 70
TABLE A2 Summary of the Incidence of Nonneoplastic Lesions in Female Rats in the 14-Week Feed Study of p-tert-Butylcatechola
0 ppm 781 ppm 1,562 ppm 3,125 ppm 6,250 ppm 12,500 ppm
Disposition Summary Animals initially in study Survivors
Terminal sacrifice
10
10
10
10
10
10
10
10
10
10
10
10
Animals examined microscopically 10 10 10 10 10 10
Alimentary System Liver
Hepatodiaphragmatic nodule Inflammation, chronic active
Stomach, forestomach Epithelium, hyperkeratosis Epithelium, hyperplasia
(10) 3
10 (10)
(30%) (100%)
(5) 5
(10) 6
(100%)
(60%)
(1) 1
(10) 7
(100%)
(70%)
(1) 1
(10) 9 5
(100%)
(90%) (50%)
(2) 2
(10) 10 8
(100%)
(100%) (80%)
(10)
4 (10)
10 10
(40%)
(100%) (100%)
Cardiovascular System Heart
Cardiomyopathy (10)
1 (10%) (10)
3 (30%)
Endocrine System None
General Body System None
Genital System Clitoral gland (10) (10)
Cyst 1 (10%) Ovary (10) (10)
Cyst 1 (10%)
Hematopoietic System None
Integumentary System None
Musculoskeletal System None
Nervous System None

A-5 p-tert-Butylcatechol, NTP TOX 70
TABLE A2 Summary of the Incidence of Nonneoplastic Lesions in Female Rats in the 14-Week Feed Study of p-tert-Butylcatechol
0 ppm 781 ppm 1,562 ppm 3,125 ppm 6,250 ppm 12,500 ppm
Respiratory System Lung (10) (10)
Inflammation, chronic active 2 (20%) Alveolar epithelium, inflammation,
chronic active 1 (10%)
Special Senses System None
Urinary System Kidney (10) (10)
Mineralization 3 (30%) Nephropathy 1 (10%) 4 (40%)
a Number of animals examined microscopically at the site and the number of animals with lesion.
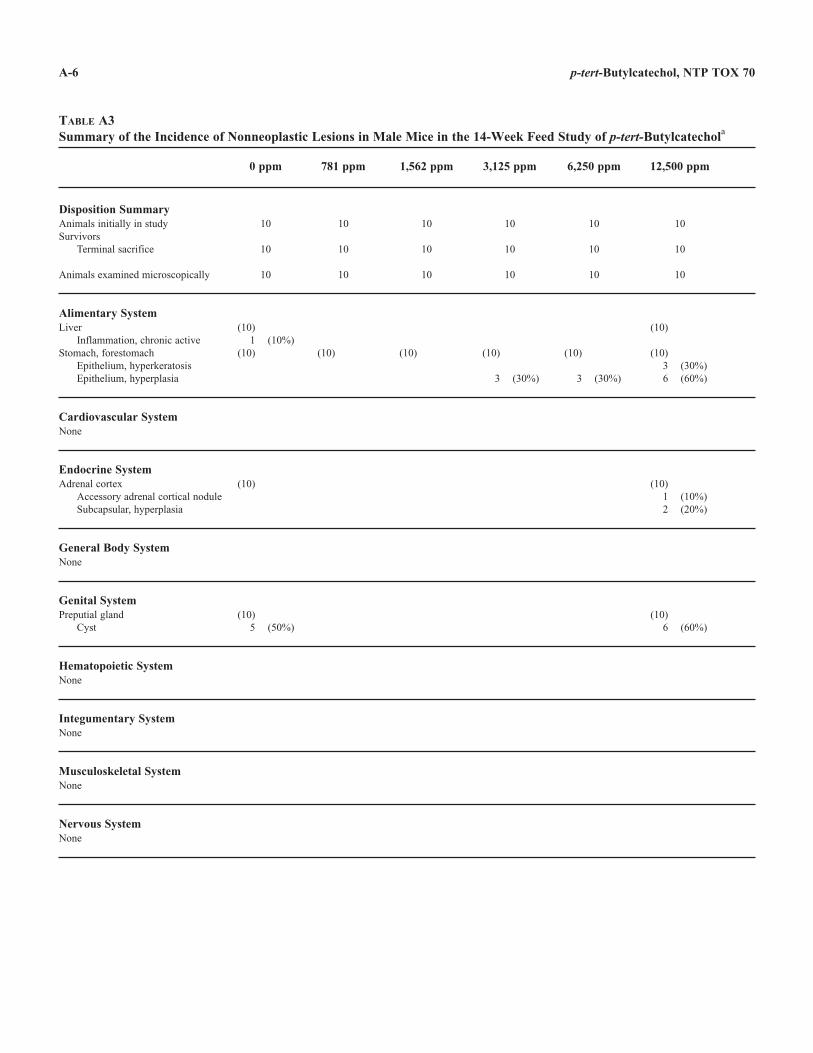
A-6 p-tert-Butylcatechol, NTP TOX 70
TABLE A3 Summary of the Incidence of Nonneoplastic Lesions in Male Mice in the 14-Week Feed Study of p-tert-Butylcatechola
0 ppm 781 ppm 1,562 ppm 3,125 ppm 6,250 ppm 12,500 ppm
Disposition Summary Animals initially in study Survivors
Terminal sacrifice
10
10
10
10
10
10
10
10
10
10
10
10
Animals examined microscopically 10 10 10 10 10 10
Alimentary System Liver
Inflammation, chronic active Stomach, forestomach
Epithelium, hyperkeratosis Epithelium, hyperplasia
(10) 1
(10) (10%)
(10) (10) (10)
3 (30%)
(10)
3 (30%)
(10)
(10) 3 6
(30%) (60%)
Cardiovascular System None
Endocrine System Adrenal cortex (10) (10)
Accessory adrenal cortical nodule 1 (10%) Subcapsular, hyperplasia 2 (20%)
General Body System None
Genital System Preputial gland (10) (10)
Cyst 5 (50%) 6 (60%)
Hematopoietic System None
Integumentary System None
Musculoskeletal System None
Nervous System None
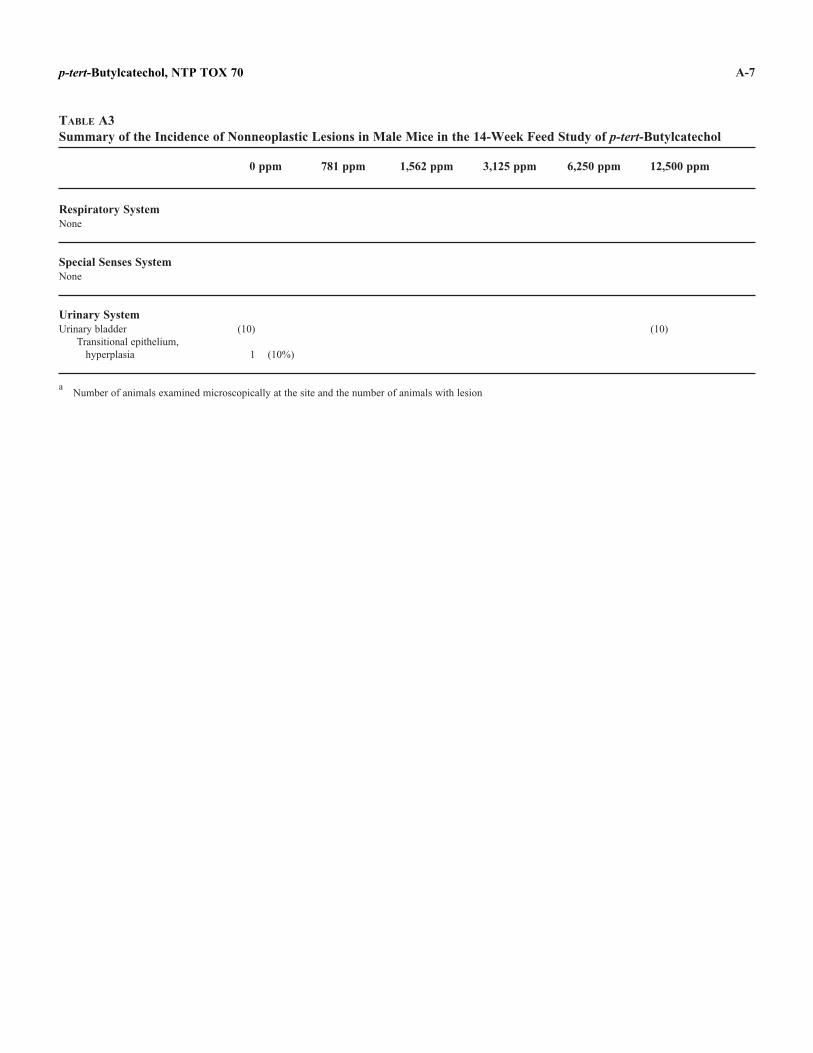
A-7 p-tert-Butylcatechol, NTP TOX 70
TABLE A3 Summary of the Incidence of Nonneoplastic Lesions in Male Mice in the 14-Week Feed Study of p-tert-Butylcatechol
0 ppm 781 ppm 1,562 ppm 3,125 ppm 6,250 ppm 12,500 ppm
Respiratory System None
Special Senses System None
Urinary System Urinary bladder (10) (10)
Transitional epithelium, hyperplasia 1 (10%)
a Number of animals examined microscopically at the site and the number of animals with lesion

A-8 p-tert-Butylcatechol, NTP TOX 70
TABLE A4 Summary of the Incidence of Nonneoplastic Lesions in Female Mice in the 14-Week Feed Study of p-tert-Butylcatechola
0 ppm 781 ppm 1,562 ppm 3,125 ppm 6,250 ppm 12,500 ppm
Disposition Summary Animals initially in study Survivors
Terminal sacrifice
10
10
10
10
10
10
10
10
10
10
10
10
Animals examined microscopically 10 10 9 10 10 10
Alimentary System Intestine large, cecum
Inflammation, chronic active Liver
Inflammation, chronic active Stomach, forestomach
Epithelium, hyperkeratosis Epithelium, hyperplasia
(10)
(10) 1
(10) (10%)
(10) (9) (10)
2 (20%)
(10) 2 4
(20%) (40%)
(10) 1
(10)
(10) 6 7
(10%)
(60%) (70%)
Cardiovascular System None
Endocrine System Adrenal cortex (10) (10)
Subcapsular, hyperplasia 5 (50%) 5 (50%)
General Body System None
Genital System None
Hematopoietic System None
Integumentary System None
Musculoskeletal System None
Nervous System None
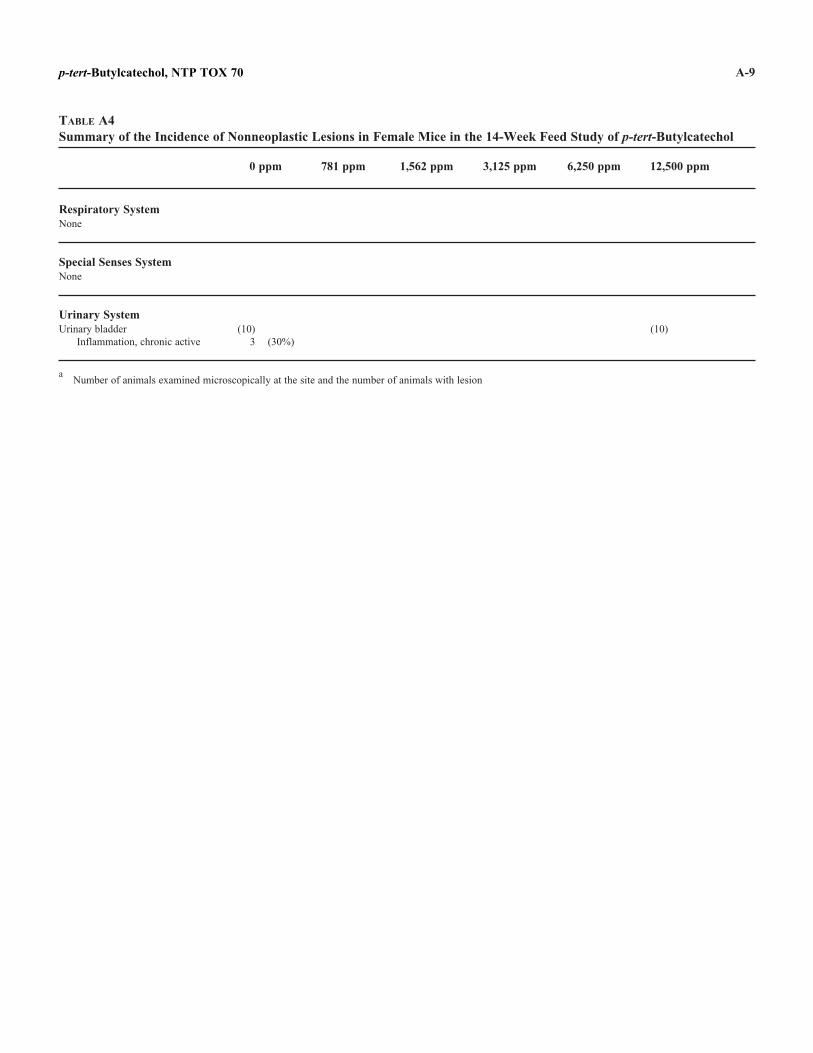
A-9 p-tert-Butylcatechol, NTP TOX 70
TABLE A4 Summary of the Incidence of Nonneoplastic Lesions in Female Mice in the 14-Week Feed Study of p-tert-Butylcatechol
0 ppm 781 ppm 1,562 ppm 3,125 ppm 6,250 ppm 12,500 ppm
Respiratory System None
Special Senses System None
Urinary System Urinary bladder (10) (10)
Inflammation, chronic active 3 (30%)
a Number of animals examined microscopically at the site and the number of animals with lesion

A-10 p-tert-Butylcatechol, NTP TOX 70

B-1
TABLE B1
TABLE B2
Hemain theHema
APPENDIX B CLINICAL PATHOLOGY RESULTS
tology and Clinical Chemistry Data for Rats 14-Week Feed Study of p-tert-Butylcatechol . . . . . . . . . . . . . . . . . . . . . . . . . . . . . . . . tology Data for Mice in the 14-Week Feed Study of p-tert-Butylcatechol . . . . . . . . . .
B-2 B-7
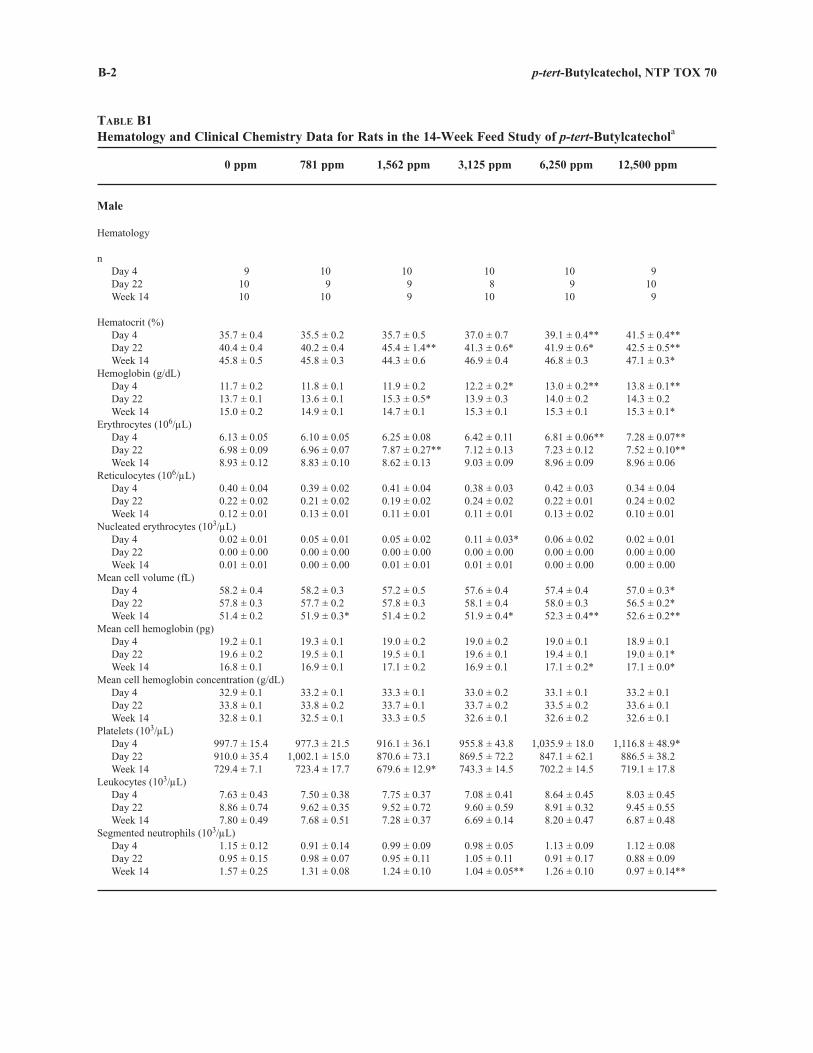
B-2 p-tert-Butylcatechol, NTP TOX 70
TABLE B1 Hematology and Clinical Chemistry Data for Rats in the 14-Week Feed Study of p-tert-Butylcatechola
0 ppm 781 ppm 1,562 ppm 3,125 ppm 6,250 ppm 12,500 ppm
Male
Hematology
n Day 4 9 10 10 10 10 9 Day 22 10 9 9 8 9 10 Week 14 10 10 9 10 10 9
Hematocrit (%) Day 4 35.7 ± 0.4 35.5 ± 0.2 35.7 ± 0.5 37.0 ± 0.7 39.1 ± 0.4** 41.5 ± 0.4** Day 22 40.4 ± 0.4 40.2 ± 0.4 45.4 ± 1.4** 41.3 ± 0.6* 41.9 ± 0.6* 42.5 ± 0.5** Week 14 45.8 ± 0.5 45.8 ± 0.3 44.3 ± 0.6 46.9 ± 0.4 46.8 ± 0.3 47.1 ± 0.3*
Hemoglobin (g/dL) Day 4 11.7 ± 0.2 11.8 ± 0.1 11.9 ± 0.2 12.2 ± 0.2* 13.0 ± 0.2** 13.8 ± 0.1** Day 22 13.7 ± 0.1 13.6 ± 0.1 15.3 ± 0.5* 13.9 ± 0.3 14.0 ± 0.2 14.3 ± 0.2 Week 14 15.0 ± 0.2 14.9 ± 0.1 14.7 ± 0.1 15.3 ± 0.1 15.3 ± 0.1 15.3 ± 0.1*
Erythrocytes (106/µL) Day 4 6.13 ± 0.05 6.10 ± 0.05 6.25 ± 0.08 6.42 ± 0.11 6.81 ± 0.06** 7.28 ± 0.07** Day 22 6.98 ± 0.09 6.96 ± 0.07 7.87 ± 0.27** 7.12 ± 0.13 7.23 ± 0.12 7.52 ± 0.10** Week 14 8.93 ± 0.12 8.83 ± 0.10 8.62 ± 0.13 9.03 ± 0.09 8.96 ± 0.09 8.96 ± 0.06
Reticulocytes (106/µL) Day 4 0.40 ± 0.04 0.39 ± 0.02 0.41 ± 0.04 0.38 ± 0.03 0.42 ± 0.03 0.34 ± 0.04 Day 22 0.22 ± 0.02 0.21 ± 0.02 0.19 ± 0.02 0.24 ± 0.02 0.22 ± 0.01 0.24 ± 0.02 Week 14 0.12 ± 0.01 0.13 ± 0.01 0.11 ± 0.01 0.11 ± 0.01 0.13 ± 0.02 0.10 ± 0.01
Nucleated erythrocytes (103/µL) Day 4 0.02 ± 0.01 0.05 ± 0.01 0.05 ± 0.02 0.11 ± 0.03* 0.06 ± 0.02 0.02 ± 0.01 Day 22 0.00 ± 0.00 0.00 ± 0.00 0.00 ± 0.00 0.00 ± 0.00 0.00 ± 0.00 0.00 ± 0.00 Week 14 0.01 ± 0.01 0.00 ± 0.00 0.01 ± 0.01 0.01 ± 0.01 0.00 ± 0.00 0.00 ± 0.00
Mean cell volume (fL) Day 4 58.2 ± 0.4 58.2 ± 0.3 57.2 ± 0.5 57.6 ± 0.4 57.4 ± 0.4 57.0 ± 0.3* Day 22 57.8 ± 0.3 57.7 ± 0.2 57.8 ± 0.3 58.1 ± 0.4 58.0 ± 0.3 56.5 ± 0.2* Week 14 51.4 ± 0.2 51.9 ± 0.3* 51.4 ± 0.2 51.9 ± 0.4* 52.3 ± 0.4** 52.6 ± 0.2**
Mean cell hemoglobin (pg) Day 4 19.2 ± 0.1 19.3 ± 0.1 19.0 ± 0.2 19.0 ± 0.2 19.0 ± 0.1 18.9 ± 0.1 Day 22 19.6 ± 0.2 19.5 ± 0.1 19.5 ± 0.1 19.6 ± 0.1 19.4 ± 0.1 19.0 ± 0.1* Week 14 16.8 ± 0.1 16.9 ± 0.1 17.1 ± 0.2 16.9 ± 0.1 17.1 ± 0.2* 17.1 ± 0.0*
Mean cell hemoglobin concentration (g/dL) Day 4 32.9 ± 0.1 33.2 ± 0.1 33.3 ± 0.1 33.0 ± 0.2 33.1 ± 0.1 33.2 ± 0.1 Day 22 33.8 ± 0.1 33.8 ± 0.2 33.7 ± 0.1 33.7 ± 0.2 33.5 ± 0.2 33.6 ± 0.1 Week 14 32.8 ± 0.1 32.5 ± 0.1 33.3 ± 0.5 32.6 ± 0.1 32.6 ± 0.2 32.6 ± 0.1
Platelets (103/µL) Day 4 997.7 ± 15.4 977.3 ± 21.5 916.1 ± 36.1 955.8 ± 43.8 1,035.9 ± 18.0 1,116.8 ± 48.9* Day 22 910.0 ± 35.4 1,002.1 ± 15.0 870.6 ± 73.1 869.5 ± 72.2 847.1 ± 62.1 886.5 ± 38.2 Week 14 729.4 ± 7.1 723.4 ± 17.7 679.6 ± 12.9* 743.3 ± 14.5 702.2 ± 14.5 719.1 ± 17.8
Leukocytes (103/µL) Day 4 7.63 ± 0.43 7.50 ± 0.38 7.75 ± 0.37 7.08 ± 0.41 8.64 ± 0.45 8.03 ± 0.45 Day 22 8.86 ± 0.74 9.62 ± 0.35 9.52 ± 0.72 9.60 ± 0.59 8.91 ± 0.32 9.45 ± 0.55 Week 14 7.80 ± 0.49 7.68 ± 0.51 7.28 ± 0.37 6.69 ± 0.14 8.20 ± 0.47 6.87 ± 0.48
Segmented neutrophils (103/µL) Day 4 1.15 ± 0.12 0.91 ± 0.14 0.99 ± 0.09 0.98 ± 0.05 1.13 ± 0.09 1.12 ± 0.08 Day 22 0.95 ± 0.15 0.98 ± 0.07 0.95 ± 0.11 1.05 ± 0.11 0.91 ± 0.17 0.88 ± 0.09 Week 14 1.57 ± 0.25 1.31 ± 0.08 1.24 ± 0.10 1.04 ± 0.05** 1.26 ± 0.10 0.97 ± 0.14**
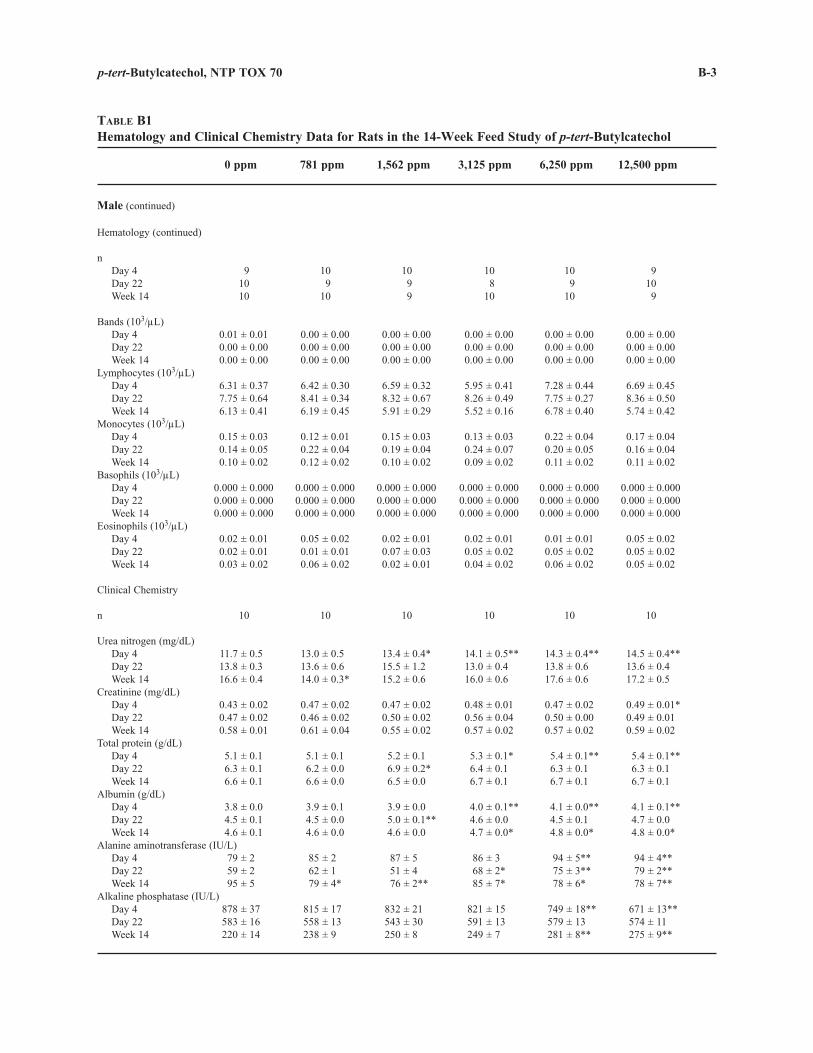
B-3 p-tert-Butylcatechol, NTP TOX 70
TABLE B1 Hematology and Clinical Chemistry Data for Rats in the 14-Week Feed Study of p-tert-Butylcatechol
0 ppm 781 ppm 1,562 ppm 3,125 ppm 6,250 ppm 12,500 ppm
Male (continued)
Hematology (continued)
n Day 4 9 10 10 10 10 9 Day 22 10 9 9 8 9 10 Week 14 10 10 9 10 10 9
Bands (103/µL) Day 4 0.01 ± 0.01 0.00 ± 0.00 0.00 ± 0.00 0.00 ± 0.00 0.00 ± 0.00 0.00 ± 0.00 Day 22 0.00 ± 0.00 0.00 ± 0.00 0.00 ± 0.00 0.00 ± 0.00 0.00 ± 0.00 0.00 ± 0.00 Week 14 0.00 ± 0.00 0.00 ± 0.00 0.00 ± 0.00 0.00 ± 0.00 0.00 ± 0.00 0.00 ± 0.00
Lymphocytes (103/µL) Day 4 6.31 ± 0.37 6.42 ± 0.30 6.59 ± 0.32 5.95 ± 0.41 7.28 ± 0.44 6.69 ± 0.45 Day 22 7.75 ± 0.64 8.41 ± 0.34 8.32 ± 0.67 8.26 ± 0.49 7.75 ± 0.27 8.36 ± 0.50 Week 14 6.13 ± 0.41 6.19 ± 0.45 5.91 ± 0.29 5.52 ± 0.16 6.78 ± 0.40 5.74 ± 0.42
Monocytes (103/µL) Day 4 0.15 ± 0.03 0.12 ± 0.01 0.15 ± 0.03 0.13 ± 0.03 0.22 ± 0.04 0.17 ± 0.04 Day 22 0.14 ± 0.05 0.22 ± 0.04 0.19 ± 0.04 0.24 ± 0.07 0.20 ± 0.05 0.16 ± 0.04 Week 14 0.10 ± 0.02 0.12 ± 0.02 0.10 ± 0.02 0.09 ± 0.02 0.11 ± 0.02 0.11 ± 0.02
Basophils (103/µL) Day 4 0.000 ± 0.000 0.000 ± 0.000 0.000 ± 0.000 0.000 ± 0.000 0.000 ± 0.000 0.000 ± 0.000 Day 22 0.000 ± 0.000 0.000 ± 0.000 0.000 ± 0.000 0.000 ± 0.000 0.000 ± 0.000 0.000 ± 0.000 Week 14 0.000 ± 0.000 0.000 ± 0.000 0.000 ± 0.000 0.000 ± 0.000 0.000 ± 0.000 0.000 ± 0.000
Eosinophils (103/µL) Day 4 0.02 ± 0.01 0.05 ± 0.02 0.02 ± 0.01 0.02 ± 0.01 0.01 ± 0.01 0.05 ± 0.02 Day 22 0.02 ± 0.01 0.01 ± 0.01 0.07 ± 0.03 0.05 ± 0.02 0.05 ± 0.02 0.05 ± 0.02 Week 14 0.03 ± 0.02 0.06 ± 0.02 0.02 ± 0.01 0.04 ± 0.02 0.06 ± 0.02 0.05 ± 0.02
Clinical Chemistry
n 10 10 10 10 10 10
Urea nitrogen (mg/dL) Day 4 11.7 ± 0.5 13.0 ± 0.5 13.4 ± 0.4* 14.1 ± 0.5** 14.3 ± 0.4** 14.5 ± 0.4** Day 22 13.8 ± 0.3 13.6 ± 0.6 15.5 ± 1.2 13.0 ± 0.4 13.8 ± 0.6 13.6 ± 0.4 Week 14 16.6 ± 0.4 14.0 ± 0.3* 15.2 ± 0.6 16.0 ± 0.6 17.6 ± 0.6 17.2 ± 0.5
Creatinine (mg/dL) Day 4 0.43 ± 0.02 0.47 ± 0.02 0.47 ± 0.02 0.48 ± 0.01 0.47 ± 0.02 0.49 ± 0.01* Day 22 0.47 ± 0.02 0.46 ± 0.02 0.50 ± 0.02 0.56 ± 0.04 0.50 ± 0.00 0.49 ± 0.01 Week 14 0.58 ± 0.01 0.61 ± 0.04 0.55 ± 0.02 0.57 ± 0.02 0.57 ± 0.02 0.59 ± 0.02
Total protein (g/dL) Day 4 5.1 ± 0.1 5.1 ± 0.1 5.2 ± 0.1 5.3 ± 0.1* 5.4 ± 0.1** 5.4 ± 0.1** Day 22 6.3 ± 0.1 6.2 ± 0.0 6.9 ± 0.2* 6.4 ± 0.1 6.3 ± 0.1 6.3 ± 0.1 Week 14 6.6 ± 0.1 6.6 ± 0.0 6.5 ± 0.0 6.7 ± 0.1 6.7 ± 0.1 6.7 ± 0.1
Albumin (g/dL) Day 4 3.8 ± 0.0 3.9 ± 0.1 3.9 ± 0.0 4.0 ± 0.1** 4.1 ± 0.0** 4.1 ± 0.1** Day 22 4.5 ± 0.1 4.5 ± 0.0 5.0 ± 0.1** 4.6 ± 0.0 4.5 ± 0.1 4.7 ± 0.0 Week 14 4.6 ± 0.1 4.6 ± 0.0 4.6 ± 0.0 4.7 ± 0.0* 4.8 ± 0.0* 4.8 ± 0.0*
Alanine aminotransferase (IU/L) Day 4 79 ± 2 85 ± 2 87 ± 5 86 ± 3 94 ± 5** 94 ± 4** Day 22 59 ± 2 62 ± 1 51 ± 4 68 ± 2* 75 ± 3** 79 ± 2** Week 14 95 ± 5 79 ± 4* 76 ± 2** 85 ± 7* 78 ± 6* 78 ± 7**
Alkaline phosphatase (IU/L) Day 4 878 ± 37 815 ± 17 832 ± 21 821 ± 15 749 ± 18** 671 ± 13** Day 22 583 ± 16 558 ± 13 543 ± 30 591 ± 13 579 ± 13 574 ± 11 Week 14 220 ± 14 238 ± 9 250 ± 8 249 ± 7 281 ± 8** 275 ± 9**
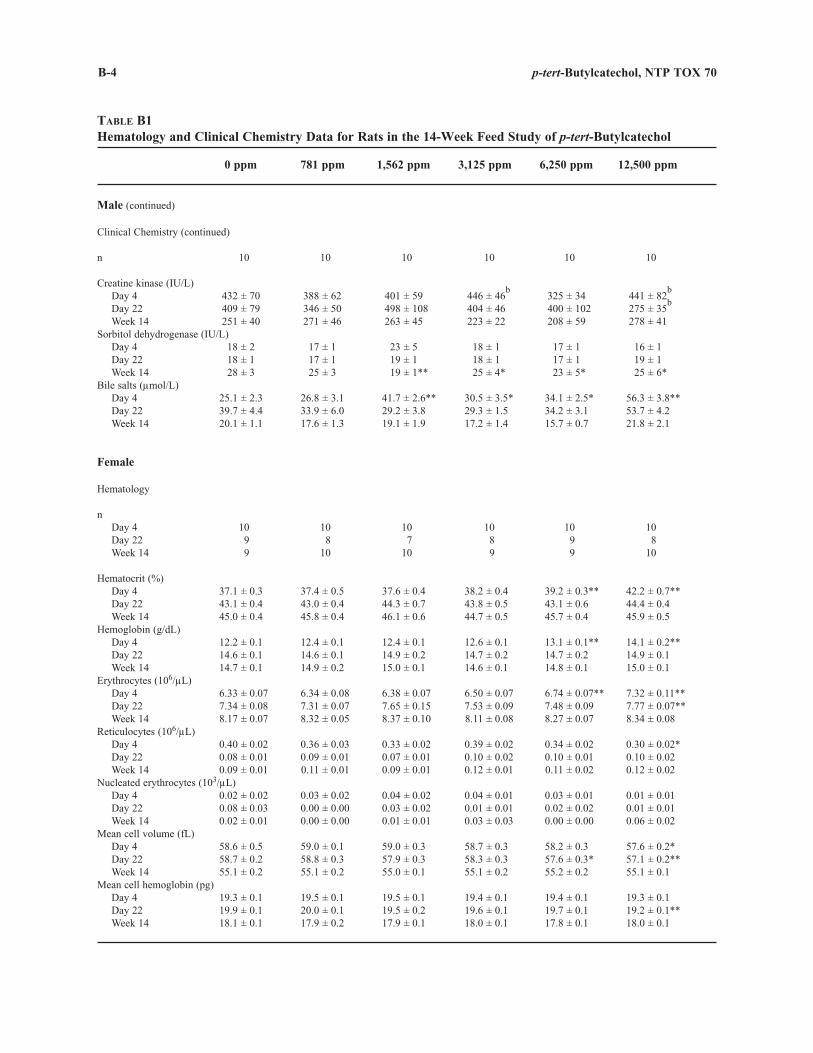
B-4 p-tert-Butylcatechol, NTP TOX 70
TABLE B1 Hematology and Clinical Chemistry Data for Rats in the 14-Week Feed Study of p-tert-Butylcatechol
0 ppm 781 ppm 1,562 ppm 3,125 ppm 6,250 ppm 12,500 ppm
Male (continued)
Clinical Chemistry (continued)
n 10 10 10 10 10 10
Creatine kinase (IU/L) Day 4 Day 22
432 ± 70 409 ± 79
388 ± 62 346 ± 50
401 ± 59 498 ± 108
446 ± 46b
404 ± 46 325 ± 34 400 ± 102
441 ± 82b
275 ± 35b
Week 14 251 ± 40 271 ± 46 263 ± 45 223 ± 22 208 ± 59 278 ± 41 Sorbitol dehydrogenase (IU/L)
Day 4 18 ± 2 17 ± 1 23 ± 5 18 ± 1 17 ± 1 16 ± 1 Day 22 18 ± 1 17 ± 1 19 ± 1 18 ± 1 17 ± 1 19 ± 1 Week 14 28 ± 3 25 ± 3 19 ± 1** 25 ± 4* 23 ± 5* 25 ± 6*
Bile salts (µmol/L) Day 4 25.1 ± 2.3 26.8 ± 3.1 41.7 ± 2.6** 30.5 ± 3.5* 34.1 ± 2.5* 56.3 ± 3.8** Day 22 39.7 ± 4.4 33.9 ± 6.0 29.2 ± 3.8 29.3 ± 1.5 34.2 ± 3.1 53.7 ± 4.2 Week 14 20.1 ± 1.1 17.6 ± 1.3 19.1 ± 1.9 17.2 ± 1.4 15.7 ± 0.7 21.8 ± 2.1
Female
Hematology
n Day 4 10 10 10 10 10 10 Day 22 9 8 7 8 9 8 Week 14 9 10 10 9 9 10
Hematocrit (%) Day 4 37.1 ± 0.3 37.4 ± 0.5 37.6 ± 0.4 38.2 ± 0.4 39.2 ± 0.3** 42.2 ± 0.7** Day 22 43.1 ± 0.4 43.0 ± 0.4 44.3 ± 0.7 43.8 ± 0.5 43.1 ± 0.6 44.4 ± 0.4 Week 14 45.0 ± 0.4 45.8 ± 0.4 46.1 ± 0.6 44.7 ± 0.5 45.7 ± 0.4 45.9 ± 0.5
Hemoglobin (g/dL) Day 4 12.2 ± 0.1 12.4 ± 0.1 12.4 ± 0.1 12.6 ± 0.1 13.1 ± 0.1** 14.1 ± 0.2** Day 22 14.6 ± 0.1 14.6 ± 0.1 14.9 ± 0.2 14.7 ± 0.2 14.7 ± 0.2 14.9 ± 0.1 Week 14 14.7 ± 0.1 14.9 ± 0.2 15.0 ± 0.1 14.6 ± 0.1 14.8 ± 0.1 15.0 ± 0.1
Erythrocytes (106/µL) Day 4 6.33 ± 0.07 6.34 ± 0.08 6.38 ± 0.07 6.50 ± 0.07 6.74 ± 0.07** 7.32 ± 0.11** Day 22 7.34 ± 0.08 7.31 ± 0.07 7.65 ± 0.15 7.53 ± 0.09 7.48 ± 0.09 7.77 ± 0.07** Week 14 8.17 ± 0.07 8.32 ± 0.05 8.37 ± 0.10 8.11 ± 0.08 8.27 ± 0.07 8.34 ± 0.08
Reticulocytes (106/µL) Day 4 0.40 ± 0.02 0.36 ± 0.03 0.33 ± 0.02 0.39 ± 0.02 0.34 ± 0.02 0.30 ± 0.02* Day 22 0.08 ± 0.01 0.09 ± 0.01 0.07 ± 0.01 0.10 ± 0.02 0.10 ± 0.01 0.10 ± 0.02 Week 14 0.09 ± 0.01 0.11 ± 0.01 0.09 ± 0.01 0.12 ± 0.01 0.11 ± 0.02 0.12 ± 0.02
Nucleated erythrocytes (103/µL) Day 4 0.02 ± 0.02 0.03 ± 0.02 0.04 ± 0.02 0.04 ± 0.01 0.03 ± 0.01 0.01 ± 0.01 Day 22 0.08 ± 0.03 0.00 ± 0.00 0.03 ± 0.02 0.01 ± 0.01 0.02 ± 0.02 0.01 ± 0.01 Week 14 0.02 ± 0.01 0.00 ± 0.00 0.01 ± 0.01 0.03 ± 0.03 0.00 ± 0.00 0.06 ± 0.02
Mean cell volume (fL) Day 4 58.6 ± 0.5 59.0 ± 0.1 59.0 ± 0.3 58.7 ± 0.3 58.2 ± 0.3 57.6 ± 0.2* Day 22 58.7 ± 0.2 58.8 ± 0.3 57.9 ± 0.3 58.3 ± 0.3 57.6 ± 0.3* 57.1 ± 0.2** Week 14 55.1 ± 0.2 55.1 ± 0.2 55.0 ± 0.1 55.1 ± 0.2 55.2 ± 0.2 55.1 ± 0.1
Mean cell hemoglobin (pg) Day 4 19.3 ± 0.1 19.5 ± 0.1 19.5 ± 0.1 19.4 ± 0.1 19.4 ± 0.1 19.3 ± 0.1 Day 22 19.9 ± 0.1 20.0 ± 0.1 19.5 ± 0.2 19.6 ± 0.1 19.7 ± 0.1 19.2 ± 0.1** Week 14 18.1 ± 0.1 17.9 ± 0.2 17.9 ± 0.1 18.0 ± 0.1 17.8 ± 0.1 18.0 ± 0.1
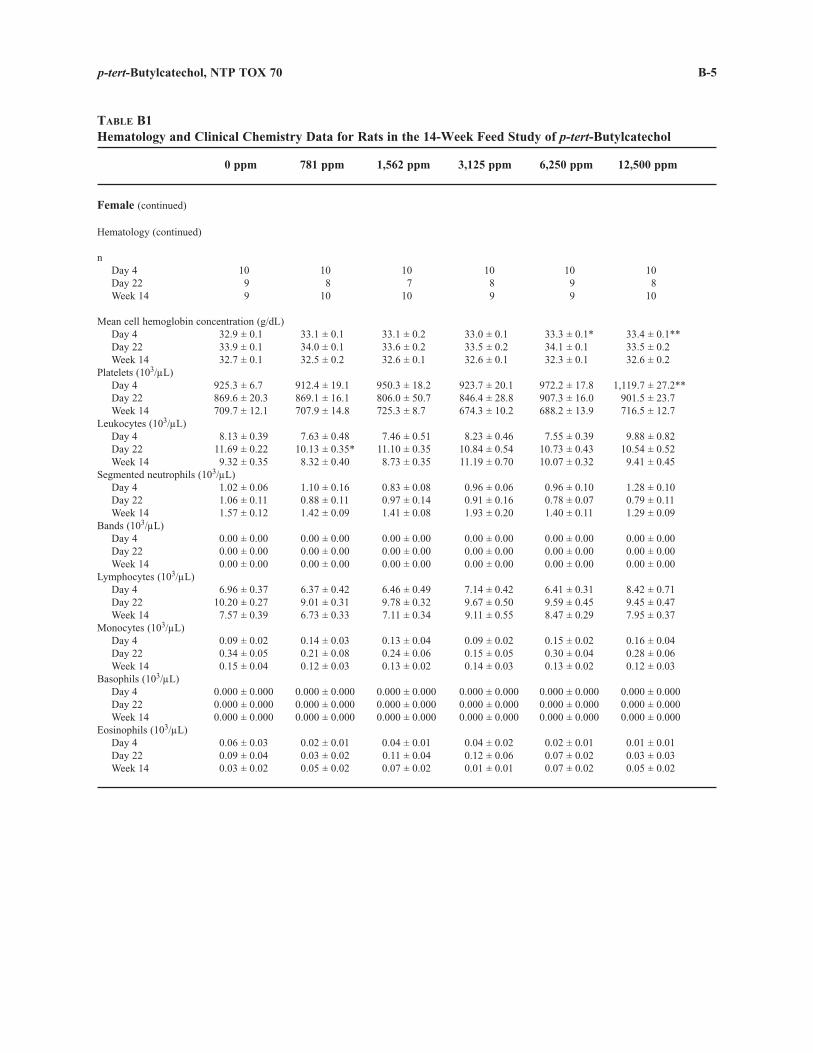
B-5 p-tert-Butylcatechol, NTP TOX 70
TABLE B1 Hematology and Clinical Chemistry Data for Rats in the 14-Week Feed Study of p-tert-Butylcatechol
0 ppm 781 ppm 1,562 ppm 3,125 ppm 6,250 ppm 12,500 ppm
Female (continued)
Hematology (continued)
n Day 4 10 10 10 10 10 10 Day 22 9 8 7 8 9 8 Week 14 9 10 10 9 9 10
Mean cell hemoglobin concentration (g/dL) Day 4 32.9 ± 0.1 33.1 ± 0.1 33.1 ± 0.2 33.0 ± 0.1 33.3 ± 0.1* 33.4 ± 0.1** Day 22 33.9 ± 0.1 34.0 ± 0.1 33.6 ± 0.2 33.5 ± 0.2 34.1 ± 0.1 33.5 ± 0.2 Week 14 32.7 ± 0.1 32.5 ± 0.2 32.6 ± 0.1 32.6 ± 0.1 32.3 ± 0.1 32.6 ± 0.2
Platelets (103/µL) Day 4 925.3 ± 6.7 912.4 ± 19.1 950.3 ± 18.2 923.7 ± 20.1 972.2 ± 17.8 1,119.7 ± 27.2** Day 22 869.6 ± 20.3 869.1 ± 16.1 806.0 ± 50.7 846.4 ± 28.8 907.3 ± 16.0 901.5 ± 23.7 Week 14 709.7 ± 12.1 707.9 ± 14.8 725.3 ± 8.7 674.3 ± 10.2 688.2 ± 13.9 716.5 ± 12.7
Leukocytes (103/µL) Day 4 8.13 ± 0.39 7.63 ± 0.48 7.46 ± 0.51 8.23 ± 0.46 7.55 ± 0.39 9.88 ± 0.82 Day 22 11.69 ± 0.22 10.13 ± 0.35* 11.10 ± 0.35 10.84 ± 0.54 10.73 ± 0.43 10.54 ± 0.52 Week 14 9.32 ± 0.35 8.32 ± 0.40 8.73 ± 0.35 11.19 ± 0.70 10.07 ± 0.32 9.41 ± 0.45
Segmented neutrophils (103/µL) Day 4 1.02 ± 0.06 1.10 ± 0.16 0.83 ± 0.08 0.96 ± 0.06 0.96 ± 0.10 1.28 ± 0.10 Day 22 1.06 ± 0.11 0.88 ± 0.11 0.97 ± 0.14 0.91 ± 0.16 0.78 ± 0.07 0.79 ± 0.11 Week 14 1.57 ± 0.12 1.42 ± 0.09 1.41 ± 0.08 1.93 ± 0.20 1.40 ± 0.11 1.29 ± 0.09
Bands (103/µL) Day 4 0.00 ± 0.00 0.00 ± 0.00 0.00 ± 0.00 0.00 ± 0.00 0.00 ± 0.00 0.00 ± 0.00 Day 22 0.00 ± 0.00 0.00 ± 0.00 0.00 ± 0.00 0.00 ± 0.00 0.00 ± 0.00 0.00 ± 0.00 Week 14 0.00 ± 0.00 0.00 ± 0.00 0.00 ± 0.00 0.00 ± 0.00 0.00 ± 0.00 0.00 ± 0.00
Lymphocytes (103/µL) Day 4 6.96 ± 0.37 6.37 ± 0.42 6.46 ± 0.49 7.14 ± 0.42 6.41 ± 0.31 8.42 ± 0.71 Day 22 10.20 ± 0.27 9.01 ± 0.31 9.78 ± 0.32 9.67 ± 0.50 9.59 ± 0.45 9.45 ± 0.47 Week 14 7.57 ± 0.39 6.73 ± 0.33 7.11 ± 0.34 9.11 ± 0.55 8.47 ± 0.29 7.95 ± 0.37
Monocytes (103/µL) Day 4 0.09 ± 0.02 0.14 ± 0.03 0.13 ± 0.04 0.09 ± 0.02 0.15 ± 0.02 0.16 ± 0.04 Day 22 0.34 ± 0.05 0.21 ± 0.08 0.24 ± 0.06 0.15 ± 0.05 0.30 ± 0.04 0.28 ± 0.06 Week 14 0.15 ± 0.04 0.12 ± 0.03 0.13 ± 0.02 0.14 ± 0.03 0.13 ± 0.02 0.12 ± 0.03
Basophils (103/µL) Day 4 0.000 ± 0.000 0.000 ± 0.000 0.000 ± 0.000 0.000 ± 0.000 0.000 ± 0.000 0.000 ± 0.000 Day 22 0.000 ± 0.000 0.000 ± 0.000 0.000 ± 0.000 0.000 ± 0.000 0.000 ± 0.000 0.000 ± 0.000 Week 14 0.000 ± 0.000 0.000 ± 0.000 0.000 ± 0.000 0.000 ± 0.000 0.000 ± 0.000 0.000 ± 0.000
Eosinophils (103/µL) Day 4 0.06 ± 0.03 0.02 ± 0.01 0.04 ± 0.01 0.04 ± 0.02 0.02 ± 0.01 0.01 ± 0.01 Day 22 0.09 ± 0.04 0.03 ± 0.02 0.11 ± 0.04 0.12 ± 0.06 0.07 ± 0.02 0.03 ± 0.03 Week 14 0.03 ± 0.02 0.05 ± 0.02 0.07 ± 0.02 0.01 ± 0.01 0.07 ± 0.02 0.05 ± 0.02
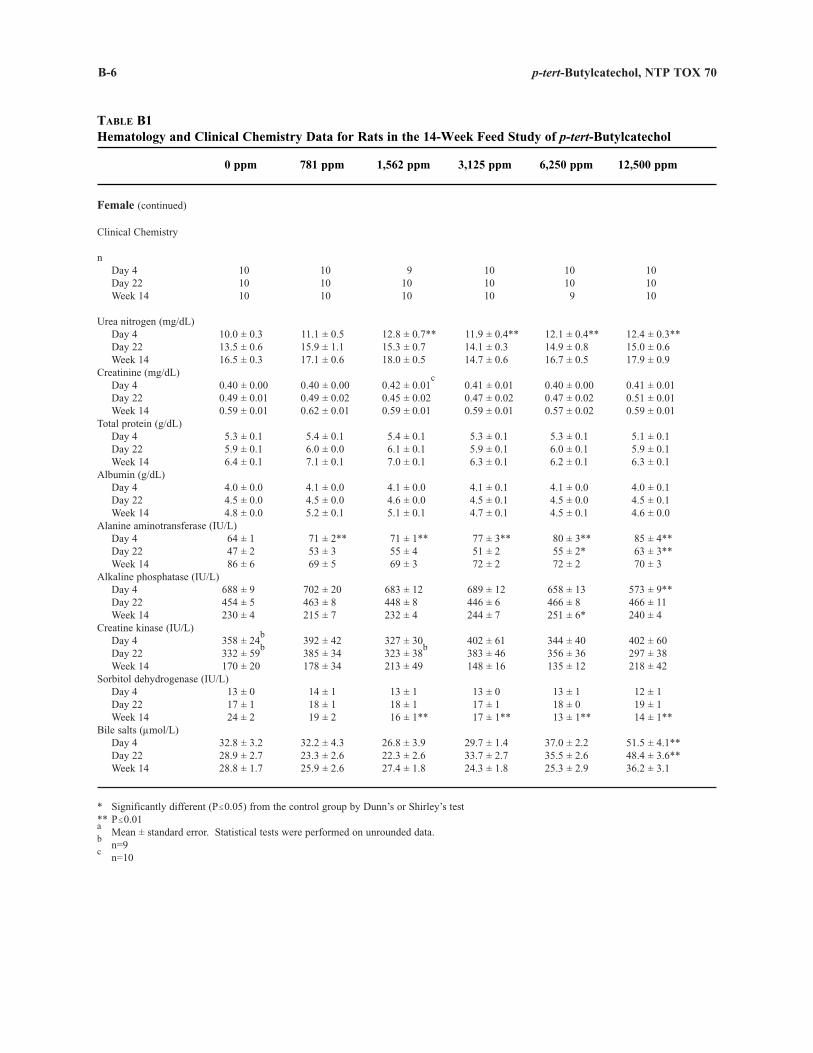
B-6 p-tert-Butylcatechol, NTP TOX 70
TABLE B1 Hematology and Clinical Chemistry Data for Rats in the 14-Week Feed Study of p-tert-Butylcatechol
0 ppm 781 ppm 1,562 ppm 3,125 ppm 6,250 ppm 12,500 ppm
Female (continued)
Clinical Chemistry
n Day 4 10 10 9 10 10 10 Day 22 10 10 10 10 10 10 Week 14 10 10 10 10 9 10
Urea nitrogen (mg/dL) Day 4 10.0 ± 0.3 11.1 ± 0.5 12.8 ± 0.7** 11.9 ± 0.4** 12.1 ± 0.4** 12.4 ± 0.3** Day 22 13.5 ± 0.6 15.9 ± 1.1 15.3 ± 0.7 14.1 ± 0.3 14.9 ± 0.8 15.0 ± 0.6 Week 14 16.5 ± 0.3 17.1 ± 0.6 18.0 ± 0.5 14.7 ± 0.6 16.7 ± 0.5 17.9 ± 0.9
Creatinine (mg/dL) c Day 4 0.40 ± 0.00 0.40 ± 0.00 0.42 ± 0.01 0.41 ± 0.01 0.40 ± 0.00 0.41 ± 0.01 Day 22 0.49 ± 0.01 0.49 ± 0.02 0.45 ± 0.02 0.47 ± 0.02 0.47 ± 0.02 0.51 ± 0.01 Week 14 0.59 ± 0.01 0.62 ± 0.01 0.59 ± 0.01 0.59 ± 0.01 0.57 ± 0.02 0.59 ± 0.01
Total protein (g/dL) Day 4 5.3 ± 0.1 5.4 ± 0.1 5.4 ± 0.1 5.3 ± 0.1 5.3 ± 0.1 5.1 ± 0.1 Day 22 5.9 ± 0.1 6.0 ± 0.0 6.1 ± 0.1 5.9 ± 0.1 6.0 ± 0.1 5.9 ± 0.1 Week 14 6.4 ± 0.1 7.1 ± 0.1 7.0 ± 0.1 6.3 ± 0.1 6.2 ± 0.1 6.3 ± 0.1
Albumin (g/dL) Day 4 4.0 ± 0.0 4.1 ± 0.0 4.1 ± 0.0 4.1 ± 0.1 4.1 ± 0.0 4.0 ± 0.1 Day 22 4.5 ± 0.0 4.5 ± 0.0 4.6 ± 0.0 4.5 ± 0.1 4.5 ± 0.0 4.5 ± 0.1 Week 14 4.8 ± 0.0 5.2 ± 0.1 5.1 ± 0.1 4.7 ± 0.1 4.5 ± 0.1 4.6 ± 0.0
Alanine aminotransferase (IU/L) Day 4 64 ± 1 71 ± 2** 71 ± 1** 77 ± 3** 80 ± 3** 85 ± 4** Day 22 47 ± 2 53 ± 3 55 ± 4 51 ± 2 55 ± 2* 63 ± 3** Week 14 86 ± 6 69 ± 5 69 ± 3 72 ± 2 72 ± 2 70 ± 3
Alkaline phosphatase (IU/L) Day 4 688 ± 9 702 ± 20 683 ± 12 689 ± 12 658 ± 13 573 ± 9** Day 22 454 ± 5 463 ± 8 448 ± 8 446 ± 6 466 ± 8 466 ± 11 Week 14 230 ± 4 215 ± 7 232 ± 4 244 ± 7 251 ± 6* 240 ± 4
Creatine kinase (IU/L) Day 4 Day 22
358 ± 24b
332 ± 59b
392 ± 42 385 ± 34
327 ± 30 323 ± 38
b 402 ± 61 383 ± 46
344 ± 40 356 ± 36
402 ± 60 297 ± 38
Week 14 170 ± 20 178 ± 34 213 ± 49 148 ± 16 135 ± 12 218 ± 42 Sorbitol dehydrogenase (IU/L)
Day 4 13 ± 0 14 ± 1 13 ± 1 13 ± 0 13 ± 1 12 ± 1 Day 22 17 ± 1 18 ± 1 18 ± 1 17 ± 1 18 ± 0 19 ± 1 Week 14 24 ± 2 19 ± 2 16 ± 1** 17 ± 1** 13 ± 1** 14 ± 1**
Bile salts (µmol/L) Day 4 32.8 ± 3.2 32.2 ± 4.3 26.8 ± 3.9 29.7 ± 1.4 37.0 ± 2.2 51.5 ± 4.1** Day 22 28.9 ± 2.7 23.3 ± 2.6 22.3 ± 2.6 33.7 ± 2.7 35.5 ± 2.6 48.4 ± 3.6** Week 14 28.8 ± 1.7 25.9 ± 2.6 27.4 ± 1.8 24.3 ± 1.8 25.3 ± 2.9 36.2 ± 3.1
* Significantly different (P#0.05) from the control group by Dunn’s or Shirley’s test ** P#0.01 a
Mean ± standard error. Statistical tests were performed on unrounded data.b
n=9 n=10
c
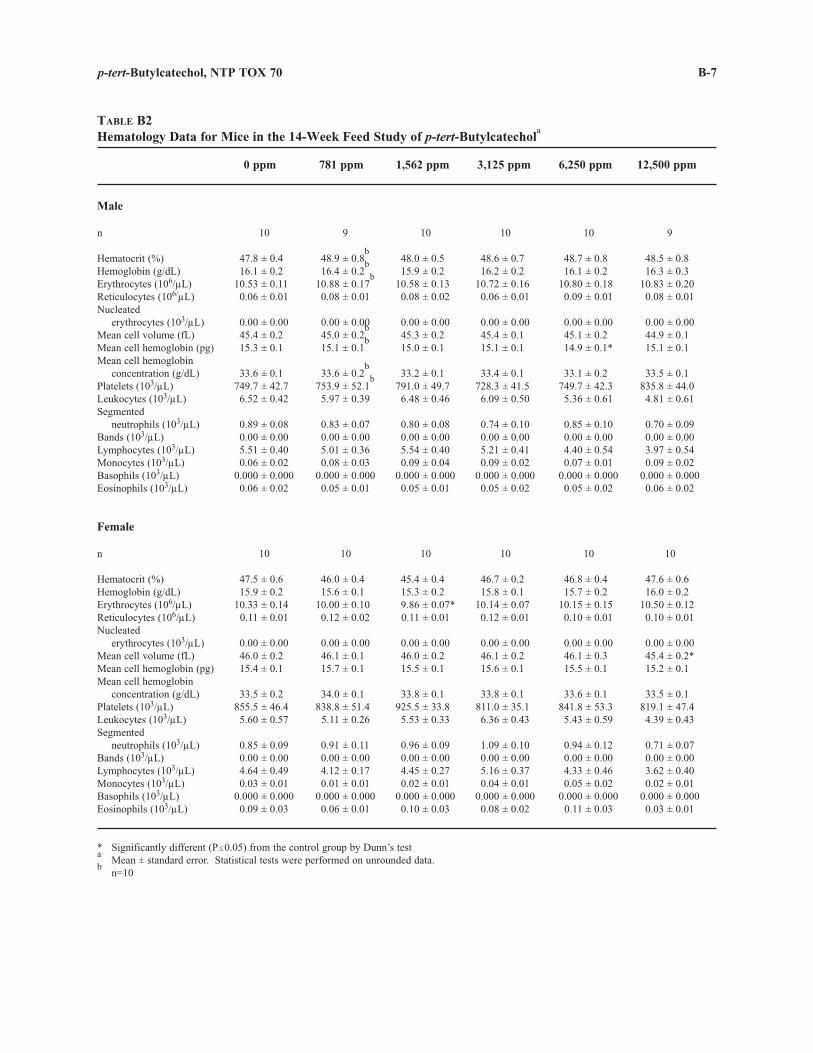
B-7 p-tert-Butylcatechol, NTP TOX 70
TABLE B2 Hematology Data for Mice in the 14-Week Feed Study of p-tert-Butylcatechol
a
0 ppm 781 ppm 1,562 ppm 3,125 ppm 6,250 ppm 12,500 ppm
Male
n 10 9 10 10 10 9
b Hematocrit (%) 47.8 ± 0.4 48.9 ± 0.8b 48.0 ± 0.5 48.6 ± 0.7 48.7 ± 0.8 48.5 ± 0.8 Hemoglobin (g/dL) Erythrocytes (106/µL)
16.1 ± 0.2 10.53 ± 0.11
16.4 ± 0.2 10.88 ± 0.17
b 15.9 ± 0.2 10.58 ± 0.13
16.2 ± 0.2 10.72 ± 0.16
16.1 ± 0.2 10.80 ± 0.18
16.3 ± 0.3 10.83 ± 0.20
Reticulocytes (106/µL) 0.06 ± 0.01 0.08 ± 0.01 0.08 ± 0.02 0.06 ± 0.01 0.09 ± 0.01 0.08 ± 0.01 Nucleated
erythrocytes (103/µL) 0.00 ± 0.00 0.00 ± 0.00b 0.00 ± 0.00 0.00 ± 0.00 0.00 ± 0.00 0.00 ± 0.00 Mean cell volume (fL) 45.4 ± 0.2 45.0 ± 0.2b 45.3 ± 0.2 45.4 ± 0.1 45.1 ± 0.2 44.9 ± 0.1 Mean cell hemoglobin (pg) 15.3 ± 0.1 15.1 ± 0.1 15.0 ± 0.1 15.1 ± 0.1 14.9 ± 0.1* 15.1 ± 0.1 Mean cell hemoglobin b
concentration (g/dL) Platelets (103/µL)
33.6 ± 0.1 749.7 ± 42.7
33.6 ± 0.2 753.9 ± 52.1
b 33.2 ± 0.1 791.0 ± 49.7
33.4 ± 0.1 728.3 ± 41.5
33.1 ± 0.2 749.7 ± 42.3
33.5 ± 0.1 835.8 ± 44.0
Leukocytes (103/µL) 6.52 ± 0.42 5.97 ± 0.39 6.48 ± 0.46 6.09 ± 0.50 5.36 ± 0.61 4.81 ± 0.61 Segmented
neutrophils (103/µL) 0.89 ± 0.08 0.83 ± 0.07 0.80 ± 0.08 0.74 ± 0.10 0.85 ± 0.10 0.70 ± 0.09 Bands (103/µL) 0.00 ± 0.00 0.00 ± 0.00 0.00 ± 0.00 0.00 ± 0.00 0.00 ± 0.00 0.00 ± 0.00 Lymphocytes (103/µL) 5.51 ± 0.40 5.01 ± 0.36 5.54 ± 0.40 5.21 ± 0.41 4.40 ± 0.54 3.97 ± 0.54 Monocytes (103/µL) 0.06 ± 0.02 0.08 ± 0.03 0.09 ± 0.04 0.09 ± 0.02 0.07 ± 0.01 0.09 ± 0.02 Basophils (103/µL) 0.000 ± 0.000 0.000 ± 0.000 0.000 ± 0.000 0.000 ± 0.000 0.000 ± 0.000 0.000 ± 0.000 Eosinophils (103/µL) 0.06 ± 0.02 0.05 ± 0.01 0.05 ± 0.01 0.05 ± 0.02 0.05 ± 0.02 0.06 ± 0.02
Female
n 10 10 10 10 10 10
Hematocrit (%) 47.5 ± 0.6 46.0 ± 0.4 45.4 ± 0.4 46.7 ± 0.2 46.8 ± 0.4 47.6 ± 0.6 Hemoglobin (g/dL) 15.9 ± 0.2 15.6 ± 0.1 15.3 ± 0.2 15.8 ± 0.1 15.7 ± 0.2 16.0 ± 0.2 Erythrocytes (106/µL) 10.33 ± 0.14 10.00 ± 0.10 9.86 ± 0.07* 10.14 ± 0.07 10.15 ± 0.15 10.50 ± 0.12 Reticulocytes (106/µL) 0.11 ± 0.01 0.12 ± 0.02 0.11 ± 0.01 0.12 ± 0.01 0.10 ± 0.01 0.10 ± 0.01 Nucleated
erythrocytes (103/µL) 0.00 ± 0.00 0.00 ± 0.00 0.00 ± 0.00 0.00 ± 0.00 0.00 ± 0.00 0.00 ± 0.00 Mean cell volume (fL) 46.0 ± 0.2 46.1 ± 0.1 46.0 ± 0.2 46.1 ± 0.2 46.1 ± 0.3 45.4 ± 0.2* Mean cell hemoglobin (pg) 15.4 ± 0.1 15.7 ± 0.1 15.5 ± 0.1 15.6 ± 0.1 15.5 ± 0.1 15.2 ± 0.1 Mean cell hemoglobin
concentration (g/dL) 33.5 ± 0.2 34.0 ± 0.1 33.8 ± 0.1 33.8 ± 0.1 33.6 ± 0.1 33.5 ± 0.1 Platelets (103/µL) 855.5 ± 46.4 838.8 ± 51.4 925.5 ± 33.8 811.0 ± 35.1 841.8 ± 53.3 819.1 ± 47.4 Leukocytes (103/µL) 5.60 ± 0.57 5.11 ± 0.26 5.53 ± 0.33 6.36 ± 0.43 5.43 ± 0.59 4.39 ± 0.43 Segmented
neutrophils (103/µL) 0.85 ± 0.09 0.91 ± 0.11 0.96 ± 0.09 1.09 ± 0.10 0.94 ± 0.12 0.71 ± 0.07 Bands (103/µL) 0.00 ± 0.00 0.00 ± 0.00 0.00 ± 0.00 0.00 ± 0.00 0.00 ± 0.00 0.00 ± 0.00 Lymphocytes (103/µL) 4.64 ± 0.49 4.12 ± 0.17 4.45 ± 0.27 5.16 ± 0.37 4.33 ± 0.46 3.62 ± 0.40 Monocytes (103/µL) 0.03 ± 0.01 0.01 ± 0.01 0.02 ± 0.01 0.04 ± 0.01 0.05 ± 0.02 0.02 ± 0.01 Basophils (103/µL) 0.000 ± 0.000 0.000 ± 0.000 0.000 ± 0.000 0.000 ± 0.000 0.000 ± 0.000 0.000 ± 0.000 Eosinophils (103/µL) 0.09 ± 0.03 0.06 ± 0.01 0.10 ± 0.03 0.08 ± 0.02 0.11 ± 0.03 0.03 ± 0.01
* Significantly different (P#0.05) from the control group by Dunn’s test a
Mean ± standard error. Statistical tests were performed on unrounded data.b
n=10

B-8 p-tert-Butylcatechol, NTP TOX 70
C-1
APPENDIX C ORGAN WEIGHTS
AND ORGAN-WEIGHT-TO-BODY-WEIGHT RATIOS
TABLE C1 Organ Weights and Organ-Weight-to-Body-Weight Ratios for Rats in the 15-Day Feed Study of p-tert-Butylcatechol . . . . . . . . . . . . . . . . . . . . . . . . . . . . . . . . . C-2
TABLE C2 Organ Weights and Organ-Weight-to-Body-Weight Ratios for Rats in the 14-Week Feed Study of p-tert-Butylcatechol . . . . . . . . . . . . . . . . . . . . . . . . . . . . . . . . C-3
TABLE C3 Organ Weights and Organ-Weight-to-Body-Weight Ratios for Mice in the 15-Day Feed Study of p-tert-Butylcatechol . . . . . . . . . . . . . . . . . . . . . . . . . . . . . . . . . C-4
TABLE C4 Organ Weights and Organ-Weight-to-Body-Weight Ratios for Mice in the 14-Week Feed Study of p-tert-Butylcatechol . . . . . . . . . . . . . . . . . . . . . . . . . . . . . . . . C-5
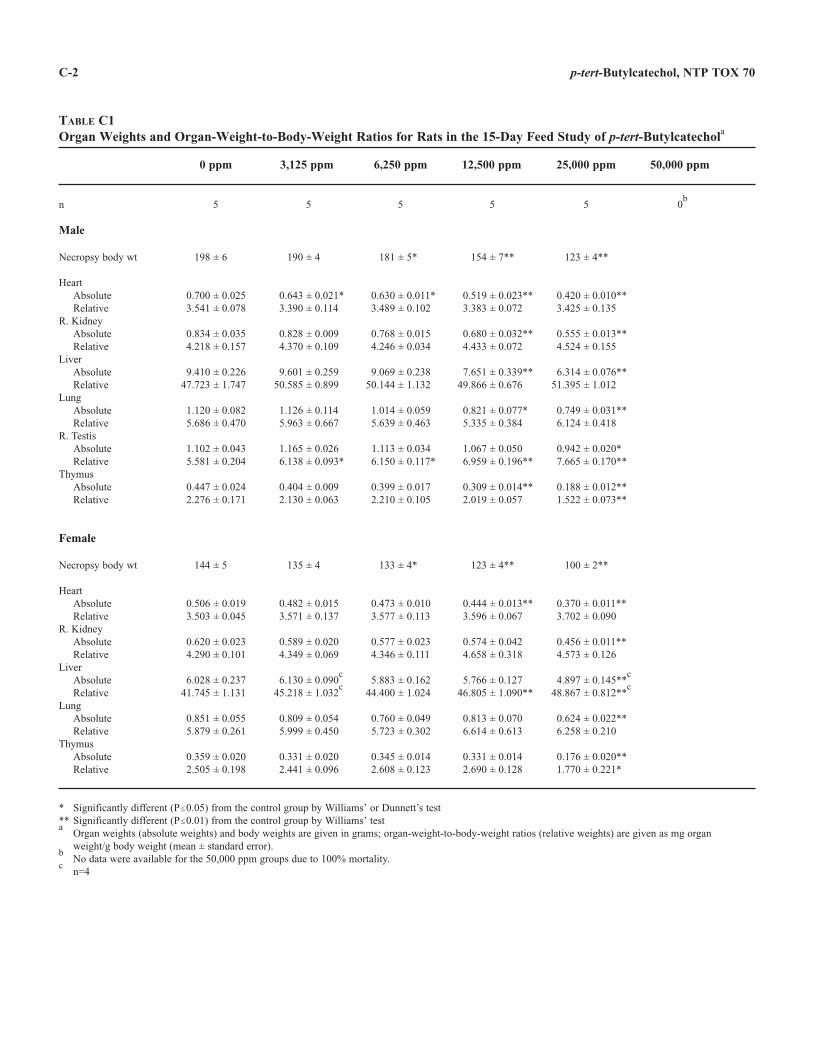
C-2 p-tert-Butylcatechol, NTP TOX 70
TABLE C1 Organ Weights and Organ-Weight-to-Body-Weight Ratios for Rats in the 15-Day Feed Study of p-tert-Butylcatechola
0 ppm 3,125 ppm 6,250 ppm 12,500 ppm 25,000 ppm 50,000 ppm
n 5 5 5 5 5 0b
Male
Necropsy body wt 198 ± 6 190 ± 4 181 ± 5* 154 ± 7** 123 ± 4**
Heart Absolute 0.700 ± 0.025 0.643 ± 0.021* 0.630 ± 0.011* 0.519 ± 0.023** 0.420 ± 0.010** Relative 3.541 ± 0.078 3.390 ± 0.114 3.489 ± 0.102 3.383 ± 0.072 3.425 ± 0.135
R. Kidney Absolute 0.834 ± 0.035 0.828 ± 0.009 0.768 ± 0.015 0.680 ± 0.032** 0.555 ± 0.013** Relative 4.218 ± 0.157 4.370 ± 0.109 4.246 ± 0.034 4.433 ± 0.072 4.524 ± 0.155
Liver Absolute 9.410 ± 0.226 9.601 ± 0.259 9.069 ± 0.238 7.651 ± 0.339** 6.314 ± 0.076** Relative 47.723 ± 1.747 50.585 ± 0.899 50.144 ± 1.132 49.866 ± 0.676 51.395 ± 1.012
Lung Absolute 1.120 ± 0.082 1.126 ± 0.114 1.014 ± 0.059 0.821 ± 0.077* 0.749 ± 0.031** Relative 5.686 ± 0.470 5.963 ± 0.667 5.639 ± 0.463 5.335 ± 0.384 6.124 ± 0.418
R. Testis Absolute 1.102 ± 0.043 1.165 ± 0.026 1.113 ± 0.034 1.067 ± 0.050 0.942 ± 0.020* Relative 5.581 ± 0.204 6.138 ± 0.093* 6.150 ± 0.117* 6.959 ± 0.196** 7.665 ± 0.170**
Thymus Absolute 0.447 ± 0.024 0.404 ± 0.009 0.399 ± 0.017 0.309 ± 0.014** 0.188 ± 0.012** Relative 2.276 ± 0.171 2.130 ± 0.063 2.210 ± 0.105 2.019 ± 0.057 1.522 ± 0.073**
Female
Necropsy body wt 144 ± 5 135 ± 4 133 ± 4* 123 ± 4** 100 ± 2**
Heart Absolute 0.506 ± 0.019 0.482 ± 0.015 0.473 ± 0.010 0.444 ± 0.013** 0.370 ± 0.011** Relative 3.503 ± 0.045 3.571 ± 0.137 3.577 ± 0.113 3.596 ± 0.067 3.702 ± 0.090
R. Kidney Absolute 0.620 ± 0.023 0.589 ± 0.020 0.577 ± 0.023 0.574 ± 0.042 0.456 ± 0.011** Relative 4.290 ± 0.101 4.349 ± 0.069 4.346 ± 0.111 4.658 ± 0.318 4.573 ± 0.126
Liver Absolute 6.028 ± 0.237 6.130 ± 0.090
c 5.883 ± 0.162 5.766 ± 0.127 4.897 ± 0.145**
c
Relative 41.745 ± 1.131 45.218 ± 1.032c
44.400 ± 1.024 46.805 ± 1.090** 48.867 ± 0.812**c
Lung Absolute 0.851 ± 0.055 0.809 ± 0.054 0.760 ± 0.049 0.813 ± 0.070 0.624 ± 0.022** Relative 5.879 ± 0.261 5.999 ± 0.450 5.723 ± 0.302 6.614 ± 0.613 6.258 ± 0.210
Thymus Absolute 0.359 ± 0.020 0.331 ± 0.020 0.345 ± 0.014 0.331 ± 0.014 0.176 ± 0.020** Relative 2.505 ± 0.198 2.441 ± 0.096 2.608 ± 0.123 2.690 ± 0.128 1.770 ± 0.221*
* Significantly different (P#0.05) from the control group by Williams’ or Dunnett’s test ** Significantly different (P#0.01) from the control group by Williams’ test a
Organ weights (absolute weights) and body weights are given in grams; organ-weight-to-body-weight ratios (relative weights) are given as mg organ weight/g body weight (mean ± standard error).
b No data were available for the 50,000 ppm groups due to 100% mortality. n=4
c
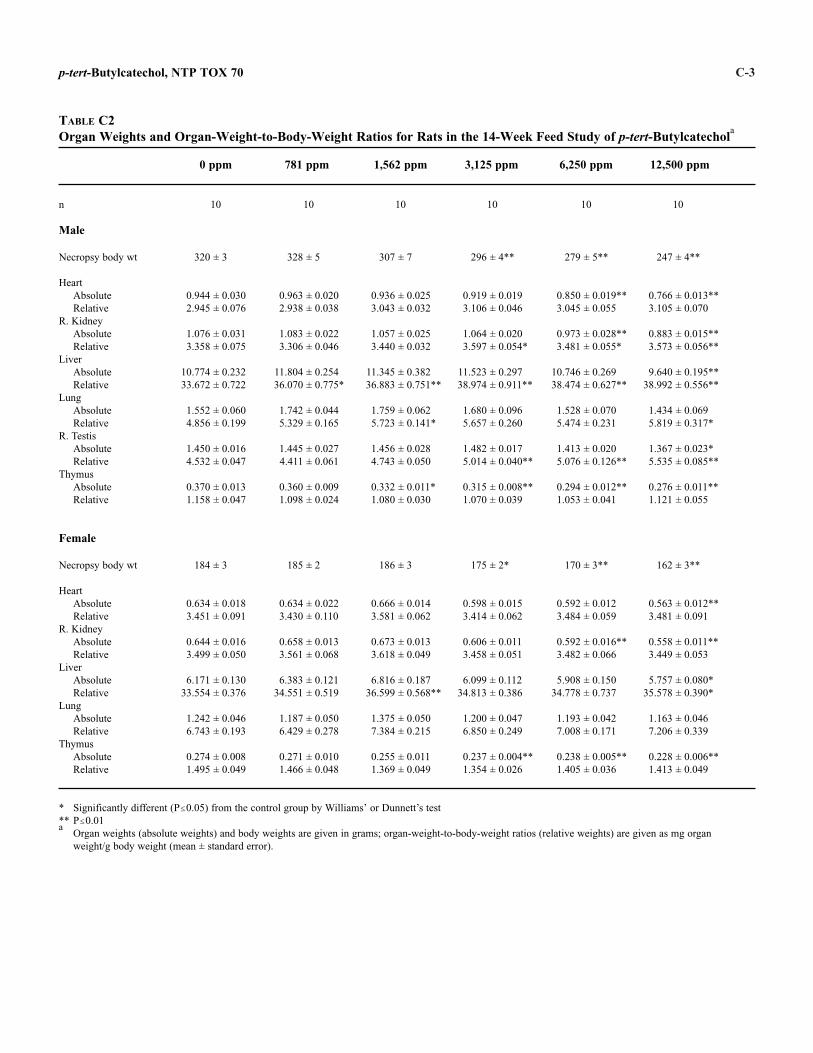
C-3 p-tert-Butylcatechol, NTP TOX 70
TABLE C2 Organ Weights and Organ-Weight-to-Body-Weight Ratios for Rats in the 14-Week Feed Study of p-tert-Butylcatechol
a
0 ppm 781 ppm 1,562 ppm 3,125 ppm 6,250 ppm 12,500 ppm
n 10 10 10 10 10 10
Male
Necropsy body wt 320 ± 3 328 ± 5 307 ± 7 296 ± 4** 279 ± 5** 247 ± 4**
Heart Absolute 0.944 ± 0.030 0.963 ± 0.020 0.936 ± 0.025 0.919 ± 0.019 0.850 ± 0.019** 0.766 ± 0.013** Relative 2.945 ± 0.076 2.938 ± 0.038 3.043 ± 0.032 3.106 ± 0.046 3.045 ± 0.055 3.105 ± 0.070
R. Kidney Absolute 1.076 ± 0.031 1.083 ± 0.022 1.057 ± 0.025 1.064 ± 0.020 0.973 ± 0.028** 0.883 ± 0.015** Relative 3.358 ± 0.075 3.306 ± 0.046 3.440 ± 0.032 3.597 ± 0.054* 3.481 ± 0.055* 3.573 ± 0.056**
Liver Absolute 10.774 ± 0.232 11.804 ± 0.254 11.345 ± 0.382 11.523 ± 0.297 10.746 ± 0.269 9.640 ± 0.195** Relative 33.672 ± 0.722 36.070 ± 0.775* 36.883 ± 0.751** 38.974 ± 0.911** 38.474 ± 0.627** 38.992 ± 0.556**
Lung Absolute 1.552 ± 0.060 1.742 ± 0.044 1.759 ± 0.062 1.680 ± 0.096 1.528 ± 0.070 1.434 ± 0.069 Relative 4.856 ± 0.199 5.329 ± 0.165 5.723 ± 0.141* 5.657 ± 0.260 5.474 ± 0.231 5.819 ± 0.317*
R. Testis Absolute 1.450 ± 0.016 1.445 ± 0.027 1.456 ± 0.028 1.482 ± 0.017 1.413 ± 0.020 1.367 ± 0.023* Relative 4.532 ± 0.047 4.411 ± 0.061 4.743 ± 0.050 5.014 ± 0.040** 5.076 ± 0.126** 5.535 ± 0.085**
Thymus Absolute 0.370 ± 0.013 0.360 ± 0.009 0.332 ± 0.011* 0.315 ± 0.008** 0.294 ± 0.012** 0.276 ± 0.011** Relative 1.158 ± 0.047 1.098 ± 0.024 1.080 ± 0.030 1.070 ± 0.039 1.053 ± 0.041 1.121 ± 0.055
Female
Necropsy body wt 184 ± 3 185 ± 2 186 ± 3 175 ± 2* 170 ± 3** 162 ± 3**
Heart Absolute 0.634 ± 0.018 0.634 ± 0.022 0.666 ± 0.014 0.598 ± 0.015 0.592 ± 0.012 0.563 ± 0.012** Relative 3.451 ± 0.091 3.430 ± 0.110 3.581 ± 0.062 3.414 ± 0.062 3.484 ± 0.059 3.481 ± 0.091
R. Kidney Absolute 0.644 ± 0.016 0.658 ± 0.013 0.673 ± 0.013 0.606 ± 0.011 0.592 ± 0.016** 0.558 ± 0.011** Relative 3.499 ± 0.050 3.561 ± 0.068 3.618 ± 0.049 3.458 ± 0.051 3.482 ± 0.066 3.449 ± 0.053
Liver Absolute 6.171 ± 0.130 6.383 ± 0.121 6.816 ± 0.187 6.099 ± 0.112 5.908 ± 0.150 5.757 ± 0.080* Relative 33.554 ± 0.376 34.551 ± 0.519 36.599 ± 0.568** 34.813 ± 0.386 34.778 ± 0.737 35.578 ± 0.390*
Lung Absolute 1.242 ± 0.046 1.187 ± 0.050 1.375 ± 0.050 1.200 ± 0.047 1.193 ± 0.042 1.163 ± 0.046 Relative 6.743 ± 0.193 6.429 ± 0.278 7.384 ± 0.215 6.850 ± 0.249 7.008 ± 0.171 7.206 ± 0.339
Thymus Absolute 0.274 ± 0.008 0.271 ± 0.010 0.255 ± 0.011 0.237 ± 0.004** 0.238 ± 0.005** 0.228 ± 0.006** Relative 1.495 ± 0.049 1.466 ± 0.048 1.369 ± 0.049 1.354 ± 0.026 1.405 ± 0.036 1.413 ± 0.049
* Significantly different (P#0.05) from the control group by Williams’ or Dunnett’s test ** P#0.01 a
Organ weights (absolute weights) and body weights are given in grams; organ-weight-to-body-weight ratios (relative weights) are given as mg organ weight/g body weight (mean ± standard error).

C-4 p-tert-Butylcatechol, NTP TOX 70
TABLE C3 Organ Weights and Organ-Weight-to-Body-Weight Ratios for Mice in the 15-Day Feed Study of p-tert-Butylcatechola
0 ppm 3,125 ppm 6,250 ppm 12,500 ppm 25,000 ppm 50,000 ppm
n 5 5 5 5 5 0b
Male
Necropsy body wt 23.4 ± 1.1 23.3 ± 0.4 22.9 ± 0.5 20.4 ± 0.6** 16.6 ± 0.5**
Heart Absolute 0.121 ± 0.006 0.118 ± 0.003 0.115 ± 0.003 0.105 ± 0.001* 0.096 ± 0.006** Relative 5.161 ± 0.095 5.083 ± 0.132 5.049 ± 0.130 5.146 ± 0.118 5.768 ± 0.253*
R. Kidney Absolute 0.228 ± 0.011 0.225 ± 0.008 0.210 ± 0.009 0.185 ± 0.005** 0.148 ± 0.009** Relative 9.742 ± 0.222 9.651 ± 0.306 9.175 ± 0.297 9.100 ± 0.292 8.897 ± 0.327
Liver Absolute 1.208 ± 0.060 1.316 ± 0.033 1.396 ± 0.018* 1.303 ± 0.056 1.134 ± 0.058 Relative 51.493 ± 0.319 56.497 ± 0.502** 61.063 ± 0.819** 63.844 ± 0.946** 68.076 ± 2.388**
Lung Absolute 0.166 ± 0.010 0.154 ± 0.005 0.161 ± 0.004 0.163 ± 0.009 0.136 ± 0.007* Relative 7.065 ± 0.130 6.613 ± 0.172 7.051 ± 0.253 8.000 ± 0.320* 8.140 ± 0.278**
R. Testis Absolute 0.100 ± 0.004 0.100 ± 0.003 0.097 ± 0.002 0.098 ± 0.001 0.091 ± 0.002 Relative 4.303 ± 0.188 4.312 ± 0.074 4.241 ± 0.074 4.828 ± 0.165* 5.476 ± 0.119**
Thymus Absolute 0.046 ± 0.003 0.046 ± 0.003 0.051 ± 0.002 0.035 ± 0.004* 0.012 ± 0.002** Relative 1.992 ± 0.141 1.985 ± 0.125 2.240 ± 0.087 1.695 ± 0.173 0.719 ± 0.131**
Female
Necropsy body wt 20.6 ± 0.3 20.1 ± 0.6 20.1 ± 0.6 18.9 ± 0.6 14.1 ± 0.6**
Heart Absolute 0.105 ± 0.002 0.100 ± 0.003 0.100 ± 0.003 0.090 ± 0.003** 0.086 ± 0.005** Relative 5.108 ± 0.064 4.987 ± 0.074 4.996 ± 0.140 4.783 ± 0.092 6.082 ± 0.262**
R. Kidney Absolute 0.152 ± 0.003 0.148 ± 0.003 0.143 ± 0.004 0.134 ± 0.006** 0.114 ± 0.005** Relative 7.402 ± 0.071 7.368 ± 0.132 7.111 ± 0.158 7.084 ± 0.175 8.078 ± 0.214*
Liver Absolute 0.975 ± 0.043 1.003 ± 0.044 1.076 ± 0.033 1.048 ± 0.033 0.885 ± 0.040 Relative 47.357 ± 1.640 49.936 ± 1.094 53.634 ± 1.210** 55.560 ± 1.015** 62.675 ± 0.721**
Lung Absolute 0.153 ± 0.005 0.143 ± 0.005 0.148 ± 0.004 0.164 ± 0.021 0.137 ± 0.005 Relative 7.434 ± 0.213 7.146 ± 0.295 7.394 ± 0.326 8.680 ± 1.013 9.806 ± 0.641*
Thymus Absolute 0.070 ± 0.003 0.068 ± 0.004 0.062 ± 0.004 0.073 ± 0.002 0.012 ± 0.002** Relative 3.394 ± 0.182 3.412 ± 0.210 3.085 ± 0.128 3.856 ± 0.109 0.809 ± 0.102**
* Significantly different (P#0.05) from the control group by Williams’ or Dunnett’s test ** P#0.01 a
Organ weights (absolute weights) and body weights are given in grams; organ-weight-to-body-weight ratios (relative weights) are given as mg organ weight/g body weight (mean ± standard error).
b No data were available for the 50,000 ppm groups due to 100% mortality.
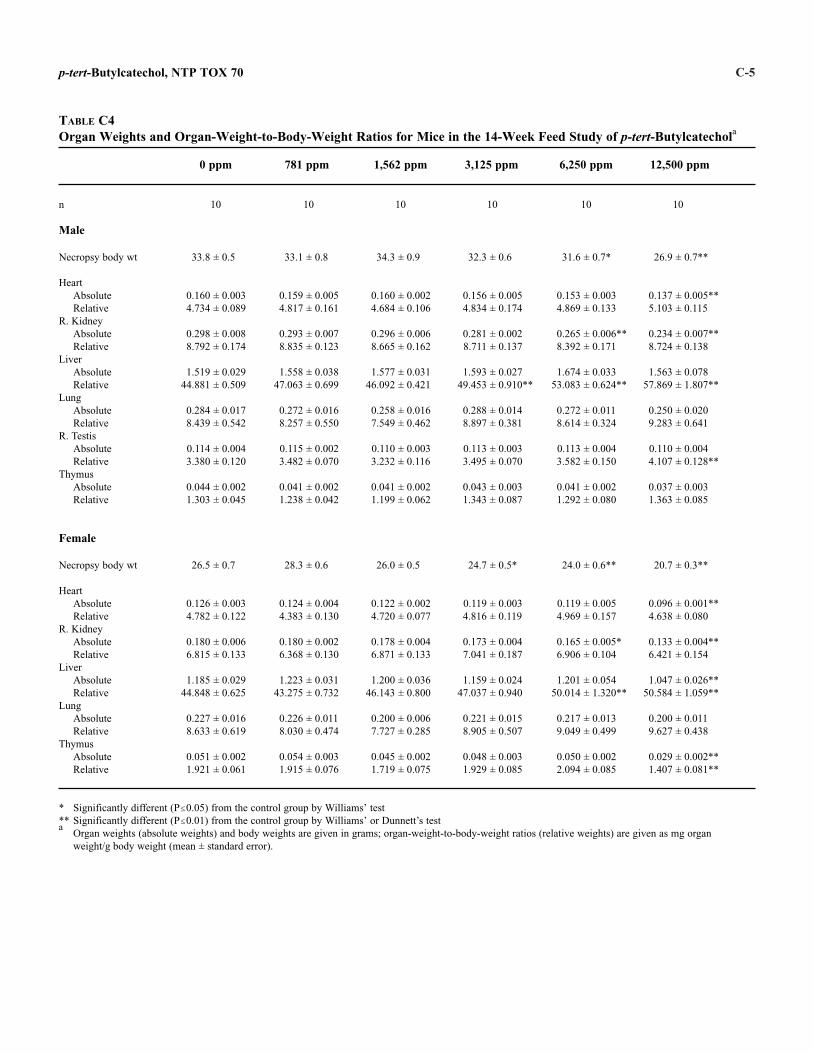
C-5 p-tert-Butylcatechol, NTP TOX 70
TABLE C4 Organ Weights and Organ-Weight-to-Body-Weight Ratios for Mice in the 14-Week Feed Study of p-tert-Butylcatechola
0 ppm 781 ppm 1,562 ppm 3,125 ppm 6,250 ppm 12,500 ppm
n 10 10 10 10 10 10
Male
Necropsy body wt 33.8 ± 0.5 33.1 ± 0.8 34.3 ± 0.9 32.3 ± 0.6 31.6 ± 0.7* 26.9 ± 0.7**
Heart Absolute 0.160 ± 0.003 0.159 ± 0.005 0.160 ± 0.002 0.156 ± 0.005 0.153 ± 0.003 0.137 ± 0.005** Relative 4.734 ± 0.089 4.817 ± 0.161 4.684 ± 0.106 4.834 ± 0.174 4.869 ± 0.133 5.103 ± 0.115
R. Kidney Absolute 0.298 ± 0.008 0.293 ± 0.007 0.296 ± 0.006 0.281 ± 0.002 0.265 ± 0.006** 0.234 ± 0.007** Relative 8.792 ± 0.174 8.835 ± 0.123 8.665 ± 0.162 8.711 ± 0.137 8.392 ± 0.171 8.724 ± 0.138
Liver Absolute 1.519 ± 0.029 1.558 ± 0.038 1.577 ± 0.031 1.593 ± 0.027 1.674 ± 0.033 1.563 ± 0.078 Relative 44.881 ± 0.509 47.063 ± 0.699 46.092 ± 0.421 49.453 ± 0.910** 53.083 ± 0.624** 57.869 ± 1.807**
Lung Absolute 0.284 ± 0.017 0.272 ± 0.016 0.258 ± 0.016 0.288 ± 0.014 0.272 ± 0.011 0.250 ± 0.020 Relative 8.439 ± 0.542 8.257 ± 0.550 7.549 ± 0.462 8.897 ± 0.381 8.614 ± 0.324 9.283 ± 0.641
R. Testis Absolute 0.114 ± 0.004 0.115 ± 0.002 0.110 ± 0.003 0.113 ± 0.003 0.113 ± 0.004 0.110 ± 0.004 Relative 3.380 ± 0.120 3.482 ± 0.070 3.232 ± 0.116 3.495 ± 0.070 3.582 ± 0.150 4.107 ± 0.128**
Thymus Absolute 0.044 ± 0.002 0.041 ± 0.002 0.041 ± 0.002 0.043 ± 0.003 0.041 ± 0.002 0.037 ± 0.003 Relative 1.303 ± 0.045 1.238 ± 0.042 1.199 ± 0.062 1.343 ± 0.087 1.292 ± 0.080 1.363 ± 0.085
Female
Necropsy body wt 26.5 ± 0.7 28.3 ± 0.6 26.0 ± 0.5 24.7 ± 0.5* 24.0 ± 0.6** 20.7 ± 0.3**
Heart Absolute 0.126 ± 0.003 0.124 ± 0.004 0.122 ± 0.002 0.119 ± 0.003 0.119 ± 0.005 0.096 ± 0.001** Relative 4.782 ± 0.122 4.383 ± 0.130 4.720 ± 0.077 4.816 ± 0.119 4.969 ± 0.157 4.638 ± 0.080
R. Kidney Absolute 0.180 ± 0.006 0.180 ± 0.002 0.178 ± 0.004 0.173 ± 0.004 0.165 ± 0.005* 0.133 ± 0.004** Relative 6.815 ± 0.133 6.368 ± 0.130 6.871 ± 0.133 7.041 ± 0.187 6.906 ± 0.104 6.421 ± 0.154
Liver Absolute 1.185 ± 0.029 1.223 ± 0.031 1.200 ± 0.036 1.159 ± 0.024 1.201 ± 0.054 1.047 ± 0.026** Relative 44.848 ± 0.625 43.275 ± 0.732 46.143 ± 0.800 47.037 ± 0.940 50.014 ± 1.320** 50.584 ± 1.059**
Lung Absolute 0.227 ± 0.016 0.226 ± 0.011 0.200 ± 0.006 0.221 ± 0.015 0.217 ± 0.013 0.200 ± 0.011 Relative 8.633 ± 0.619 8.030 ± 0.474 7.727 ± 0.285 8.905 ± 0.507 9.049 ± 0.499 9.627 ± 0.438
Thymus Absolute 0.051 ± 0.002 0.054 ± 0.003 0.045 ± 0.002 0.048 ± 0.003 0.050 ± 0.002 0.029 ± 0.002** Relative 1.921 ± 0.061 1.915 ± 0.076 1.719 ± 0.075 1.929 ± 0.085 2.094 ± 0.085 1.407 ± 0.081**
* Significantly different (P#0.05) from the control group by Williams’ test ** Significantly different (P#0.01) from the control group by Williams’ or Dunnett’s test a
Organ weights (absolute weights) and body weights are given in grams; organ-weight-to-body-weight ratios (relative weights) are given as mg organ weight/g body weight (mean ± standard error).

C-6 p-tert-Butylcatechol, NTP TOX 70

D-1
TABLE
TABLE
TABLE
TABLE
APPENDIX D REPRODUCTIVE TISSUE EVALUATIONS
AND ESTROUS CYCLE CHARACTERIZATION
D1 Summary of Reproductive Tissue Evaluations for Male Rats in the 14-Week Feed Study of p-tert-Butylcatechol . . . . . . . . . . . . . . . . . . . . . . . . . . . . . . . . D-2
D2 Estrous Cycle Characterization for Female Rats in the 14-Week Feed Study of p-tert-Butylcatechol . . . . . . . . . . . . . . . . . . . . . . . . . . . . . . . . D-3
D3 Summary of Reproductive Tissue Evaluations for Male Mice in the 14-Week Feed Study of p-tert-Butylcatechol . . . . . . . . . . . . . . . . . . . . . . . . . . . . . . . . D-4
D4 Estrous Cycle Characterization for Female Mice in the 14-Week Feed Study of p-tert-Butylcatechol . . . . . . . . . . . . . . . . . . . . . . . . . . . . . . . . D-5

D-2 p-tert-Butylcatechol, NTP TOX 70
TABLE D1 Summary of Reproductive Tissue Evaluations for Male Rats in the 14-Week Feed Study of p-tert-Butylcatechola
0 ppm 3,125 ppm 6,250 ppm 12,500 ppm
n 10 10 10 10
Weights (g) Necropsy body wt 320 ± 3 296 ± 4** 279 ± 5** 247 ± 4** L. Cauda epididymis
Absolute 0.1611 ± 0.0054 0.1593 ± 0.0057 0.1613 ± 0.0063 0.1364 ± 0.0044** Relative 0.50 ± 0.02 0.54 ± 0.02 0.58 ± 0.02* 0.55 ± 0.02
L. Epididymis Absolute 0.4706 ± 0.0061 0.4713 ± 0.0116 0.4634 ± 0.0109 0.4221 ± 0.0052** Relative 1.47 ± 0.02 1.59 ± 0.03 1.66 ± 0.04 1.71 ± 0.03
L. Testis Absolute 1.5258 ± 0.0202 1.5280 ± 0.0207 1.5006 ± 0.0160 1.3843 ± 0.0799* Relative 4.77 ± 0.06 5.17 ± 0.06 5.39 ± 0.12 5.59 ± 0.32
Spermatid and sperm measurements Spermatid heads (107/g testis) 159.84 ± 9.90 149.00 ± 9.12 165.01 ± 6.75 179.29 ± 6.25 Spermatid heads (107/testis) 181.88 ± 8.40 157.13 ± 9.76* 168.69 ± 5.36 150.31 ± 3.26** Sperm heads
(107/g cauda epididymis) 449.84 ± 21.42 482.92 ± 30.52 434.79 ± 16.93 505.94 ± 19.88 Sperm heads
(107/cauda epididymis) 71.88 ± 3.07 76.37 ± 4.97 69.87 ± 3.50 68.76 ± 3.07
Epididymal sperm motility (%) 72.15 ± 0.96 70.87 ± 1.03 70.76 ± 0.78 67.08 ± 1.22**
* Significantly different (P#0.05) from the control group by Williams’ or Dunnett’s test (tissue weights) or by Dunn’s test (spermatid heads per testis)
** Significantly different (P#0.01) from the control group by Williams’ test (body and tissue weights), Dunn’s test (spermatid heads per testis), or Shirley’s test (motility)
a Data are presented as mean ± standard error. Organ weights (absolute weights) and body weights are given in grams; organ-weight-to-bodyweight ratios (relative weights) are given as mg organ weight/g body weight. Differences from the control group for spermatid heads per g testis, sperm heads per g cauda epididymis, and sperm heads per cauda epididymis are not significant by Dunn’s test.

D-3
c
p-tert-Butylcatechol, NTP TOX 70
TABLE D2 Estrous Cycle Characterization for Female Rats in the 14-Week Feed Study of p-tert-Butylcatechola
0 ppm 3,125 ppm 6,250 ppm 12,500 ppm
n 10 10 10 10
Necropsy body wt (g) 184 ± 3 175 ± 2* 170 ± 3** 162 ± 3**
Number of cycling femalesb
10 10 5* 4* Number of females
with regular estrous cycles 10 8 2* 2* Number of estrous cycles 1.8 ± 0.1 1.3 ± 0.2* 1.0 ± 0.0* 1.0 ± 0.0* Estrous cycle length (days) Estrous stages
c (% of cycle)
4.750 ± 0.201 5.500 ± 0.316 6.200 ± 0.663* 7.000 ± 0.577**
Diestrus 47.1 57.5 78.3 77.1 Proestrus 15.1 14.2 4.2 5.9 Estrus 23.5 17.5 11.7 10.2 Metestrus 14.3 10.8 5.8 6.8
* Significantly different (P#0.05) from the control group by Williams’ test (body weights), chi-square test (numbers of cycling females and of females with regular cycles), or Shirley’s test (number of estrous cycles and estrous cycle length)
** P#0.01 a
Necropsy body weight and estrous cycle length data are presented as mean ± standard error. b
Does not include animals with estrous cycles that were longer than 12 days or unclear Evidence shows that females exposed to 6,250 or 12,500 ppm differ significantly (Wilk’s Criterion: 6,250 ppm, P#0.05; 12,500 ppm, P#0.01) from the control females in the relative length of time spent in the estrous stages. Exposed females spent more time in diestrus and less time in proestrus, estrus, and metestrus than did the control females.
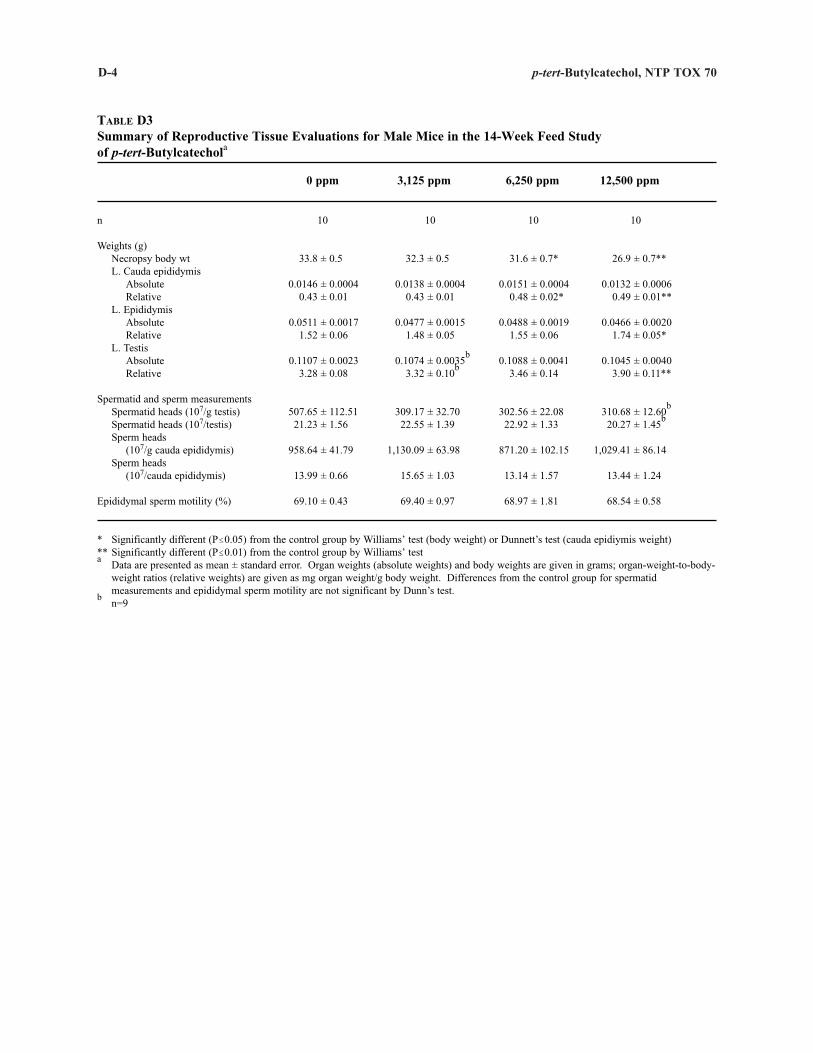
D-4 p-tert-Butylcatechol, NTP TOX 70
TABLE D3 Summary of Reproductive Tissue Evaluations for Male Mice in the 14-Week Feed Study of p-tert-Butylcatechola
0 ppm 3,125 ppm 6,250 ppm 12,500 ppm
n 10 10 10 10
Weights (g) Necropsy body wt 33.8 ± 0.5 32.3 ± 0.5 31.6 ± 0.7* 26.9 ± 0.7** L. Cauda epididymis
Absolute 0.0146 ± 0.0004 0.0138 ± 0.0004 0.0151 ± 0.0004 0.0132 ± 0.0006 Relative 0.43 ± 0.01 0.43 ± 0.01 0.48 ± 0.02* 0.49 ± 0.01**
L. Epididymis Absolute 0.0511 ± 0.0017 0.0477 ± 0.0015 0.0488 ± 0.0019 0.0466 ± 0.0020 Relative 1.52 ± 0.06 1.48 ± 0.05 1.55 ± 0.06 1.74 ± 0.05*
L. Testis Absolute Relative
0.1107 ± 0.0023 3.28 ± 0.08
0.1074 ± 0.0035b
3.32 ± 0.10b
0.1088 ± 0.0041 3.46 ± 0.14
0.1045 ± 0.0040 3.90 ± 0.11**
Spermatid and sperm measurements Spermatid heads (107/g testis) Spermatid heads (107/testis)
507.65 ± 112.51 21.23 ± 1.56
309.17 ± 32.70 22.55 ± 1.39
302.56 ± 22.08 22.92 ± 1.33
310.68 ± 12.60b
20.27 ± 1.45b
Sperm heads (107/g cauda epididymis) 958.64 ± 41.79 1,130.09 ± 63.98 871.20 ± 102.15 1,029.41 ± 86.14
Sperm heads (107/cauda epididymis) 13.99 ± 0.66 15.65 ± 1.03 13.14 ± 1.57 13.44 ± 1.24
Epididymal sperm motility (%) 69.10 ± 0.43 69.40 ± 0.97 68.97 ± 1.81 68.54 ± 0.58
* Significantly different (P#0.05) from the control group by Williams’ test (body weight) or Dunnett’s test (cauda epidiymis weight) ** Significantly different (P#0.01) from the control group by Williams’ test a
Data are presented as mean ± standard error. Organ weights (absolute weights) and body weights are given in grams; organ-weight-to-bodyweight ratios (relative weights) are given as mg organ weight/g body weight. Differences from the control group for spermatid measurements and epididymal sperm motility are not significant by Dunn’s test.
b n=9
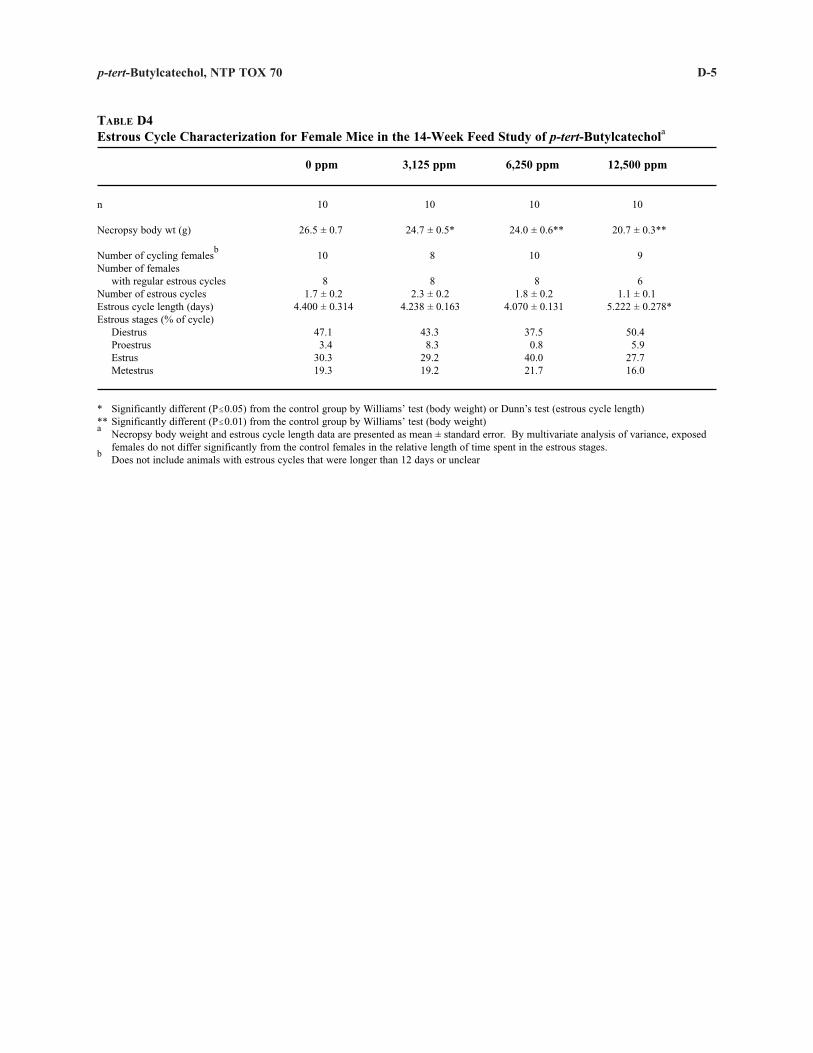
D-5 p-tert-Butylcatechol, NTP TOX 70
TABLE D4 Estrous Cycle Characterization for Female Mice in the 14-Week Feed Study of p-tert-Butylcatechola
0 ppm 3,125 ppm 6,250 ppm 12,500 ppm
n 10 10 10 10
Necropsy body wt (g) 26.5 ± 0.7 24.7 ± 0.5* 24.0 ± 0.6** 20.7 ± 0.3**
Number of cycling femalesb
10 8 10 9 Number of females
with regular estrous cycles 8 8 8 6 Number of estrous cycles 1.7 ± 0.2 2.3 ± 0.2 1.8 ± 0.2 1.1 ± 0.1 Estrous cycle length (days) 4.400 ± 0.314 4.238 ± 0.163 4.070 ± 0.131 5.222 ± 0.278* Estrous stages (% of cycle)
Diestrus 47.1 43.3 37.5 50.4 Proestrus 3.4 8.3 0.8 5.9 Estrus 30.3 29.2 40.0 27.7 Metestrus 19.3 19.2 21.7 16.0
* Significantly different (P#0.05) from the control group by Williams’ test (body weight) or Dunn’s test (estrous cycle length) ** Significantly different (P#0.01) from the control group by Williams’ test (body weight) a
Necropsy body weight and estrous cycle length data are presented as mean ± standard error. By multivariate analysis of variance, exposed females do not differ significantly from the control females in the relative length of time spent in the estrous stages.
b Does not include animals with estrous cycles that were longer than 12 days or unclear

D-6 p-tert-Butylcatechol, NTP TOX 70

E-1
TABLE E1 Mutagenicity oTABLE E2 Induction of M
Treated with pTABLE E3 Frequency of M
Following Adm
APPENDIX E GENETIC TOXICOLOGY
f p-tert-Butylcatechol in Salmonella typhimurium . . . . . . . . . . . . . . . . . . . . . E-2 icronuclei in Bone Marrow Polychromatic Erythrocytes of Male Rats -tert-Butylcatechol by Intraperitoneal Injection . . . . . . . . . . . . . . . . . . . . . . E-4
icronuclei in Peripheral Blood Erythrocytes of Mice inistration of p-tert-Butylcatechol in Feed for 14 Weeks . . . . . . . . . . . . . . . E-5
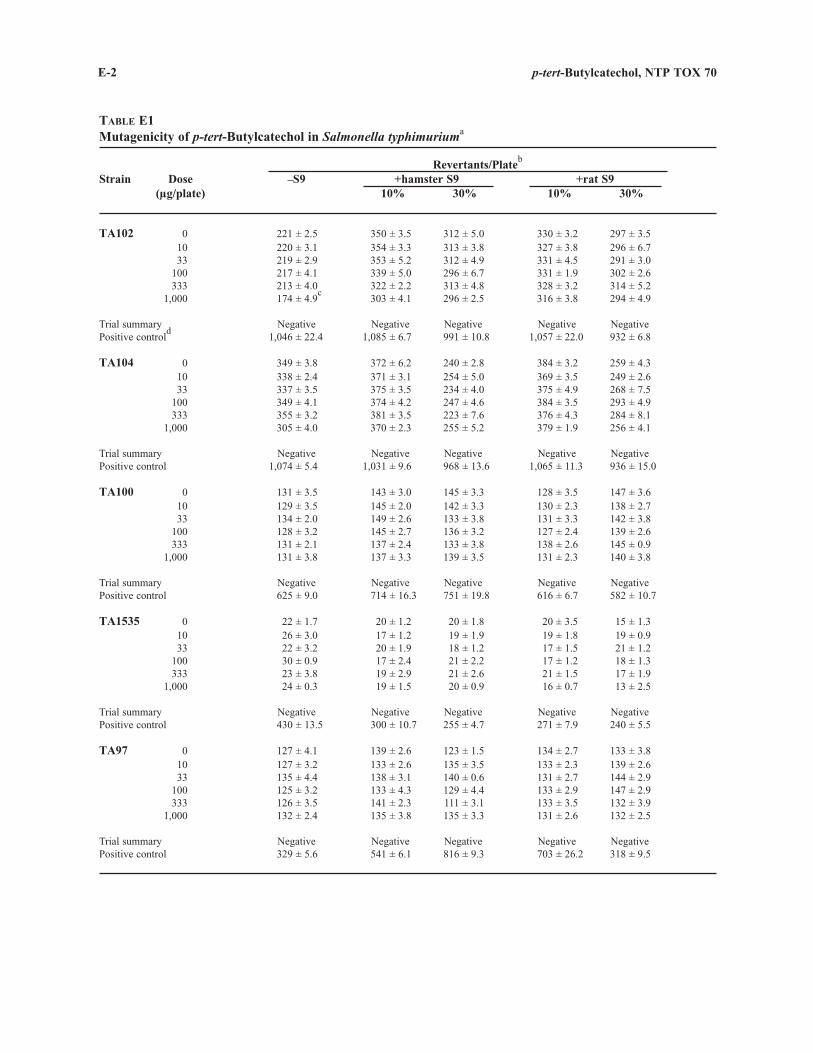
E-2 p-tert-Butylcatechol, NTP TOX 70
TABLE E1 Mutagenicity of p-tert-Butylcatechol in Salmonella typhimuriuma
Strain Dose (µg/plate)
–S9 Revertants/Plateb
+hamster S9 10% 30%
+rat S9 10% 30%
TA102 0 10 33
100 333
1,000
221 ± 2.5 220 ± 3.1 219 ± 2.9 217 ± 4.1 213 ± 4.0 174 ± 4.9
c
350 ± 3.5 354 ± 3.3 353 ± 5.2 339 ± 5.0 322 ± 2.2 303 ± 4.1
312 ± 5.0 313 ± 3.8 312 ± 4.9 296 ± 6.7 313 ± 4.8 296 ± 2.5
330 ± 3.2 327 ± 3.8 331 ± 4.5 331 ± 1.9 328 ± 3.2 316 ± 3.8
297 ± 3.5 296 ± 6.7 291 ± 3.0 302 ± 2.6 314 ± 5.2 294 ± 4.9
Trial summary Positive control
d Negative
1,046 ± 22.4 Negative
1,085 ± 6.7 Negative 991 ± 10.8
Negative 1,057 ± 22.0
Negative 932 ± 6.8
TA104 0 10 33
100 333
1,000
349 ± 3.8 338 ± 2.4 337 ± 3.5 349 ± 4.1 355 ± 3.2 305 ± 4.0
372 ± 6.2 371 ± 3.1 375 ± 3.5 374 ± 4.2 381 ± 3.5 370 ± 2.3
240 ± 2.8 254 ± 5.0 234 ± 4.0 247 ± 4.6 223 ± 7.6 255 ± 5.2
384 ± 3.2 369 ± 3.5 375 ± 4.9 384 ± 3.5 376 ± 4.3 379 ± 1.9
259 ± 4.3 249 ± 2.6 268 ± 7.5 293 ± 4.9 284 ± 8.1 256 ± 4.1
Trial summary Positive control
Negative 1,074 ± 5.4
Negative 1,031 ± 9.6
Negative 968 ± 13.6
Negative 1,065 ± 11.3
Negative 936 ± 15.0
TA100 0 10 33
100 333
1,000
131 ± 3.5 129 ± 3.5 134 ± 2.0 128 ± 3.2 131 ± 2.1 131 ± 3.8
143 ± 3.0 145 ± 2.0 149 ± 2.6 145 ± 2.7 137 ± 2.4 137 ± 3.3
145 ± 3.3 142 ± 3.3 133 ± 3.8 136 ± 3.2 133 ± 3.8 139 ± 3.5
128 ± 3.5 130 ± 2.3 131 ± 3.3 127 ± 2.4 138 ± 2.6 131 ± 2.3
147 ± 3.6 138 ± 2.7 142 ± 3.8 139 ± 2.6 145 ± 0.9 140 ± 3.8
Trial summary Positive control
Negative 625 ± 9.0
Negative 714 ± 16.3
Negative 751 ± 19.8
Negative 616 ± 6.7
Negative 582 ± 10.7
TA1535 0 10 33
100 333
1,000
22 ± 1.7 26 ± 3.0 22 ± 3.2 30 ± 0.9 23 ± 3.8 24 ± 0.3
20 ± 1.2 17 ± 1.2 20 ± 1.9 17 ± 2.4 19 ± 2.9 19 ± 1.5
20 ± 1.8 19 ± 1.9 18 ± 1.2 21 ± 2.2 21 ± 2.6 20 ± 0.9
20 ± 3.5 19 ± 1.8 17 ± 1.5 17 ± 1.2 21 ± 1.5 16 ± 0.7
15 ± 1.3 19 ± 0.9 21 ± 1.2 18 ± 1.3 17 ± 1.9 13 ± 2.5
Trial summary Positive control
Negative 430 ± 13.5
Negative 300 ± 10.7
Negative 255 ± 4.7
Negative 271 ± 7.9
Negative 240 ± 5.5
TA97 0 10 33
100 333
1,000
127 ± 4.1 127 ± 3.2 135 ± 4.4 125 ± 3.2 126 ± 3.5 132 ± 2.4
139 ± 2.6 133 ± 2.6 138 ± 3.1 133 ± 4.3 141 ± 2.3 135 ± 3.8
123 ± 1.5 135 ± 3.5 140 ± 0.6 129 ± 4.4 111 ± 3.1 135 ± 3.3
134 ± 2.7 133 ± 2.3 131 ± 2.7 133 ± 2.9 133 ± 3.5 131 ± 2.6
133 ± 3.8 139 ± 2.6 144 ± 2.9 147 ± 2.9 132 ± 3.9 132 ± 2.5
Trial summary Positive control
Negative 329 ± 5.6
Negative 541 ± 6.1
Negative 816 ± 9.3
Negative 703 ± 26.2
Negative 318 ± 9.5
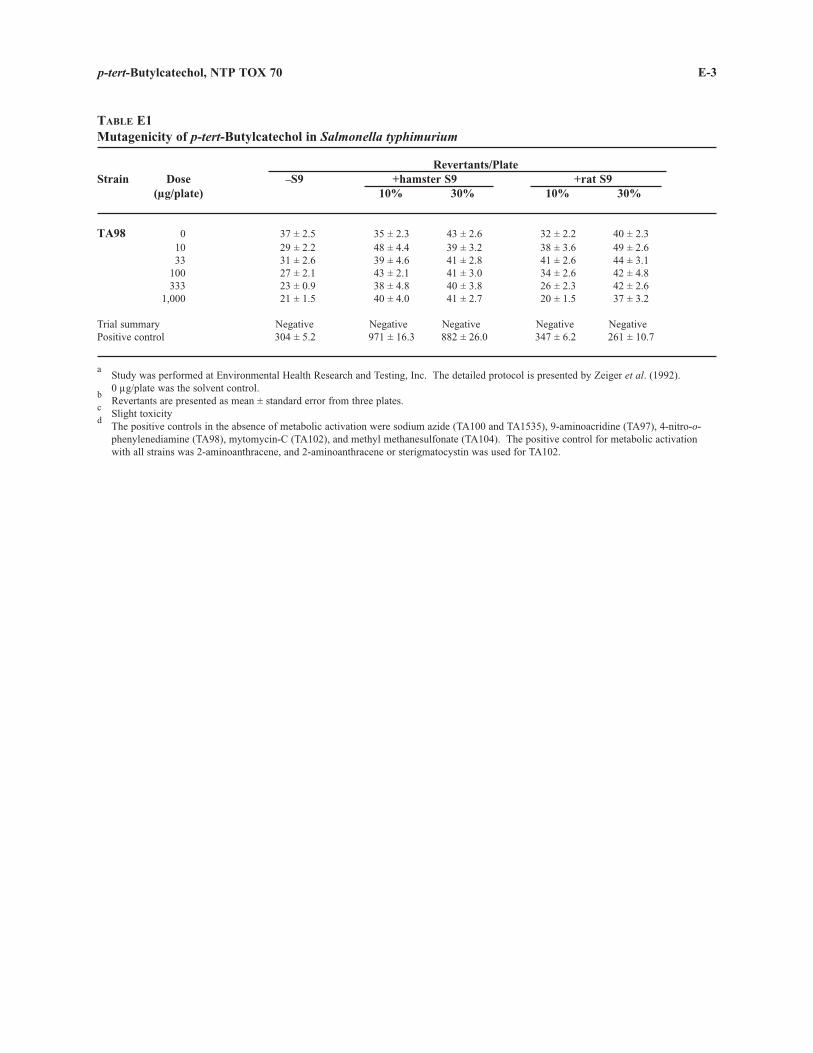
E-3
c
p-tert-Butylcatechol, NTP TOX 70
TABLE E1 Mutagenicity of p-tert-Butylcatechol in Salmonella typhimurium
Strain Dose –S9 Revertants/Plate
+hamster S9 +rat S9 (µg/plate) 10% 30% 10% 30%
TA98 0 37 ± 2.5 35 ± 2.3 43 ± 2.6 32 ± 2.2 40 ± 2.3 10 29 ± 2.2 48 ± 4.4 39 ± 3.2 38 ± 3.6 49 ± 2.6 33 31 ± 2.6 39 ± 4.6 41 ± 2.8 41 ± 2.6 44 ± 3.1
100 27 ± 2.1 43 ± 2.1 41 ± 3.0 34 ± 2.6 42 ± 4.8 333 23 ± 0.9 38 ± 4.8 40 ± 3.8 26 ± 2.3 42 ± 2.6
1,000 21 ± 1.5 40 ± 4.0 41 ± 2.7 20 ± 1.5 37 ± 3.2
Trial summary Negative Negative Negative Negative Negative Positive control 304 ± 5.2 971 ± 16.3 882 ± 26.0 347 ± 6.2 261 ± 10.7
a Study was performed at Environmental Health Research and Testing, Inc. The detailed protocol is presented by Zeiger et al. (1992). 0 µg/plate was the solvent control.
b Revertants are presented as mean ± standard error from three plates. Slight toxicity
d The positive controls in the absence of metabolic activation were sodium azide (TA100 and TA1535), 9-aminoacridine (TA97), 4-nitro-ophenylenediamine (TA98), mytomycin-C (TA102), and methyl methanesulfonate (TA104). The positive control for metabolic activation with all strains was 2-aminoanthracene, and 2-aminoanthracene or sterigmatocystin was used for TA102.

E-4
c
p-tert-Butylcatechol, NTP TOX 70
TABLE E2 Induction of Micronuclei in Bone Marrow Polychromatic Erythrocytes of Male Rats Treated with p-tert-Butylcatechol by Intraperitoneal Injectiona
Number of Rats Compound Dose with Erythrocytes Micronucleated PCEs/ P Valuec
(mg/kg) Scored 1,000 PCEsb
Trial 1
dCorn oil 5 1.00 ± 0.16
p-tert-Butylcatechol 125 5 1.80 ± 0.66 0.1225 250 5 2.90 ± 0.83 0.0050
e500 1 2.00
fP=0.010
Cyclophosphamideg
10 5 17.80 ± 2.41 0.0000
Trial 2
Corn oil 5 1.80 ± 0.34
p-tert-Butylcatechol 125 5 3.00 ± 0.69 0.0414 250 3 1.33 ± 0.17 0.7610 300 4 2.13 ± 0.24 0.3114
P=0.582
Cyclophosphamide 10 5 11.70 ± 2.08 0.0000
a Study was performed at Environmental Health Research and Testing, Inc. The detailed protocol is presented by Shelby et al. (1993). PCE=polychromatic erythrocyte
b Mean ± standard error Pairwise comparison with the vehicle control. Dosed group values are significant at P#0.013 (Trial 1) or P#0.008 (Trial 2); positive control values are significant at P#0.05 (ILS, 1990).
d Vehicle control
e Due to excess lethality at this dose, data were not included in statistical analyses.
f Significance of micronucleated PCEs/1,000 PCEs tested by the one-tailed trend test, significant at P#0.025 (ILS, 1990)
g Positive control

E-5
c
p-tert-Butylcatechol, NTP TOX 70
TABLE E3 Frequency of Micronuclei in Peripheral Blood Erythrocytes of Mice Following Administration of p-tert-Butylcatechol in Feed for 14 Weeksa
Concentration (ppm)
Number of Mice with Erythrocytes
Scored Micronucleated NCEs/
1,000 NCEsb P Valuec PCEs (%)
Male
0 781
1,562 3,125 6,250
12,500
10 10 10 10 10 10
0.40 ± 0.12 0.40 ± 0.10 0.60 ± 0.20 0.55 ± 0.16 0.70 ± 0.08 0.60 ± 0.15
0.5000 0.1855 0.2456 0.1004 0.1855
2.0 1.8 1.7 1.6 1.7 1.9
P=0.159d
Female
0 781
1,562 3,125 6,250
12,500
10 10 10 10 10 10
0.70 ± 0.15 0.55 ± 0.12 0.50 ± 0.11 0.45 ± 0.14 0.70 ± 0.17 0.75 ± 0.11
0.7258 0.7930 0.8515 0.5000 0.4263
1.7 1.7 1.7 2.1 1.8 1.7
P=0.186
a Study was performed at SITEK Research Laboratories. The detailed protocol is presented by MacGregor et al. (1990). NCE=normochromatic erythrocyte; PCE=polychromatic erythrocyte
b Mean ± standard error Pairwise comparison with the controls, significant at P#0.005 (ILS, 1990)
d Significance of micronucleated NCEs/1,000 NCEs tested by the one-tailed trend test, significant at P#0.025 (ILS, 1990)

E-6 p-tert-Butylcatechol, NTP TOX 70

F-1
PROCUREMENT A
PREPARATION AN
FIGURE F1 InfFIGURE F2 ProFIGURE F3 13CTABLE F1 Hig
of pTABLE F2 Pre
of pTABLE F3 Res
in tTABLE F4 Res
in t
APPENDIX F CHEMICAL CHARACTERIZATION
AND DOSE FORMULATION STUDIES
ND CHARACTERIZATION OF p-tert-BUTYLCATECHOL . . . . . . . . . . . . . . . . . . . . . . . . . . . . . . F-2 D ANALYSIS OF DOSE FORMULATIONS . . . . . . . . . . . . . . . . . . . . . . . . . . . . . . . . . . . . . . . . F-2
rared Absorption Spectrum of p-tert-Butylcatechol . . . . . . . . . . . . . . . . . . . . . . . . . . . . . F-4 ton Nuclear Magnetic Resonance Spectrum of p-tert-Butylcatechol . . . . . . . . . . . . . . . . F-5 -Nuclear Magnetic Resonance Spectrum of p-tert-Butylcatechol . . . . . . . . . . . . . . . . . . F-6 h-Performance Liquid Chromatography Systems Used in the Feed Studies -tert-Butylcatechol . . . . . . . . . . . . . . . . . . . . . . . . . . . . . . . . . . . . . . . . . . . . . . . . . . . . . . F-7 paration and Storage of Dose Formulations in the Feed Studies -tert-Butylcatechol . . . . . . . . . . . . . . . . . . . . . . . . . . . . . . . . . . . . . . . . . . . . . . . . . . . . . . F-7 ults of Analyses of Dose Formulations Administered to Rats and Mice he 15-Day Feed Studies of p-tert-Butylcatechol . . . . . . . . . . . . . . . . . . . . . . . . . . . . . . . . F-8 ults of Analyses of Dose Formulations Administered to Rats and Mice he 14-Week Feed Studies of p-tert-Butylcatechol . . . . . . . . . . . . . . . . . . . . . . . . . . . . . . . F-9
F-2 p-tert-Butylcatechol, NTP TOX 70
CHEMICAL CHARACTERIZATION AND DOSE FORMULATION STUDIES
PROCUREMENT AND CHARACTERIZATION OF P-TERT-BUTYLCATECHOL p-tert-Butylcatechol was obtained from Aldrich Chemical Company (Milwaukee, WI) in two lots (03404 MF and 19115EN); lot 03404 MF was used during the 15-day studies and lot 19115EN was used during the 14-week studies. Identity, purity, and stability analyses were conducted by the study laboratories. Reports on analyses performed in support of the p-tert-butylcatechol studies are on file at the National Institute of Environmental Health Sciences.
The chemical, a whitish, flaky solid, was identified as p-tert-butylcatechol by infrared spectroscopy (lots 03404 MF and 19115EN) and proton and carbon-13 nuclear magnetic resonance spectroscopy (lot 19115EN). All spectra were consistent with the literature spectra (Aldrich, 1981) or the structure of p-tert-butylcatechol. The infrared and nuclear magnetic resonance spectra are presented in Figures F1 through F3.
The purity of each lot was determined by high-performance liquid chromatography (HPLC) by system A (lot 03404 MF) or system B (lot 19115EN) (Table F1). Major peak comparisons of lot 03404 MF with lot 19115EN were performed with HPLC by system B.
For lot 03404 MF, results of HPLC analyses indicated the major product peak and three impurities. One major impurity peak had an area of 0.3% relative to the major peak; two minor impurities had relative areas of less than 0.1%. For lot 19115EN, results of HPLC analyses indicated the major product peak and two impurity peaks with areas of 0.26% and 0.20% relative to the major peak area. The overall purity of each lot was determined to be greater than 99%. Major peak comparisons indicated nearly identical purity profiles and impurity concentrations between the two lots.
Accelerated stability studies of lot 03404 MF of the bulk chemical were conducted with HPLC by system A. These studies indicated that p-tert-butylcatechol is stable as a bulk chemical for at least 14 days when stored under a nitrogen headspace, protected from strong oxidizers, at temperatures up to approximately 60° C. Based on the results of these studies and on information in the literature, the bulk chemical was stored under a nitrogen headspace (lot 03404 MF) in amber glass bottles, in the dark, at room temperature. No degradation of the bulk chemical was detected.
PREPARATION AND ANALYSIS OF DOSE FORMULATIONS Dose formulations were prepared by mixing p-tert-butylcatechol with nonirradiated feed once (15-day studies) or with irradiated feed approximately every 4 weeks (14-week studies) (Table F2). A premix of ground p-tertbutylcatechol and feed was prepared by hand and then blended with additional feed in a twin-shell blender for 15 minutes. Formulations were stored in plastic bags at –20° C for up to 3 weeks during the 15-day studies and in plastic bags inside buckets at 5° C for up to 42 days during the 14-week studies.
Homogeneity studies of 3,125 and 50,000 ppm dose formulations in nonirradiated feed (15-day studies) and 781 and 12,500 ppm dose formulations in irradiated feed (14-week studies) and stability studies of the 781 and 3,125 ppm dose formulations were performed by the study laboratories. The 3,125 and 50,000 ppm dose formulations were analyzed with HPLC by system B; the 781 and 12,500 ppm dose formulations were extracted with a modified process employing a Soxhlet apparatus and analyzed with HPLC by system C. Homogeneity was confirmed. Stability of the 3,125 ppm dose formulation was confirmed for 35 days for samples stored at approximately –20° C. Stability of the 781 ppm dose formulation was confirmed for 42 days for samples stored in

F-3 p-tert-Butylcatechol, NTP TOX 70
plastic bags at temperatures up to 5° C; samples subjected to animal room conditions showed declines in p-tertbutylcatechol concentrations with time.
Periodic analyses of the dose formulations of p-tert-butylcatechol were conducted by the study laboratories using HPLC by system A (15-day studies) or system C (14-week studies). For the 15-day studies, dose formulations were analyzed once; all five were within 10% of the target concentrations, with no value greater than 105% of the target concentration (Table F3). Animal room samples of these dose formulations were also analyzed; the concentrations of all samples were 59% to 81% of the target concentrations. For the 14-week studies, dose formulations were analyzed at the beginning, midpoint, and end of the studies; 14 of 15 were within 10% of the target concentrations with no value greater than 105% of the target concentration (Table F4). The single dose formulation that was not within specifications was remixed and analyzed and was found to be within 10% of the target concentration. Animal room samples of these dose formulations were also analyzed; the concentrations of 9 of 15 animal room samples for rats and 13 of 15 for mice were less than 90% of the target concentrations. The low concentrations of animal room samples were attributed to chemical degradation, oxidation, evaporation, or binding with feed.

F-4 p-tert-Butylcatechol, NTP TOX 70
Figure F1 Infrared Absorption Spectrum of p-tert-Butylcatechol

F-5 p-tert-Butylcatechol, NTP TOX 70
Figure F2 Proton Nuclear Magnetic Resonance Spectrum of p-tert-Butylcatechol

F-6 p-tert-Butylcatechol, NTP TOX 70
Figure F3 13C-Nuclear Magnetic Resonance Spectrum of p-tert-Butylcatechol

F-7 p-tert-Butylcatechol, NTP TOX 70
TABLE F1 High-Performance Liquid Chromatography Systems Used in the Feed Studies of p-tert-Butylcatechol
Detection System Column Solvent System
System A Ultraviolet (278 nm)
System B Ultraviolet (282 nm)
System C Ultraviolet (278 nm)
Ultrasphere ODS, 150 mm × 4 mm, 5-µm particle size (Beckman, Fullerton, CA)
Inertsil ODS-2, 150 mm × 4.6 mm, 5-µm particle size (Phenomenex, Torrance, CA)
Prodigy 5 ODS-3, 150 mm × 4.6 mm, 5-µm particle size (Phenomenex)
1% aqueous glacial acetic acid:acetonitrile (60:40) at a flow rate of 1.0 or 1.5 mL/minute
1% acetic acid:acetonitrile; 65:35 for 15 minutes, then 65:35 to 10:90 in 20 minutes, held for 10 minutes
1% acetic acid:acetonitrile (60:40), isocratic; flow rate 1.5 mL/minute
TABLE F2 Preparation and Storage of Dose Formulations in the Feed Studies of p-tert-Butylcatechol
15-Day Studies 14-Week Studies
Preparation p-tert-Butylcatechol was ground in a mortar and passed through a No. 20 sieve. A premix of feed and p-tert-butylcatechol was then prepared and layered with the remaining feed in a twin-shell blender and blended with the intensifier bar on for 5 minutes and off for 10 minutes. Dose formulations were prepared once, at the beginning of the studies.
Chemical Lot Number 03404 MF
Maximum Storage Time 3 weeks
Storage Conditions Stored in sealed, double plastic bags at –20° C
Study Laboratory Microbiological Associates, Inc. (Bethesda, MD)
p-tert-Butylcatechol was ground in a mortar to a semifine powder. A premix of feed and p-tert-butylcatechol was then prepared and and ground in a mortar; the premix was passed through sieves (781 ppm, 20- and 40-mesh; 12,500 ppm, 14-mesh; other premixes, 14- and 20-mesh). The premix was layered with the remaining feed in a Patterson-Kelly twin-shell blender and mixed for approximately 15 minutes. Dose formulations were prepared approximately every 4 weeks.
19115EN
42 days
Stored in plastic bags inside buckets at approximately 5° C
Battelle Columbus Laboratories (Columbus, OH)
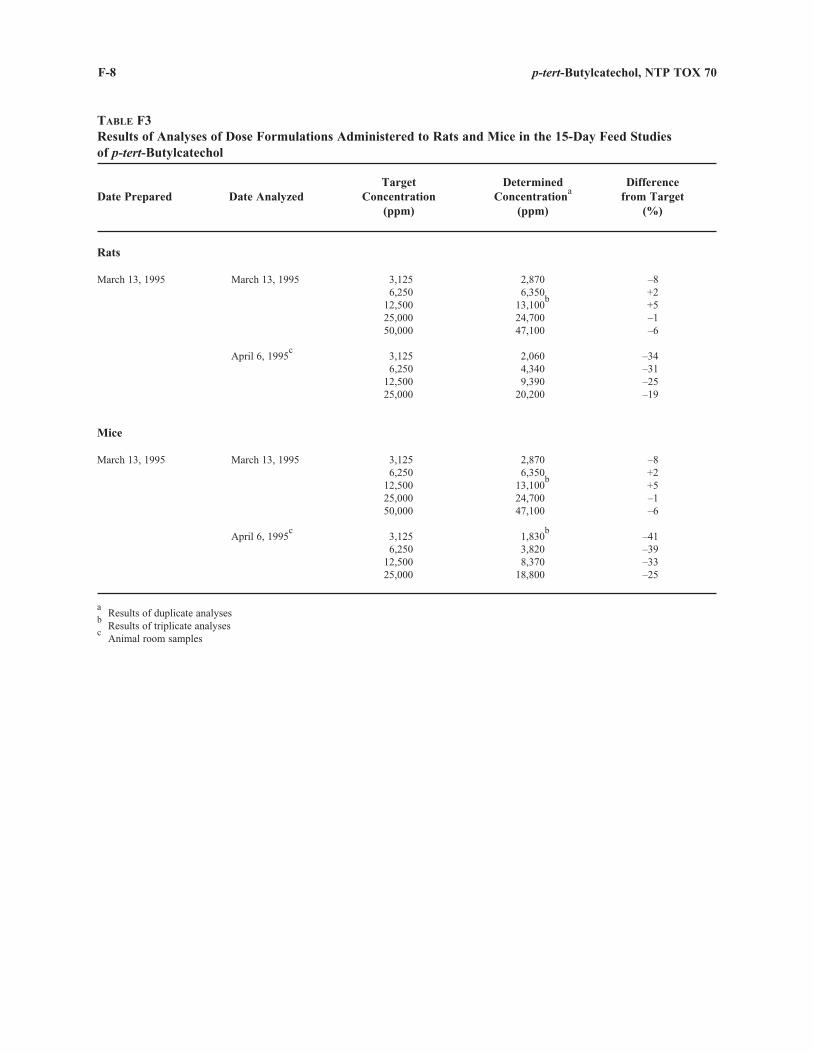
F-8
c
p-tert-Butylcatechol, NTP TOX 70
TABLE F3 Results of Analyses of Dose Formulations Administered to Rats and Mice in the 15-Day Feed Studies of p-tert-Butylcatechol
Date Prepared Date Analyzed Target
Concentration (ppm)
Determined Concentrationa
(ppm)
Difference from Target
(%)
Rats
March 13, 1995 March 13, 1995 3,125 6,250
12,500 25,000 50,000
2,870 6,350
13,100b
24,700 47,100
–8 +2 +5 –1 –6
April 6, 1995c
3,125 6,250
12,500 25,000
2,060 4,340 9,390
20,200
–34 –31 –25 –19
Mice
March 13, 1995 March 13, 1995 3,125 6,250
12,500 25,000 50,000
2,870 6,350
13,100b
24,700 47,100
–8 +2 +5 –1 –6
April 6, 1995c
3,125 6,250
12,500 25,000
1,830b
3,820 8,370
18,800
–41 –39 –33 –25
a Results of duplicate analyses
b Results of triplicate analyses Animal room samples

, ,
F-9 p-tert-Butylcatechol, NTP TOX 70
TABLE F4 Results of Analyses of Dose Formulations Administered to Rats and Mice in the 14-Week Feed Studies of p-tert-Butylcatechol
Date Prepared Date Analyzed Target
Concentration (ppm)
Determined Concentrationa
(ppm)
Difference from Target
(%)
Rats
August 20, 1996 August 22, 1996 781 1,562 3,125 6,250
12,500
822 1,509 3,142 6,494
11,342
+5 –3 +1 +4 –9
September 26, 1996b
781 1,562 3,125 6,250
12,500
670 1,444 2,990 6,116
11,591
–14 –8 –4 –2 –7
September 17, 1996 September 20, 23, and 24, 1996 781 1,562 3,125 6,250
12,500
768 1,462 3,049 5,745
11,831
–2 –6 –2 –8 –5
October 25, 1996b
781 1,562 3,125 6,250
12,500
602 1,283 2,516 4,442 9,158
–23 –18 –19 –29 –27
November 12, 1996 November 18, 1996 781 1,562 3,125 6,250
12,500
781 1,149
c
2,827 5,685
11,546
0 –26 –10 –9 –8
November 19, 1996 November 21, 1996 1,562 1,480d
–5
December 12 and 13, 1996b
781 1,562 3,125 6,250
12,500
582 1,266 2,897 5,352
11,612
–25 –19 –7
–14 –7

,
,
F-10 p-tert-Butylcatechol, NTP TOX 70
TABLE F4 Results of Analyses of Dose Formulations Administered to Rats and Mice in the 14-Week Feed Studies of p-tert-Butylcatechol
Date Prepared Date Analyzed Target
Concentration (ppm)
Determined Concentration
(ppm)
Difference from Target
(%)
Mice
August 20, 1996 August 22, 1996 781 1,562 3,125 6,250
12,500
822 1,509 3,142 6,494
11,342
+5 –3 +1 +4 –9
September 26, 1996b
781 1,562 3,125 6,250
12,500
571 1,204 2,679 4,688
10,302
–27 –23 –14 –25 –18
September 17, 1996 September 20, 23, and 24, 1996 781 1,562 3,125 6,250
12,500
768 1,462 3,049 5,745
11,831
–2 –6 –2 –8 –5
October 25, 1996b
781 1,562 3,125 6,250
12,500
608 1,275 2,769 4,549 9,355
–22 –18 –11 –27 –25
November 12, 1996 November 18, 1996 781 1,562 3,125 6,250
12,500
781 1,149
c
2,827 5,685
11,546
0 –26 –10 –9 –8
November 19, 1996 November 21, 1996 1,562 1,480d
–5
December 12 and 13, 1996b
781 1,562 3,125 6,250
12,500
672 1,425 2,798 5,271
10,036
–14 –9
–10 –16 –20
a Results of duplicate analyses
b Animal room samples Remixed; not used in study
d Results of remix
c

G-1
INTROD
MATER
RESUL
REFER
TABLE
TABLE
TABLE
TABLE
FIGURE
TABLE
TABLE
TABLE
TABLE
TABLE
TABLE
TABLE
TABLE
FIGURE
FIGURE
TABLE
APPENDIX G ABSORPTION, DISTRIBUTION, METABOLISM,
AND EXCRETION STUDIES
UCTION . . . . . . . . . . . . . . . . . . . . . . . . . . . . . . . . . . . . . . . . . . . . . . . . . . . . . . . . . . . . . . . . . . . . . . . G-2 IALS AND METHODS . . . . . . . . . . . . . . . . . . . . . . . . . . . . . . . . . . . . . . . . . . . . . . . . . . . . . . . . . . . . . . G-2
TS AND DISCUSSION . . . . . . . . . . . . . . . . . . . . . . . . . . . . . . . . . . . . . . . . . . . . . . . . . . . . . . . . . . . . . . . G-4 ENCES . . . . . . . . . . . . . . . . . . . . . . . . . . . . . . . . . . . . . . . . . . . . . . . . . . . . . . . . . . . . . . . . . . . . . . . . . G-6 G1 Cumulative Excretion of Radioactivity by Male F344/N Rats
after a Single Intravenous Injection of 3 mg/kg [14C]-p-tert-Butylcatechol . . . . . . . . . . . . . G-7 G2 Tissue Distribution of Radioactivity in Male F344/N Rats
72 Hours after a Single Intravenous Injection of 3 mg/kg [14C]-p-tert-Butylcatechol . . . . . G-7 G3 Cumulative Excretion of Radioactivity by Male F344/N Rats
after a Single Gavage Dose of [14C]-p-tert-Butylcatechol . . . . . . . . . . . . . . . . . . . . . . . . . . . G-8 G4 Tissue Distribution of Radioactivity in Male F344/N Rats
72 Hours after a Single Gavage Dose of [14C]-p-tert-Butylcatechol . . . . . . . . . . . . . . . . . . . G-9 G1 High-Performance Liquid Chromatographic Radiochromatogram
of Urine Collected from 0 to 6 Hours after a Single Gavage Dose of 2 mg/kg [14C]-p-tert-Butylcatechol to Male F344/N Rats . . . . . . . . . . . . . . . . . . . . . . . . . G-10
G5 Cumulative Excretion of Radioactivity by Male F344/N Rats after a Single Dermal Application of [14C]-p-tert-Butylcatechol . . . . . . . . . . . . . . . . . . . . . . G-11
G6 Distribution of Radioactivity in Male F344/N Rats 72 Hours after a Single Dermal Application of [14C]-p-tert-Butylcatechol . . . . . . . . . . . . . . G-11
G7 Cumulative Excretion of Radioactivity by Male B6C3F1 Mice after a Single Intravenous Injection of 3 mg/kg [14C]-p-tert-Butylcatechol . . . . . . . . . . . . . G-12
G8 Tissue Distribution of Radioactivity in Male B6C3F1 Mice 72 Hours after a Single Intravenous Injection of 3 mg/kg [14C]-p-tert-Butylcatechol . . . . . G-13
G9 Cumulative Excretion of Radioactivity by Male B6C3F1 Mice after a Single Gavage Dose of 300 mg/kg [14C]-p-tert-Butylcatechol . . . . . . . . . . . . . . . . . . G-14
G10 Tissue Distribution of Radioactivity in Male B6C3F1 Mice 72 Hours after a Single Gavage Dose of 300 mg/kg [14C]-p-tert-Butylcatechol . . . . . . . . . . G-14
G11 Cumulative Excretion of Radioactivity by Male B6C3F1 Mice after a Single Dermal Application of [14C]-p-tert-Butylcatechol . . . . . . . . . . . . . . . . . . . . . . G-15
G12 Distribution of Radioactivity in Male B6C3F1 Mice 72 Hours after a Single Dermal Application of [14C]-p-tert-Butylcatechol . . . . . . . . . . . . . . G-15
G2 Mass Spectrum of the Late-Eluting Deconjugated p-tert-Butylcatechol Metabolite . . . . . . G-16 G3 Proton Nuclear Magnetic Resonance Spectrum
of the Late-Eluting Deconjugated p-tert-Butylcatechol Metabolite . . . . . . . . . . . . . . . . . . . G-17 G13 Concentration of p-tert-Butylcatechol Equivalents in the Plasma
of Male F344/N Rats after a Single Gavage Dose or Dermal Application of [14C]-p-tert-Butylcatechol . . . . . . . . . . . . . . . . . . . . . . . . . . . . . . . . . . . . . . . . . . . . . . . . . . G-18

G-2 p-tert-Butylcatechol, NTP TOX 70
ABSORPTION, DISTRIBUTION, METABOLISM, AND EXCRETION STUDIES
INTRODUCTION Studies were conducted in adult male F344/N rats and B6C3F1 mice to determine the absorption, distribution, metabolism, and excretion of p-tert-butylcatechol following intravenous injection, gavage dosing, or dermal application. These studies were conducted by Research Triangle Institute (Research Triangle Park, NC).
MATERIALS AND METHODS [14C]-p-tert-Butylcatechol (15.0 mCi/mmol; lot 940207), labeled on the methine carbon, was obtained from Wizard Laboratories (West Sacramento, CA); the radiochemical purity was determined to be approximately 94% by highperformance liquid chromatography (HPLC) with a DuPont Zorbax Rx-C18 column, a mobile phase of methanol:water (55:45) at a flow rate of 1 mL/minute, and a Ramona-5-LS radioactivity detector with a 0.5-mL solid scintillate flow cell. Radioactivity eluting in each fraction was measured by liquid scintillation spectrometry (LSS). Nonradiolabeled p-tert-butylcatechol (lot DF04501LZ) was obtained from Aldrich Chemical Company, Inc. (Milwaukee, WI); the chemical was identified as p-tert-butylcatechol by proton nuclear magnetic resonance (NMR) spectroscopy and mass spectrometry.
Male F344/N rats and B6C3F1 mice were obtained from Charles River Laboratories, Inc. (Raleigh, NC, and Portage, MI). Animals were quarantined for at least 1 week; rats were 13 to 15 weeks old and mice were 9 to 10 weeks old when the studies began. Animals received certified Purina Rodent Chow No. 5002 and tap water ad libitum. Rats and mice were housed in polycarbonate cages; the day before dosing, animals were transferred to individual glass metabolism chambers that allowed for separate collection of urine and feces.
Rats designated for plasma p-tert-butylcatechol concentration analyses were anesthetized with an intraperitoneal dose of 60 mg/kg ketamine:xylazine (7:1) and then implanted with indwelling jugular cannulae to facilitate the collection of blood samples. The design of the cannula was similar to that of Harms and Ojeda (1974) as modified by McKenna and Bieri (1984). The rats were allowed to recover for 1 day prior to dosing.
Approximately 24 hours before dermal doses were applied, animals were anesthetized with intramuscular injections of 60 mg/kg ketamine:xylazine (7:1) (rats) or intraperitoneal injections of 60 mg/kg sodium pentobarbital (mice). The fur on the back of each animal was clipped, wiped with acetone, dried, and examined; animals with nicks in the clipped area were excluded from the study. The doses were applied to 4 cm2 (rats) or 1 cm2 (mice) areas of skin; the dosing areas were outlined with a permanent, felt-tip marker. Prior to dosing, protective foam appliances were glued onto the rats’ backs with Hollister’s medical adhesive; doses were administered with a balltipped gavage needle and syringe. A nonocclusive cloth cover was attached to the foam appliance, and a protective metal mesh cover was secured over the appliance with elastoplast adhesive bandage after dosing. For mice, a metal tissue capsule was glued over the dosing site with QuicktiteTM Super Glue Gel; doses were administered with a 50 µL Wiretrol (Drummond Scientific Co., Broomall, PA).
Doses for intravenous injection contained 6.3 to 23 µCi [14C]-radiolabel and an appropriate amount of unlabeled p-tert-butylcatechol. The doses for rats were formulated in 10% Emulphor in F344 rat plasma at a dosing volume of 1 mL/kg. The initial set of doses for mice were formulated in isotonic saline; doses for a repeat study were formulated in 10% Emulphor in B6C3F1 mouse plasma. The dosing volume for mice was 2 mL/kg. The doses were injected into a lateral tail vein. The gavage dose formulations contained 16.7 to 19.3 µCi [14C]-radiolabel and an appropriate amount of unlabeled p-tert-butylcatechol. The 2 mg/kg dose was formulated in water, the 200 and 300 mg/kg doses were formulated in 20% Emulphor in water, and the 1,000 mg/kg dose was formulated in 80%
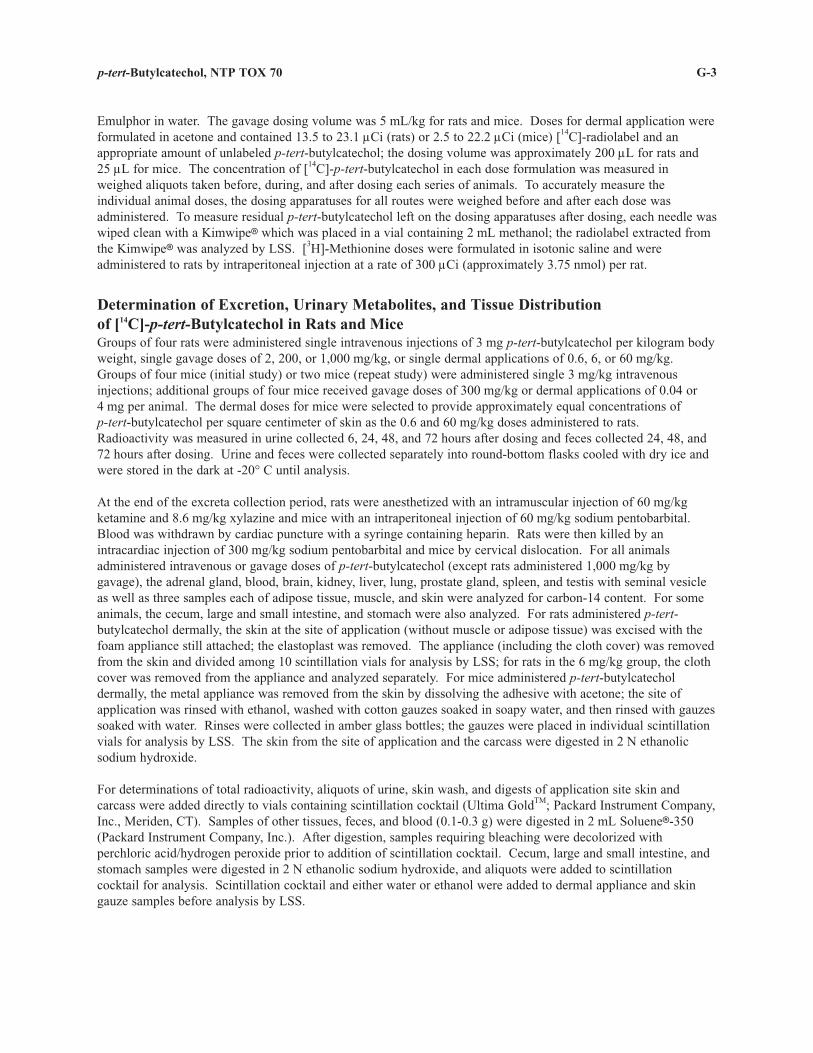
G-3 p-tert-Butylcatechol, NTP TOX 70
Emulphor in water. The gavage dosing volume was 5 mL/kg for rats and mice. Doses for dermal application were formulated in acetone and contained 13.5 to 23.1 µCi (rats) or 2.5 to 22.2 µCi (mice) [14C]-radiolabel and an appropriate amount of unlabeled p-tert-butylcatechol; the dosing volume was approximately 200 µL for rats and 25 µL for mice. The concentration of [14C]-p-tert-butylcatechol in each dose formulation was measured in weighed aliquots taken before, during, and after dosing each series of animals. To accurately measure the individual animal doses, the dosing apparatuses for all routes were weighed before and after each dose was administered. To measure residual p-tert-butylcatechol left on the dosing apparatuses after dosing, each needle was wiped clean with a Kimwipe7 which was placed in a vial containing 2 mL methanol; the radiolabel extracted from the Kimwipe7 was analyzed by LSS. [3H]-Methionine doses were formulated in isotonic saline and were administered to rats by intraperitoneal injection at a rate of 300 µCi (approximately 3.75 nmol) per rat.
Determination of Excretion, Urinary Metabolites, and Tissue Distribution of [14C]-p-tert-Butylcatechol in Rats and Mice Groups of four rats were administered single intravenous injections of 3 mg p-tert-butylcatechol per kilogram body weight, single gavage doses of 2, 200, or 1,000 mg/kg, or single dermal applications of 0.6, 6, or 60 mg/kg. Groups of four mice (initial study) or two mice (repeat study) were administered single 3 mg/kg intravenous injections; additional groups of four mice received gavage doses of 300 mg/kg or dermal applications of 0.04 or 4 mg per animal. The dermal doses for mice were selected to provide approximately equal concentrations of p-tert-butylcatechol per square centimeter of skin as the 0.6 and 60 mg/kg doses administered to rats. Radioactivity was measured in urine collected 6, 24, 48, and 72 hours after dosing and feces collected 24, 48, and 72 hours after dosing. Urine and feces were collected separately into round-bottom flasks cooled with dry ice and were stored in the dark at -20° C until analysis.
At the end of the excreta collection period, rats were anesthetized with an intramuscular injection of 60 mg/kg ketamine and 8.6 mg/kg xylazine and mice with an intraperitoneal injection of 60 mg/kg sodium pentobarbital. Blood was withdrawn by cardiac puncture with a syringe containing heparin. Rats were then killed by an intracardiac injection of 300 mg/kg sodium pentobarbital and mice by cervical dislocation. For all animals administered intravenous or gavage doses of p-tert-butylcatechol (except rats administered 1,000 mg/kg by gavage), the adrenal gland, blood, brain, kidney, liver, lung, prostate gland, spleen, and testis with seminal vesicle as well as three samples each of adipose tissue, muscle, and skin were analyzed for carbon-14 content. For some animals, the cecum, large and small intestine, and stomach were also analyzed. For rats administered p-tertbutylcatechol dermally, the skin at the site of application (without muscle or adipose tissue) was excised with the foam appliance still attached; the elastoplast was removed. The appliance (including the cloth cover) was removed from the skin and divided among 10 scintillation vials for analysis by LSS; for rats in the 6 mg/kg group, the cloth cover was removed from the appliance and analyzed separately. For mice administered p-tert-butylcatechol dermally, the metal appliance was removed from the skin by dissolving the adhesive with acetone; the site of application was rinsed with ethanol, washed with cotton gauzes soaked in soapy water, and then rinsed with gauzes soaked with water. Rinses were collected in amber glass bottles; the gauzes were placed in individual scintillation vials for analysis by LSS. The skin from the site of application and the carcass were digested in 2 N ethanolic sodium hydroxide.
For determinations of total radioactivity, aliquots of urine, skin wash, and digests of application site skin and carcass were added directly to vials containing scintillation cocktail (Ultima GoldTM; Packard Instrument Company, Inc., Meriden, CT). Samples of other tissues, feces, and blood (0.1-0.3 g) were digested in 2 mL Soluene7-350 (Packard Instrument Company, Inc.). After digestion, samples requiring bleaching were decolorized with perchloric acid/hydrogen peroxide prior to addition of scintillation cocktail. Cecum, large and small intestine, and stomach samples were digested in 2 N ethanolic sodium hydroxide, and aliquots were added to scintillation cocktail for analysis. Scintillation cocktail and either water or ethanol were added to dermal appliance and skin gauze samples before analysis by LSS.
G-4 p-tert-Butylcatechol, NTP TOX 70
Urine samples were filtered through a 0.45-µm Millex7-HV filter (Millipore Corp., Bedford, MA) and analyzed by HPLC (using the system described for chemical purity analyses) for unchanged p-tert-butylcatechol and its metabolites. Selected urine samples were incubated with $-glucuronidase/sulfatase, purified $-glucuronidase, or sulfatase obtained from Sigma Chemical Company (St. Louis, MO) before HPLC analysis. Solutions of $-glucuronidase/sulfatase were prepared from Helix pomatia and contained 100,000 units glucuronidase and 1,000 to 5,000 units sulfatase per mL; 20 µL were added to 450 µL urine and 50 µL 1 M ammonium acetate. The mixture was heated for 2 hours at 37° C before HPLC analysis. Purified $-glucuronidase was prepared from Escherichia coli; 1,000 U were added to 200 to 400 µL urine, and the mixture was incubated for 4 to 18 hours at 37° C before analysis. Sulfatase was prepared from Aerobacter aerogenes and contained 14.5 units sulfatase and no glucuronidase per mL of solution; 10 µL sulfatase was added to 300 µL of 0.05 M TRIZMA buffer (pH 7.5; Sigma Chemical Company) and 100 µL urine. The mixture was incubated at 37° C for 2 to 4 hours before analysis.
Characterization of Urinary Metabolites in Rats Urine collected during the first 24 hours after dosing from rats administered 60 mg/kg dermally was analyzed for urinary metabolites. Solid-phase extraction was performed with a Bond Elut C18 SPE cartridge containing 500 mg packing material in a 6-mL syringe barrel (Varian, Inc., Palo Alto, CA); the cartridge was prewetted with 1 mL methanol followed by 2 mL water. The cartridge was loaded with 1 mL urine and then rinsed with 2 mL water followed by 2 mL 5% aqueous methanol to remove salts. Metabolites were eluted with a rinse of 2 mL methanol, which was evaporated under a stream of nitrogen at 37° C. $-Glucuronidase/sulfatase (20-30 µL) was added, and the mixture was incubated overnight at 37° C. The sample was then centrifuged and the supernatant was aspirated and collected; 1 mL methanol was added to the pellet, and the sample was vortexed and centrifuged. The original and methanol supernatants were analyzed by HPLC as described above. Both supernatants contained undeconjugated metabolites, p-tert-butylcatechol, and a late-eluting, deconjugated metabolite; the methanol supernatant, which contained the larger portion of the deconjugated metabolite, was analyzed by HPLC and the fractions containing this deconjugated metabolite were collected. This eluant was concentrated to approximately 50% of its original volume under a stream of nitrogen at 37° C. Deconjugated p-tert-butylcatechol metabolites were characterized by gas chromatography/mass spectrometry with electron impact ionization and NMR spectroscopy.
Determination of Plasma Concentrations of [14C]-p-tert-Butylcatechol in Rats Groups of four rats were administered single gavage doses of 200 mg/kg or single dermal applications of 60 mg/kg. Blood samples (0.3 mL) were collected before dosing and at 15 and 30 minutes and 1, 2, 4, 8, and 24 hours after dosing. The samples were centrifuged to separate the plasma, which was analyzed by liquid scintillation spectrometry for total radioactivity. Plasma samples were extracted twice with 400 µL methyl alcohol; the supernatants were combined, evaporated to dryness, and reconstituted in 100 µL of the mobile phase before analysis by HPLC as described above. Rats were asphyxiated with carbon dioxide. No necropsies were performed on these groups of rats. For rats administered p-tert-butylcatechol dermally, the foam appliance was analyzed for carbon-14 content as described for the tissue distribution studies; the cloth cover was removed from the appliance and analyzed separately.
RESULTS AND DISCUSSION
Excretion, Urinary Metabolites, and Tissue Distribution of [14C]-p-tert-Butylcatechol in Rats and Mice The excretion of [14C]-p-tert-butylcatechol administered to rats by intravenous injection is shown in Table G1; distribution in tissues is shown in Table G2. After intravenous injection, the radioactivity was rapidly excreted in urine, with 54% of the administered radioactivity recovered in the first 6 hours after dosing. After 72 hours, approximately 90% of the dose had been recovered in the urine and 6% in the feces; only 0.3% of the dose
G-5 p-tert-Butylcatechol, NTP TOX 70
remained in the tissues. No tissues developed high tissue/blood ratios of p-tert-butylcatechol equivalents; this finding is consistent with the production of very polar metabolites.
The excretion of [14C]-p-tert-butylcatechol administered to rats by gavage is shown in Table G3; distribution of the 2 and 200 mg/kg doses in tissues is shown in Table G4. The overall rates and routes of excretion were similar between the 2 and 200 mg/kg doses 6 hours after dosing. The doses were excreted primarily in the urine and approximately 90% of the radiolabel was recovered, indicating a very high rate of oral absorption. For the 1,000 mg/kg dose, the rate of excretion was slower than for the lower doses, and a greater percentage of the radioactivity (25%) was excreted in the feces. Similar to rats dosed intravenously, the tissues of rats in the 2 and 200 mg/kg groups did not develop significant concentrations of p-tert-butylcatechol-derived residues; also, very little radioactivity remained in the gastrointestinal tract tissues or contents. The 0-to-6-hour urinary metabolite profile for the 2 mg/kg gavage dose is shown in Figure G1a. This profile is representative of those obtained for each route of administration and for both species. p-tert-Butylcatechol was excreted primarily as conjugates and other polar metabolites. Incubation with $-glucuronidase or sulfatase hydrolyzed the conjugates to give parent and a less polar analyte (retention time 23.5 minutes), as shown in Figure G1b. HPLC analyses of urine samples treated with purified $-glucuronidase or purified sulfatase demonstrated that sulfatase liberated a greater proportion of the polar metabolites, indicating that sulfate conjugates comprise the majority of the polar metabolites (data not shown).
The excretion of [14C]-p-tert-butylcatechol applied dermally to rats is shown in Table G5; distribution of radioactivity 72 hours after dosing is shown in Table G6. Absorption increased with increasing dose. Approximately two-thirds of the 60 mg/kg dose was absorbed by 24 hours after application and more than 80% by 72 hours. The 0.6 mg/kg dose was far less well absorbed. The severity of local inflammation at the site of application increased with increasing dose; this increase in blood flow to the area may have been responsible for the dose-related increase in absorption. Alternatively, p-tert-butylcatechol may have had a solvent effect on the permeability of the skin, or saturation of the covalent binding of dermal sulfhydryls with the Michael-accepting oxidative products of p-tert-butylcatechol may have occurred at the higher doses. The percentage of the dose recovered in the foam appliance was greatest for the 0.6 mg/kg dose and decreased with increasing dose. The cloth appliance cover in the 6 mg/kg group contained 1.5% to 5.4% of the dose (data not shown). HPLC analyses of urine collected from the 0.6 and 60 mg/kg groups from 0 to 6 hours after dosing indicated only polar metabolites (data not shown); no parent compound was detected in the urine.
The excretion of [14C]-p-tert-butylcatechol administered to mice by intravenous injection is shown in Table G7; distribution in tissues is shown in Table G8. Mice excreted the radioactivity more slowly than did rats, with greater concentrations excreted in the feces (28% for mice versus 6% for rats). However, the mouse feces samples were often contaminated with urine-soaked feed pellet solids. As for rats, no tissues developed high concentrations of p-tert-butylcatechol residues. Because the tissue-to-blood ratio favored lung over liver by a factor of 10 for mice but was approximately equal for rats, a repeat study was conducted for mice with the dose formulated in a mixture of Emulphor in plasma as for rats. The percentage of dose excreted was similar between vehicles, and the tissue-to-blood ratio in the repeat study was only slightly greater for lung than for liver (Tables G7 and G8). Therefore, it was speculated that the dose for the initial study (formulated in isotonic saline) contained particles of p-tert-butylcatechol large enough to lodge in the lung following injection; the dose for the repeat study contained no particles of this size.
The excretion of [14C]-p-tert-butylcatechol administered to mice by gavage is shown in Table G9; distribution in tissues is shown in Table G10. Approximately half of the administered dose was excreted by 24 hours and 90% by 72 hours, mostly in urine. The relatively high concentration of radioactivity recovered in feces may have been due to urine-soaked feed particles and feces in the fecal samples. No tissues developed high concentrations of p-tertbutylcatechol residues.
The excretion of [14C]-p-tert-butylcatechol applied dermally to mice is shown in Table G11; distribution of radioactivity 72 hours after dosing is shown in Table G12. Most of the doses were absorbed by 72 hours (72% of
G-6 p-tert-Butylcatechol, NTP TOX 70
the 0.04 mg dose and 86% of the 4 mg dose). The absorbed dose was excreted rapidly, with 40% of the 0.04 mg dose and 57% of the 4 mg dose excreted in the first 24 hours after dosing. Mice administered 4 mg had local inflammation at the site of application.
Characterization of Urinary Metabolites in Rats After intravenous injection, gavage dosing, or dermal application of p-tert-butylcatechol to rats, polar metabolites were excreted in urine. Incubation of the urine with sulfatase-free $-glucuronidase caused little change in the metabolite profile; however, incubation of the urine with sulfatase caused significant changes. The polar metabolite peak was greatly reduced, with the concomitant appearance of a peak coeluting with p-tertbutylcatechol and a later-eluting peak with a retention time of 23.5 minutes (Figure G1b). A small polar peak with a retention time of 5 minutes also appeared. The late-eluting peak was collected and analyzed by gas chromatography with mass spectrometry (Figure G2). The mass spectrum displayed ions at 180 (M+) and 165 (M-CH3) consistent with mono-O-methylated p-tert-butylcatechol; the spectrum matched a literature reference (91% probability) for t-butyl-2-methoxyphenol (Wiley/NBS Mass Spectral Database). The proton NMR spectrum of the isolated metabolite is shown in Figure G3. Resonances from the methyl protons of the t-butyl group appear as a singlet at 1.22 ppm. The phenyl protons appear in the pattern of a 1,3,4-trisubstituted benzene at 6.79 to 6.99 ppm, and the protons of the O-methyl appear as a singlet at 3.81 ppm. The data were not sufficient to distinguish between the two possible O-methylated metabolites. p-tert-Butylcatechol is probably O-methylated by catechol O-methyltransferase. In vitro, catechol O-methyltransferase catalyzes the conversion of catechols to both o- and p-methylated products. Creveling et al. (1972) showed that the meta/para (m/p) ratio is dependent on the nature of the ring substituents, and less polar substrates such as 4-methyl and 4-ethyl catechol gave ratios near unity. However, the authors apparently were unable to separate the isomers of O-methylated p-tert-butylcatechol and, therefore, did not report a ratio for this compound. Katz and Jacobson (1972) correlated substrate kinetic parameters with steric parameters of the substituents of the substrate and calculated a predicted m/p ratio of 0.13 for the O-methylation of p-tert-butylcatechol. This value suggests that the late-eluting isolated metabolite is the p-O-methylated isomer. However, Daly et al. (1960) noted that less of the para isomer is often formed in vivo than in vitro. Therefore, it is difficult to speculate which of the isomers is excreted as the sulfate conjugate in rat urine, and it is possible that both isomers are present.
Plasma Concentrations of [14C]-p-tert-Butylcatechol in Rats The concentrations of tert-butylcatechol equivalents in plasma for rats administered 200 mg/kg by gavage or 60 mg/kg dermally are shown in Table G13. Peak concentrations were observed 30 minutes after gavage dosing and 1 hour after dermal application; no parent compound was detected in plasma extracts for either route.
REFERENCES Creveling, C.R., Morris, N., Shimizu, H., Ong, H.H., and Daly, J. (1972). Catechol O-methyltransferase. IV. Factors affecting m- and p-methylation of substituted catechols. Mol. Pharmacol. 8, 398-409.
Daly, J.W., Axelrod, J., and Witkop, B. (1960). Dynamic aspects of enzymatic O-methylation and -demethylation of catechols in vitro and in vivo. J. Biol. Chem. 235, 1155-1159.
Harms, P.G., and Ojeda, S.R. (1974). A rapid and simple procedure for chronic cannulation of the rat jugular vein. J. Appl. Physiol. 36, 391-392.
Katz, R., and Jacobson, A.E. (1972). Chemical structure-activity correlation in the O-methylation of substituted catechols by catechol O-methyltransferase. Mol. Pharmacol. 8, 594-599.
McKenna, M.C., and Bieri, J.G. (1984). Multilayer cannula for long-term infusion of unrestrained rats. Lab. Anim. Sci. 34, 308-310.
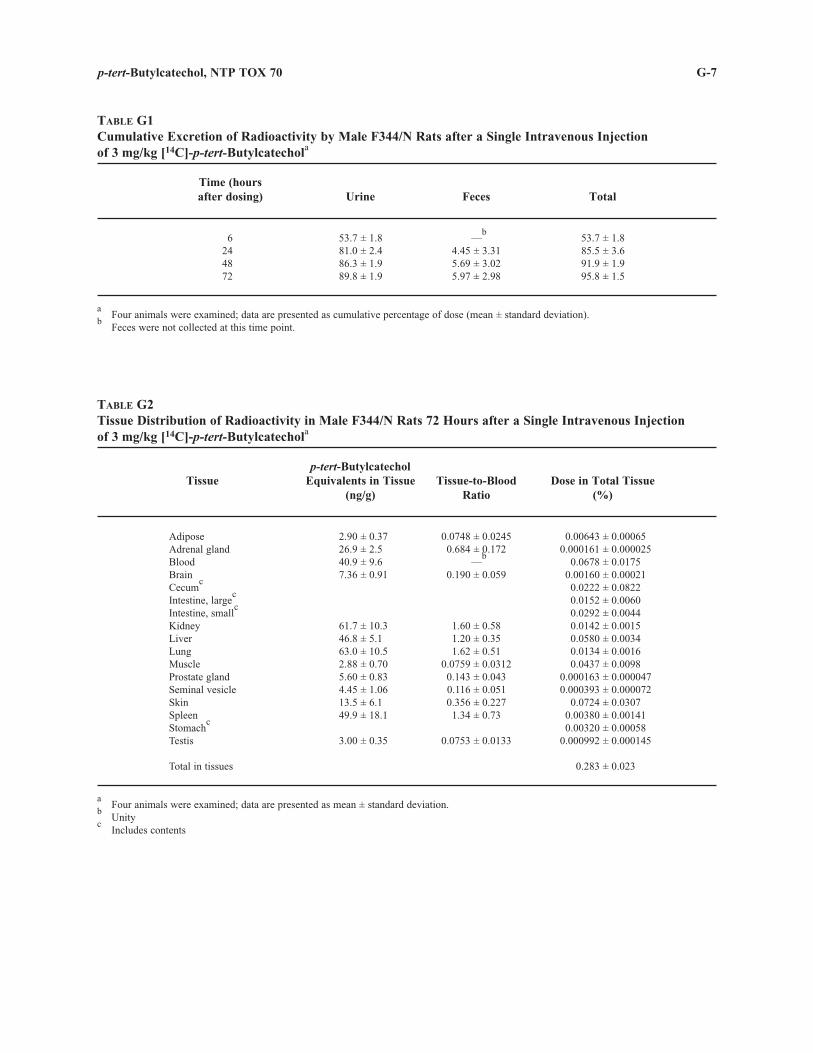
G-7 p-tert-Butylcatechol, NTP TOX 70
TABLE G1 Cumulative Excretion of Radioactivity by Male F344/N Rats after a Single Intravenous Injection of 3 mg/kg [14C]-p-tert-Butylcatechola
Time (hours after dosing) Urine Feces Total
6 24 48 72
53.7 ± 1.8 81.0 ± 2.4 86.3 ± 1.9 89.8 ± 1.9
— b
4.45 ± 3.31 5.69 ± 3.02 5.97 ± 2.98
53.7 ± 1.8 85.5 ± 3.6 91.9 ± 1.9 95.8 ± 1.5
a Four animals were examined; data are presented as cumulative percentage of dose (mean ± standard deviation).
b Feces were not collected at this time point.
TABLE G2 Tissue Distribution of Radioactivity in Male F344/N Rats 72 Hours after a Single Intravenous Injection of 3 mg/kg [14C]-p-tert-Butylcatechola
p-tert-Butylcatechol Tissue Equivalents in Tissue Tissue-to-Blood Dose in Total Tissue
(ng/g) Ratio (%)
Adipose 2.90 ± 0.37 0.0748 ± 0.0245 0.00643 ± 0.00065 Adrenal gland Blood
26.9 ± 2.5 40.9 ± 9.6
0.684 ± 0.172 —
b 0.000161 ± 0.000025
0.0678 ± 0.0175 Brain 7.36 ± 0.91 0.190 ± 0.059 0.00160 ± 0.00021 Cecum
c 0.0222 ± 0.0822
Intestine, largec
Intestine, smallc
0.0152 ± 0.0060 0.0292 ± 0.0044
Kidney 61.7 ± 10.3 1.60 ± 0.58 0.0142 ± 0.0015 Liver 46.8 ± 5.1 1.20 ± 0.35 0.0580 ± 0.0034 Lung 63.0 ± 10.5 1.62 ± 0.51 0.0134 ± 0.0016 Muscle 2.88 ± 0.70 0.0759 ± 0.0312 0.0437 ± 0.0098 Prostate gland 5.60 ± 0.83 0.143 ± 0.043 0.000163 ± 0.000047 Seminal vesicle 4.45 ± 1.06 0.116 ± 0.051 0.000393 ± 0.000072 Skin 13.5 ± 6.1 0.356 ± 0.227 0.0724 ± 0.0307 Spleen Stomach
c 49.9 ± 18.1 1.34 ± 0.73 0.00380 ± 0.00141
0.00320 ± 0.00058 Testis 3.00 ± 0.35 0.0753 ± 0.0133 0.000992 ± 0.000145
Total in tissues 0.283 ± 0.023
a Four animals were examined; data are presented as mean ± standard deviation.
b Unity Includes contents
c
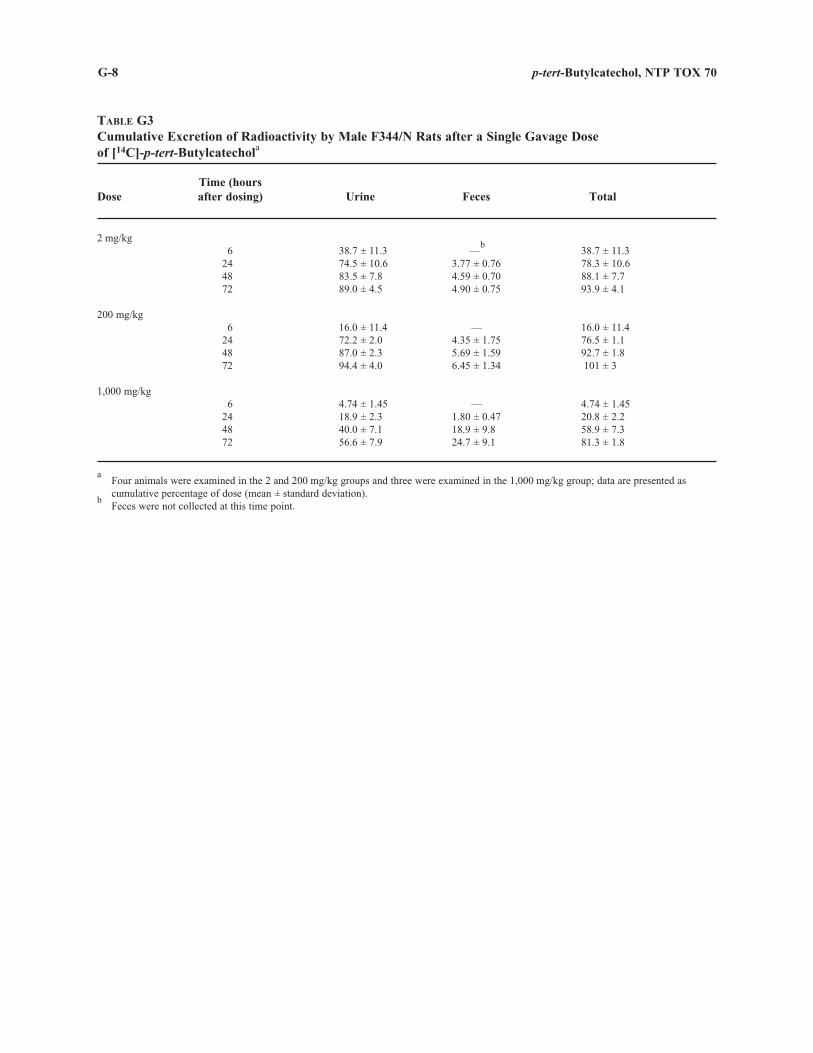
G-8 p-tert-Butylcatechol, NTP TOX 70
TABLE G3 Cumulative Excretion of Radioactivity by Male F344/N Rats after a Single Gavage Dose of [14C]-p-tert-Butylcatechola
Dose Time (hours after dosing) Urine Feces Total
2 mg/kg 6
24 48 72
38.7 ± 11.3 74.5 ± 10.6 83.5 ± 7.8 89.0 ± 4.5
— b
3.77 ± 0.76 4.59 ± 0.70 4.90 ± 0.75
38.7 ± 11.3 78.3 ± 10.6 88.1 ± 7.7 93.9 ± 4.1
200 mg/kg 6
24 48 72
16.0 ± 11.4 72.2 ± 2.0 87.0 ± 2.3 94.4 ± 4.0
— 4.35 ± 1.75 5.69 ± 1.59 6.45 ± 1.34
16.0 ± 11.4 76.5 ± 1.1 92.7 ± 1.8 101 ± 3
1,000 mg/kg 6
24 48 72
4.74 ± 1.45 18.9 ± 2.3 40.0 ± 7.1 56.6 ± 7.9
— 1.80 ± 0.47 18.9 ± 9.8 24.7 ± 9.1
4.74 ± 1.45 20.8 ± 2.2 58.9 ± 7.3 81.3 ± 1.8
a Four animals were examined in the 2 and 200 mg/kg groups and three were examined in the 1,000 mg/kg group; data are presented as cumulative percentage of dose (mean ± standard deviation).
b Feces were not collected at this time point.

G-9 p-tert-Butylcatechol, NTP TOX 70
TABLE G4 Tissue Distribution of Radioactivity in Male F344/N Rats 72 Hours after a Single Gavage Dose of [14C]-p-tert-Butylcatechola
p-tert-Butylcatechol Dose Tissue Equivalents in Tissue Tissue-to-Blood Dose in Total Tissue
(ng/g) Ratio (%)
2 mg/kg Adipose 0.381 ± 0.279 0.0205 ± 0.0227 0.00135 ± 0.00098 Adrenal gland Blood
0.00 ± 0.00 25.1 ± 13.5
0.00 ± 0.00 —
b 0.00 ± 0.00
0.0670 ± 0.0366 Brain 0.0564 ± 0.0639 0.00345 ± 0.00542 0.0000191 ± 0.0000224 Cecum
c 0.0221 ± 0.0075
Intestine, largec
Intestine, smallc
0.0124 ± 0.0009 0.0384 ± 0.0029
Kidney 79.4 ± 25.8 3.47 ± 0.92 0.0305 ± 0.0114 Liver 27.3 ± 1.9 1.33 ± 0.63 0.0603 ± 0.0019 Lung 22.3 ± 10.0 0.982 ± 0.502 0.00782 ± 0.00412 Muscle 0.0377 ± 0.0260 0.00199 ± 0.00200 0.000919 ± 0.000629 Prostate gland 1.15 ± 1.13 0.072 ± 0.102 0.0000585 ± 0.0000562 Seminal vesicle 0.602 ± 0.595 0.0388 ± 0.0532 0.0000864 ± 0.0000581 Skin 1.43 ± 0.84 0.0811 ± 0.0876 0.0123 ± 0.0070 Spleen Stomach
c 26.3 ± 8.95 1.13 ± 0.24 0.00344 ± 0.00120
0.125 ± 0.038 Testis 0.184 ± 0.117 0.0107 ± 0.0120 0.000101 ± 0.000070
Total in tissues 0.18 ± 0.05
200 mg/kg Adipose 69.8 ± 18.9 0.0580 ± 0.0182 0.00272 ± 0.00075 Adrenal gland 105 ± 24 0.0871 ± 0.0214 0.0000118 ± 0.0000028 Blood 1,220 ± 127 — 0.0353 ± 0.0035 Brain 19.2 ± 6.6 0.0159 ± 0.0060 0.0000676 ± 0.0000199 Cecum
c 0.0468 ± 0.0140
Intestine, largec
Intestine, smallc
0.0216 ± 0.0070 0.0468 ± 0.0106
Kidney 2,860 ± 1,060 2.39 ± 0.96 0.0105 ± 0.0037 Liver 2,840 ± 137 2.34 ± 0.26 0.0638 ± 0.0119 Lung 1,390 ± 219 1.14 ± 0.16 0.00489 ± 0.00123 Muscle 22.0 ± 6.2 0.0178 ± 0.0042 0.00586 ± 0.00160 Prostate gland 139 ± 78 0.119 ± 0.079 0.0000773 ± 0.0000411 Seminal vesicle 58.7 ± 29.5 0.0487 ± 0.0260 0.0000823 ± 0.0000393 Skin 368 ± 281 0.299 ± 0.223 0.0347 ± 0.0264 Spleen Stomach
c 3,110 ± 2,880 2.42 ± 2.03 0.00412 ± 0.00367
0.0102 ± 0.0020 Testis 28.2 ± 10.3 0.0232 ± 0.0088 0.000167 ± 0.000054
Total in tissues 0.16 ± 0.05
a Four animals were examined in each group; data are presented as mean ± standard deviation.
b Unity Includes contents
c

G-10 p-tert-Butylcatechol, NTP TOX 70
FIGURE G1 High-Performance Liquid Chromatographic Radiochromatogram of Urine Collected from 0 to 6 Hours after a Single Gavage Dose of 2 mg/kg [14C]-p-tert-Butylcatechol to Male F344/N Rats
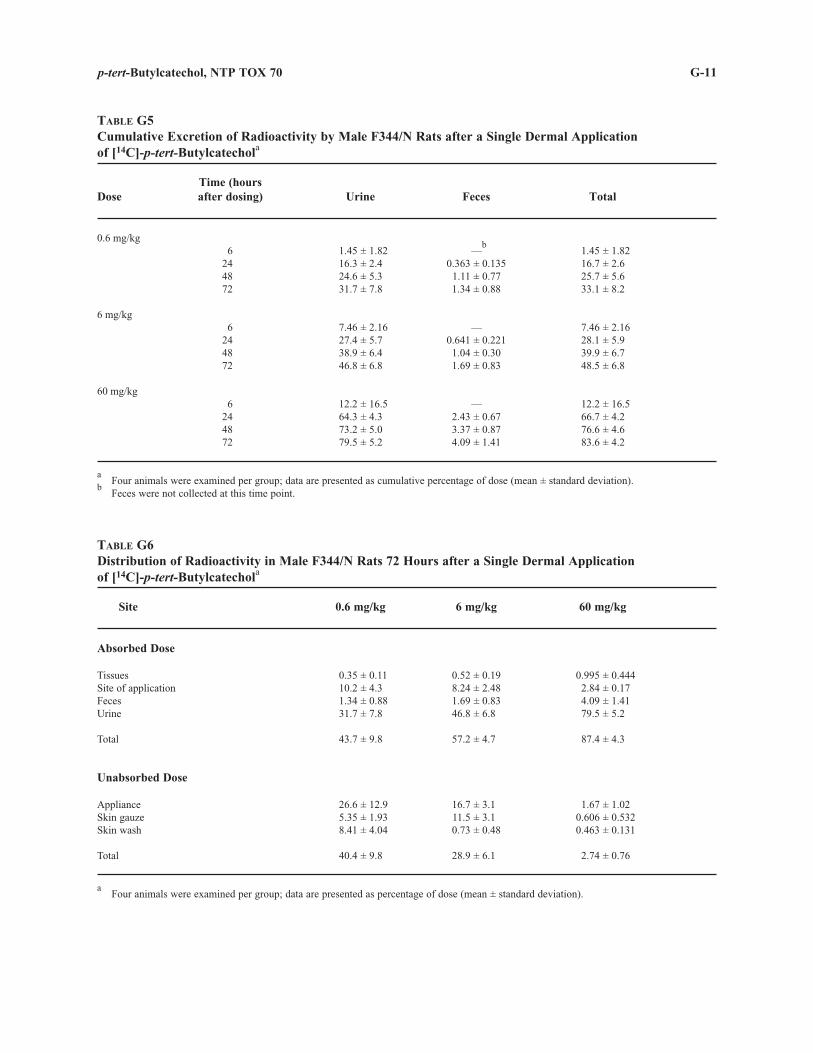
G-11 p-tert-Butylcatechol, NTP TOX 70
TABLE G5 Cumulative Excretion of Radioactivity by Male F344/N Rats after a Single Dermal Application of [14C]-p-tert-Butylcatechola
Dose Time (hours after dosing) Urine Feces Total
0.6 mg/kg 6
24 48 72
1.45 ± 1.82 16.3 ± 2.4 24.6 ± 5.3 31.7 ± 7.8
— b
0.363 ± 0.135 1.11 ± 0.77 1.34 ± 0.88
1.45 ± 1.82 16.7 ± 2.6 25.7 ± 5.6 33.1 ± 8.2
6 mg/kg 6
24 48 72
7.46 ± 2.16 27.4 ± 5.7 38.9 ± 6.4 46.8 ± 6.8
— 0.641 ± 0.221 1.04 ± 0.30 1.69 ± 0.83
7.46 ± 2.16 28.1 ± 5.9 39.9 ± 6.7 48.5 ± 6.8
60 mg/kg 6
24 48 72
12.2 ± 16.5 64.3 ± 4.3 73.2 ± 5.0 79.5 ± 5.2
— 2.43 ± 0.67 3.37 ± 0.87 4.09 ± 1.41
12.2 ± 16.5 66.7 ± 4.2 76.6 ± 4.6 83.6 ± 4.2
a Four animals were examined per group; data are presented as cumulative percentage of dose (mean ± standard deviation).
b Feces were not collected at this time point.
TABLE G6 Distribution of Radioactivity in Male F344/N Rats 72 Hours after a Single Dermal Application of [14C]-p-tert-Butylcatechola
Site 0.6 mg/kg 6 mg/kg 60 mg/kg
Absorbed Dose
Tissues 0.35 ± 0.11 0.52 ± 0.19 0.995 ± 0.444 Site of application 10.2 ± 4.3 8.24 ± 2.48 2.84 ± 0.17 Feces 1.34 ± 0.88 1.69 ± 0.83 4.09 ± 1.41 Urine 31.7 ± 7.8 46.8 ± 6.8 79.5 ± 5.2
Total 43.7 ± 9.8 57.2 ± 4.7 87.4 ± 4.3
Unabsorbed Dose
Appliance 26.6 ± 12.9 16.7 ± 3.1 1.67 ± 1.02 Skin gauze 5.35 ± 1.93 11.5 ± 3.1 0.606 ± 0.532 Skin wash 8.41 ± 4.04 0.73 ± 0.48 0.463 ± 0.131
Total 40.4 ± 9.8 28.9 ± 6.1 2.74 ± 0.76
a Four animals were examined per group; data are presented as percentage of dose (mean ± standard deviation).
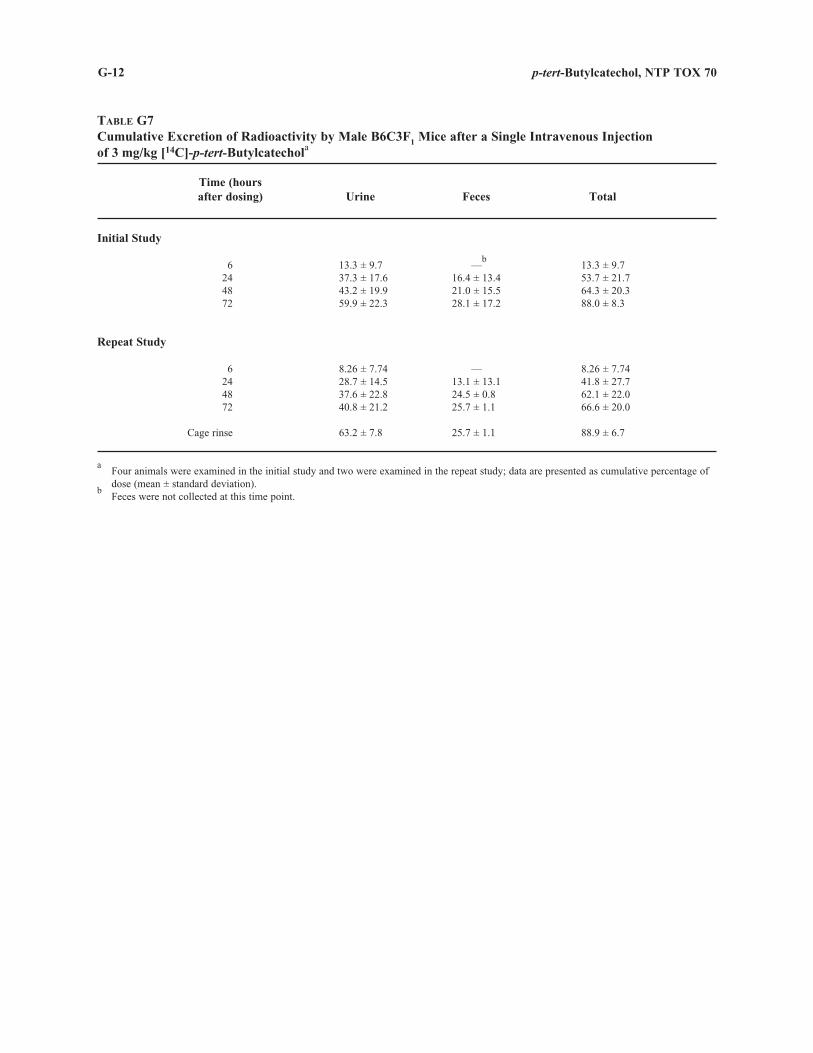
G-12 p-tert-Butylcatechol, NTP TOX 70
TABLE G7 Cumulative Excretion of Radioactivity by Male B6C3F1 Mice after a Single Intravenous Injection of 3 mg/kg [14C]-p-tert-Butylcatechola
Time (hours after dosing) Urine Feces Total
Initial Study
b6 13.3 ± 9.7 — 13.3 ± 9.7
24 37.3 ± 17.6 16.4 ± 13.4 53.7 ± 21.7 48 43.2 ± 19.9 21.0 ± 15.5 64.3 ± 20.3 72 59.9 ± 22.3 28.1 ± 17.2 88.0 ± 8.3
Repeat Study
6 8.26 ± 7.74 — 8.26 ± 7.74 24 28.7 ± 14.5 13.1 ± 13.1 41.8 ± 27.7 48 37.6 ± 22.8 24.5 ± 0.8 62.1 ± 22.0 72 40.8 ± 21.2 25.7 ± 1.1 66.6 ± 20.0
Cage rinse 63.2 ± 7.8 25.7 ± 1.1 88.9 ± 6.7
a Four animals were examined in the initial study and two were examined in the repeat study; data are presented as cumulative percentage of dose (mean ± standard deviation).
b Feces were not collected at this time point.
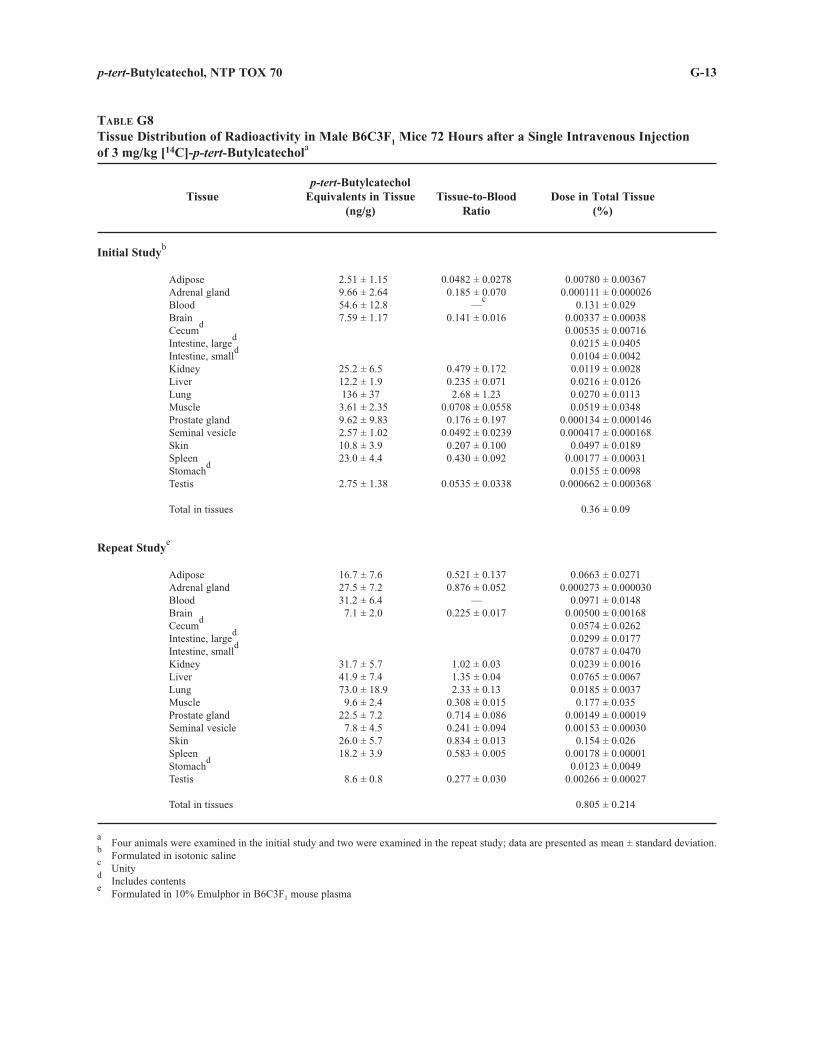
G-13 p-tert-Butylcatechol, NTP TOX 70
TABLE G8 Tissue Distribution of Radioactivity in Male B6C3F1 Mice 72 Hours after a Single Intravenous Injection of 3 mg/kg [14C]-p-tert-Butylcatechola
Tissue p-tert-Butylcatechol
Equivalents in Tissue (ng/g)
Tissue-to-Blood Ratio
Dose in Total Tissue (%)
Initial Studyb
Adipose Adrenal gland Blood Brain Cecum
d
Intestine, larged
Intestine, smalld
Kidney Liver Lung Muscle Prostate gland Seminal vesicle Skin Spleen Stomach
d
Testis
2.51 ± 1.15 9.66 ± 2.64 54.6 ± 12.8 7.59 ± 1.17
25.2 ± 6.5 12.2 ± 1.9 136 ± 37 3.61 ± 2.35 9.62 ± 9.83 2.57 ± 1.02 10.8 ± 3.9 23.0 ± 4.4
2.75 ± 1.38
0.0482 ± 0.0278 0.185 ± 0.070
— c
0.141 ± 0.016
0.479 ± 0.172 0.235 ± 0.071 2.68 ± 1.23
0.0708 ± 0.0558 0.176 ± 0.197
0.0492 ± 0.0239 0.207 ± 0.100 0.430 ± 0.092
0.0535 ± 0.0338
0.00780 ± 0.00367 0.000111 ± 0.000026
0.131 ± 0.029 0.00337 ± 0.00038 0.00535 ± 0.00716 0.0215 ± 0.0405 0.0104 ± 0.0042 0.0119 ± 0.0028 0.0216 ± 0.0126 0.0270 ± 0.0113 0.0519 ± 0.0348
0.000134 ± 0.000146 0.000417 ± 0.000168
0.0497 ± 0.0189 0.00177 ± 0.00031 0.0155 ± 0.0098
0.000662 ± 0.000368
Total in tissues 0.36 ± 0.09
Repeat Studye
Adipose Adrenal gland Blood Brain Cecum
d
Intestine, larged
Intestine, smalld
Kidney Liver Lung Muscle Prostate gland Seminal vesicle Skin Spleen Stomach
d
Testis
16.7 ± 7.6 27.5 ± 7.2 31.2 ± 6.4
7.1 ± 2.0
31.7 ± 5.7 41.9 ± 7.4 73.0 ± 18.9
9.6 ± 2.4 22.5 ± 7.2
7.8 ± 4.5 26.0 ± 5.7 18.2 ± 3.9
8.6 ± 0.8
0.521 ± 0.137 0.876 ± 0.052
— 0.225 ± 0.017
1.02 ± 0.03 1.35 ± 0.04 2.33 ± 0.13
0.308 ± 0.015 0.714 ± 0.086 0.241 ± 0.094 0.834 ± 0.013 0.583 ± 0.005
0.277 ± 0.030
0.0663 ± 0.0271 0.000273 ± 0.000030
0.0971 ± 0.0148 0.00500 ± 0.00168 0.0574 ± 0.0262 0.0299 ± 0.0177 0.0787 ± 0.0470 0.0239 ± 0.0016 0.0765 ± 0.0067 0.0185 ± 0.0037 0.177 ± 0.035
0.00149 ± 0.00019 0.00153 ± 0.00030
0.154 ± 0.026 0.00178 ± 0.00001 0.0123 ± 0.0049
0.00266 ± 0.00027
Total in tissues 0.805 ± 0.214
a Four animals were examined in the initial study and two were examined in the repeat study; data are presented as mean ± standard deviation.
b Formulated in isotonic saline Unity
d Includes contents
e Formulated in 10% Emulphor in B6C3F1 mouse plasma
c

G-14 p-tert-Butylcatechol, NTP TOX 70
TABLE G9 Cumulative Excretion of Radioactivity by Male B6C3F1 Mice after a Single Gavage Dose of 300 mg/kg [14C]-p-tert-Butylcatechola
Time (hours after dosing) Urine Feces Total
6 24 48 72
21.3 ± 15.5 40.2 ± 18.1 47.6 ± 18.6 50.1 ± 18.1
— b
14.2 ± 6.2 20.5 ± 6.2 25.6 ± 9.5
21.3 ± 15.5 54.4 ± 15.4 68.1 ± 12.8 75.7 ± 10.3
Cage rinse 64.6 ± 11.1 25.6 ± 9.5 90.2 ± 1.6
a Four animals were examined; data are presented as cumulative percentage of dose (mean ± standard deviation).
b Feces were not collected at this time point.
TABLE G10 Tissue Distribution of Radioactivity in Male B6C3F1 Mice 72 Hours after a Single Gavage Dose of 300 mg/kg [14C]-p-tert-Butylcatechola
p-tert-Butylcatechol Tissue Equivalents in Tissue Tissue-to-Blood Dose in Total Tissue
(ng/g) Ratio (%)
Adipose 373 ± 153 0.733 ± 0.090 0.0117 ± 0.0047 Adrenal gland Blood
577 ± 161 495 ± 146
1.22 ± 0.39 —
b 0.000137 ± 0.000165
0.0117 ± 0.0034 Brain 169 ± 55 0.35 ± 0.12 0.00103 ± 0.00044 Cecum
c 0.0145 ± 0.0038
Intestine, largec
Intestine, smallc
0.00771 ± 0.00522 0.0536 ± 0.0296
Kidney 1,160 ± 184 2.43 ± 0.40 0.00657 ± 0.00086 Liver 2,620 ± 332 5.53 ± 1.16 0.0412 ± 0.0048 Lung 920 ± 204 1.91 ± 0.35 0.00188 ± 0.00030 Muscle 206 ± 100 0.421 ± 0.228 0.0296 ± 0.0145 Prostate gland 398 ± 156 0.784 ± 0.177 0.000197 ± 0.000076 Seminal vesicle 191 ± 70 0.380 ± 0.054 0.000317 ± 0.000096 Skin 691 ± 305 1.39 ± 0.56 0.0320 ± 0.0140 Spleen Stomach
c 196 ± 80 0.384 ± 0.070 0.000169 ± 0.000056
0.0197 ± 0.0112 Testis 126 ± 40 0.253 ± 0.031 0.000298 ± 0.000081
Total in tissues 0.234 ± 0.065
a Four animals were examined; data are presented as mean ± standard deviation.
b Unity Includes contents
c

G-15 p-tert-Butylcatechol, NTP TOX 70
TABLE G11 Cumulative Excretion of Radioactivity by Male B6C3F1 Mice after a Single Dermal Application of [14C]-p-tert-Butylcatechola
Dose Time (hours after dosing) Urine Feces Total
0.04 mg/animal 6
24 48 72
4.3 ± 5.2 32.1 ± 9.6 47.1 ± 10.7 51.7 ± 8.9
— b
7.45 ± 5.39 8.15 ± 5.31 12.4 ± 7.7
4.3 ± 5.2 39.6 ± 13.6 55.2 ± 15.3 64.1 ± 15.7
Cage rinse 57.0 ± 7.5 12.4 ± 7.7 69.4 ± 13.4
4 mg/animal 6
24 48 72
11.9 ± 14.0 54.3 ± 10.5 68.3 ± 3.9 71.4 ± 3.5
— 2.58 ± 1.30 3.48 ± 1.51 5.42 ± 2.55
11.9 ± 14.0 56.9 ± 10.3 71.8 ± 3.0 76.8 ± 1.4
Cage rinse 73.7 ± 3.2 5.42 ± 2.55 79.1 ± 2.1
a Four animals were examined per group; data are presented as cumulative percentage of dose (mean ± standard deviation).
b Feces were not collected at this time point.
TABLE G12 Distribution of Radioactivity in Male B6C3F1 Mice 72 Hours after a Single Dermal Application of [14C]-p-tert-Butylcatechola
Site 0.04 mg/animal 4 mg/animal
Absorbed Dose
Tissues Site of application Feces Urine
11.6 ± 8.3 1.51 ± 0.43 12.4 ± 7.7 57.0 ± 7.5
0.76 ± 0.30 6.18 ± 0.52 5.4 ± 2.6
73.7 ± 3.2
Total 72.2 ± 14.2 86.0 ± 2.7
Unabsorbed Dose
Skin wash 11.6 ± 8.3 2.25 ± 0.81
Total Recovery 83.7 ± 11.3 88.3 ± 2.7
a Four animals were examined per group; data are presented as percentage of dose (mean ± standard deviation).

G-16 p-tert-Butylcatechol, NTP TOX 70
FIGURE G2 Mass Spectrum of the Late-Eluting Deconjugated p-tert-Butylcatechol Metabolite

G-17p-tert-Butylcatechol, NTP TOX 70
FIGURE G3 Proton Nuclear Magnetic Resonance Spectrum of the Late-Eluting Deconjugated p-tert-Butylcatechol Metabolite

G-18 p-tert-Butylcatechol, NTP TOX 70
TABLE G13 Concentration of p-tert-Butylcatechol Equivalents in the Plasma of Male F344/N Rats after a Single Gavage Dose or Dermal Application of [14C]-p-tert-Butylcatechola
Time (hours Mean ± Standard after dosing) Rat 1 Rat 2 Rat 3 Rat 4 Deviation
Gavage Dosing (200 mg/kg)
0.25 36,700 32,100 42,200 34,900 36,500 ± 4,290 0.5 64,200 38,600 44,000 45,700 48,100 ± 11,100 1 52,100 36,200 30,500 36,400 38,800 ± 9,250 2 15,400 26,100 25,800 28,000 23,800 ± 5,680 4 29,400 27,200 26,400 30,400 28,300 ± 1,890 8 21,400 16,100 28,700 26,100 23,100 ± 5,550
24 2,540 2,370 2,700 1,710 2,330 ± 436
Dermal Application (60 mg/kg)
0.25 15,500 15,200 10,000 10,300 12,700 ± 3,010 0.5 25,400 25,000 21,400 18,500 22,600 ± 3,270 1 28,700 29,900 22,200 28,600 27,300 ± 3,490 2 20,400 21,000 23,400 27,600 23,100 ± 3,260 4 10,000 10,700 12,500 8,660 10,500 ± 1,620 8 5,370 5,180 19,500 8,900 9,740 ± 6,730
24 717 745 1,010 628 776 ± 165
a Data are presented as ng equivalents per gram of plasma.