NHS Newbury and District CCG NHS England Publications ... · NHS Newbury and District CCG NHS...
47
NHS Newbury and District CCG Commissioning for Value: Where to Look January 2016 Gateway ref: 04599 OFFICIAL
Transcript of NHS Newbury and District CCG NHS England Publications ... · NHS Newbury and District CCG NHS...
NHS Newbury and District CCG
NHS England Publications Gateway ref:
NHS Newbury and District CCG
Commissioning for Value: Where to Look January 2016
Gateway ref: 04599 OFFICIAL
NHS Newbury and District CCG
Contents
Gateway ref: 04599 OFFICIAL
• Foreword: Professor Sir Bruce Keogh
• The RightCare programme: Wave one
• Supporting the Five Year Forward View
• Supporting the 2016/17 planning guidance
• Introduction: Welcome to your refreshed data pack
• What is Commissioning for Value?
• Commissioning for Value and RightCare
• Why act?
• Your most similar CCGs
• Your data slides
Refresh of the Where to look packs
Refresh of the Pathway on a Page packs
Complex patient information
• You may be thinking…
• Next steps and actions
• Further support and information
• Annex: How to interpret the complex patients co-morbidities table
NHS Newbury and District CCG
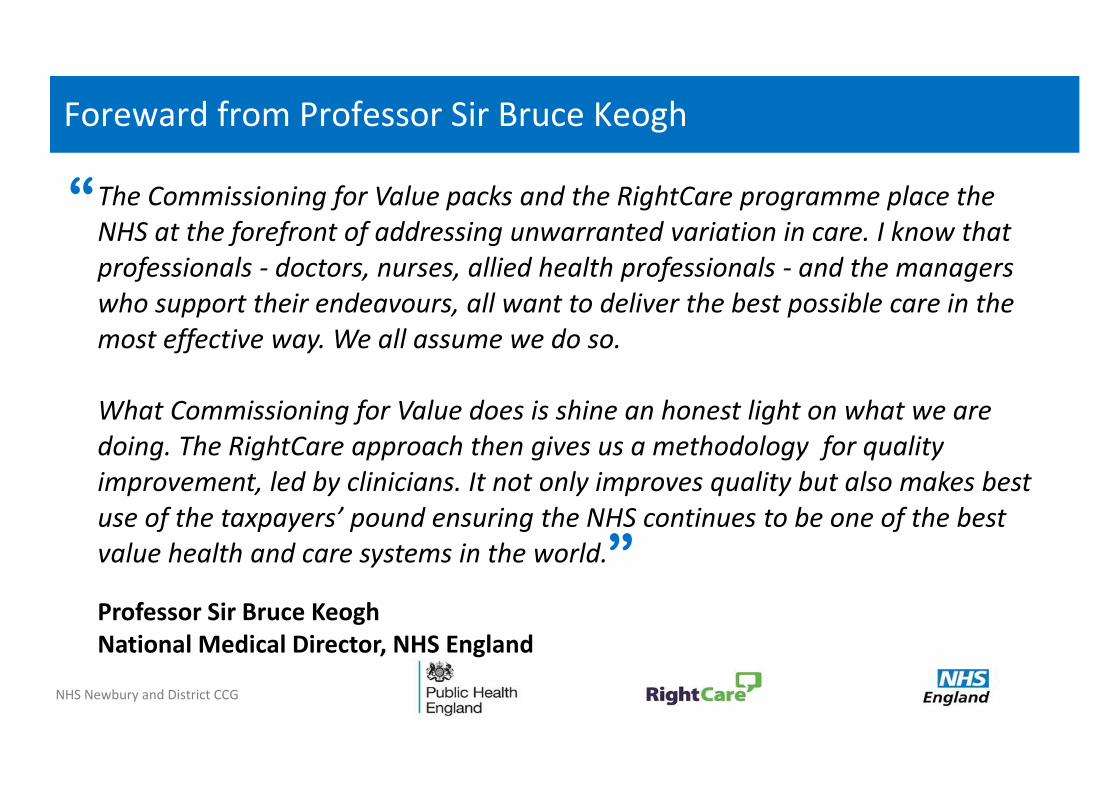
Foreward from Professor Sir Bruce Keogh
The Commissioning for Value packs and the RightCare programme place the NHS at the forefront of addressing unwarranted variation in care. I know that professionals - doctors, nurses, allied health professionals - and the managers who support their endeavours, all want to deliver the best possible care in the most effective way. We all assume we do so.
What Commissioning for Value does is shine an honest light on what we are doing. The RightCare approach then gives us a methodology for quality improvement, led by clinicians. It not only improves quality but also makes best use of the taxpayers’ pound ensuring the NHS continues to be one of the best value health and care systems in the world.
Professor Sir Bruce Keogh National Medical Director, NHS England
“
”

NHS Newbury and District CCG
The RightCare programme roll out: Wave one
The RightCare Programme includes the Commissioning for Value packs and tools, the NHS Atlas series, and the work of the Delivery Partners.
The approach has been tested and proven successful in recent years in a number of different health economies. As a programme that focusses relentlessly on value, increasing quality and releasing funds for further innovation, it has particular resonance.
NHS England has committed significant funding to rolling out the RightCare approach to all CCGs over the next two years. In order to provide close support to CCGs and ensure successful implementation, this will happen in three waves.
Each Regional Director has selected a cohort of CCGs to be involved in Wave One, this totals 65 across England. These CCGs will receive early access to RightCare Delivery Partner support from January 2016.
CCGs that aren’t involved in Wave One can still access and use this Commissioning for Value material and the recently published Atlas of Variation and accompanying locator tool: http://www.rightcare.nhs.uk/index.php/atlas/atlas-of-variation-2015-opportunity-locator-tool/
We’ll be supporting all CCGs in making the most of the RightCare approach regardless of whether they are involved in Wave One – this will commence at regional workshops: http://www.rightcare.nhs.uk/index.php/programme/regional-launch-events-janfeb-2016/ in January and February 2016. These will be promoted via the CCG bulletin and the RightCare email updates. All CCGs are encouraged to register.
NHS Newbury and District CCG
Supporting the Five Year Forward View
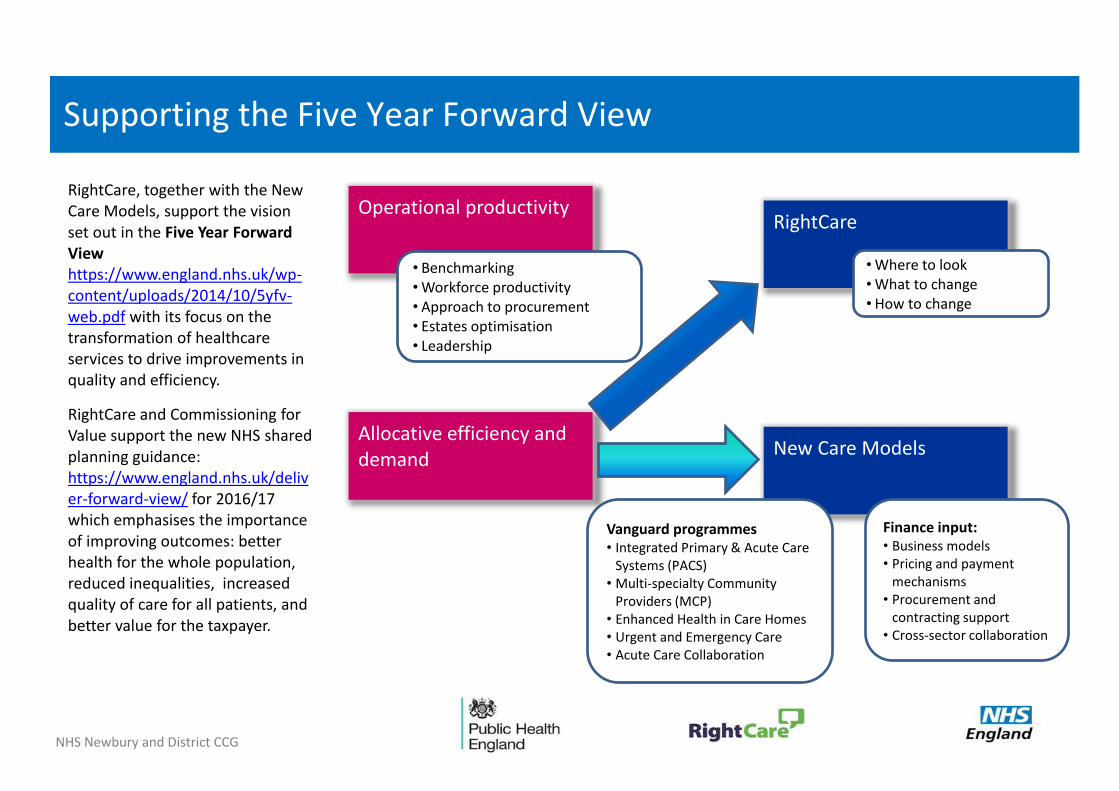
RightCare, together with the New Care Models, support the vision set out in the Five Year Forward View https://www.england.nhs.uk/wp-content/uploads/2014/10/5yfv-web.pdf with its focus on the transformation of healthcare services to drive improvements in quality and efficiency.
RightCare and Commissioning for Value support the new NHS shared planning guidance: https://www.england.nhs.uk/deliver-forward-view/ for 2016/17 which emphasises the importance of improving outcomes: better health for the whole population, reduced inequalities, increased quality of care for all patients, and better value for the taxpayer.
Operational productivity
Allocative efficiency and demand
RightCare
New Care Models
• Benchmarking • Workforce productivity • Approach to procurement • Estates optimisation • Leadership
• Where to look • What to change • How to change
Vanguard programmes • Integrated Primary & Acute Care
Systems (PACS) • Multi-specialty Community
Providers (MCP) • Enhanced Health in Care Homes • Urgent and Emergency Care • Acute Care Collaboration
Finance input: • Business models • Pricing and payment
mechanisms • Procurement and
contracting support • Cross-sector collaboration
NHS Newbury and District CCG
Supporting the 2016/17 planning guidance
This pack is being released to coincide with the recently issued NHS Shared Planning Guidance: https://www.england.nhs.uk/deliver-forward-view/.
Commissioners will take the opportunity to draw on the Atlas of Variation and this document, and take into account our plans to roll RightCare out to all CCGs over the next two years, in
developing their planning submissions.
The data and evidence available through tools such as Commissioning for Value will help commissioners make the most important decisions in delivering concrete and sustainable clinical and financial benefits across the NHS. We expect that the roll-out of the RightCare programme will drive up the quality of care while contributing significantly to meeting the efficiency challenge set out in the Five Year Forward View.
Paul Baumann Chief Financial Officer, NHS England
“
”
NHS Newbury and District CCG
Introduction: Welcome to your refreshed data pack
This pack builds on earlier Commissioning for Value packs and updates the data from three previous sets of information:
• The original data packs from October 2013
• The Pathway on a Page packs from November 2014
• The complex patients information in the Integrated Care packs from February 2015 (restated for completeness, not refreshed)
The information contained in these slides, and the accompanying online tools, is personalised for your CCG and should be used to help support local discussion about prioritisation to improve the value and utilisation of resources.
By using this information each CCG will be able to ensure its plans focus on those opportunities which have the potential to provide the biggest improvements in health outcomes , resource allocation and reducing inequalities.
NHS England, Public Health England and CCGs have legal duties under the Health and Social Care Act 2012 with regard to reducing health inequalities. One of the main focuses for the Commissioning for Value series has always been reducing variation in outcomes. Commissioners should continue to use these packs and the supporting tools to drive local action to reduce inequalities in access to services and in the health outcomes achieved.
All the previous packs and supporting information can be found on the Commissioning for Value pages : https://www.england.nhs.uk/comm-for-value/ on the NHS England website.
NHS Newbury and District CCG
Commissioning for Value and RightCare
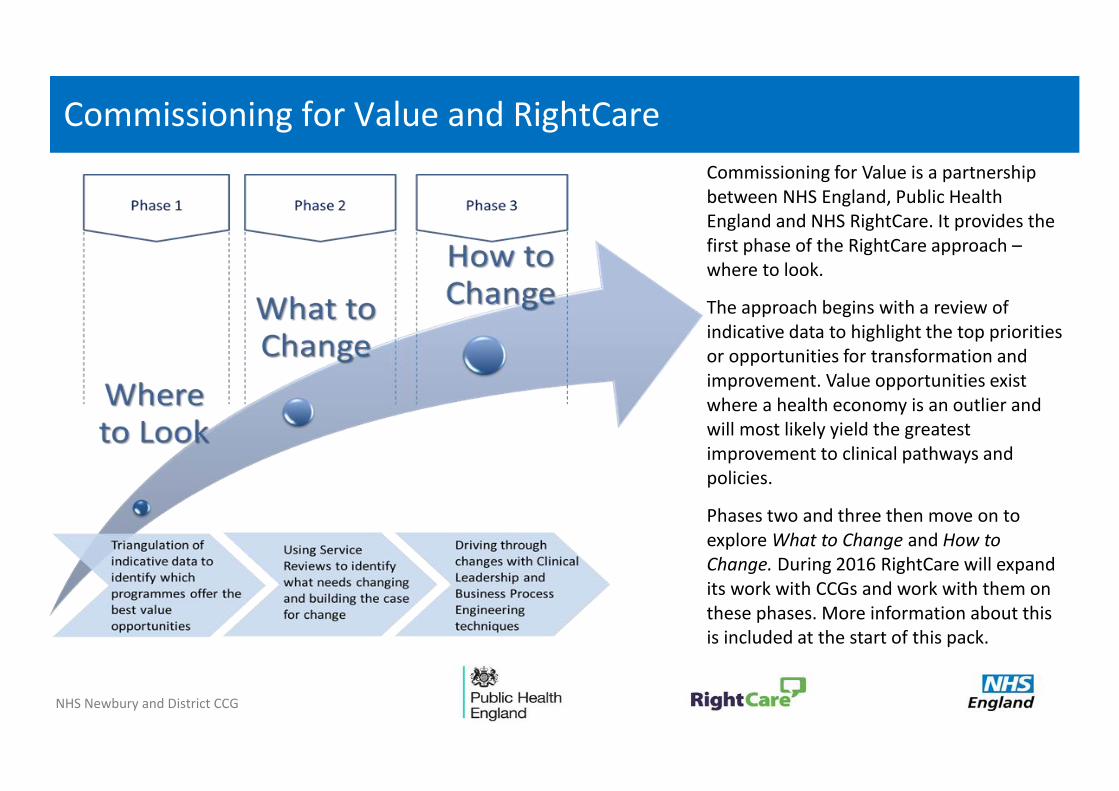
Commissioning for Value is a partnership between NHS England, Public Health England and NHS RightCare. It provides the first phase of the RightCare approach – where to look.
The approach begins with a review of indicative data to highlight the top priorities or opportunities for transformation and improvement. Value opportunities exist where a health economy is an outlier and will most likely yield the greatest improvement to clinical pathways and policies.
Phases two and three then move on to explore What to Change and How to Change. During 2016 RightCare will expand its work with CCGs and work with them on these phases. More information about this is included at the start of this pack.
NHS Newbury and District CCG
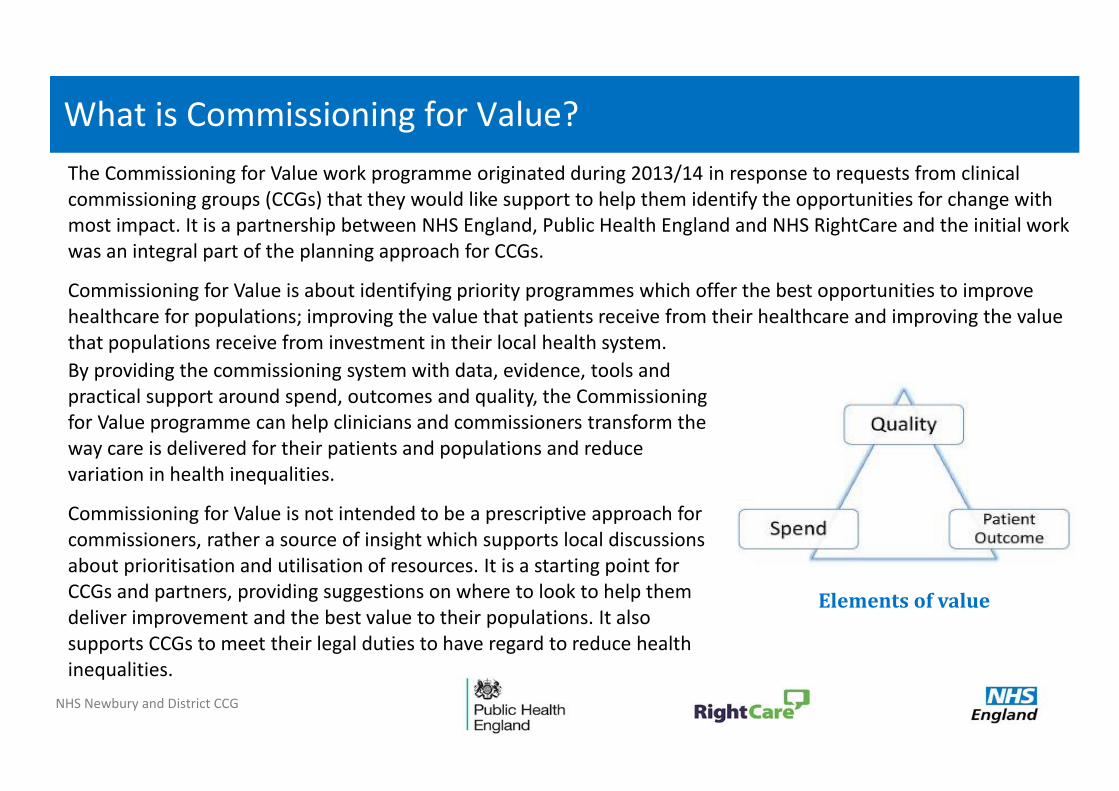
What is Commissioning for Value?
Elements of value
The Commissioning for Value work programme originated during 2013/14 in response to requests from clinical commissioning groups (CCGs) that they would like support to help them identify the opportunities for change with most impact. It is a partnership between NHS England, Public Health England and NHS RightCare and the initial work was an integral part of the planning approach for CCGs.
Commissioning for Value is about identifying priority programmes which offer the best opportunities to improve healthcare for populations; improving the value that patients receive from their healthcare and improving the value that populations receive from investment in their local health system.
By providing the commissioning system with data, evidence, tools and practical support around spend, outcomes and quality, the Commissioning for Value programme can help clinicians and commissioners transform the way care is delivered for their patients and populations and reduce variation in health inequalities.
Commissioning for Value is not intended to be a prescriptive approach for commissioners, rather a source of insight which supports local discussions about prioritisation and utilisation of resources. It is a starting point for CCGs and partners, providing suggestions on where to look to help them deliver improvement and the best value to their populations. It also supports CCGs to meet their legal duties to have regard to reduce health inequalities.
NHS Newbury and District CCG
Why act?
We’ve worked with diverse health economies in recent years that have adopted the RightCare approach. Examples of the population healthcare and system impact of adopting the RightCare approach include:
1000s more people at risk of or already with Type 2 diabetes detected and being supported with their primary and secondary prevention (Bradford City and Bradford Districts CCGs)
36% reduction in GP referrals to acute MSK services via a locally-run triage system using locally derived protocols (Ashford CCG)
Significant reductions in unplanned activity amongst people with complex care needs via proactive primary care (Slough CCG)
30% reduction in COPD emergency activity from a full pathway redesign (Hardwick CCG)
98% reduction in calls from frequent callers via enhanced integrated care and pathway navigation (Blackpool CCG)
Please see the RightCare casebooks: http://www.rightcare.nhs.uk/ for more information.
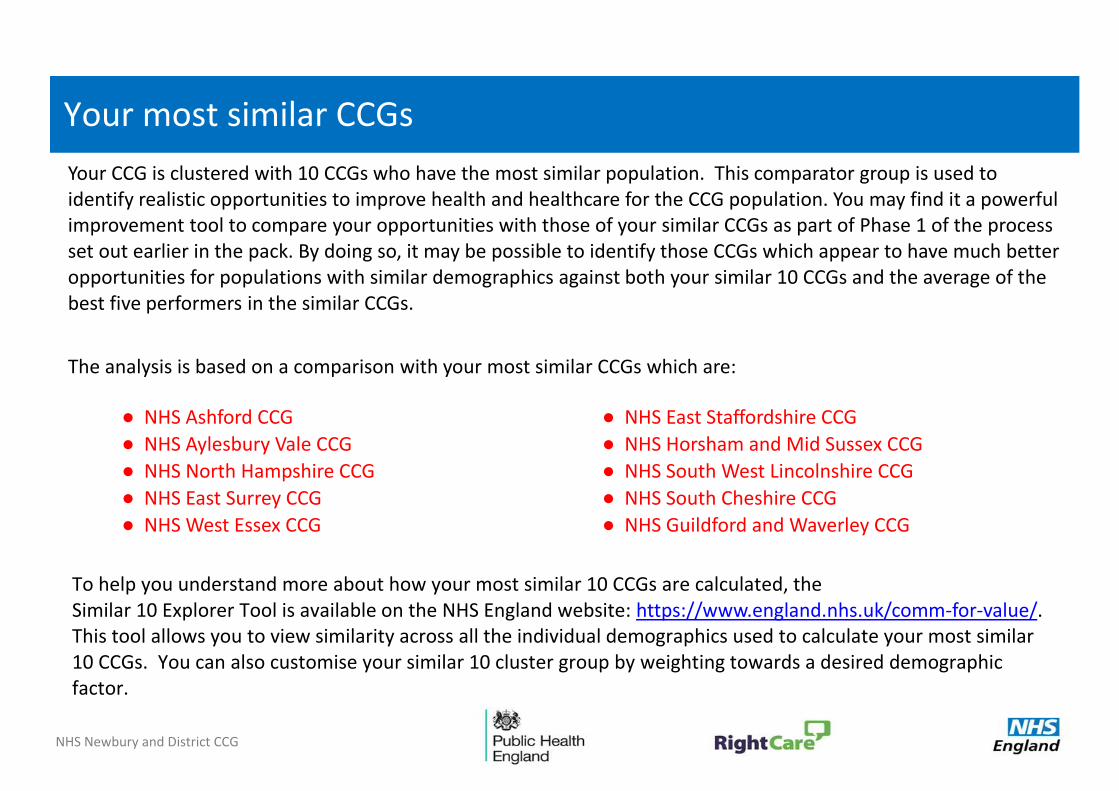
● NHS Ashford CCG ● NHS East Staffordshire CCG
● NHS Aylesbury Vale CCG ● NHS Horsham and Mid Sussex CCG
● NHS North Hampshire CCG ● NHS South West Lincolnshire CCG
● NHS East Surrey CCG ● NHS South Cheshire CCG
● NHS West Essex CCG ● NHS Guildford and Waverley CCG
NHS Newbury and District CCG
Your most similar CCGs
The analysis is based on a comparison with your most similar CCGs which are:
To help you understand more about how your most similar 10 CCGs are calculated, the Similar 10 Explorer Tool is available on the NHS England website: https://www.england.nhs.uk/comm-for-value/. This tool allows you to view similarity across all the individual demographics used to calculate your most similar 10 CCGs. You can also customise your similar 10 cluster group by weighting towards a desired demographic factor.
Your CCG is clustered with 10 CCGs who have the most similar population. This comparator group is used to identify realistic opportunities to improve health and healthcare for the CCG population. You may find it a powerful improvement tool to compare your opportunities with those of your similar CCGs as part of Phase 1 of the process set out earlier in the pack. By doing so, it may be possible to identify those CCGs which appear to have much better opportunities for populations with similar demographics against both your similar 10 CCGs and the average of the best five performers in the similar CCGs.
NHS Newbury and District CCG
Where to look Step 1: Data refresh from the 2013 packs
The Commissioning for Value approach begins with a review of indicative data across the 10 highest spending programmes of care to highlight the top priorities (opportunities) for transformation and improvement.
This pack begins the process for you by offering a triangulation of nationally-held data that indicates where CCGs may gain the highest value healthcare improvement by focussing their reforms.
The following slides help identify the ‘where to look’ opportunities to improve value. They contain a range of improvement opportunities across a number of key programme areas to help CCGs identify where local health economies can prioritise ‘where to look’. They do not seek to provide phases 2 ('what to change') and 3 ('how to change') of the overall approach.
The opportunities that follow in the next few slides outline the potential improvements (in terms of both reduced expenditure and lives saved) if the CCG were to perform at the average of the similar 10 and best five of the similar 10 as outlined in the previous slide.
These formulas should be double checked during the QA process to ensure correct output
NHS Newbury and District CCG
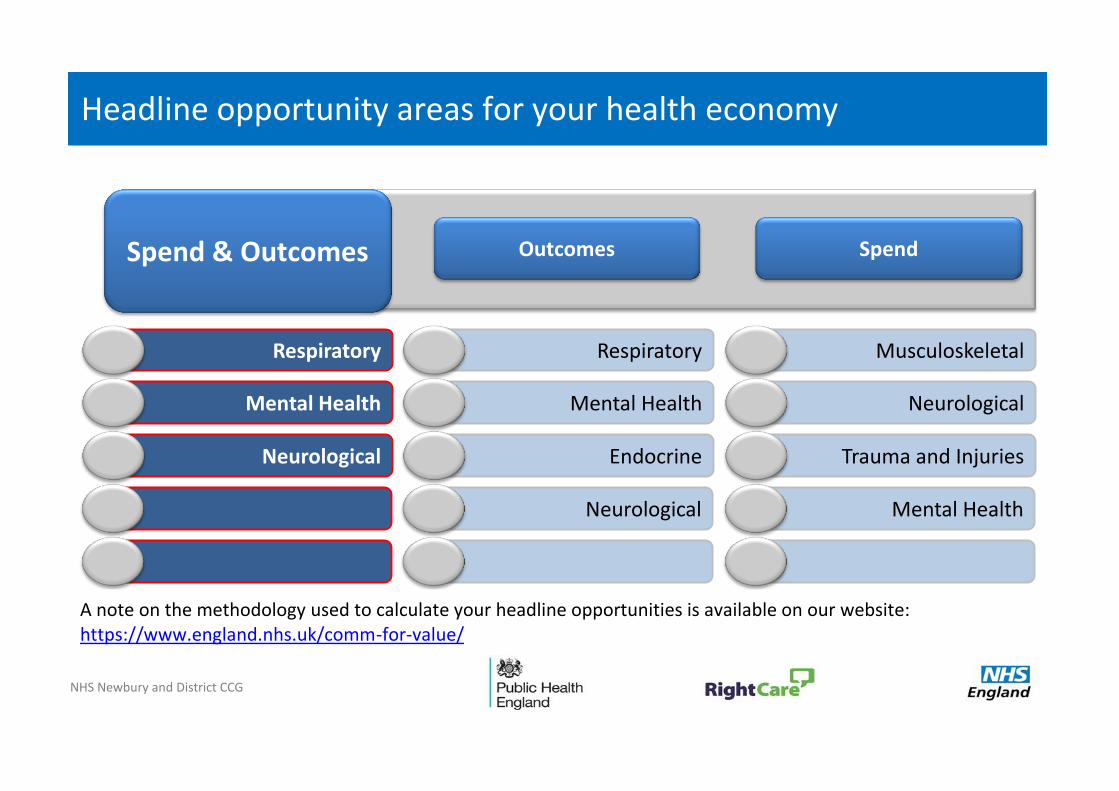
Headline opportunity areas for your health economy
Respiratory
Mental Health
Neurological
Musculoskeletal
Neurological
Mental Health
Trauma and Injuries
Respiratory
Mental Health
Neurological
Endocrine
Spend & Outcomes Outcomes Spend
A note on the methodology used to calculate your headline opportunities is available on our website: https://www.england.nhs.uk/comm-for-value/
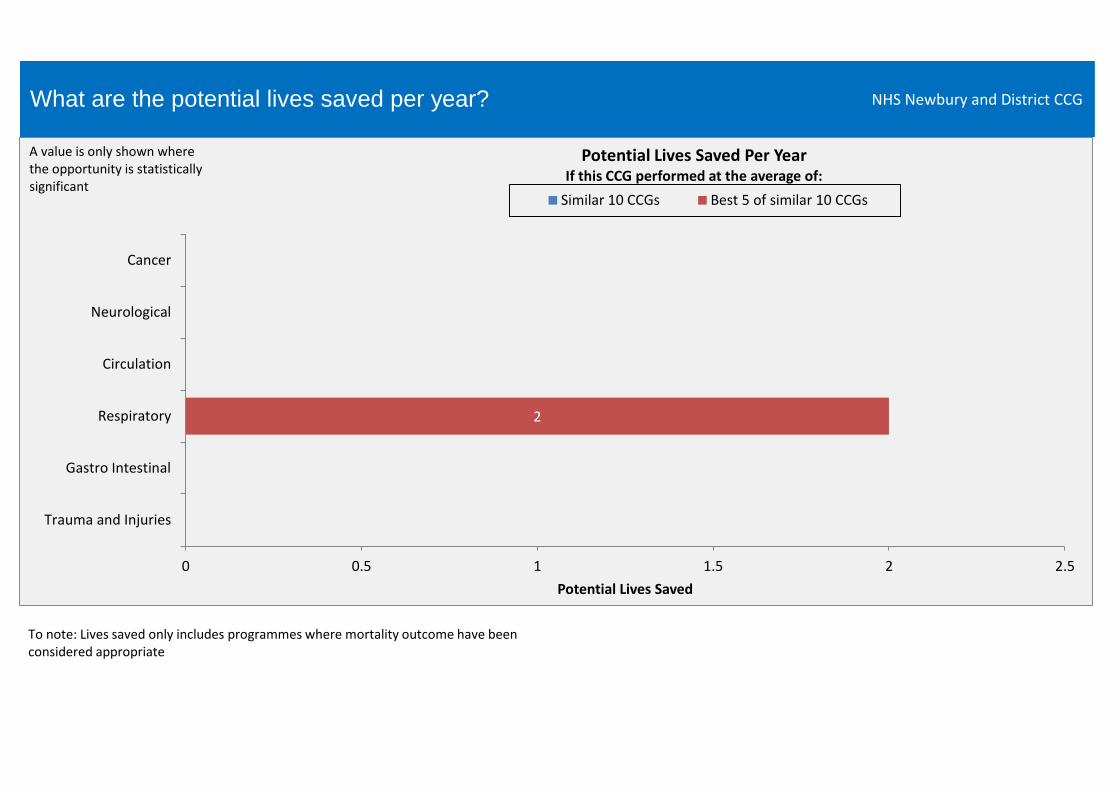
What are the potential lives saved per year?
2
0 0.5 1 1.5 2 2.5
Trauma and Injuries
Gastro Intestinal
Respiratory
Circulation
Neurological
Cancer
Potential Lives Saved
Potential Lives Saved Per Year If this CCG performed at the average of:
Similar 10 CCGs Best 5 of similar 10 CCGs
A value is only shown where the opportunity is statistically significant
NHS Newbury and District CCG
To note: Lives saved only includes programmes where mortality outcome have been considered appropriate
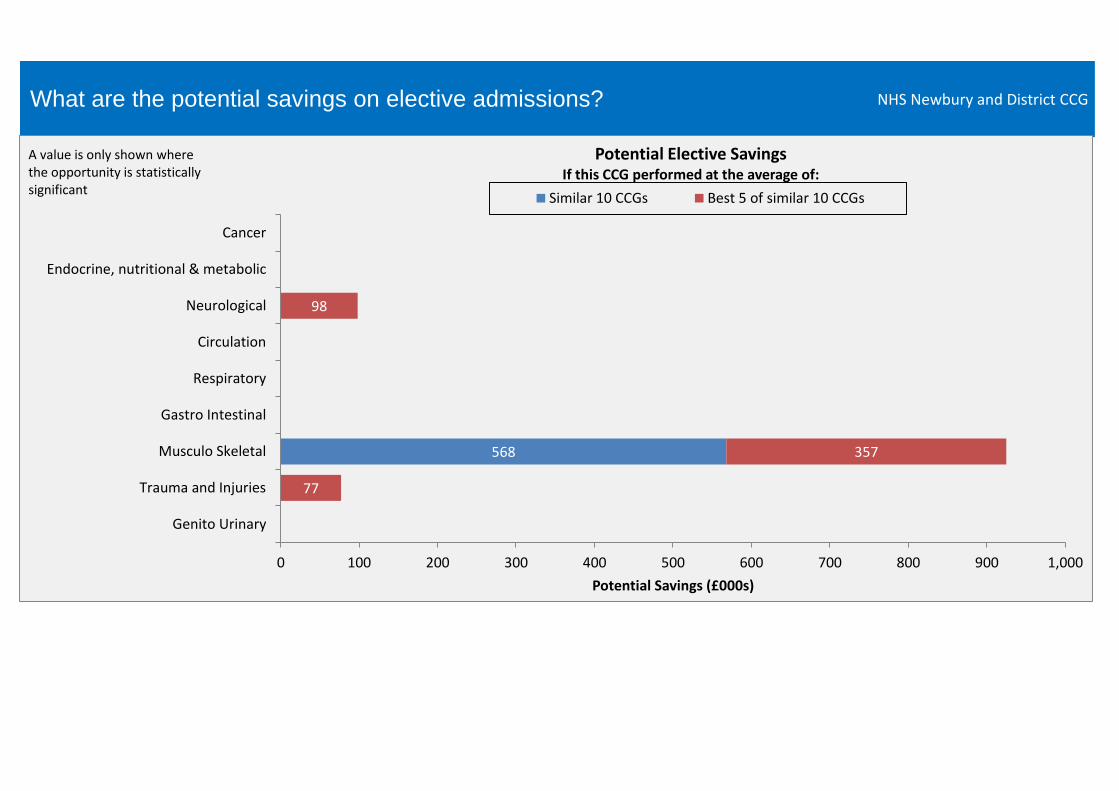
What are the potential savings on elective admissions?
568
77
357
98
0 100 200 300 400 500 600 700 800 900 1,000
Genito Urinary
Trauma and Injuries
Musculo Skeletal
Gastro Intestinal
Respiratory
Circulation
Neurological
Endocrine, nutritional & metabolic
Cancer
Potential Savings (£000s)
Potential Elective Savings If this CCG performed at the average of:
Similar 10 CCGs Best 5 of similar 10 CCGs
A value is only shown where the opportunity is statistically significant
NHS Newbury and District CCG
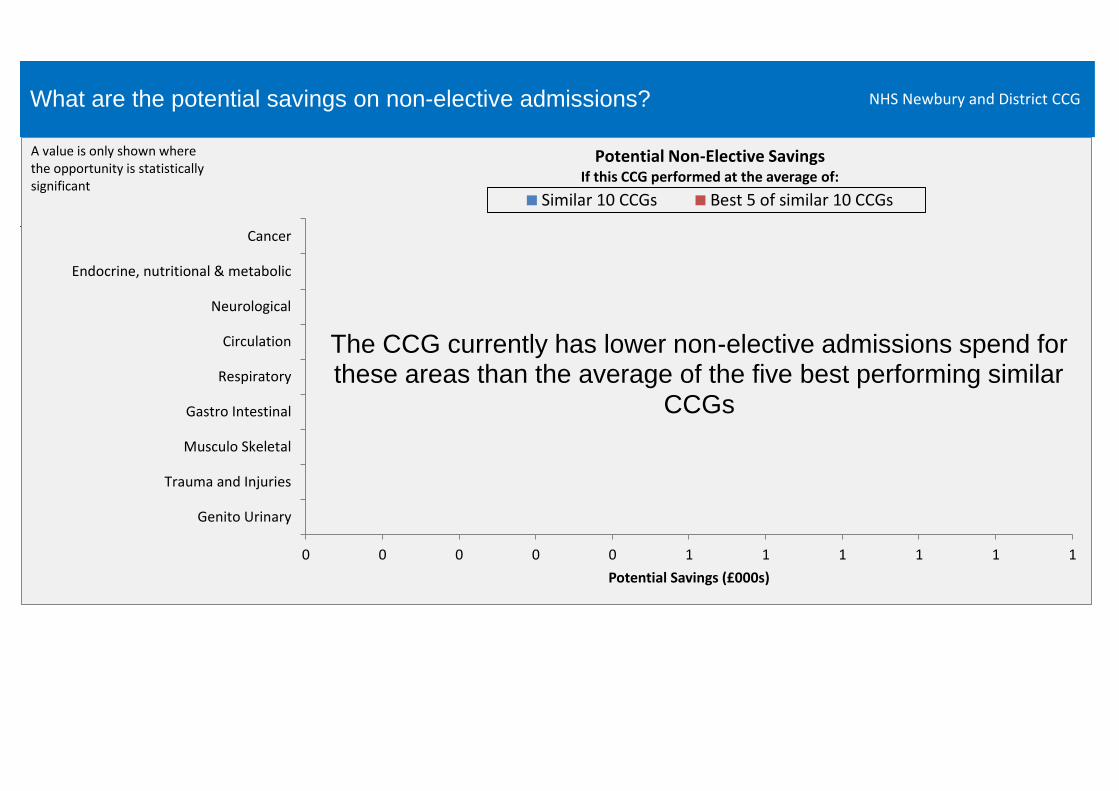
The CCG currently has lower non-elective admissions spend for these areas than the average of the five best performing similar CCGs
What are the potential savings on non-elective admissions?
0 0 0 0 0 1 1 1 1 1 1
Genito Urinary
Trauma and Injuries
Musculo Skeletal
Gastro Intestinal
Respiratory
Circulation
Neurological
Endocrine, nutritional & metabolic
Cancer
Potential Savings (£000s)
Similar 10 CCGs Best 5 of similar 10 CCGs
Potential Non-Elective Savings If this CCG performed at the average of:
NHS Newbury and District CCG
A value is only shown where the opportunity is statistically significant
The CCG currently has lower non-elective admissions spend for these areas than the average of the five best performing similar
CCGs
http://www.OpenPrescribing.net
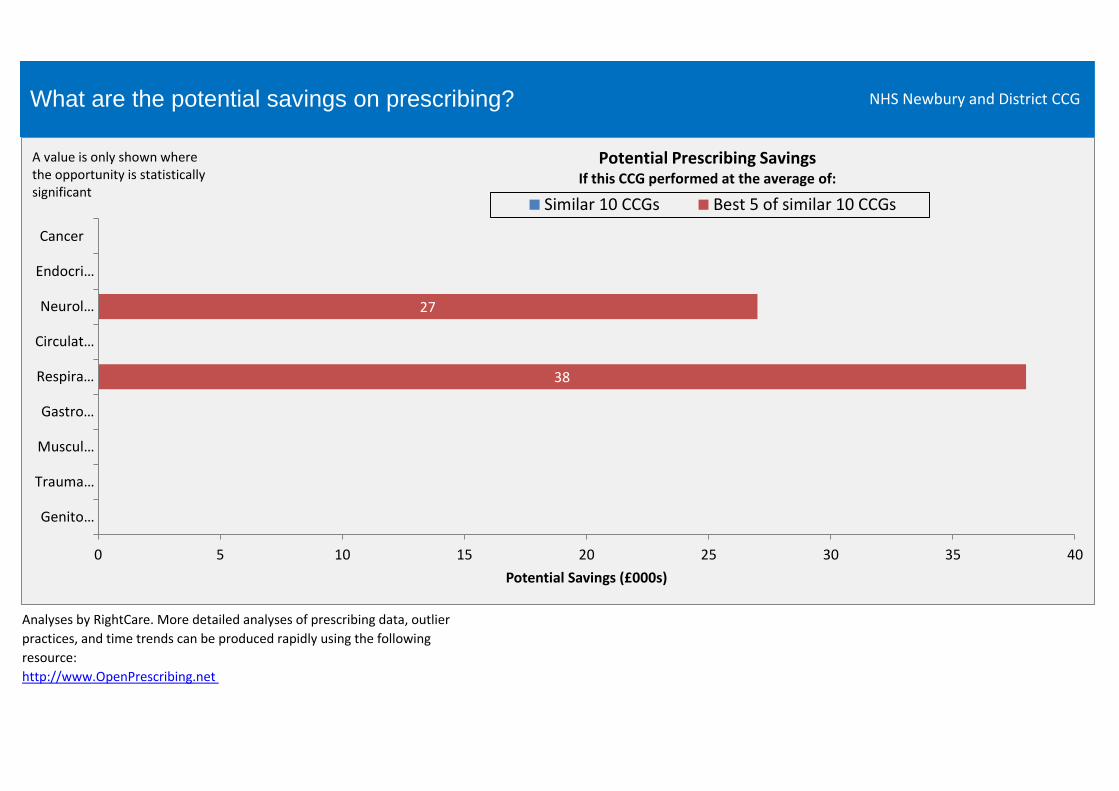
What are the potential savings on prescribing?
Analyses by RightCare. More detailed analyses of prescribing data, outlier
practices, and time trends can be produced rapidly using the following
resource:
NHS Newbury and District CCG
38
27
0 5 10 15 20 25 30 35 40
Genito…
Trauma…
Muscul…
Gastro…
Respira…
Circulat…
Neurol…
Endocri…
Cancer
Potential Savings (£000s)
Similar 10 CCGs Best 5 of similar 10 CCGs
Potential Prescribing Savings If this CCG performed at the average of:
A value is only shown where the opportunity is statistically significant
380
Disease Area Spend £000 Quality
No. of
patients,
life-years,
referrals, etc.
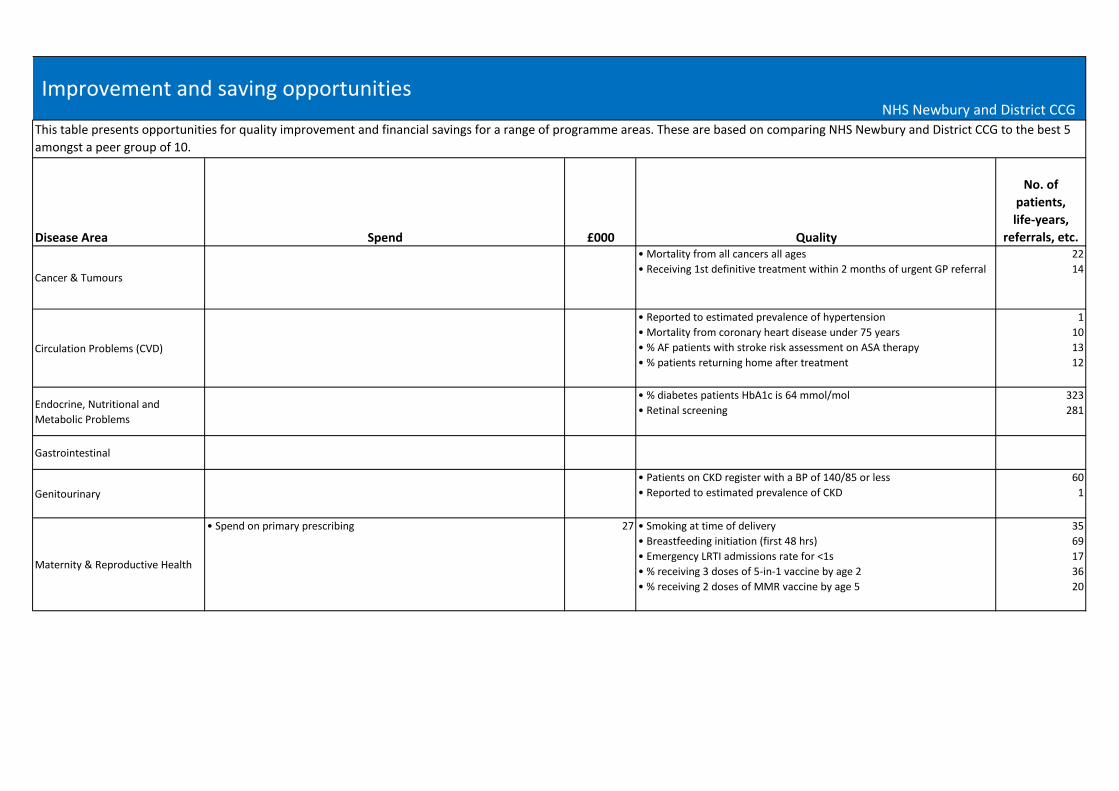
Cancer & Tumours
• Mortality from all cancers all ages
• Receiving 1st definitive treatment within 2 months of urgent GP referral
22
14
Circulation Problems (CVD)
• Reported to estimated prevalence of hypertension
• Mortality from coronary heart disease under 75 years
• % AF patients with stroke risk assessment on ASA therapy
• % patients returning home after treatment
1
10
13
12
Endocrine, Nutritional and
Metabolic Problems
• % diabetes patients HbA1c is 64 mmol/mol
• Retinal screening
323
281
Gastrointestinal
Genitourinary
• Patients on CKD register with a BP of 140/85 or less
• Reported to estimated prevalence of CKD
60
1
Maternity & Reproductive Health
• Spend on primary prescribing 27 • Smoking at time of delivery
• Breastfeeding initiation (first 48 hrs)
• Emergency LRTI admissions rate for <1s
• % receiving 3 doses of 5-in-1 vaccine by age 2
• % receiving 2 doses of MMR vaccine by age 5
35
69
17
36
20
This table presents opportunities for quality improvement and financial savings for a range of programme areas. These are based on comparing NHS Newbury and District CCG to the best 5
amongst a peer group of 10.
Improvement and saving opportunitiesNHS Newbury and District CCG
380
Disease Area Spend £000 Quality
No. of
patients,
life-years,
referrals, etc.
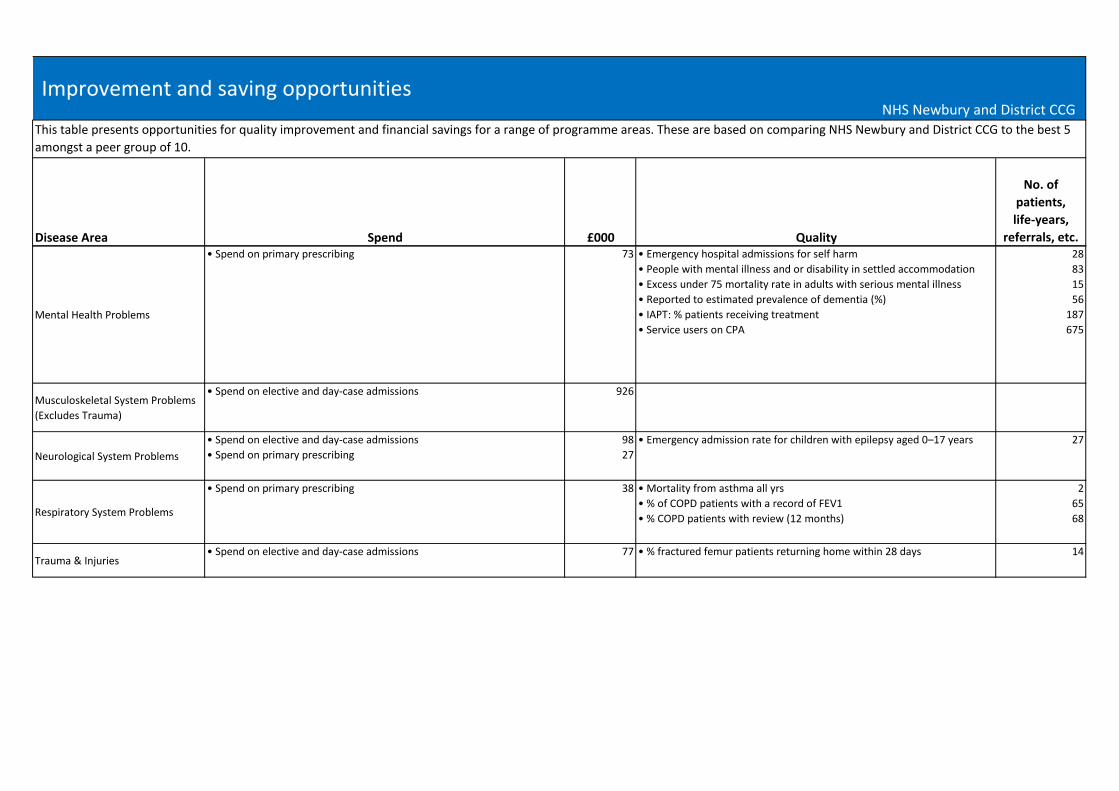
This table presents opportunities for quality improvement and financial savings for a range of programme areas. These are based on comparing NHS Newbury and District CCG to the best 5
amongst a peer group of 10.
Improvement and saving opportunitiesNHS Newbury and District CCG
Mental Health Problems
• Spend on primary prescribing 73 • Emergency hospital admissions for self harm
• People with mental illness and or disability in settled accommodation
• Excess under 75 mortality rate in adults with serious mental illness
• Reported to estimated prevalence of dementia (%)
• IAPT: % patients receiving treatment
• Service users on CPA
28
83
15
56
187
675
Musculoskeletal System Problems
(Excludes Trauma)
• Spend on elective and day-case admissions 926
Neurological System Problems
• Spend on elective and day-case admissions
• Spend on primary prescribing
98
27
• Emergency admission rate for children with epilepsy aged 0–17 years 27
Respiratory System Problems
• Spend on primary prescribing 38 • Mortality from asthma all yrs
• % of COPD patients with a record of FEV1
• % COPD patients with review (12 months)
2
65
68
Trauma & Injuries• Spend on elective and day-case admissions 77 • % fractured femur patients returning home within 28 days 14
NHS Newbury and District CCG
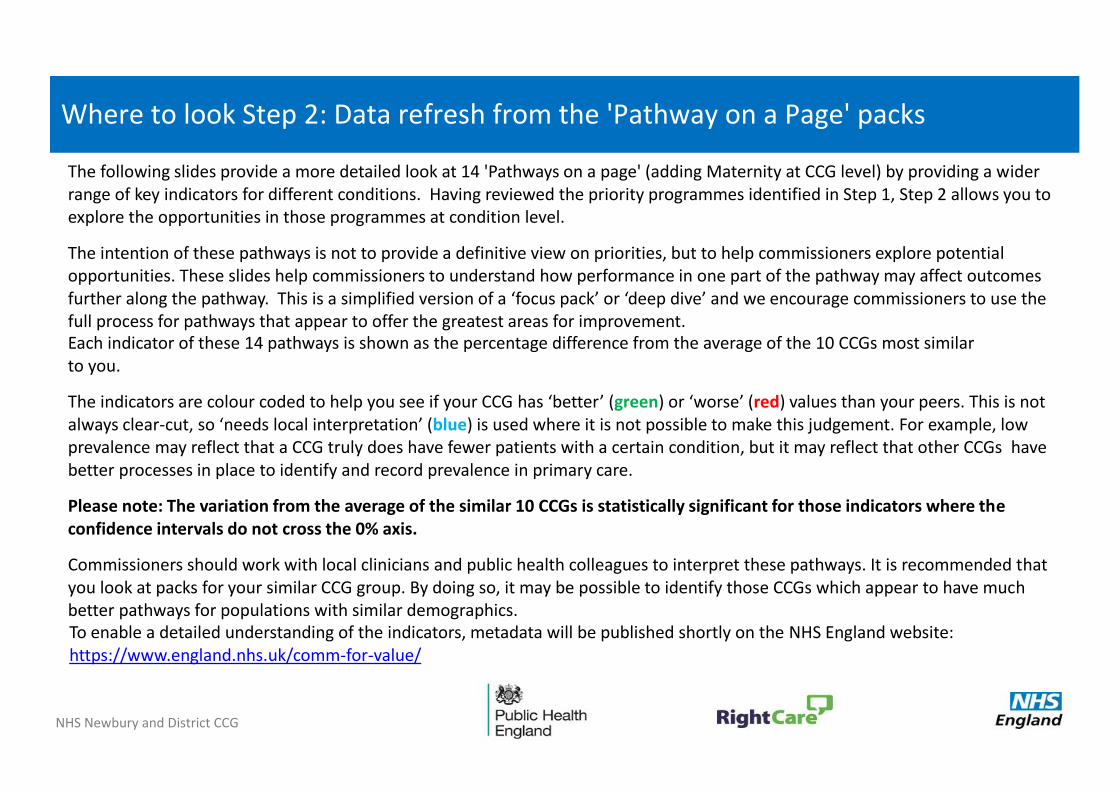
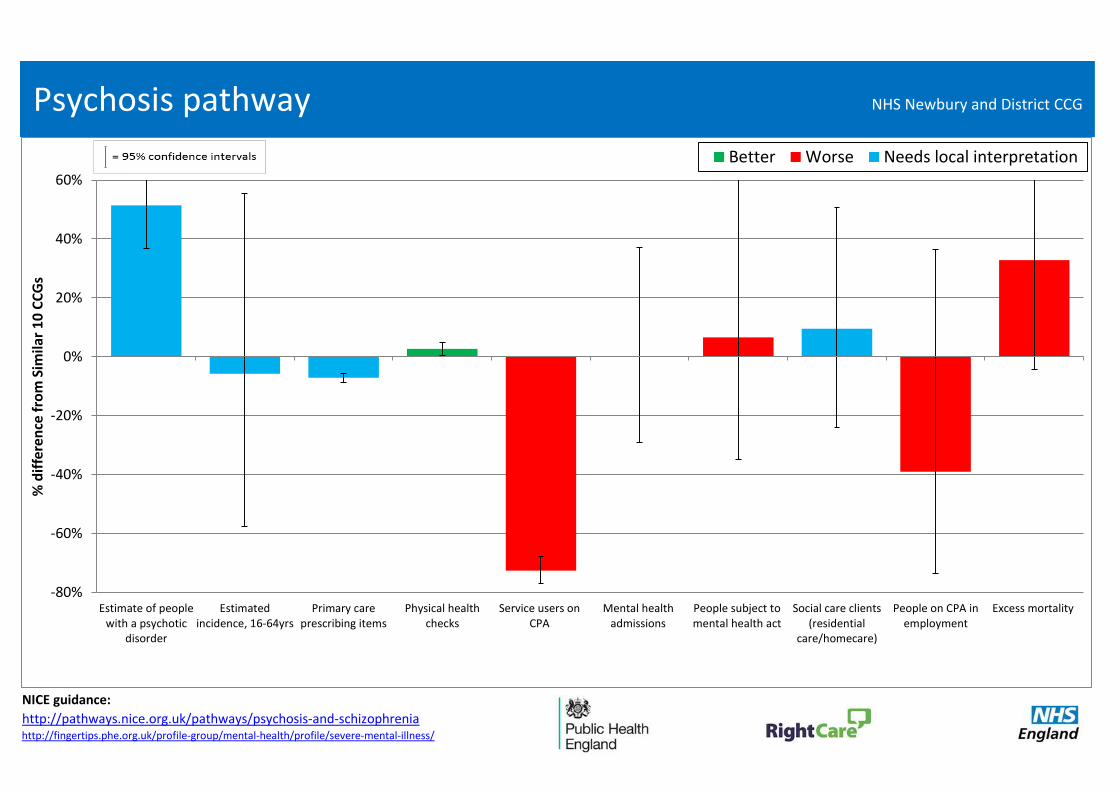
Where to look Step 2: Data refresh from the 'Pathway on a Page' packs
The following slides provide a more detailed look at 14 'Pathways on a page' (adding Maternity at CCG level) by providing a wider range of key indicators for different conditions. Having reviewed the priority programmes identified in Step 1, Step 2 allows you to explore the opportunities in those programmes at condition level.
The intention of these pathways is not to provide a definitive view on priorities, but to help commissioners explore potential opportunities. These slides help commissioners to understand how performance in one part of the pathway may affect outcomes further along the pathway. This is a simplified version of a ‘focus pack’ or ‘deep dive’ and we encourage commissioners to use the full process for pathways that appear to offer the greatest areas for improvement. Each indicator of these 14 pathways is shown as the percentage difference from the average of the 10 CCGs most similar to you.
The indicators are colour coded to help you see if your CCG has ‘better’ (green) or ‘worse’ (red) values than your peers. This is not always clear-cut, so ‘needs local interpretation’ (blue) is used where it is not possible to make this judgement. For example, low prevalence may reflect that a CCG truly does have fewer patients with a certain condition, but it may reflect that other CCGs have better processes in place to identify and record prevalence in primary care.
Please note: The variation from the average of the similar 10 CCGs is statistically significant for those indicators where the confidence intervals do not cross the 0% axis.
Commissioners should work with local clinicians and public health colleagues to interpret these pathways. It is recommended that you look at packs for your similar CCG group. By doing so, it may be possible to identify those CCGs which appear to have much better pathways for populations with similar demographics. To enable a detailed understanding of the indicators, metadata will be published shortly on the NHS England website: https://www.england.nhs.uk/comm-for-value/
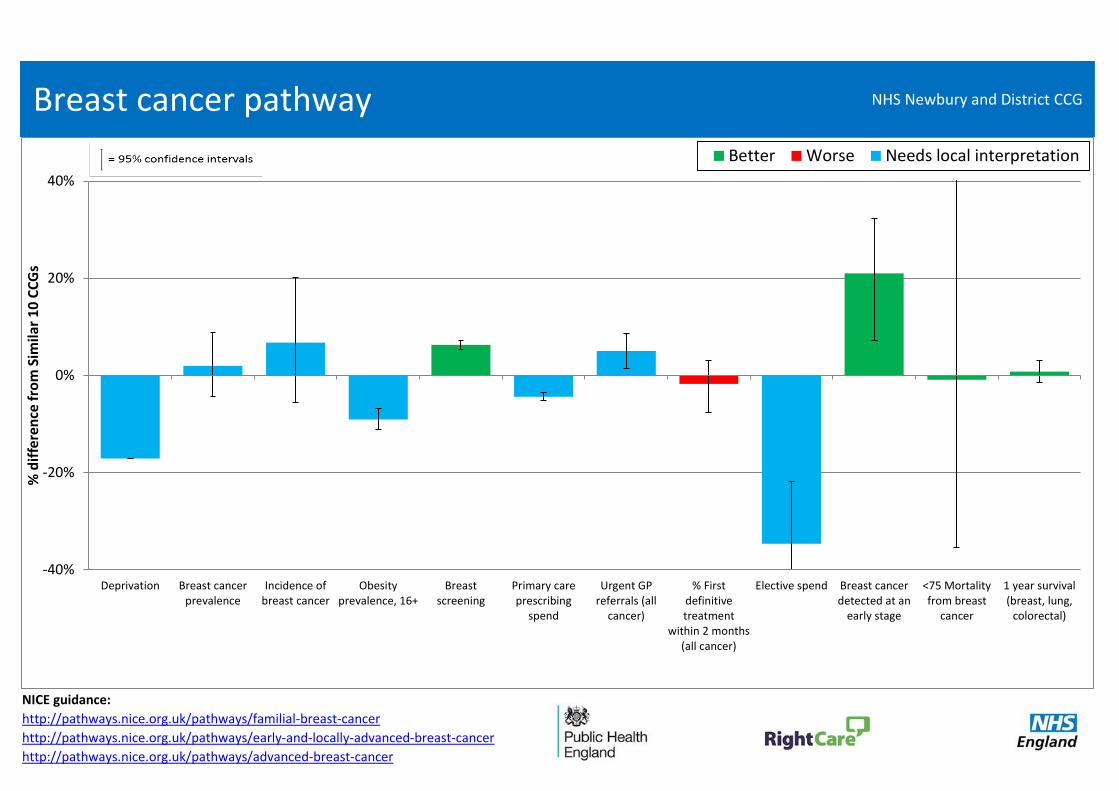
NICE guidance:
http://pathways.nice.org.uk/pathways/familial-breast-cancer
http://pathways.nice.org.uk/pathways/early-and-locally-advanced-breast-cancer
http://pathways.nice.org.uk/pathways/advanced-breast-cancer
Breast cancer pathway
-40%
-20%
0%
20%
40%
Deprivation Breast cancerprevalence
Incidence ofbreast cancer
Obesityprevalence, 16+
Breastscreening
Primary careprescribing
spend
Urgent GPreferrals (all
cancer)
% Firstdefinitivetreatment
within 2 months(all cancer)
Elective spend Breast cancerdetected at an
early stage
<75 Mortalityfrom breast
cancer
1 year survival(breast, lung,
colorectal)
% d
iffe
ren
ce f
rom
Sim
ilar
10
CC
Gs
Better Worse Needs local interpretation
NHS Newbury and District CCG
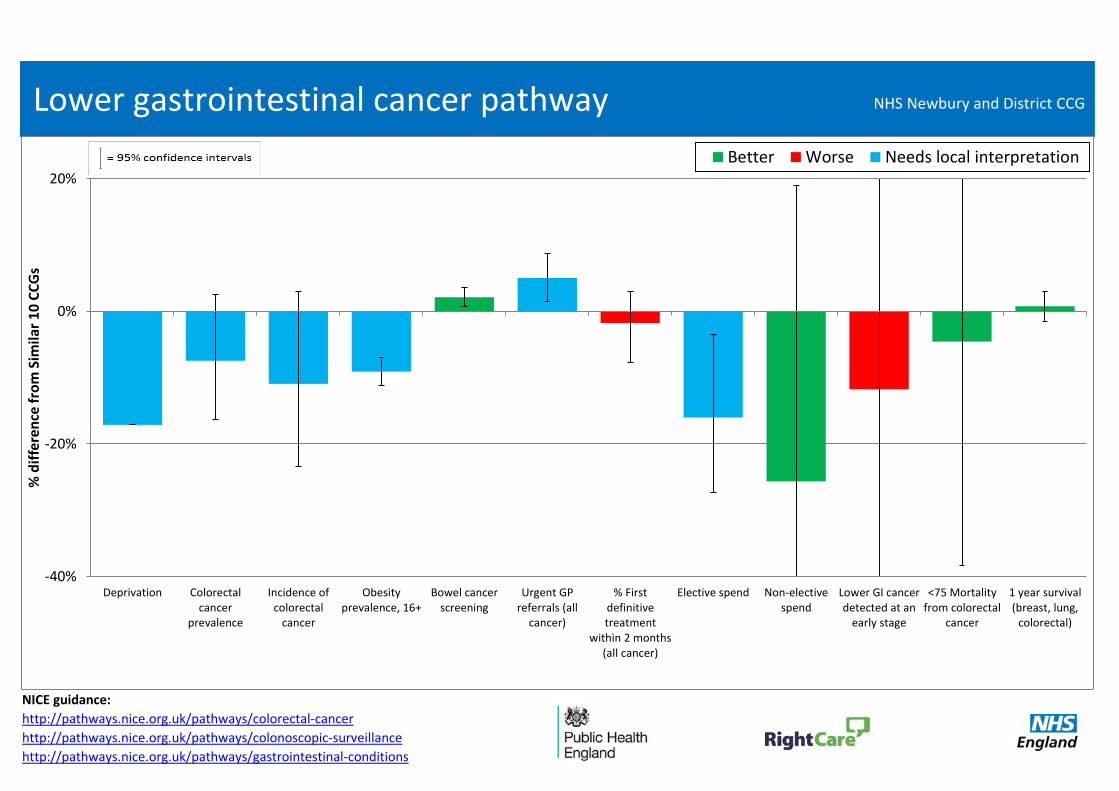
NICE guidance:
http://pathways.nice.org.uk/pathways/colorectal-cancer
http://pathways.nice.org.uk/pathways/colonoscopic-surveillance
http://pathways.nice.org.uk/pathways/gastrointestinal-conditions
Lower gastrointestinal cancer pathway
-40%
-20%
0%
20%
Deprivation Colorectalcancer
prevalence
Incidence ofcolorectal
cancer
Obesityprevalence, 16+
Bowel cancerscreening
Urgent GPreferrals (all
cancer)
% Firstdefinitivetreatment
within 2 months(all cancer)
Elective spend Non-electivespend
Lower GI cancerdetected at an
early stage
<75 Mortalityfrom colorectal
cancer
1 year survival(breast, lung,
colorectal)
% d
iffe
ren
ce f
rom
Sim
ilar
10
CC
Gs
Better Worse Needs local interpretation
NHS Newbury and District CCG
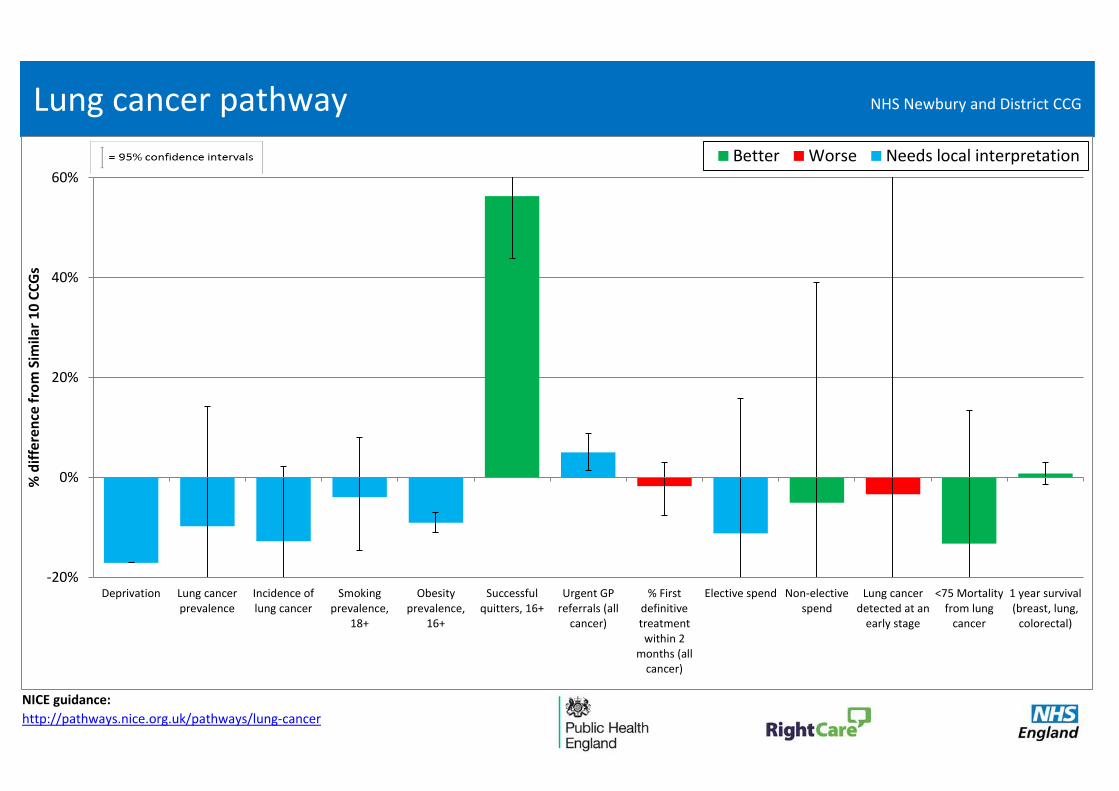
NICE guidance:
http://pathways.nice.org.uk/pathways/lung-cancer
Lung cancer pathway
-20%
0%
20%
40%
60%
Deprivation Lung cancerprevalence
Incidence oflung cancer
Smokingprevalence,
18+
Obesityprevalence,
16+
Successfulquitters, 16+
Urgent GPreferrals (all
cancer)
% Firstdefinitivetreatmentwithin 2
months (allcancer)
Elective spend Non-electivespend
Lung cancerdetected at an
early stage
<75 Mortalityfrom lung
cancer
1 year survival(breast, lung,
colorectal)
% d
iffe
ren
ce f
rom
Sim
ilar
10
CC
Gs
Better Worse Needs local interpretation
NHS Newbury and District CCG
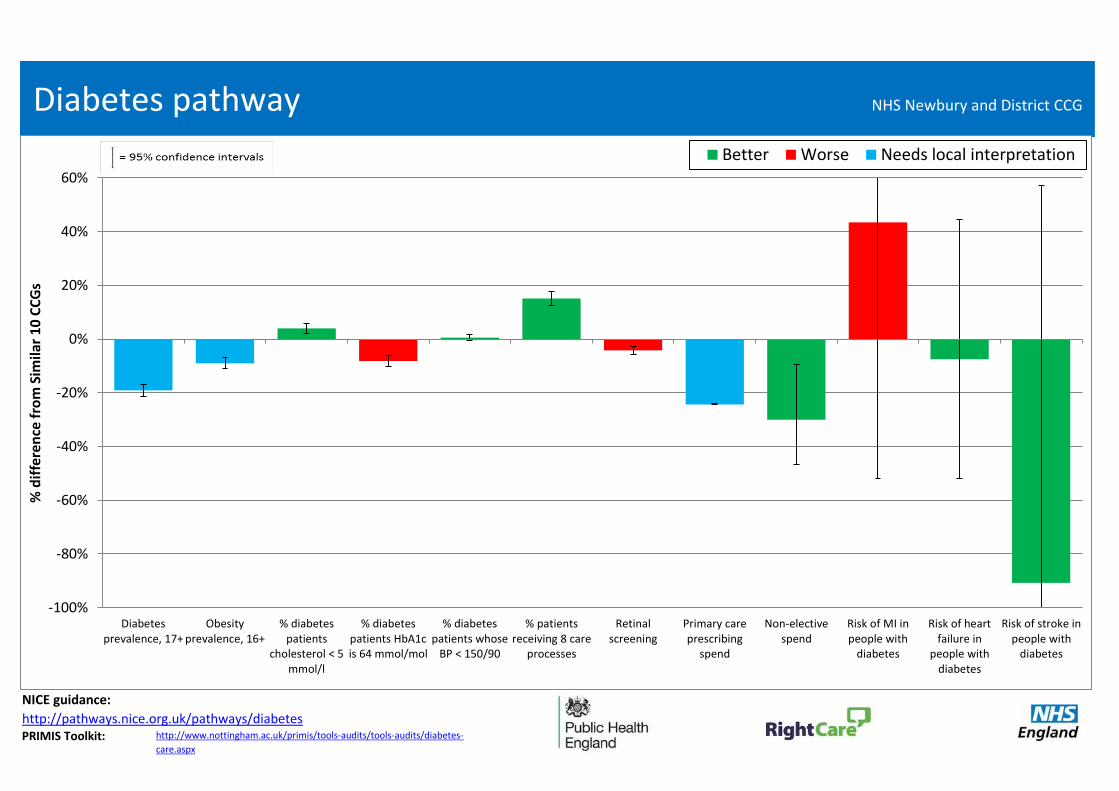
NICE guidance:
http://pathways.nice.org.uk/pathways/diabetesPRIMIS Toolkit:
Diabetes pathway
http://www.nottingham.ac.uk/primis/tools-audits/tools-audits/diabetes-
care.aspx
-100%
-80%
-60%
-40%
-20%
0%
20%
40%
60%
Diabetesprevalence, 17+
Obesityprevalence, 16+
% diabetespatients
cholesterol < 5mmol/l
% diabetespatients HbA1cis 64 mmol/mol
% diabetespatients whose
BP < 150/90
% patientsreceiving 8 care
processes
Retinalscreening
Primary careprescribing
spend
Non-electivespend
Risk of MI inpeople with
diabetes
Risk of heartfailure in
people withdiabetes
Risk of stroke inpeople with
diabetes
% d
iffe
ren
ce f
rom
Sim
ilar
10
CC
Gs
Better Worse Needs local interpretation
NHS Newbury and District CCG
NICE guidance:
http://pathways.nice.org.uk/pathways/psychosis-and-schizophreniahttp://fingertips.phe.org.uk/profile-group/mental-health/profile/severe-mental-illness/
Psychosis pathway
-80%
-60%
-40%
-20%
0%
20%
40%
60%
Estimate of peoplewith a psychotic
disorder
Estimatedincidence, 16-64yrs
Primary careprescribing items
Physical healthchecks
Service users onCPA
Mental healthadmissions
People subject tomental health act
Social care clients(residential
care/homecare)
People on CPA inemployment
Excess mortality
% d
iffe
ren
ce f
rom
Sim
ilar
10
CC
Gs
Better Worse Needs local interpretation
NHS Newbury and District CCG
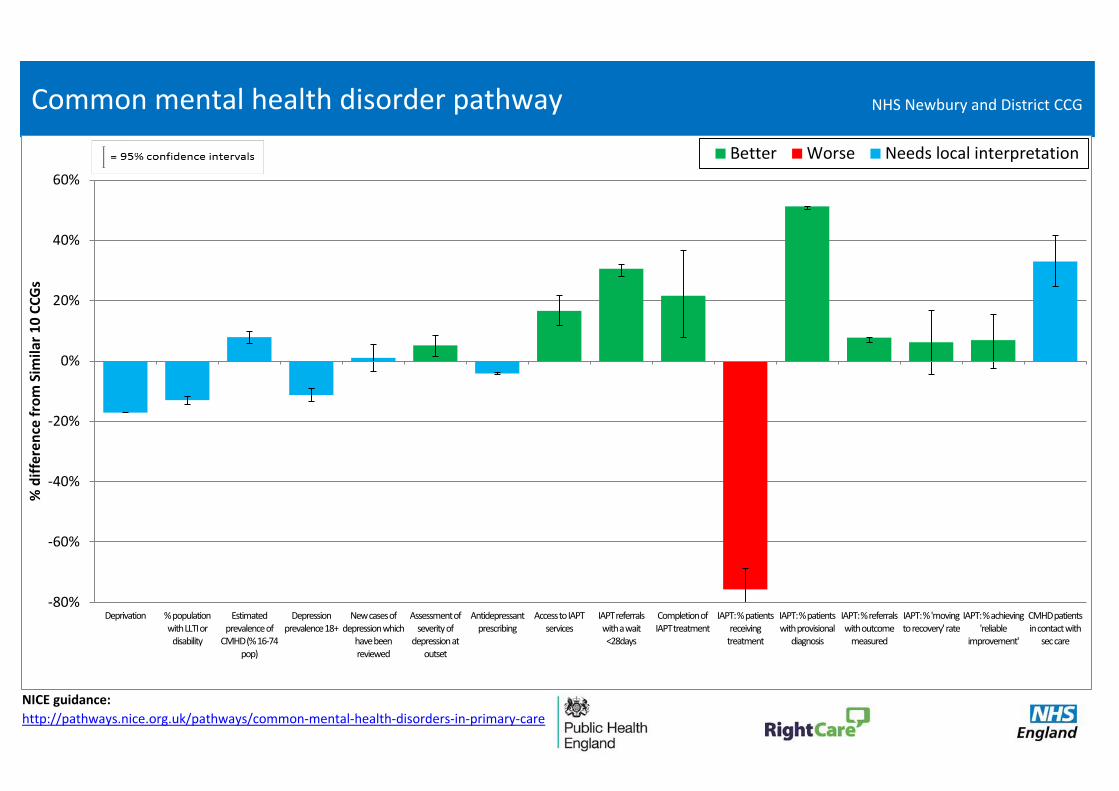
NICE guidance:
http://pathways.nice.org.uk/pathways/common-mental-health-disorders-in-primary-care
Common mental health disorder pathway
-80%
-60%
-40%
-20%
0%
20%
40%
60%
Deprivation % population with LLTI or
disability
Estimated prevalence of
CMHD (% 16-74 pop)
Depression prevalence 18+
New cases of depression which
have been reviewed
Assessment of severity of
depression at outset
Antidepressant prescribing
Access to IAPT services
IAPT referrals with a wait <28days
Completion of IAPT treatment
IAPT: % patients receiving
treatment
IAPT: % patients with provisional
diagnosis
IAPT: % referrals with outcome
measured
IAPT: % 'moving to recovery' rate
IAPT: % achieving 'reliable
improvement'
CMHD patients in contact with
sec care
% d
iffe
ren
ce f
rom
Sim
ilar
10
CC
Gs
Better Worse Needs local interpretation
NHS Newbury and District CCG
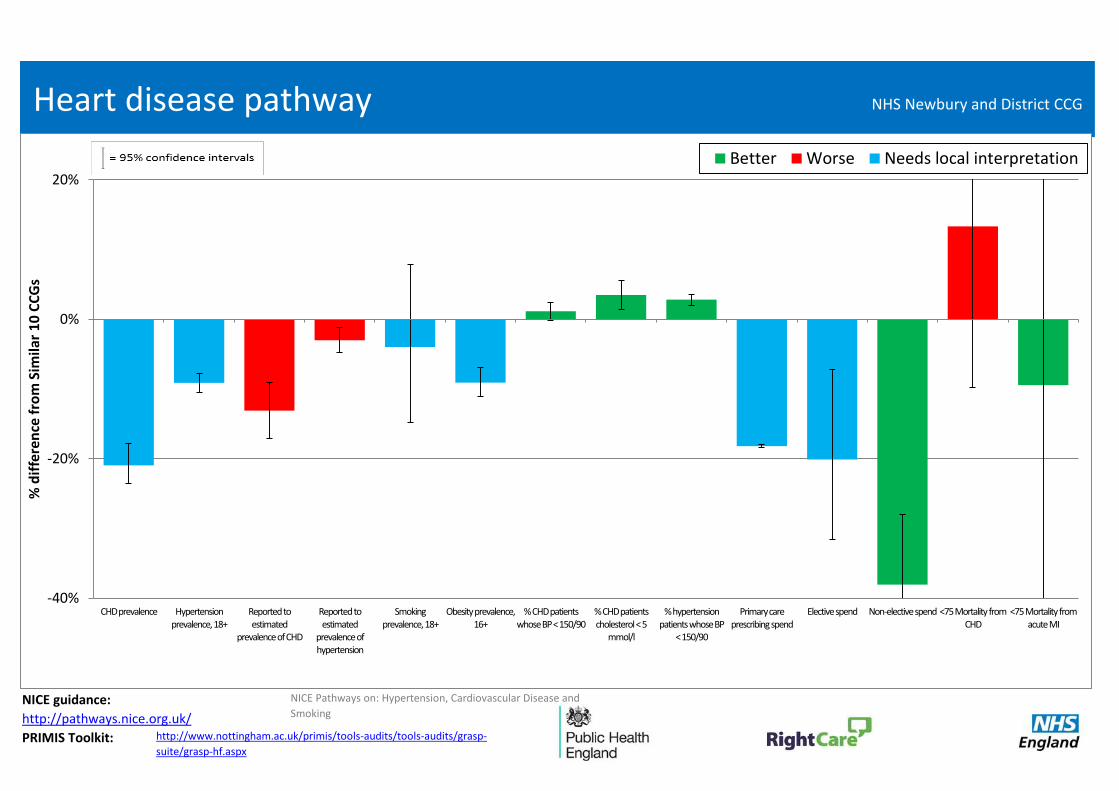
NICE guidance:
http://pathways.nice.org.uk/
PRIMIS Toolkit:
Heart disease pathway
NICE Pathways on: Hypertension, Cardiovascular Disease and
Smoking
http://www.nottingham.ac.uk/primis/tools-audits/tools-audits/grasp-
suite/grasp-hf.aspx
-40%
-20%
0%
20%
CHD prevalence Hypertension prevalence, 18+
Reported to estimated
prevalence of CHD
Reported to estimated
prevalence of hypertension
Smoking prevalence, 18+
Obesity prevalence, 16+
% CHD patients whose BP < 150/90
% CHD patients cholesterol < 5
mmol/l
% hypertension patients whose BP
< 150/90
Primary care prescribing spend
Elective spend Non-elective spend <75 Mortality from CHD
<75 Mortality from acute MI
% d
iffe
ren
ce f
rom
Sim
ilar
10
CC
Gs
Better Worse Needs local interpretation
NHS Newbury and District CCG
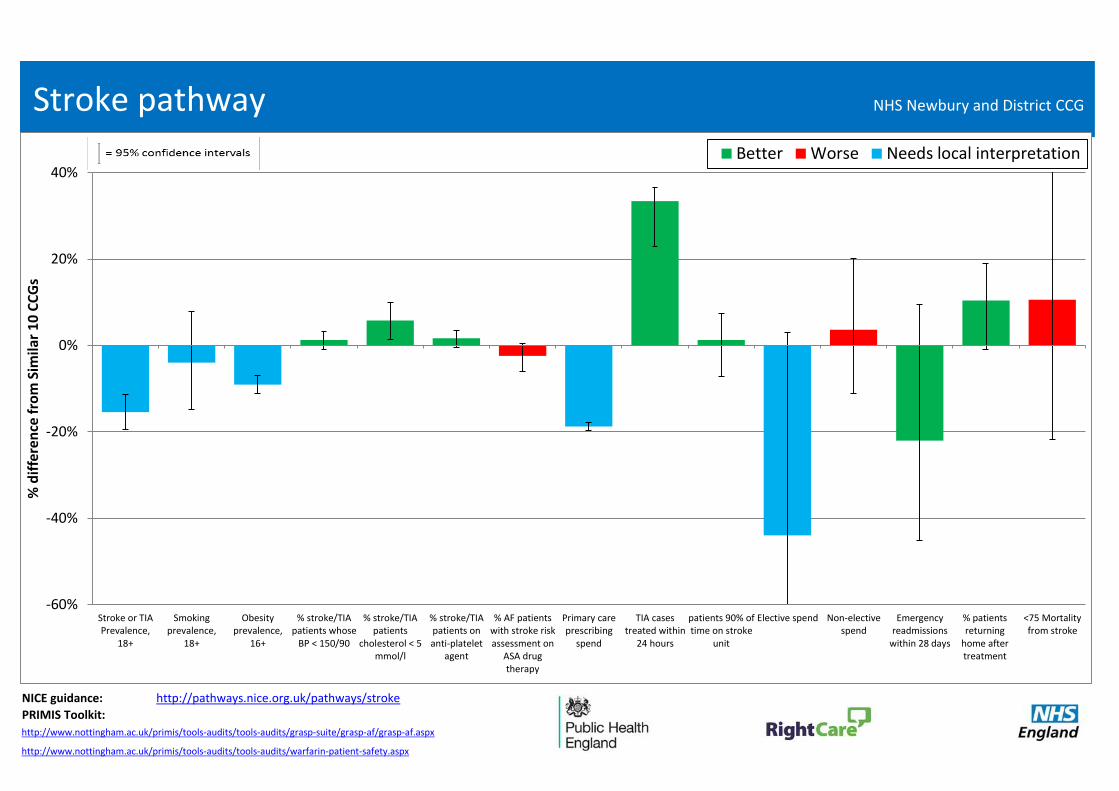
NICE guidance: http://pathways.nice.org.uk/pathways/stroke
http://www.nottingham.ac.uk/primis/tools-audits/tools-audits/warfarin-patient-safety.aspx
http://www.nottingham.ac.uk/primis/tools-audits/tools-audits/grasp-suite/grasp-af/grasp-af.aspx
PRIMIS Toolkit:
Stroke pathway
-60%
-40%
-20%
0%
20%
40%
Stroke or TIAPrevalence,
18+
Smokingprevalence,
18+
Obesityprevalence,
16+
% stroke/TIApatients whose
BP < 150/90
% stroke/TIApatients
cholesterol < 5mmol/l
% stroke/TIApatients onanti-platelet
agent
% AF patientswith stroke riskassessment on
ASA drugtherapy
Primary careprescribing
spend
TIA casestreated within
24 hours
patients 90% oftime on stroke
unit
Elective spend Non-electivespend
Emergencyreadmissions
within 28 days
% patientsreturning
home aftertreatment
<75 Mortalityfrom stroke
% d
iffe
ren
ce f
rom
Sim
ilar
10
CC
Gs
Better Worse Needs local interpretation
NHS Newbury and District CCG
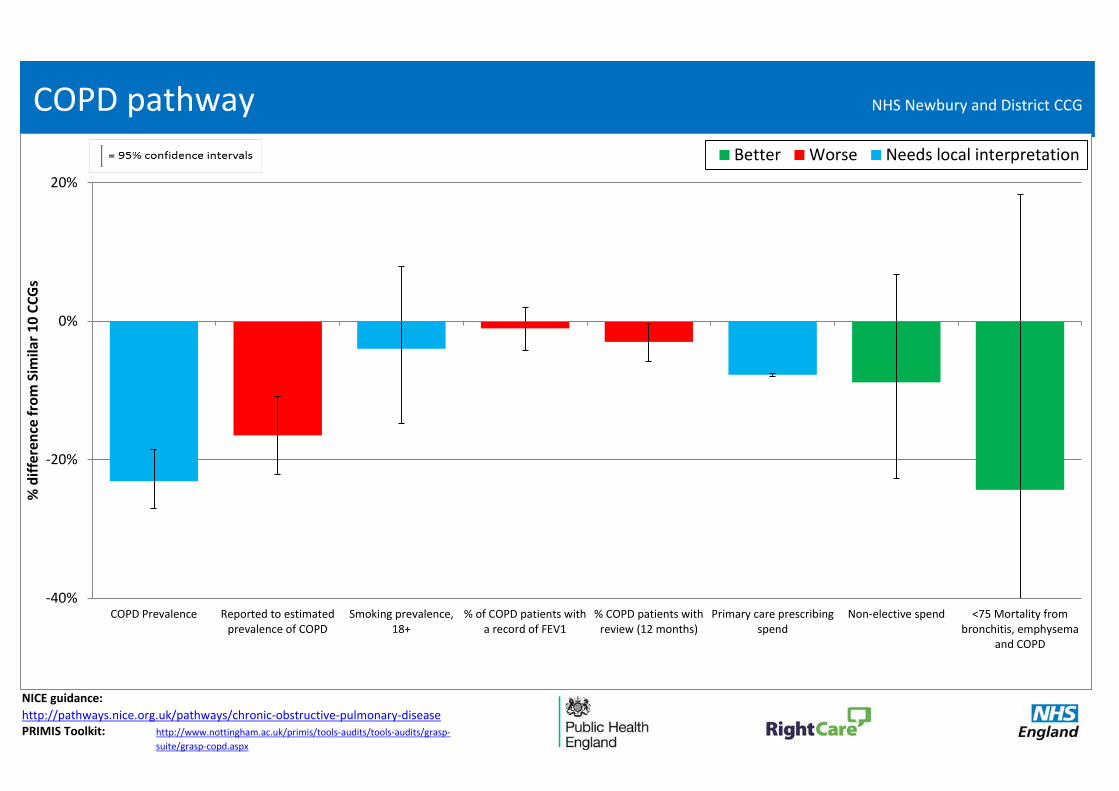
NICE guidance:
PRIMIS Toolkit:
COPD pathway
http://pathways.nice.org.uk/pathways/chronic-obstructive-pulmonary-diseasehttp://www.nottingham.ac.uk/primis/tools-audits/tools-audits/grasp-
suite/grasp-copd.aspx
-40%
-20%
0%
20%
COPD Prevalence Reported to estimatedprevalence of COPD
Smoking prevalence,18+
% of COPD patients witha record of FEV1
% COPD patients withreview (12 months)
Primary care prescribingspend
Non-elective spend <75 Mortality frombronchitis, emphysema
and COPD
% d
iffe
ren
ce f
rom
Sim
ilar
10
CC
Gs
Better Worse Needs local interpretation
NHS Newbury and District CCG
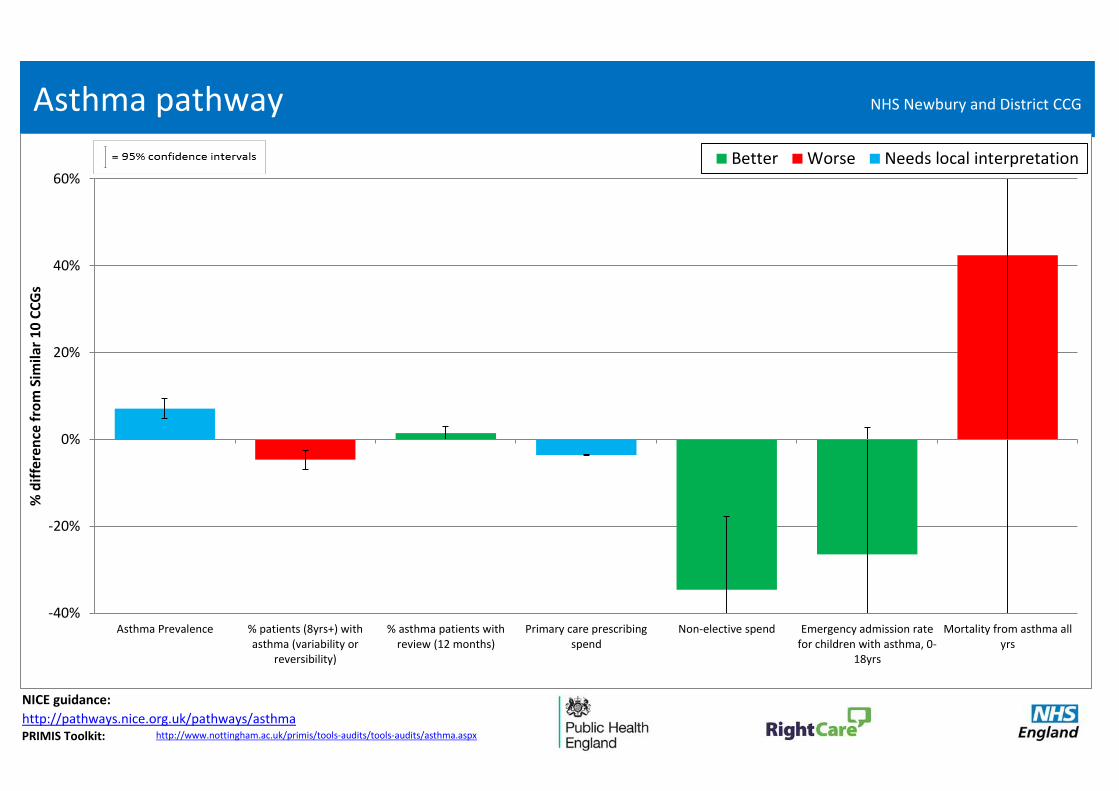
NICE Pathways
NICE guidance:
http://pathways.nice.org.uk/pathways/asthmaPRIMIS Toolkit:
Asthma pathway
http://www.nottingham.ac.uk/primis/tools-audits/tools-audits/asthma.aspx
-40%
-20%
0%
20%
40%
60%
Asthma Prevalence % patients (8yrs+) withasthma (variability or
reversibility)
% asthma patients withreview (12 months)
Primary care prescribingspend
Non-elective spend Emergency admission ratefor children with asthma, 0-
18yrs
Mortality from asthma allyrs
% d
iffe
ren
ce f
rom
Sim
ilar
10
CC
Gs
Better Worse Needs local interpretation
NHS Newbury and District CCG
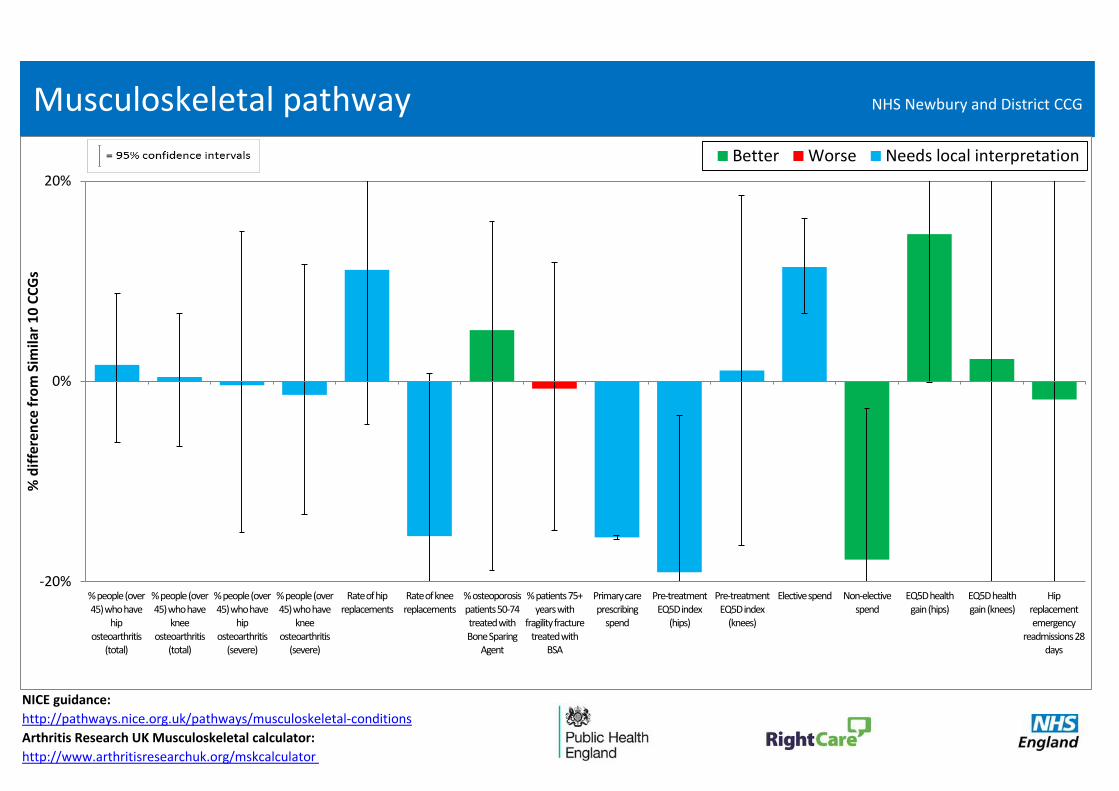
NICE guidance:
http://pathways.nice.org.uk/pathways/musculoskeletal-conditions
Arthritis Research UK Musculoskeletal calculator:
http://www.arthritisresearchuk.org/mskcalculator
Musculoskeletal pathway
-20%
0%
20%
% people (over 45) who have
hip osteoarthritis
(total)
% people (over 45) who have
knee osteoarthritis
(total)
% people (over 45) who have
hip osteoarthritis
(severe)
% people (over 45) who have
knee osteoarthritis
(severe)
Rate of hip replacements
Rate of knee replacements
% osteoporosis patients 50-74 treated with Bone Sparing
Agent
% patients 75+ years with
fragility fracture treated with
BSA
Primary care prescribing
spend
Pre-treatment EQ5D index
(hips)
Pre-treatment EQ5D index
(knees)
Elective spend Non-elective spend
EQ5D health gain (hips)
EQ5D health gain (knees)
Hip replacement emergency
readmissions 28 days
% d
iffe
ren
ce f
rom
Sim
ilar
10
CC
Gs
Better Worse Needs local interpretation
NHS Newbury and District CCG
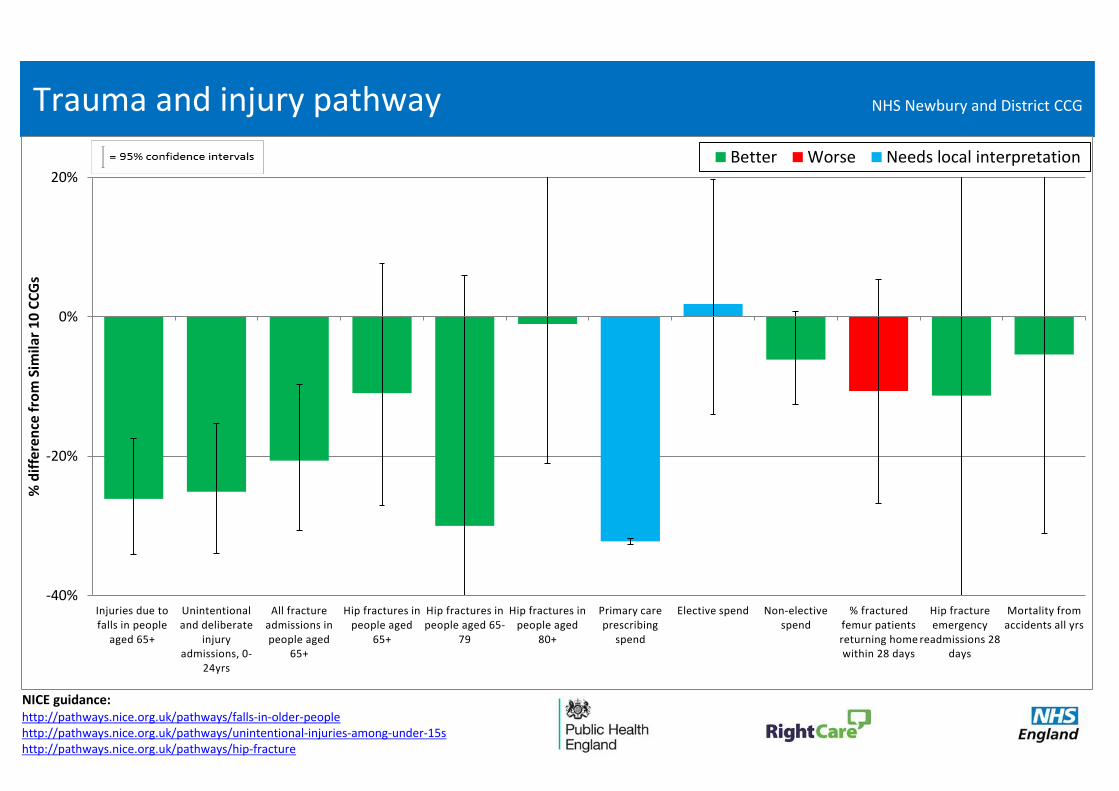
NICE guidance:http://pathways.nice.org.uk/pathways/falls-in-older-peoplehttp://pathways.nice.org.uk/pathways/unintentional-injuries-among-under-15shttp://pathways.nice.org.uk/pathways/hip-fracture
Trauma and injury pathway
-40%
-20%
0%
20%
Injuries due to falls in people
aged 65+
Unintentional and deliberate
injury admissions, 0-
24yrs
All fracture admissions in people aged
65+
Hip fractures in people aged
65+
Hip fractures in people aged 65-
79
Hip fractures in people aged
80+
Primary care prescribing
spend
Elective spend Non-elective spend
% fractured femur patients returning home within 28 days
Hip fracture emergency
readmissions 28 days
Mortality from accidents all yrs
% d
iffe
ren
ce f
rom
Sim
ilar
10
CC
Gs
Better Worse Needs local interpretation
NHS Newbury and District CCG

NICE guidance:
http://pathways.nice.org.uk/pathways/chronic-kidney-disease
http://pathways.nice.org.uk/pathways/acute-kidney-injury
Renal pathway
-40%
-20%
0%
20%
40%
Reported CKD prevalence
Reported to estimated
prevalence of CKD
% CKD patients whose BP <
140/85
% on CKD register with hypertension
and proteinuria treated with ACE-I or ARB
Creatinine ratio test used in last
12 months
Primary care prescribing
spend
Nephrology first outpatient
attendance rate
Elective spend Non-elective spend
Acceptance rate for renal
replacement therapy
% home dialysis undertaken
% of patients on RRT who have a
transplant
% d
iffe
ren
ce f
rom
Sim
ilar
10
CC
Gs
Better Worse Needs local interpretation
NHS Newbury and District CCG
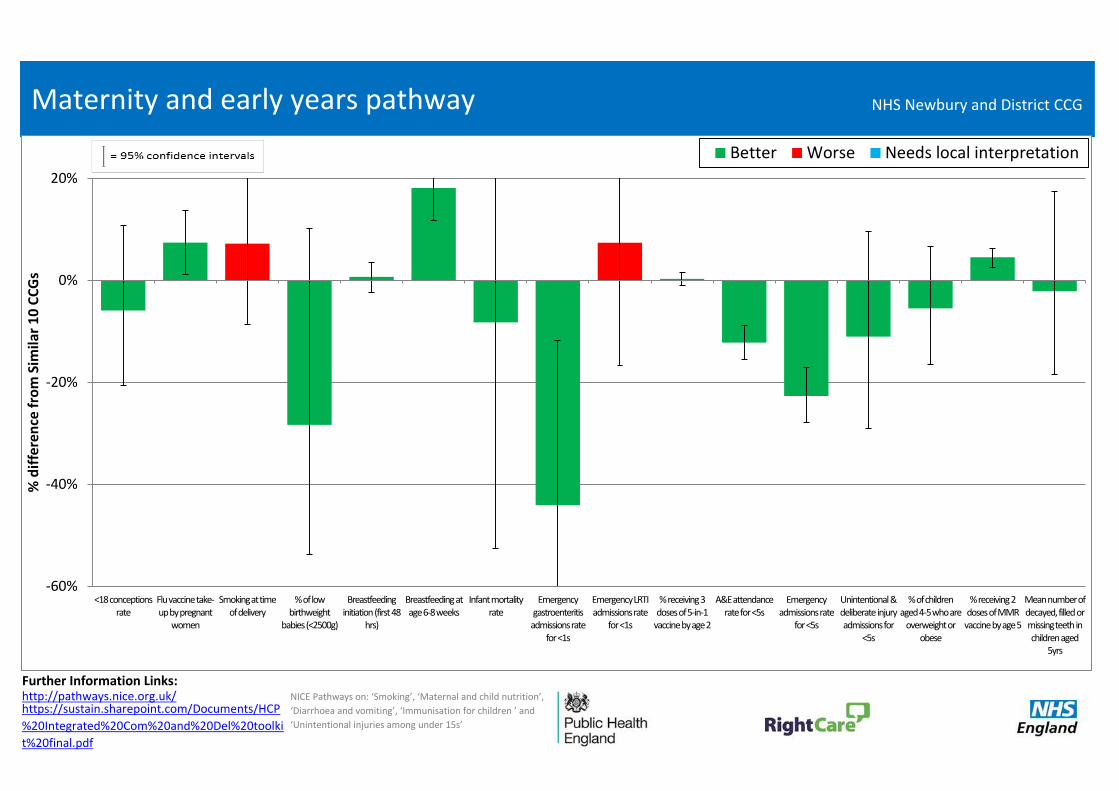
Further Information Links:http://pathways.nice.org.uk/https://sustain.sharepoint.com/Documents/HCP
%20Integrated%20Com%20and%20Del%20toolki
t%20final.pdf
NICE Pathways on: ‘Smoking’, ‘Maternal and child nutrition’,
‘Diarrhoea and vomiting’, ‘Immunisation for children ’ and
‘Unintentional injuries among under 15s’
Maternity and early years pathway
-60%
-40%
-20%
0%
20%
<18 conceptions rate
Flu vaccine take-up by pregnant
women
Smoking at time of delivery
% of low birthweight
babies (<2500g)
Breastfeeding initiation (first 48
hrs)
Breastfeeding at age 6-8 weeks
Infant mortality rate
Emergency gastroenteritis admissions rate
for <1s
Emergency LRTI admissions rate
for <1s
% receiving 3 doses of 5-in-1
vaccine by age 2
A&E attendance rate for <5s
Emergency admissions rate
for <5s
Unintentional & deliberate injury admissions for
<5s
% of children aged 4-5 who are
overweight or obese
% receiving 2 doses of MMR
vaccine by age 5
Mean number of decayed, filled or missing teeth in children aged
5yrs
% d
iffe
ren
ce f
rom
Sim
ilar
10
CC
Gs
Better Worse Needs local interpretation
NHS Newbury and District CCG
NHS Newbury and District CCG
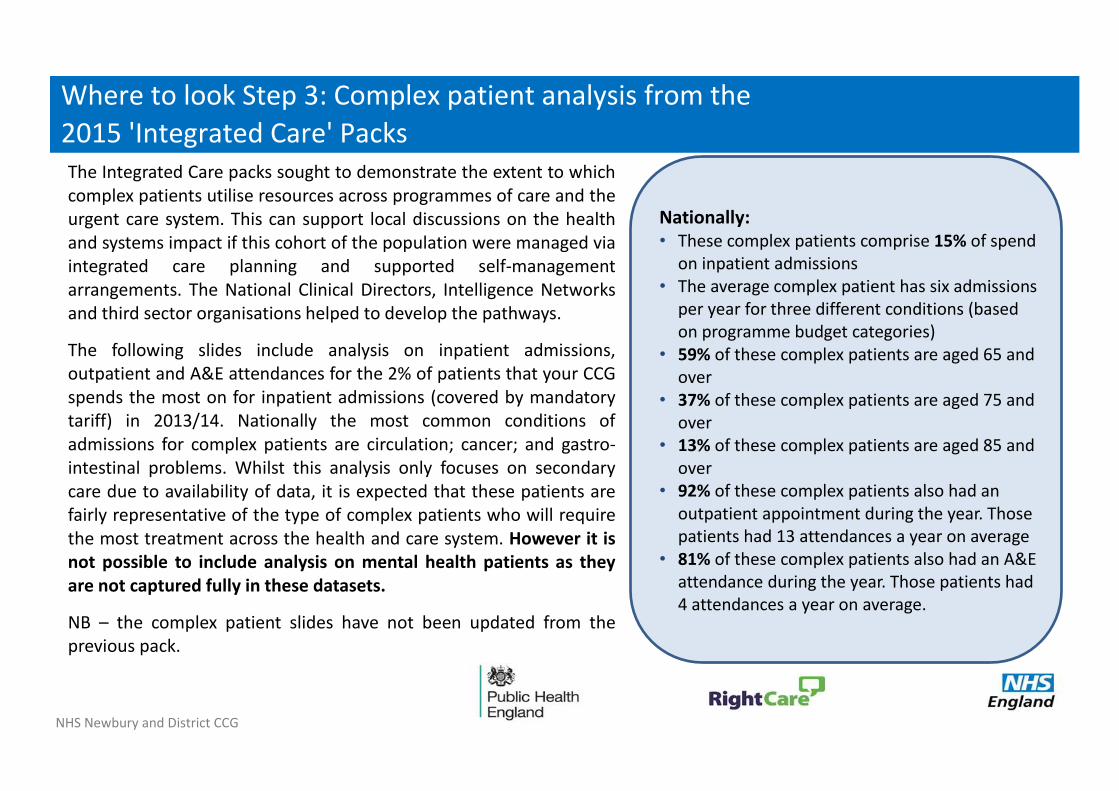
Where to look Step 3: Complex patient analysis from the
2015 'Integrated Care' PacksThe Integrated Care packs sought to demonstrate the extent to which complex patients utilise resources across programmes of care and the urgent care system. This can support local discussions on the health and systems impact if this cohort of the population were managed via integrated care planning and supported self-management arrangements. The National Clinical Directors, Intelligence Networks and third sector organisations helped to develop the pathways.
The following slides include analysis on inpatient admissions, outpatient and A&E attendances for the 2% of patients that your CCG spends the most on for inpatient admissions (covered by mandatory tariff) in 2013/14. Nationally the most common conditions of admissions for complex patients are circulation; cancer; and gastro-intestinal problems. Whilst this analysis only focuses on secondary care due to availability of data, it is expected that these patients are fairly representative of the type of complex patients who will require the most treatment across the health and care system. However it is not possible to include analysis on mental health patients as they are not captured fully in these datasets.
NB – the complex patient slides have not been updated from the previous pack.
Nationally: • These complex patients comprise 15% of spend
on inpatient admissions • The average complex patient has six admissions
per year for three different conditions (based on programme budget categories)
• 59% of these complex patients are aged 65 and over
• 37% of these complex patients are aged 75 and over
• 13% of these complex patients are aged 85 and over
• 92% of these complex patients also had an outpatient appointment during the year. Those patients had 13 attendances a year on average
• 81% of these complex patients also had an A&E attendance during the year. Those patients had 4 attendances a year on average.
05L
05P
06F
06H
06M
08Y
10G
10N
10W
99M
99P
99Q
11J
18
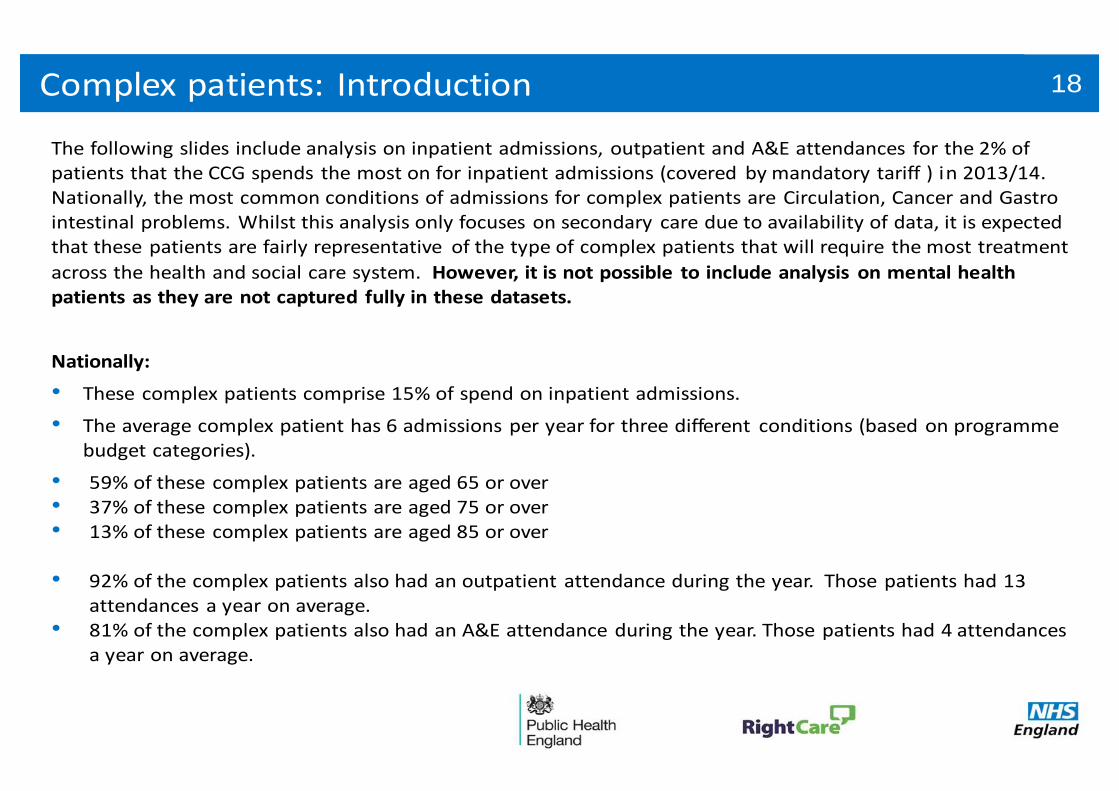
The following slides include analysis on inpatient admissions, outpatient and A&E attendances for the 2% of patients that the CCG spends the most on for inpatient admissions (covered by mandatory tariff ) in 2013/14. Nationally, the most common conditions of admissions for complex patients are Circulation, Cancer and Gastro intestinal problems. Whilst this analysis only focuses on secondary care due to availability of data, it is expected that these patients are fairly representative of the type of complex patients that will require the most treatment
across the health and social care system. However, it is not possible to include analysis on mental health patients as they are not captured fully in these datasets.
Nationally:
• These complex patients comprise 15% of spend on inpatient admissions.
• The average complex patient has 6 admissions per year for three different conditions (based on programme budget categories).
• 59% of these complex patients are aged 65 or over• 37% of these complex patients are aged 75 or over• 13% of these complex patients are aged 85 or over
• 92% of the complex patients also had an outpatient attendance during the year. Those patients had 13 attendances a year on average.
• 81% of the complex patients also had an A&E attendance during the year. Those patients had 4 attendances a year on average.
Complex patients: Introduction
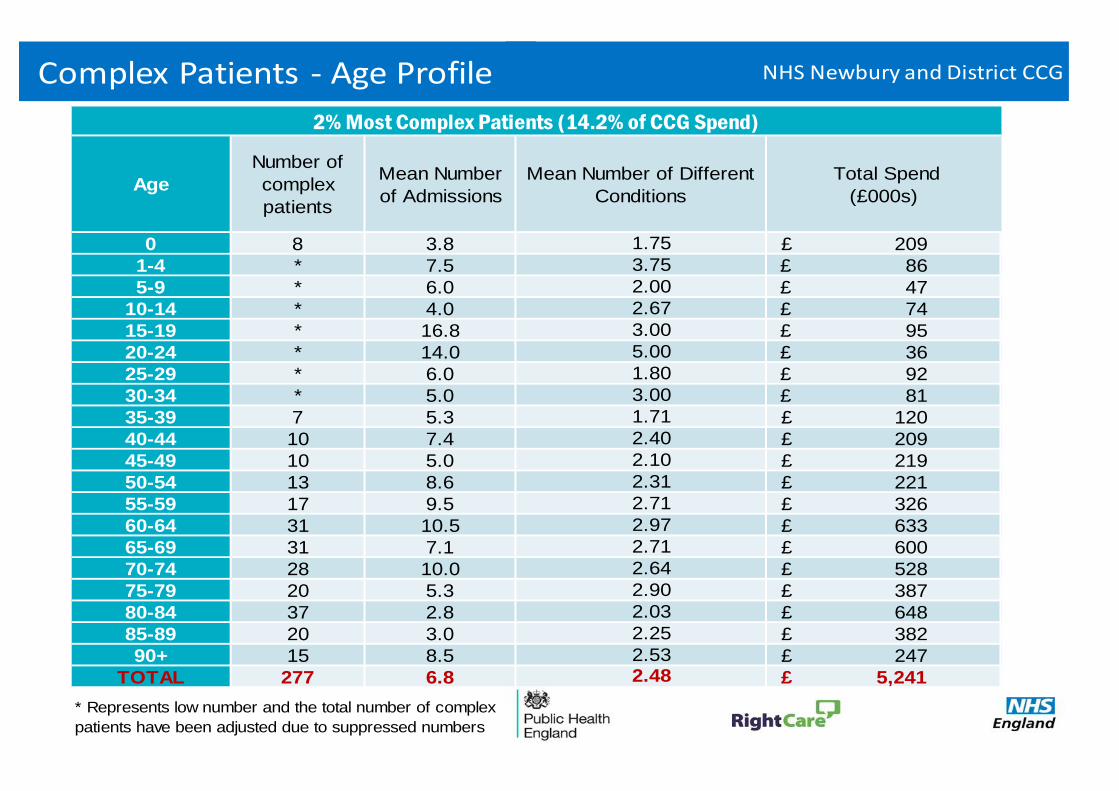
Age
Number of
complex
patients
Mean Number
of Admissions
Mean Number of Different
Conditions
5-9 * 6.0
10-14 * 4.0
0 8 3.8
1-4 * 7.5
25-29 * 6.0
30-34 * 5.0
15-19 * 16.8
20-24 * 14.0
* Represents low number and the total number of complex
patients have been adjusted due to suppressed numbers
50-54 13 8.6
35-39 7 5.3
40-44 10 7.4
85-89 20 3.0
90+ 15 8.5
75-79 20 5.3
80-84 37 2.8
3.00
1.71
2.40
2.10
Total Spend
(£000s)
2% Most Complex Patients (14.2% of CCG Spend)
TOTAL 277 6.8
65-69 31 7.1
70-74 28 10.0
55-59 17 9.5
60-64 31 10.5
45-49 10 5.0
2.53 2.48
£ 209
£ 86
£ 47
£ 74
£ 95
£ 36
£ 92
2.31
2.71
2.97
2.71
2.64
2.90
1.75
3.75
2.00
2.67
3.00
5.00
1.80
2.03
2.25
£ 247
£ 5,241
£ 633
£ 600
£ 528
£ 387
£ 648
£ 382
£ 81
£ 120
£ 209
£ 219
£ 221
£ 326
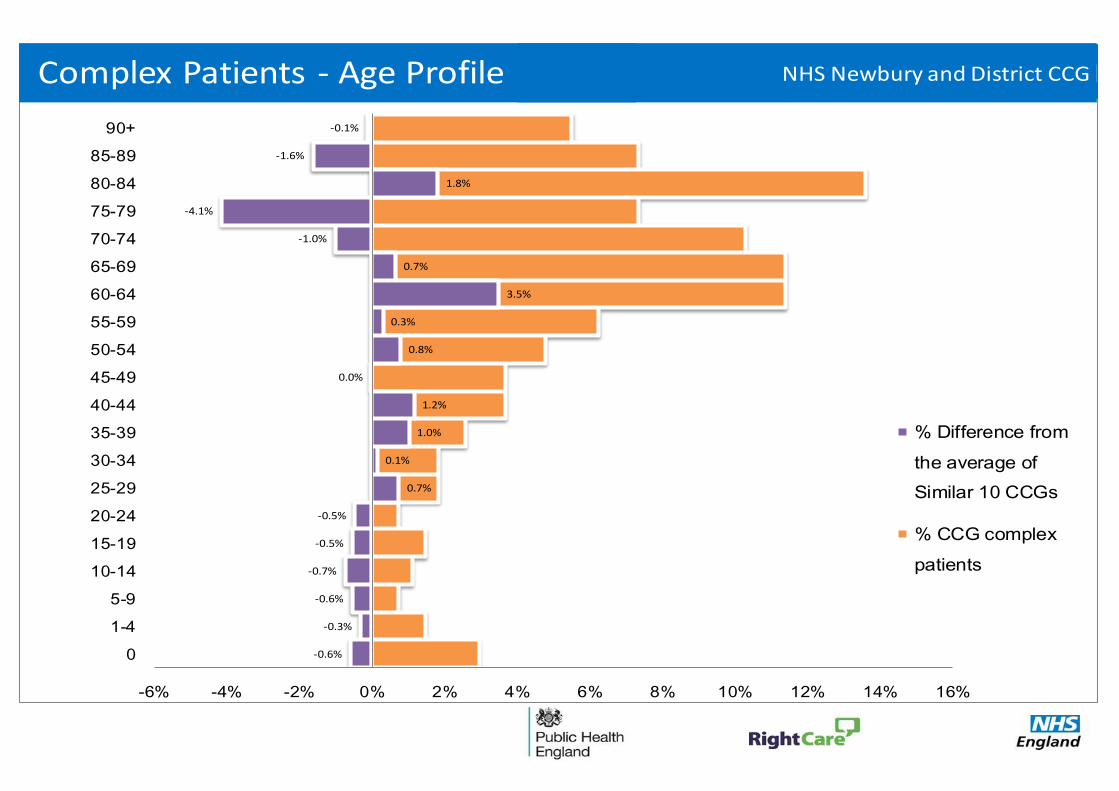
Complex Patients - Age Profile NHS Newbury and District CCG
*
-0.6%
-0.3%
-0.6%
-0.7%
-0.5%
-0.5%
0.7%
0.1%
1.0%
1.2%
0.0%
0.8%
0.3%
3.5%
0.7%
-1.0%
-4.1%
1.8%
-1.6%
-0.1%
-6% -4% -2% 0% 2% 4% 6% 8% 10% 12% 14% 16%
0
1-4
5-9
10-14
15-19
20-24
25-29
30-34
35-39
40-44
45-49
50-54
55-59
60-64
65-69
70-74
75-79
80-84
85-89
90+
% Difference from
the average of
Similar 10 CCGs
% CCG complex
patients
Complex Patients - Age Profile NHS Newbury and District CCG
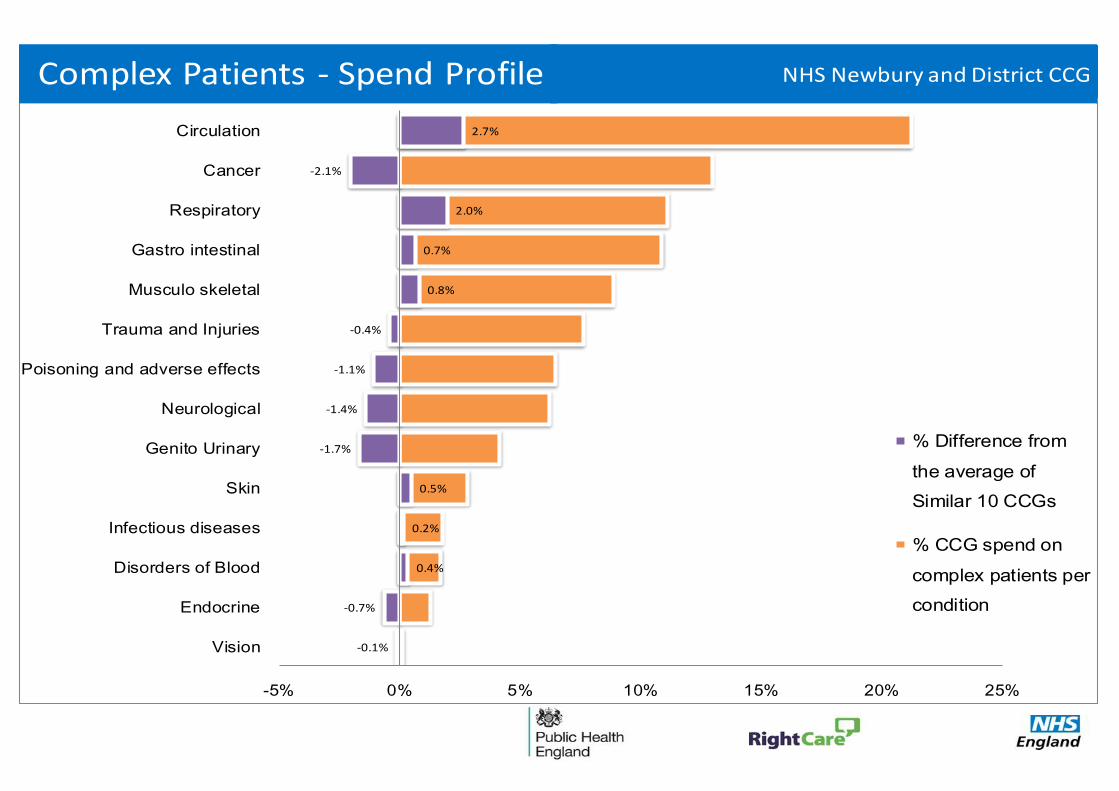
*
-0.1%
-0.7%
0.4%
0.2%
0.5%
-1.7%
-1.4%
-1.1%
-0.4%
0.8%
0.7%
2.0%
-2.1%
2.7%
-5% 0% 5% 10% 15% 20% 25%
Vision
Endocrine
Disorders of Blood
Infectious diseases
Skin
Genito Urinary
Neurological
Poisoning and adverse effects
Trauma and Injuries
Musculo skeletal
Gastro intestinal
Respiratory
Cancer
Circulation
% Difference from
the average of
Similar 10 CCGs
% CCG spend on
complex patients per
condition
Complex Patients - Spend Profile NHS Newbury and District CCG
Gastro intestinal
93 patients
Main conditions
Cancer
Respiratory
62 patients
Cancer
77 patients
Circulation
Respiratory
Respiratory
Trauma and Injuries
20
16 10
15
Circulation
Disorders of Blood
Genito Urinary
Gastro intestinal
Neurological
14
Cancer
Co-morbidity 2Co-morbidity 1 Co-morbidity 5 Co-morbidity 4Co-morbidity 3
15
RespiratoryPoisoning and
adverse effectsCirculation
55 patients
Neurological
63 patients
Cancer
14 13
Genito Urinary
16
13
Cancer
Gastro intestinal
16
18
Poisoning and
adverse effects
17
15
Neurological
Gastro intestinal
Trauma and Injuries
18
Neurological
Circulation
Poisoning and
adverse effects
17
15
Gastro intestinal
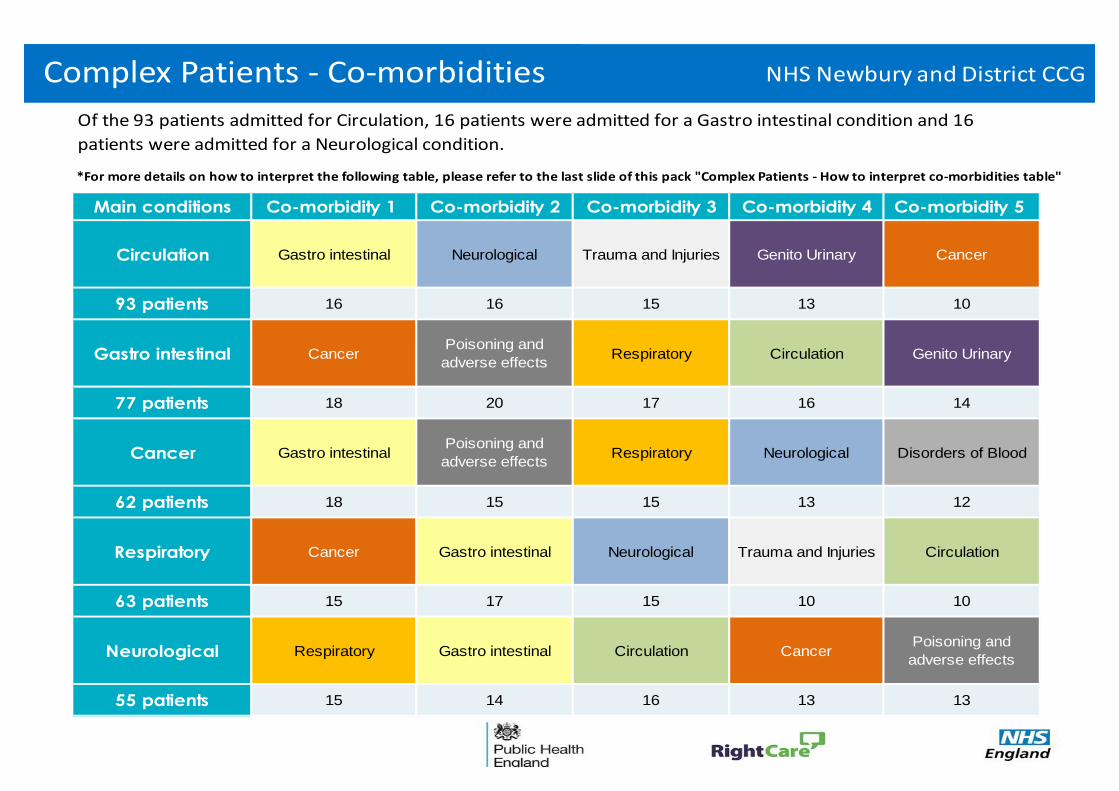
*For more details on how to interpret the following table, please refer to the last slide of this pack "Complex Patients - How to interpret co-morbidities table"
Of the 93 patients admitted for Circulation, 16 patients were admitted for a Gastro intestinal condition and 16
patients were admitted for a Neurological condition.
10
13 12
10
13
15
15
16
Complex Patients - Co-morbidities NHS Newbury and District CCG
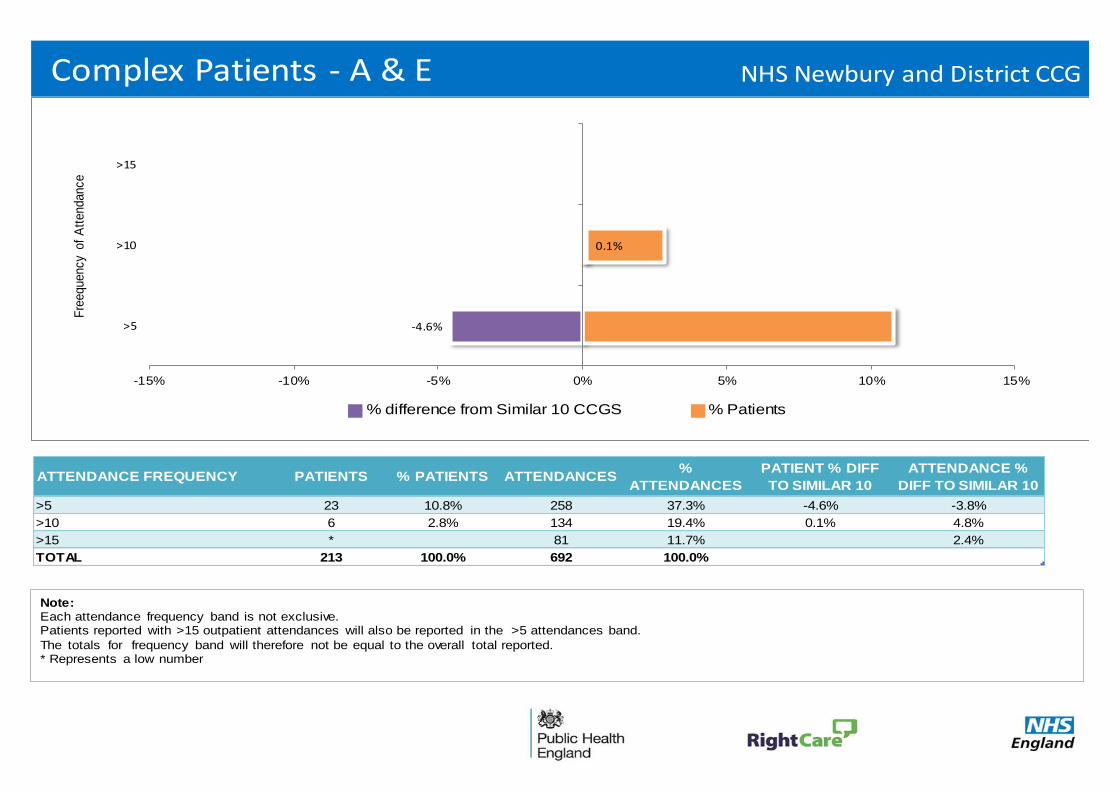
Complex Patients - A & E NHS Newbury and District CCG
-4.6%
0.1%
-15% -10% -5% 0% 5% 10% 15%
>5
>10
>15
Fre
equency o
f A
ttendance
Note:Each attendance frequency band is not exclusive. Patients reported with >15 outpatient attendances will also be reported in the >5 attendances band.
The totals for frequency band will therefore not be equal to the overall total reported.* Represents a low number
% difference from Similar 10 CCGS % Patients
ATTENDANCE FREQUENCY PATIENTS % PATIENTS ATTENDANCES%
ATTENDANCES
PATIENT % DIFF
TO SIMILAR 10
ATTENDANCE %
DIFF TO SIMILAR 10
>5 23 10.8% 258 37.3% -4.6% -3.8%
>10 6 2.8% 134 19.4% 0.1% 4.8%
>15 * 81 11.7% 2.4%
TOTAL 213 100.0% 692 100.0%

1
2
3
4
5
Complex Patients - Outpatients NHS Newbury and District CCG
-8.9%
-12.2%
-11.5%
-30% -20% -10% 0% 10% 20% 30% 40% 50% 60% 70%
>5
>10
>15
Fre
equency o
f A
ttendance
Note:Each attendance frequency band is not exclusive. Patients reported with >15 outpatient attendances will also be
reported in the >5 attendances band.The totals for frequency band will therefore not be equal to the overall total reported.
The treatments table shows the top 5 treatments for a CCG based on attendances. The number of patients is not exclusive as 1 patient could attend for multiple different conditions.
* Represents a low number.‡ Please refer to Commissioning for Value website for details.
% difference from Similar 10 CCGS % Patients
ATTENDANCE FREQUENCY PATIENTS % PATIENTS ATTENDANCES%
ATTENDANCES
PATIENT % DIFF
TO SIMILAR 10
ATTENDANCE %
DIFF TO SIMILAR 10
>5 141 58.0% 1,923 87.0% -8.9% -5.4%
>10 72 29.6% 1,376 62.3% -12.2% -14.6%
>15 36 14.8% 918 41.5% -11.5% -19.6%
TOTAL 243 100.0% 2,210 100.0%
‡ TOP 5 CONDITIONS PATIENTS % PATIENTS ATTENDANCES%
ATTENDANCES
Trauma and Musculoskeletal 69 28.4% 319 14.4%
Circulation 84 34.6% 285 12.9%
Genito Urinary 50 20.6% 270 12.2%
Cancer 46 18.9% 206 9.3%
Disorders of Blood 34 14.0% 182 8.2%
TOTAL 243 100.0% 2,210 100.0%
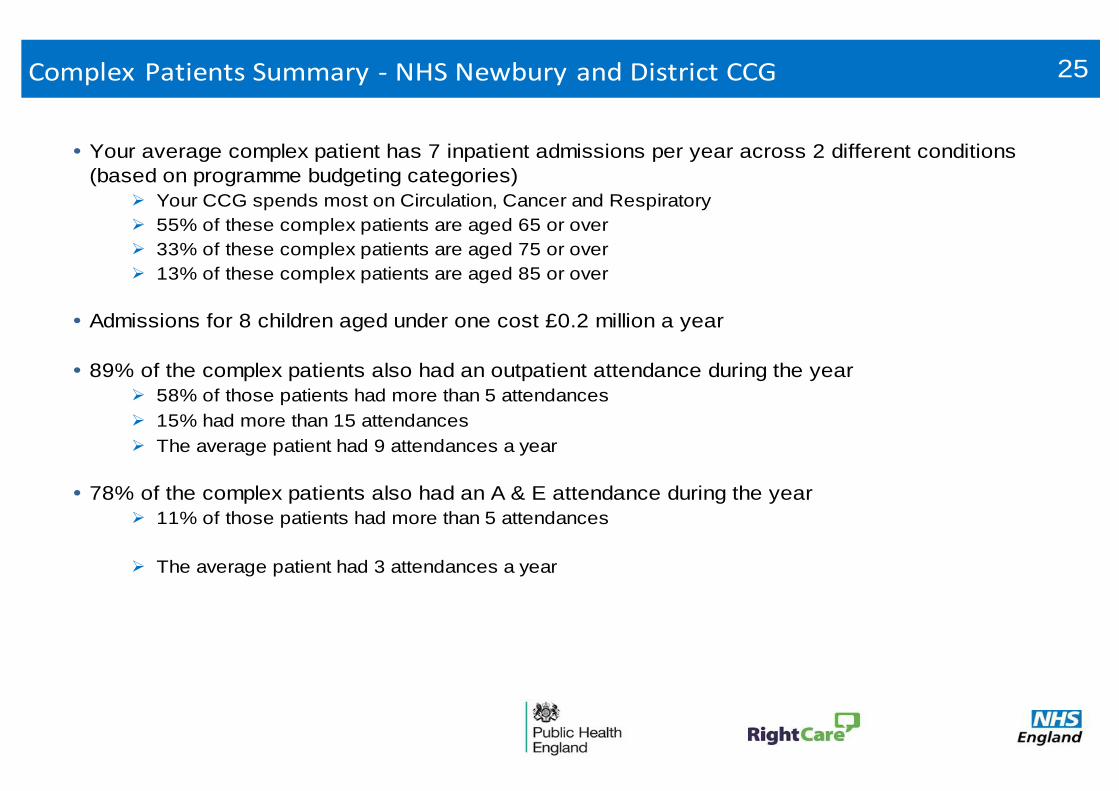
• Your average complex patient has 7 inpatient admissions per year across 2 different conditions
(based on programme budgeting categories)
Your CCG spends most on Circulation, Cancer and Respiratory
55% of these complex patients are aged 65 or over
33% of these complex patients are aged 75 or over
13% of these complex patients are aged 85 or over
• Admissions for 8 children aged under one cost £0.2 million a year
• 89% of the complex patients also had an outpatient attendance during the year
58% of those patients had more than 5 attendances
15% had more than 15 attendances
The average patient had 9 attendances a year
• 78% of the complex patients also had an A & E attendance during the year
11% of those patients had more than 5 attendances
The average patient had 3 attendances a year
25Complex Patients Summary - NHS Newbury and District CCG

NHS Newbury and District CCG
You may be thinking…
“The data are wrong”
The data are ‘indicative’, they do not need to be 100% robust to indicate that improvement is needed in an area, especially where more than one indicator (triangulation) suggests the same.
“The data are old”
The data are the most recent available. Have you done anything since to improve the pathway? If not, the opportunity remains.
“We’ve already fixed that area”
Great news! Double-check that the reforms have worked and move on to the next priority area identified by the indicators.
NHS Newbury and District CCG
Next steps and actions
In addition to joining our workshops in early 2016, commissioners can take practical steps now:
• Identify the priority programmes and complex patients in your locality and compare with current reform activity and improvement plans
• Engage with clinicians and other local stakeholders, including public health teams in local authorities and commissioning support organisations
• Revisit the Commissioning for Value web pages: https://www.england.nhs.uk/comm-for-value/ regularly as content, including new tools to support use of the Commissioning for Value packs, will be added soon
• Explore other resources, such as the ‘how to’ videos, CVD Intelligence Network focus pack and NICE resources. See the NHS RightCare website for links: http://www.rightcare.nhs.uk/ Ensure planning round submissions reflect the opportunities identified and potential for change
• Engage with the national RightCare team at the regional workshops in January and February
• And (for Wave One CCGs) prepare for action in your local health economy by appointing an SRO to champion this work, plus leads with key responsibility for finance, commissioning, innovation, clinical and primary care
NHS Newbury and District CCG
Further support and information
The Commissioning for Value benchmarking tool, full details of all the data used, and links to other useful tools are available on the Commissioning for Value pages of the NHS England website: https://www.england.nhs.uk/comm-for-value/ We will shortly be producing a series of focus packs for CCGs that will provide more detailed information on the opportunities to improve in the eleven highest spending programmes covered by this pack. This will include a wider range of outcomes measures and information on the most common procedures and diagnoses that patients are admitted to hospital for. This will also present information on those GP practices within each CCG that are performing better or worse than similar practices across the country.
The NHS RightCare website offers resources to support CCGs in adopting the Commissioning for Value approach: http://www.rightcare.nhs.uk/ These include:
• Online videos and ‘how to’ guides • Case studies with learning from other CCGs
If you have any questions or require any further information or support you can email the Commissioning for Value support team direct at: [email protected]
NHS Newbury and District CCG
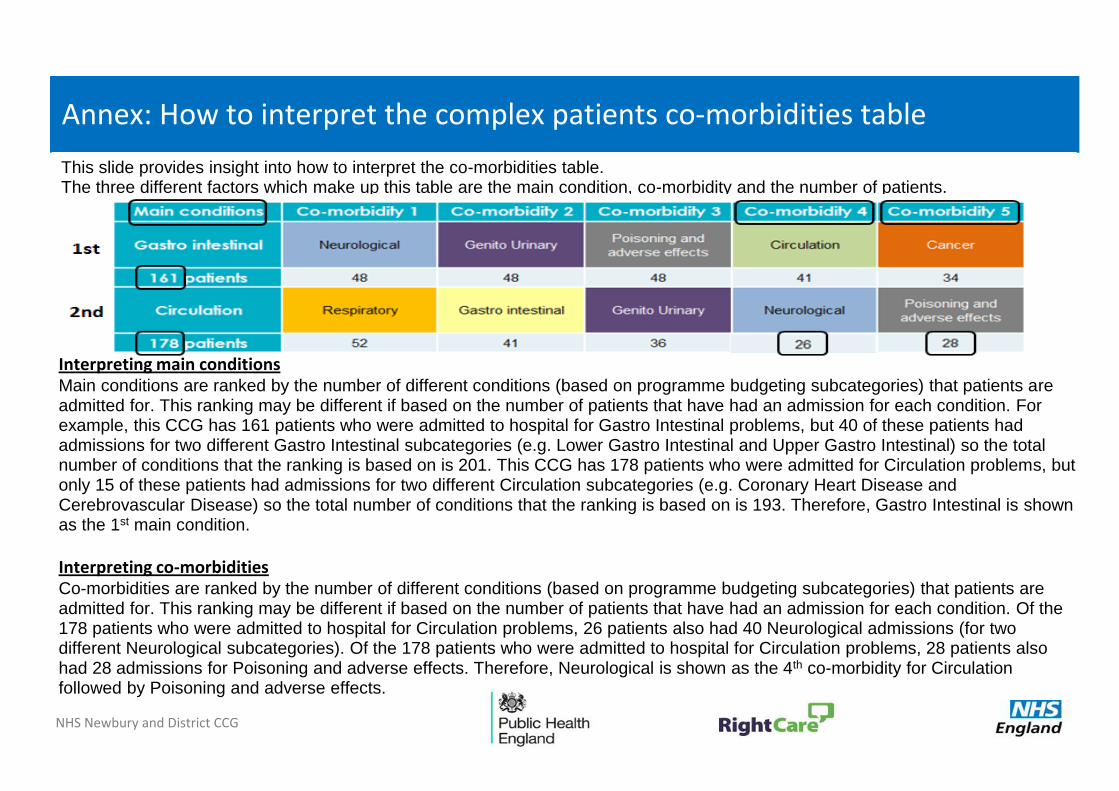
Annex: How to interpret the complex patients co-morbidities table
This slide provides insight into how to interpret the co-morbidities table. The three different factors which make up this table are the main condition, co-morbidity and the number of patients.
Interpreting main conditions Main conditions are ranked by the number of different conditions (based on programme budgeting subcategories) that patients are admitted for. This ranking may be different if based on the number of patients that have had an admission for each condition. For example, this CCG has 161 patients who were admitted to hospital for Gastro Intestinal problems, but 40 of these patients had admissions for two different Gastro Intestinal subcategories (e.g. Lower Gastro Intestinal and Upper Gastro Intestinal) so the total number of conditions that the ranking is based on is 201. This CCG has 178 patients who were admitted for Circulation problems, but only 15 of these patients had admissions for two different Circulation subcategories (e.g. Coronary Heart Disease and Cerebrovascular Disease) so the total number of conditions that the ranking is based on is 193. Therefore, Gastro Intestinal is shown as the 1st main condition.
Interpreting co-morbidities Co-morbidities are ranked by the number of different conditions (based on programme budgeting subcategories) that patients are admitted for. This ranking may be different if based on the number of patients that have had an admission for each condition. Of the 178 patients who were admitted to hospital for Circulation problems, 26 patients also had 40 Neurological admissions (for two different Neurological subcategories). Of the 178 patients who were admitted to hospital for Circulation problems, 28 patients also had 28 admissions for Poisoning and adverse effects. Therefore, Neurological is shown as the 4th co-morbidity for Circulation followed by Poisoning and adverse effects.