NHS Stockport CCG NHS England Publications Gateway · PDF fileNHS Stockport CCG NHS England...
34
NHS England Publications Gateway ref: 03066 Commissioning for Value: Integrated care pathways February 2015 NHS Stockport CCG
Transcript of NHS Stockport CCG NHS England Publications Gateway · PDF fileNHS Stockport CCG NHS England...
NHS Stockport CCG
NHS England Publications Gateway ref:
NHS England Publications Gateway ref: 03066
Commissioning for Value: Integrated care pathways
February 2015
Contents
NHS Stockport CCG
NHS Stockport CCG
Contents
• Introduction: What is Commissioning for Value?
• Supporting planning and transformation
• The integrated care pack
• Why act: Patient Case Study
• Integrated Care Pathways and Data
• Pathways on a Page
• Complex Patients
• Complex Patients Case Study – Wigan Borough CCG
• Identifying opportunities to improve population health
• The NHS Right Care approach - Next steps
• Commissioning for Value workshops
• Further support and information
• Annex - Full list of indicators
• Complex Patients - How to interpret co-morbidities table
2
Introduction: What is Commissioning for Value?
NHS Stockport CCG
Introduction: What is Commissioning for Value?
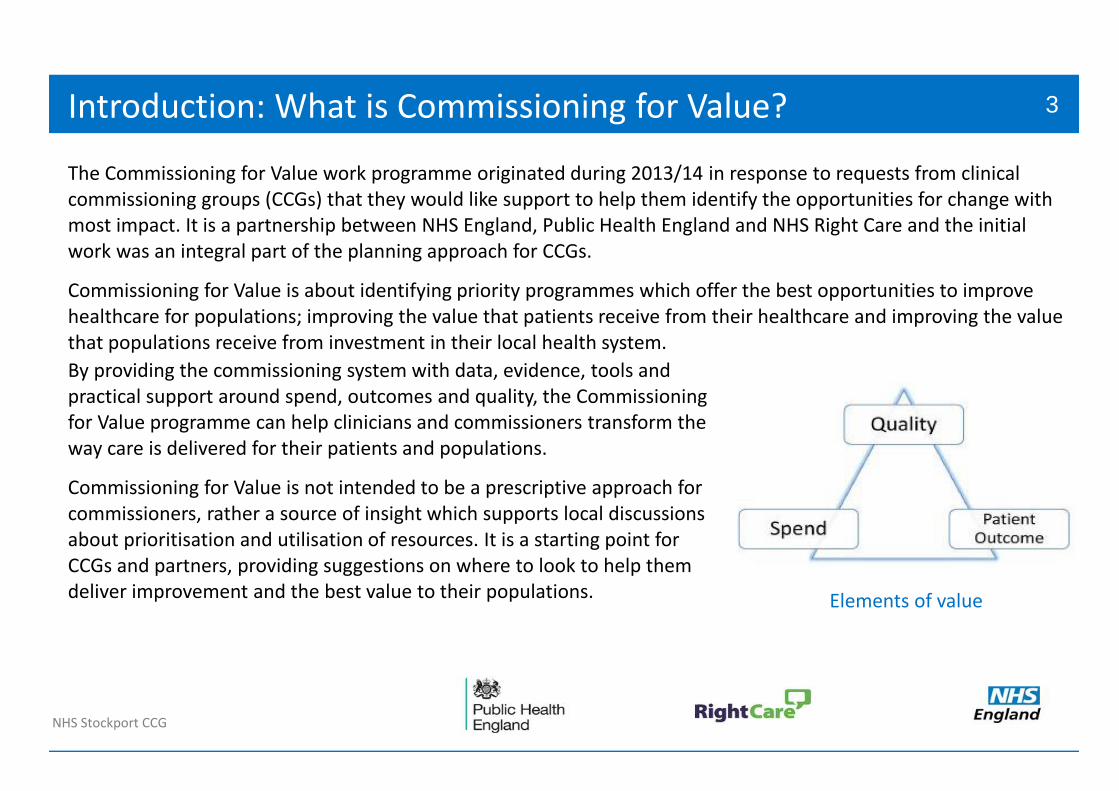
The Commissioning for Value work programme originated during 2013/14 in response to requests from clinical commissioning groups (CCGs) that they would like support to help them identify the opportunities for change with most impact. It is a partnership between NHS England, Public Health England and NHS Right Care and the initial work was an integral part of the planning approach for CCGs.
Commissioning for Value is about identifying priority programmes which offer the best opportunities to improve healthcare for populations; improving the value that patients receive from their healthcare and improving the value that populations receive from investment in their local health system.
By providing the commissioning system with data, evidence, tools and practical support around spend, outcomes and quality, the Commissioning for Value programme can help clinicians and commissioners transform the way care is delivered for their patients and populations.
Commissioning for Value is not intended to be a prescriptive approach for commissioners, rather a source of insight which supports local discussions about prioritisation and utilisation of resources. It is a starting point for CCGs and partners, providing suggestions on where to look to help them deliver improvement and the best value to their populations.
Elements of value
3
Supporting planning and transformation
NHS Stockport CCG
Supporting planning and transformation
The healthcare system is facing the challenges of increasing demand and limited resources. People’s need for services continues to grow faster than funding. This means that we have to innovate and transform the way we deliver high quality services, within available resources, to ensure that patients and their needs are always put first.
These packs support the vision set out in the recently published Five Year Forward View http://www.england.nhs.uk/wp-content/uploads/2014/10/5yfv-web.pdf with its focus on the transformation of healthcare services to drive quality and efficiency.
They also support the planning guidance for 2015/16. The Forward View into action: planning for 2015/16 http://www.england.nhs.uk/wp-content/uploads/2014/12/forward-view-plning.pdf which emphasises the importance of improving outcomes: Better health for the whole population; Increased quality of care for all patients, and; Better value for the taxpayer.
Commissioning for Value helps to support local discussion about prioritisation and utilisation of resources. By using the information contained in these integrated care packs and associated tools, CCGs will be able to ensure their plans focus on the opportunities which have the potential to provide the biggest improvements in health outcomes and resource utilisation.
4
The Integrated Care pack
NHS Stockport CCG
The Integrated Care pack
This Integrated Care pack is the latest in a series of Commissioning for Value support packs for CCGs.
The first packs - released in October 2013 - contained information on a range of improvement opportunities to help each CCG identify where its local health economy could focus its efforts – the ‘where to look’ phase of the NHS Right Care approach.
In November 2014 we published the Pathway on a Page packs which showed a more detailed look at these areas by providing a wider range of key indicators, the latest published data, and presenting them along the lines of a pathway that patients may experience for different conditions. Both sets of the previous packs can be seen at: http://www.england.nhs.uk/resources/resources-for-ccgs/comm-for-value/.
The new Integrated Care packs seek to demonstrate the extent to which complex patients utilise resources across programmes of care and the urgent care system. This can support local discussions on the health and systems impact if this cohort of the population were managed via integrated care planning and supported self-management arrangements, as is occurring in Wigan Borough CCG.
The National Clinical Directors, Intelligence Networks and third sector organisations have helped to develop the pathways.
5
Why act: Patient case study – Long Term Conditions
NHS Stockport CCG
Why act: Patient case study – Long Term Conditions
Paul Adams is a typical patient in a typical CCG. The following story is seen across the country in many long term condition pathways. Journey one tells of a standard care pathway. Journey two tells of a pathway that has been commissioned for value.
Journey One
• At the age of 45, and after 2 years of increased urinary frequency and loss of energy, Paul goes to his GP. The GP performs tests, confirms diabetes and seeks to manage with diet, exercise and pills. This leads to 6 visits to the practice nurse and 6 laboratory tests per year.
• Paul knows that he is supposed to manage his diet better but is not sure how to do this and does not want to keep bothering the GP and the practice nurse.
• By the age of 50, Paul has given up smoking but continues to drink. His left leg is beginning to hurt. His GP prescribed insulin a year ago and now refers him for outpatient diabetic and vascular support.
• At 52, Paul’s condition has deteriorated further. He has to have his leg amputated and he now has renal and heart problems. His vision is also deteriorating rapidly. He is a classic complex care patient.
This version of Paul’s patient journey costs £49,000 at 2014/15 prices…
6
Why act: Patient case study – Long Term Conditions
NHS Stockport CCG
Why act: Patient case study – Long Term Conditions
If Paul Adams' CCG had adopted Commissioning for Value principles and reformed their diabetes and other long term conditions pathways, what might Paul’s patient journey have looked like?
Journey Two
• The NHS Health Check identifies Paul’s condition one year earlier, at the age of 44 and case management begins…
• Paul is referred to specialist clinics for advice on diet and exercise and he has this refreshed every 2 years. He is also referred to a stop smoking clinic and successfully quits
• Paul has a care plan and optimal medication and retinopathy screening begins 18 months earlier
• He is supported in his self management via the Desmond Programme and a local Diabetes Patient Support Group
Journey One cost £49k and managed Paul’s deterioration
Journey Two costs £9k and keeps Paul well
7
Integrated care data slides
NHS Stockport CCG
Integrated care data slides
The following slides present information on a range of areas where CCGs and Local Authorities (LAs) need to work together to deliver integrated services to deliver the best possible outcomes for patients;
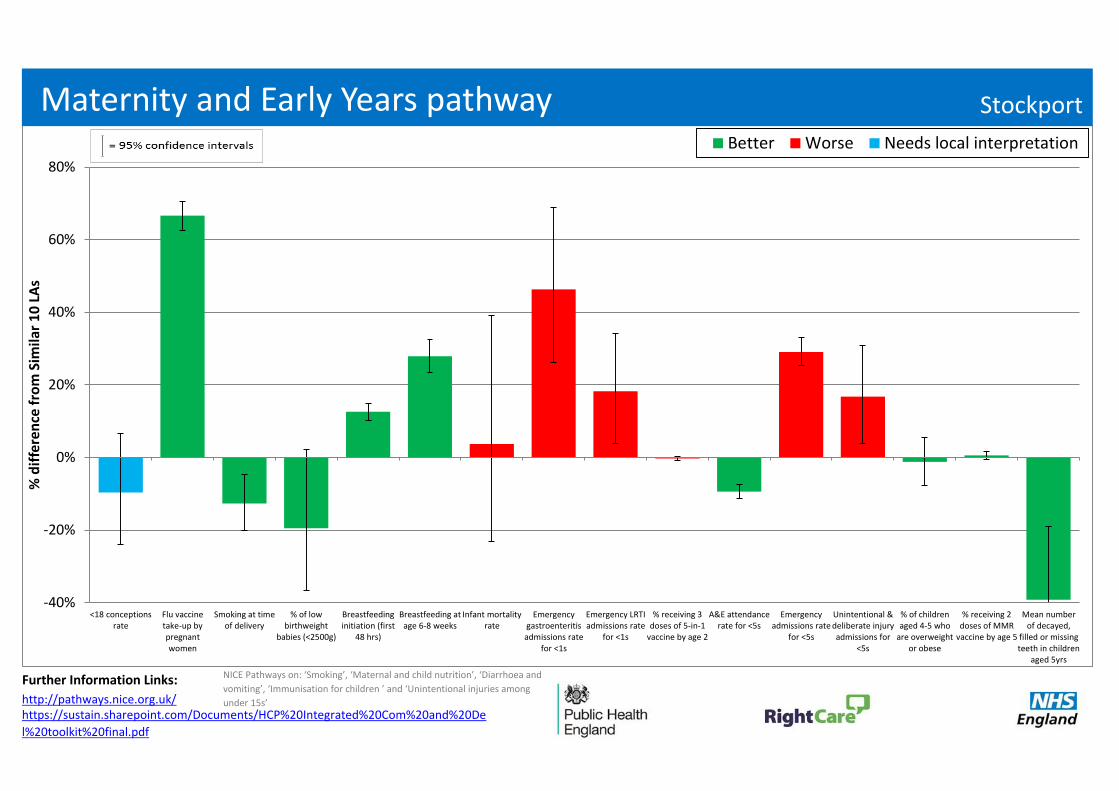
• Maternity and Early Years Pathway (for any LA that has more than a 10% share of the CCG’s population) – shows performance on a range of indicators compared to the average of the ten most similar LAs.
• Inpatient expenditure for 0-4 year olds - shows CCG expenditure broken down by the healthcare programmes with the highest spend for admissions covered by the Payment by Results mandatory tariff compared to the ten most similar CCGs.
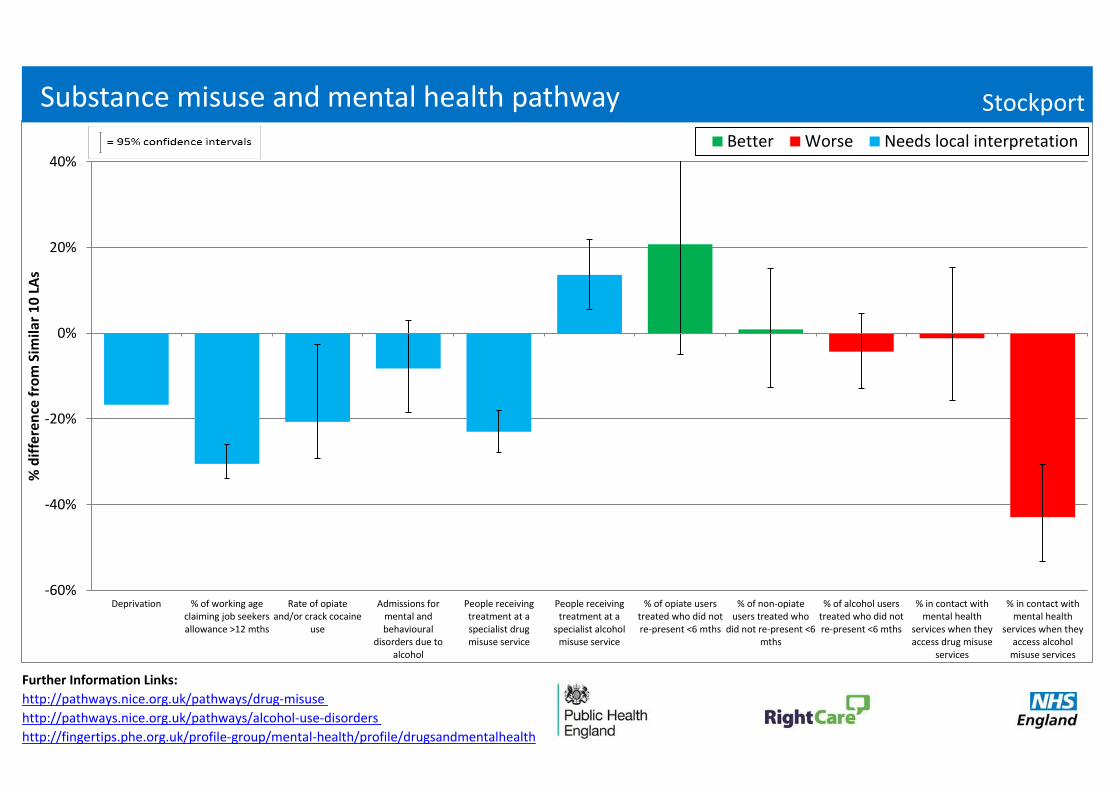
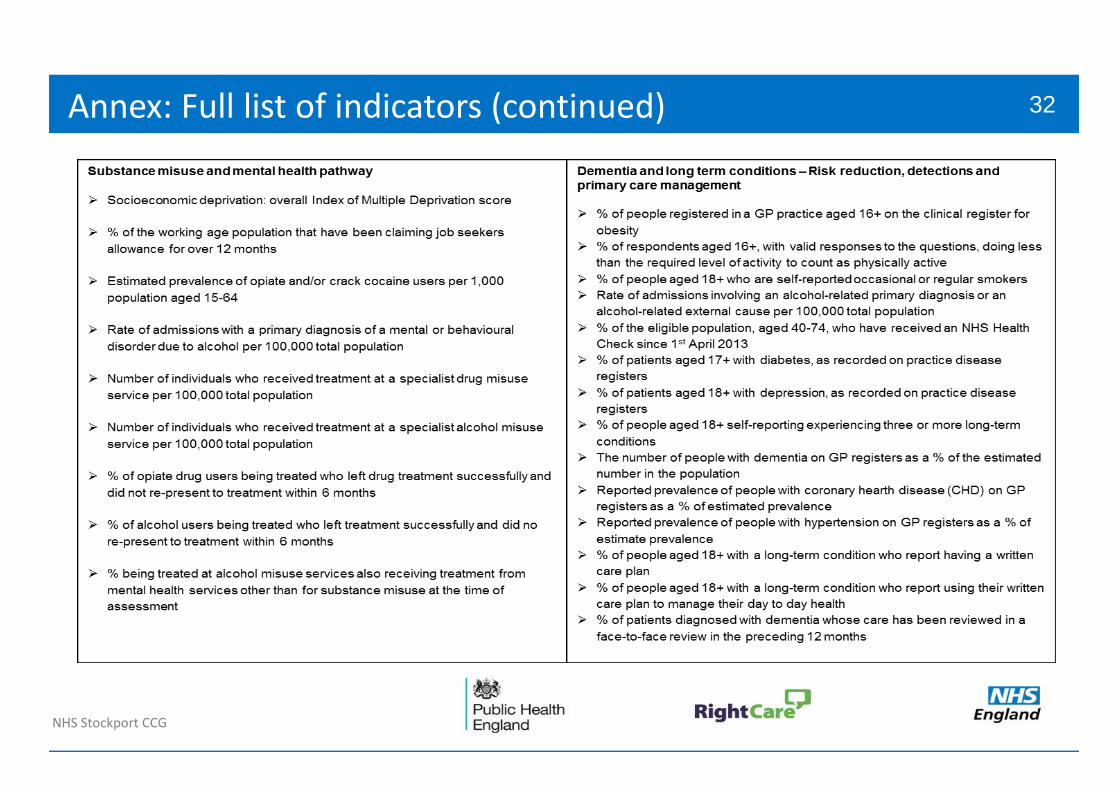
• Substance Misuse and Mental Health Pathway (for any LA that has more than a 10% share of the CCG’s population) – shows performance on a range of indicators compared to the average of the ten most similar LAs.
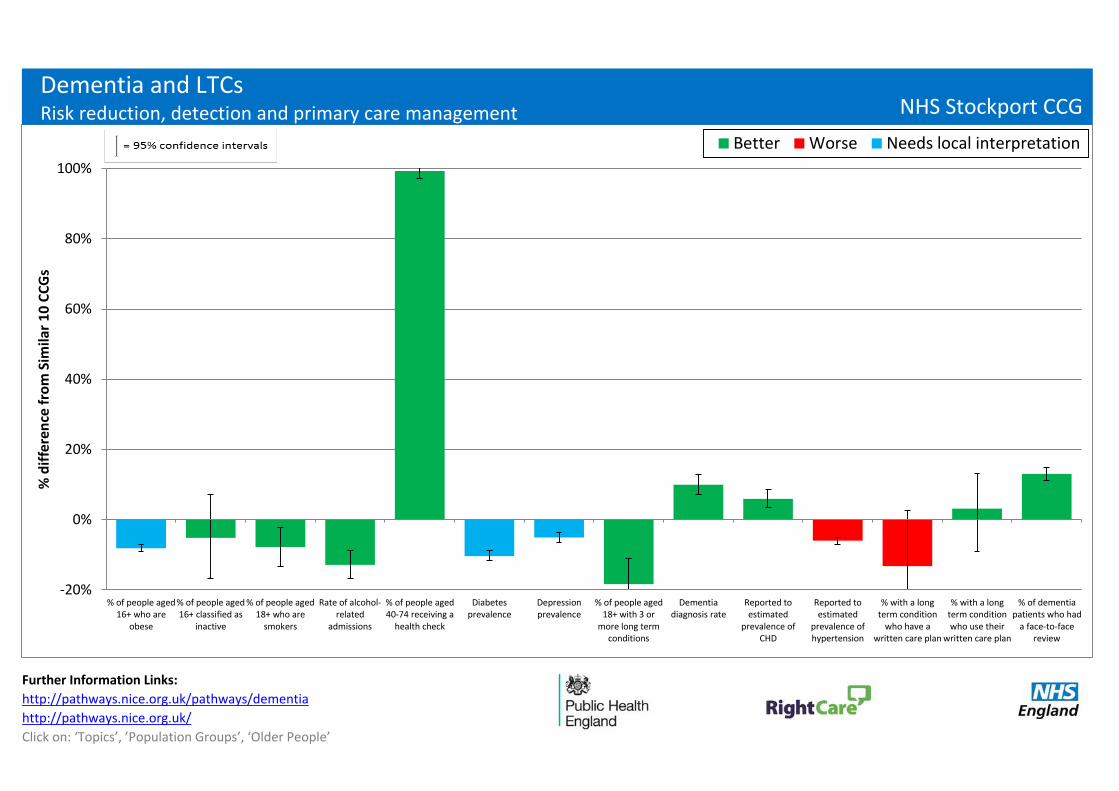
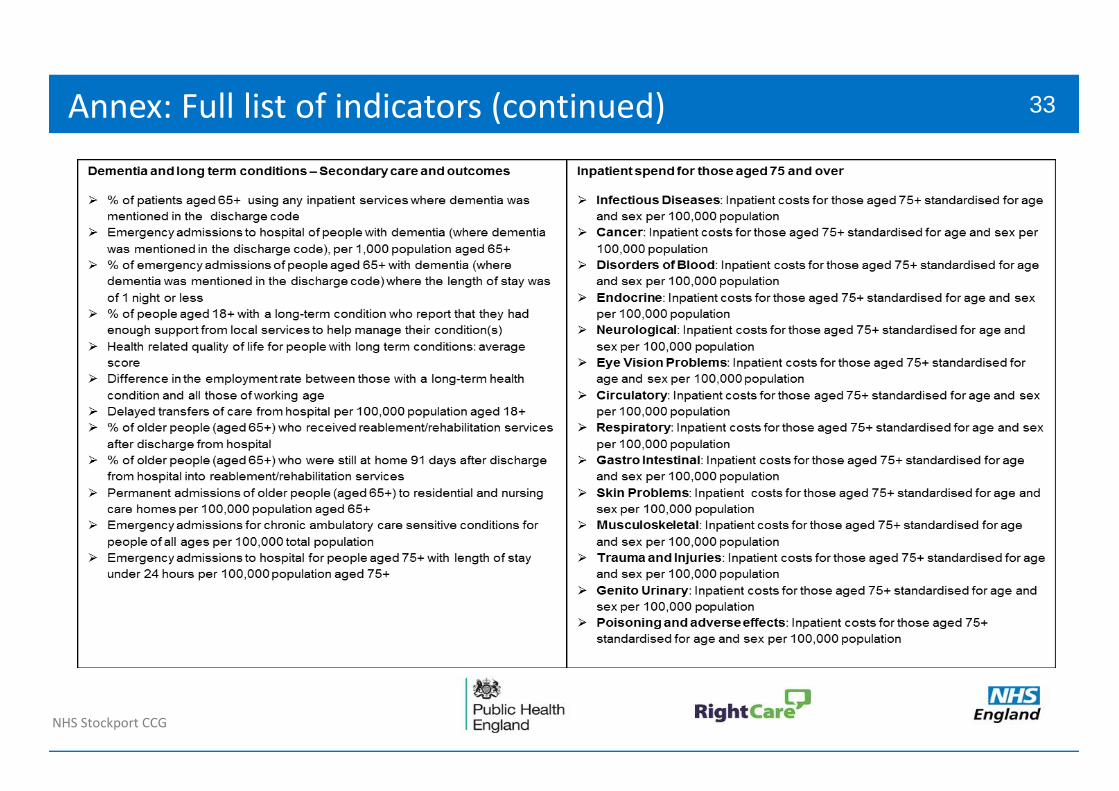
• Dementia and Long Term Conditions Pathway – shows CCG performance on a range of indicators compared to the average of the ten most similar CCGs. Dementia and Long Term Conditions (LTCs) are on the same pathway because risk reduction factors for dementia are similar to those for other LTCs.
• Inpatient expenditure for 75+ year olds - shows CCG expenditure broken down by the healthcare programmes with the highest spend for admissions covered by the Payment by Results mandatory tariff compared to the ten most similar CCGs.
• Analysis of the CCGs’ most complex patients (the 2% of patients that the CCG spends the most on for inpatient admissions covered by the Payment by Results mandatory tariff) – includes information on the number of admissions, age profile and healthcare conditions for inpatient admissions and outpatient and A&E attendances.
8
How to interpret the pathways on a page
NHS Stockport CCG
How to interpret the pathways on a page
Any Town CCG
Amongst the following slides, key indicators are presented for 3 pathways; Maternity and Early Years, Substance Misuse & Mental Health and Dementia & Long Term Conditions. The format of the pathways is the same as presented in the 2014 version of the packs. Each indicator is shown as the percentage difference from the average of the 10 CCGs/LAs most similar to you.
The indicators are colour coded to help you see if your CCG/LA has ‘better’ (green) or ‘worse’ (red) values than your peers. This is not always clear-cut, so ‘needs local interpretation’ (blue) is used where it is not possible to make this judgement. For example, low prevalence may reflect that a CCG/LA truly does have fewer patients with a certain condition, but it may reflect that other CCGs/LAs have better processes in place to identify and record prevalence in primary care.
To note, the variation from the average of the similar 10 CCGs/LAs is statistically significant for those indicators where the confidence intervals do not cross the 0% axis.
Commissioners should work with local clinicians and public health colleagues to interpret these pathways. It is recommended that you look at packs for similar CCGs. By doing so, it may be possible to identify those CCGs which appear to have much better pathways for populations with similar demographics.
To enable a detailed understanding of the indicators, metadata will be published at: http://www.england.nhs.uk/resources/resources-for-ccgs/comm-for-value shortly, but longer descriptions of the indicators are available in the annex at the end of this pack.
Links to the NICE guidance are included for each pathway. All the pathways can be accessed at: http://pathways.nice.org.uk/
9
Most similar CCGs
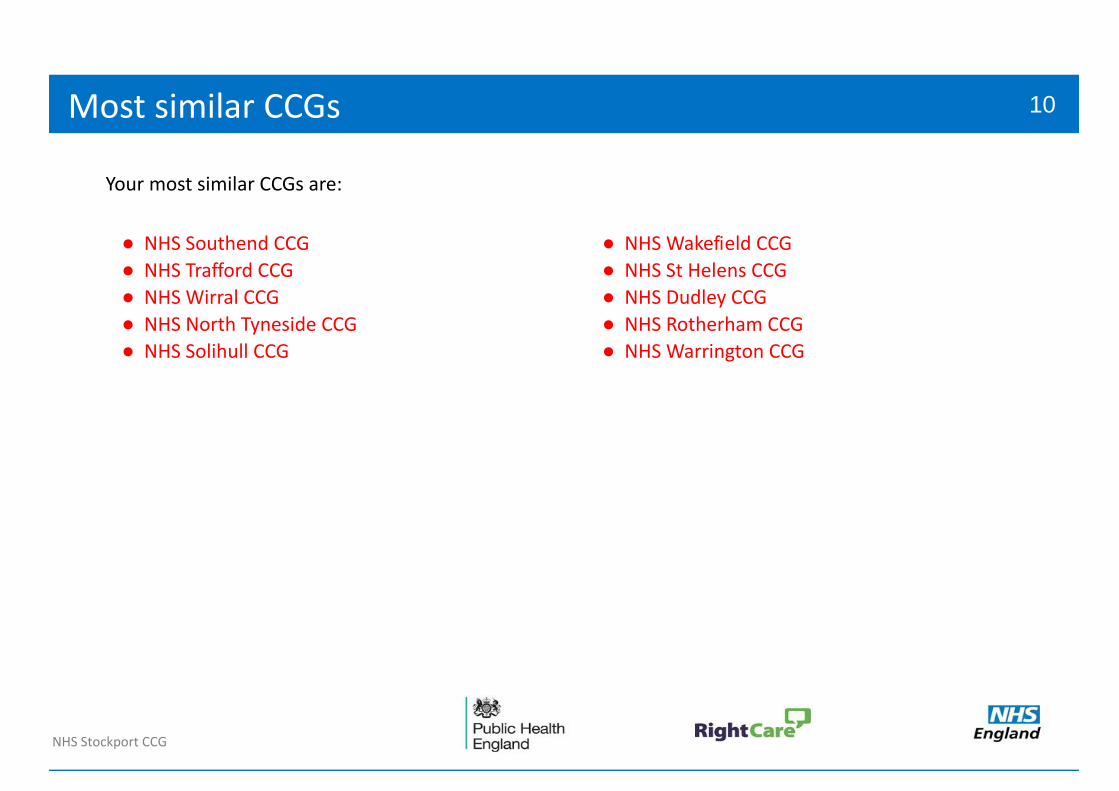
● NHS Southend CCG ● NHS Wakefield CCG
● NHS Trafford CCG ● NHS St Helens CCG
● NHS Wirral CCG ● NHS Dudley CCG
● NHS North Tyneside CCG ● NHS Rotherham CCG
● NHS Solihull CCG ● NHS Warrington CCG
NHS Stockport CCG
Most similar CCGs
Your most similar CCGs are:
10
Most similar LAs
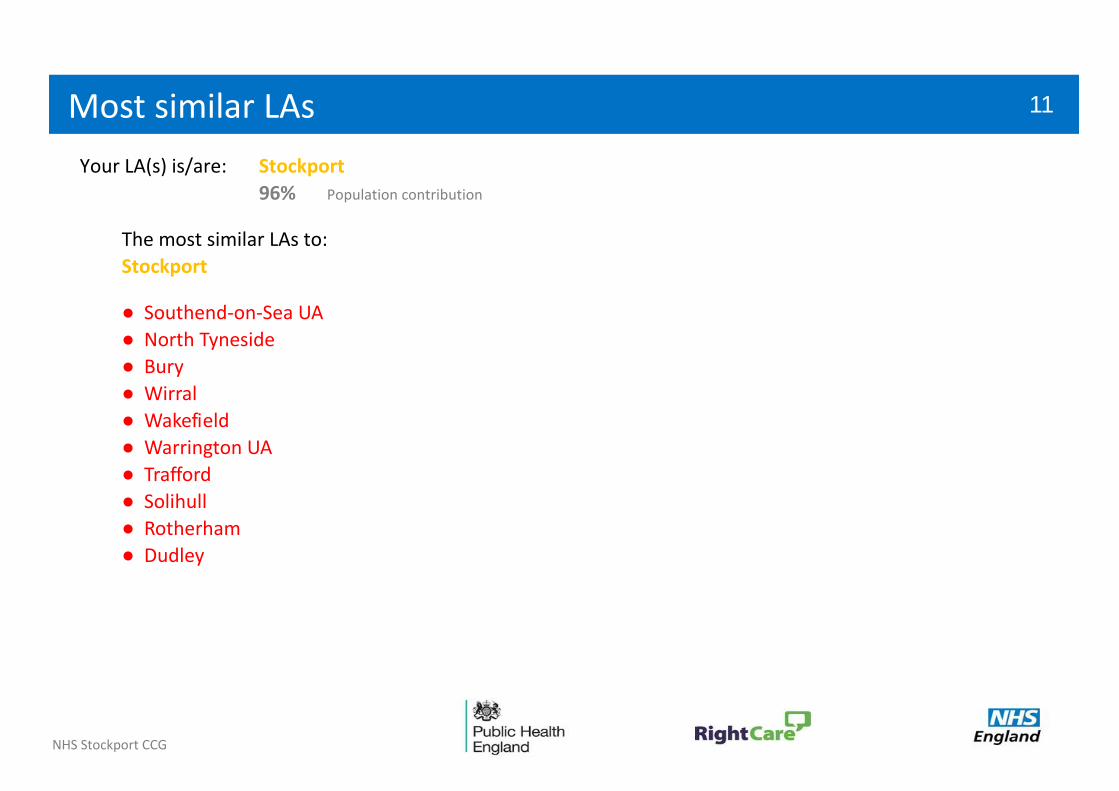
Your LA(s) is/are: Stockport
96% Population contribution
The most similar LAs to:
Stockport
● Southend-on-Sea UA
● North Tyneside
● Bury
● Wirral
● Wakefield
● Warrington UA
● Trafford
● Solihull
● Rotherham
● Dudley
NHS Stockport CCG
Most similar LAs 11
Further Information Links:
http://pathways.nice.org.uk/
NICE Pathways on: ‘Smoking’, ‘Maternal and child nutrition’, ‘Diarrhoea and
vomiting’, ‘Immunisation for children ’ and ‘Unintentional injuries among
under 15s’https://sustain.sharepoint.com/Documents/HCP%20Integrated%20Com%20and%20De
l%20toolkit%20final.pdf
-40%
-20%
0%
20%
40%
60%
80%
<18 conceptionsrate
Flu vaccinetake-up bypregnantwomen
Smoking at timeof delivery
% of lowbirthweight
babies (<2500g)
Breastfeedinginitiation (first
48 hrs)
Breastfeeding atage 6-8 weeks
Infant mortalityrate
Emergencygastroenteritisadmissions rate
for <1s
Emergency LRTIadmissions rate
for <1s
% receiving 3doses of 5-in-1
vaccine by age 2
A&E attendancerate for <5s
Emergencyadmissions rate
for <5s
Unintentional &deliberate injuryadmissions for
<5s
% of childrenaged 4-5 who
are overweightor obese
% receiving 2doses of MMR
vaccine by age 5
Mean numberof decayed,
filled or missingteeth in children
aged 5yrs
% d
iffe
ren
ce f
rom
Sim
ilar
10
LA
s
Better Worse Needs local interpretation
Maternity and Early Years pathway Stockport
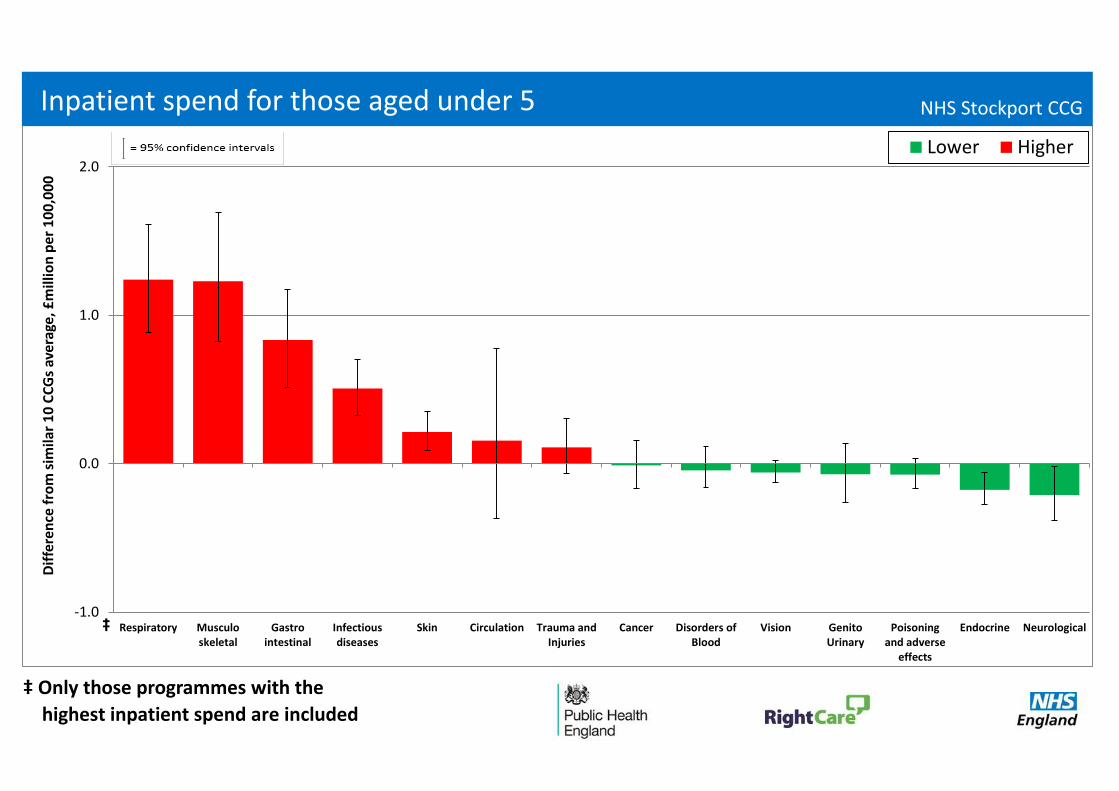
‡ Only those programmes with the
highest inpatient spend are included
-1.0
0.0
1.0
2.0
Respiratory Musculoskeletal
Gastrointestinal
Infectiousdiseases
Skin Circulation Trauma andInjuries
Cancer Disorders ofBlood
Vision GenitoUrinary
Poisoningand adverse
effects
Endocrine Neurological
Dif
fere
nce
fro
m s
imila
r 1
0 C
CG
s av
erag
e, £
mill
ion
pe
r 1
00
,00
0
Lower Higher
Inpatient spend for those aged under 5 NHS Stockport CCG
‡
Further Information Links:
http://pathways.nice.org.uk/pathways/drug-misuse
http://pathways.nice.org.uk/pathways/alcohol-use-disorders
http://fingertips.phe.org.uk/profile-group/mental-health/profile/drugsandmentalhealth
-60%
-40%
-20%
0%
20%
40%
Deprivation % of working ageclaiming job seekersallowance >12 mths
Rate of opiateand/or crack cocaine
use
Admissions formental andbehavioural
disorders due toalcohol
People receivingtreatment at aspecialist drugmisuse service
People receivingtreatment at a
specialist alcoholmisuse service
% of opiate userstreated who did notre-present <6 mths
% of non-opiateusers treated who
did not re-present <6mths
% of alcohol userstreated who did notre-present <6 mths
% in contact withmental health
services when theyaccess drug misuse
services
% in contact withmental health
services when theyaccess alcohol
misuse services
% d
iffe
ren
ce f
rom
Sim
ilar
10
LA
s
Better Worse Needs local interpretation
Substance misuse and mental health pathway Stockport
Further Information Links:
http://pathways.nice.org.uk/pathways/dementia
http://pathways.nice.org.uk/
Click on: ‘Topics’, ’Population Groups’, ‘Older People’
-20%
0%
20%
40%
60%
80%
100%
% of people aged16+ who are
obese
% of people aged16+ classified as
inactive
% of people aged18+ who are
smokers
Rate of alcohol-related
admissions
% of people aged40-74 receiving a
health check
Diabetesprevalence
Depressionprevalence
% of people aged18+ with 3 or
more long termconditions
Dementiadiagnosis rate
Reported toestimated
prevalence ofCHD
Reported toestimated
prevalence ofhypertension
% with a longterm condition
who have awritten care plan
% with a longterm conditionwho use their
written care plan
% of dementiapatients who had
a face-to-facereview
% d
iffe
ren
ce f
rom
Sim
ilar
10
CC
Gs
Better Worse Needs local interpretation
Dementia and LTCs
Risk reduction, detection and primary care management NHS Stockport CCG
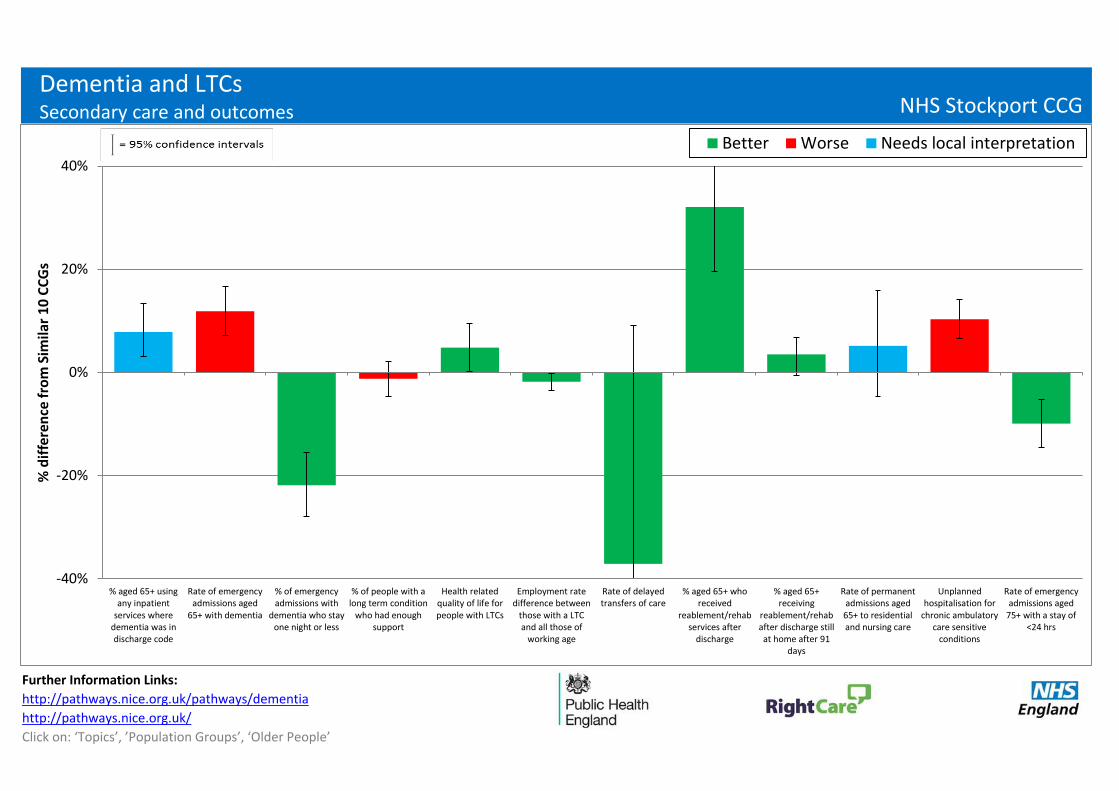
Further Information Links:
http://pathways.nice.org.uk/pathways/dementia
http://pathways.nice.org.uk/
Click on: ‘Topics’, ’Population Groups’, ‘Older People’
-40%
-20%
0%
20%
40%
% aged 65+ usingany inpatient
services wheredementia was indischarge code
Rate of emergencyadmissions aged
65+ with dementia
% of emergencyadmissions with
dementia who stayone night or less
% of people with along term condition
who had enoughsupport
Health relatedquality of life forpeople with LTCs
Employment ratedifference between
those with a LTCand all those of
working age
Rate of delayedtransfers of care
% aged 65+ whoreceived
reablement/rehabservices after
discharge
% aged 65+receiving
reablement/rehabafter discharge stillat home after 91
days
Rate of permanentadmissions aged65+ to residentialand nursing care
Unplannedhospitalisation for
chronic ambulatorycare sensitive
conditions
Rate of emergencyadmissions aged
75+ with a stay of<24 hrs
% d
iffe
ren
ce f
rom
Sim
ilar
10
CC
Gs
Better Worse Needs local interpretation
Dementia and LTCs
Secondary care and outcomes NHS Stockport CCG
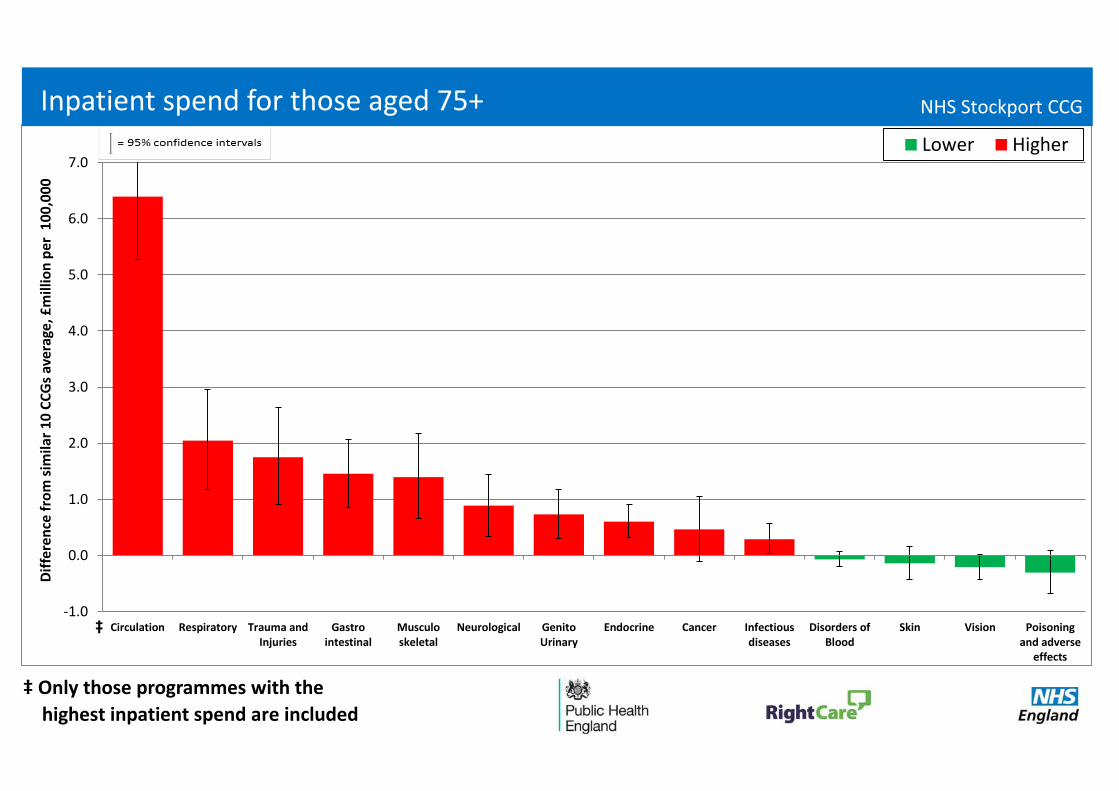
‡ Only those programmes with the
highest inpatient spend are included
-1.0
0.0
1.0
2.0
3.0
4.0
5.0
6.0
7.0
Circulation Respiratory Trauma andInjuries
Gastrointestinal
Musculoskeletal
Neurological GenitoUrinary
Endocrine Cancer Infectiousdiseases
Disorders ofBlood
Skin Vision Poisoningand adverse
effects
Dif
fere
nce
fro
m s
imila
r 1
0 C
CG
s av
erag
e, £
mill
ion
per
10
0,0
00
Lower Higher
‡
Inpatient spend for those aged 75+ NHS Stockport CCG
05L
05P
06F
06H
06M
08Y
10G
10N
10W
99M
99P
99Q
11J
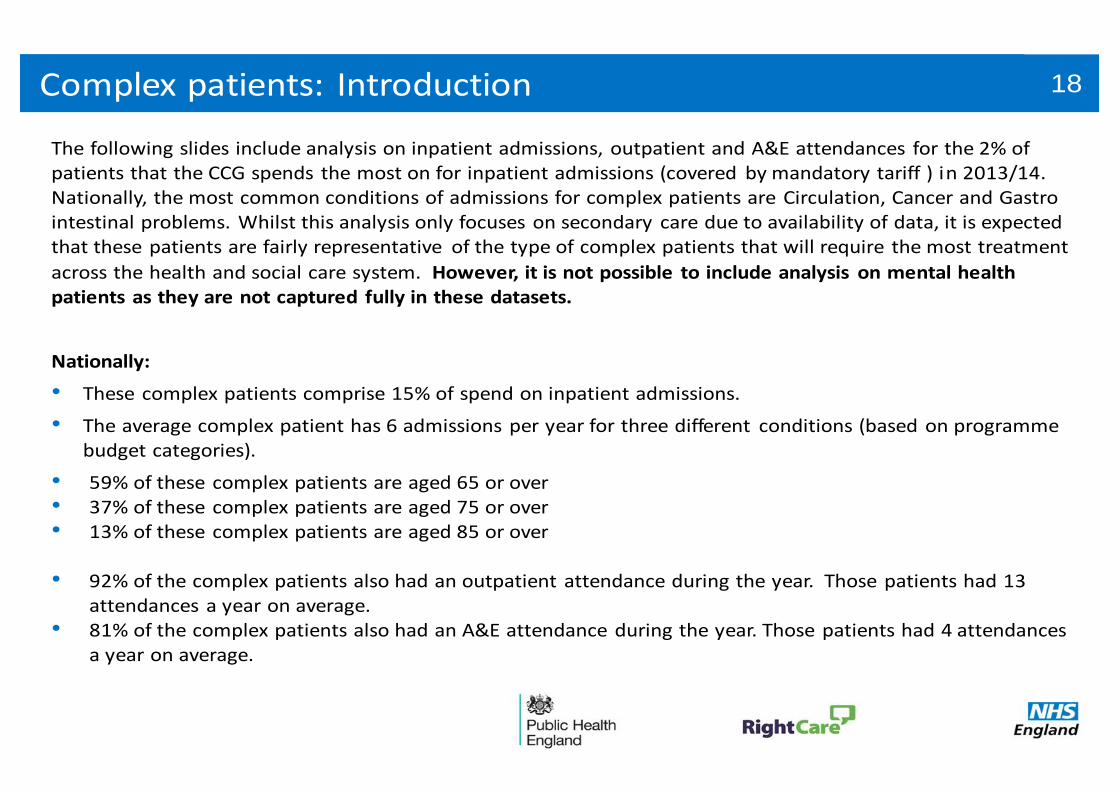
18
The following slides include analysis on inpatient admissions, outpatient and A&E attendances for the 2% of patients that the CCG spends the most on for inpatient admissions (covered by mandatory tariff ) in 2013/14. Nationally, the most common conditions of admissions for complex patients are Circulation, Cancer and Gastro intestinal problems. Whilst this analysis only focuses on secondary care due to availability of data, it is expected that these patients are fairly representative of the type of complex patients that will require the most treatment
across the health and social care system. However, it is not possible to include analysis on mental health patients as they are not captured fully in these datasets.
Nationally:
• These complex patients comprise 15% of spend on inpatient admissions.
• The average complex patient has 6 admissions per year for three different conditions (based on programme budget categories).
• 59% of these complex patients are aged 65 or over• 37% of these complex patients are aged 75 or over• 13% of these complex patients are aged 85 or over
• 92% of the complex patients also had an outpatient attendance during the year. Those patients had 13 attendances a year on average.
• 81% of the complex patients also had an A&E attendance during the year. Those patients had 4 attendances a year on average.
Complex patients: Introduction
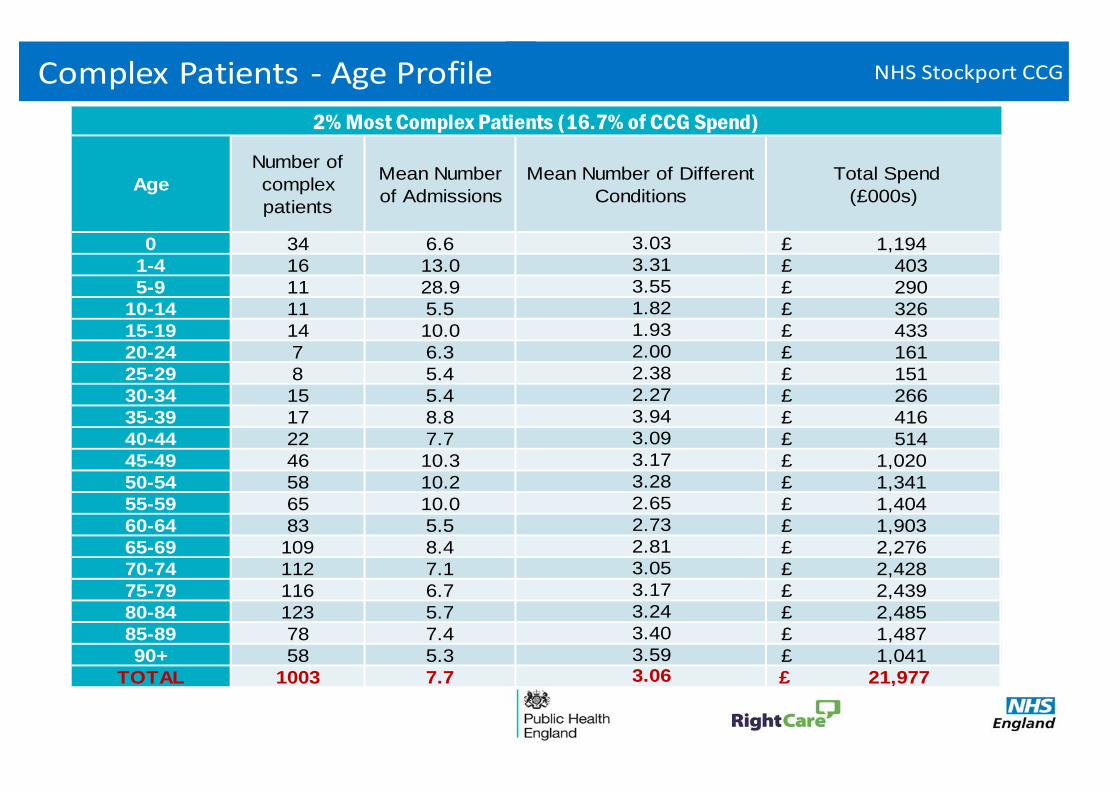
Age
Number of
complex
patients
Mean Number
of Admissions
Mean Number of Different
Conditions
5-9 11 28.9
10-14 11 5.5
0 34 6.6
1-4 16 13.0
25-29 8 5.4
30-34 15 5.4
15-19 14 10.0
20-24 7 6.3
50-54 58 10.2
35-39 17 8.8
40-44 22 7.7
85-89 78 7.4
90+ 58 5.3
75-79 116 6.7
80-84 123 5.7
2.27
3.94
3.09
3.17
Total Spend
(£000s)
2% Most Complex Patients (16.7% of CCG Spend)
TOTAL 1003 7.7
65-69 109 8.4
70-74 112 7.1
55-59 65 10.0
60-64 83 5.5
45-49 46 10.3
3.59 3.06
£ 1,194
£ 403
£ 290
£ 326
£ 433
£ 161
£ 151
3.28
2.65
2.73
2.81
3.05
3.17
3.03
3.31
3.55
1.82
1.93
2.00
2.38
3.24
3.40
£ 1,041
£ 21,977
£ 1,903
£ 2,276
£ 2,428
£ 2,439
£ 2,485
£ 1,487
£ 266
£ 416
£ 514
£ 1,020
£ 1,341
£ 1,404
Complex Patients - Age Profile NHS Stockport CCG
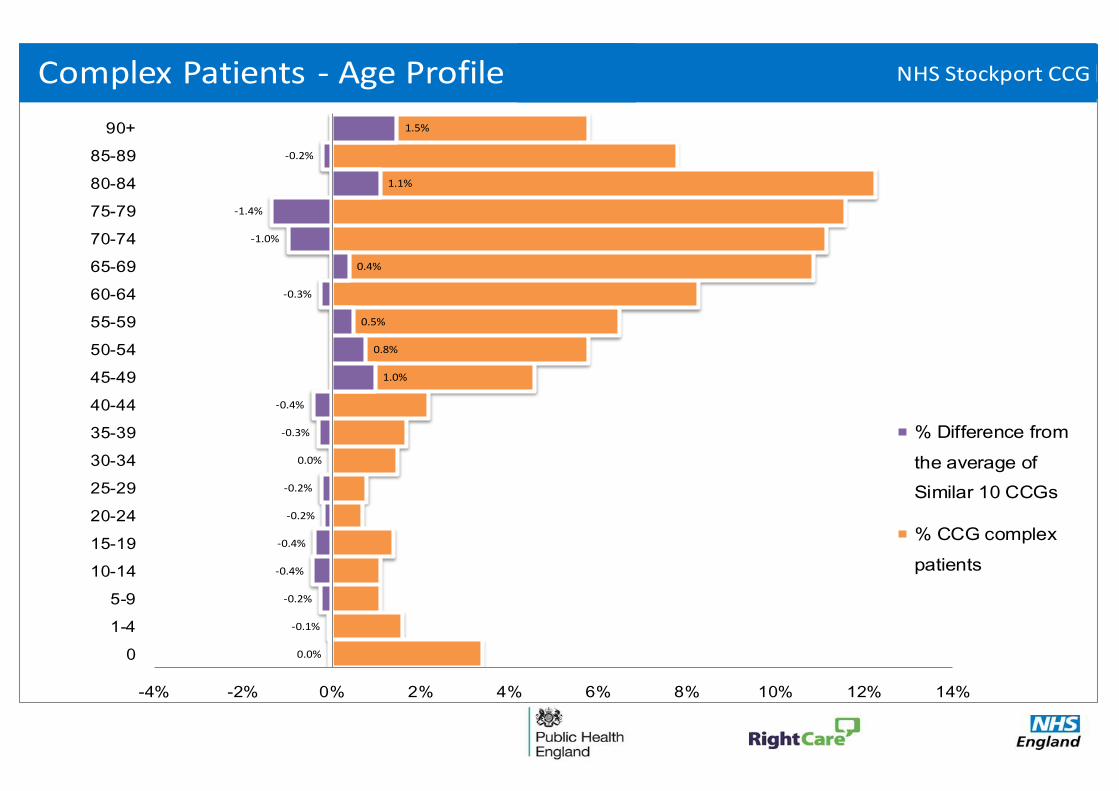
0.0%
-0.1%
-0.2%
-0.4%
-0.4%
-0.2%
-0.2%
0.0%
-0.3%
-0.4%
1.0%
0.8%
0.5%
-0.3%
0.4%
-1.0%
-1.4%
1.1%
-0.2%
1.5%
-4% -2% 0% 2% 4% 6% 8% 10% 12% 14%
0
1-4
5-9
10-14
15-19
20-24
25-29
30-34
35-39
40-44
45-49
50-54
55-59
60-64
65-69
70-74
75-79
80-84
85-89
90+
% Difference from
the average of
Similar 10 CCGs
% CCG complex
patients
Complex Patients - Age Profile NHS Stockport CCG
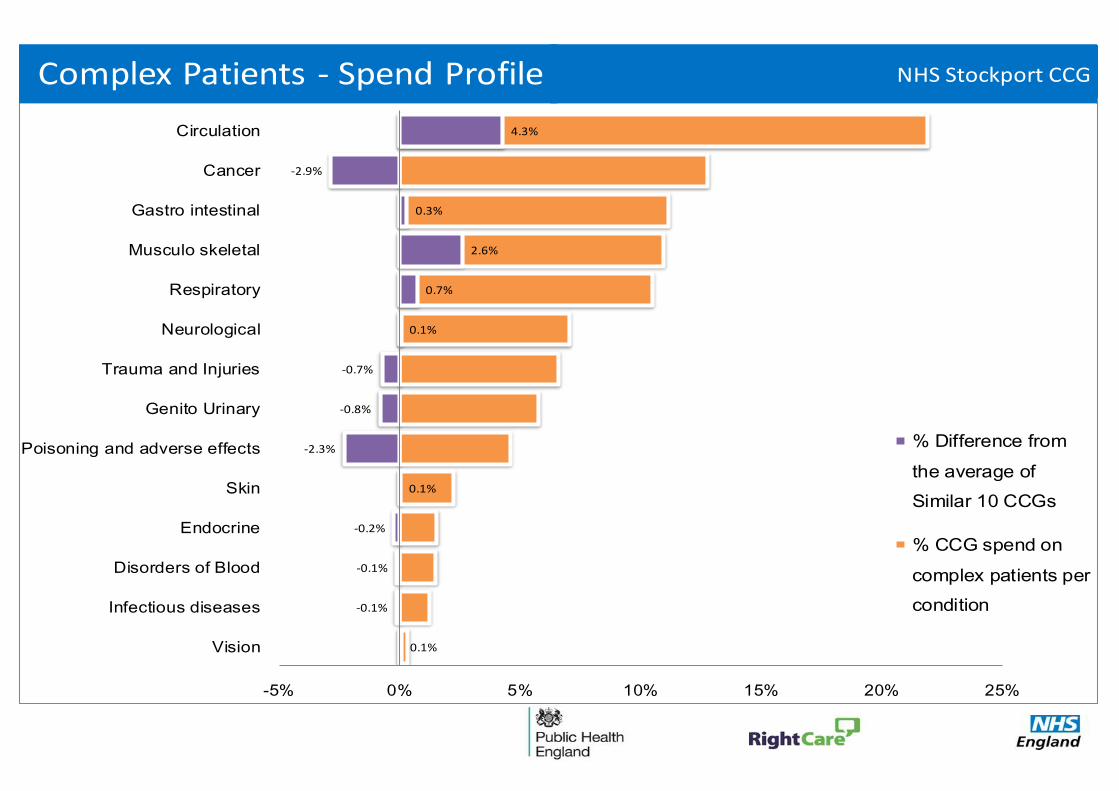
0.1%
-0.1%
-0.1%
-0.2%
0.1%
-2.3%
-0.8%
-0.7%
0.1%
0.7%
2.6%
0.3%
-2.9%
4.3%
-5% 0% 5% 10% 15% 20% 25%
Vision
Infectious diseases
Disorders of Blood
Endocrine
Skin
Poisoning and adverse effects
Genito Urinary
Trauma and Injuries
Neurological
Respiratory
Musculo skeletal
Gastro intestinal
Cancer
Circulation
% Difference from
the average of
Similar 10 CCGs
% CCG spend on
complex patients per
condition
Complex Patients - Spend Profile NHS Stockport CCG
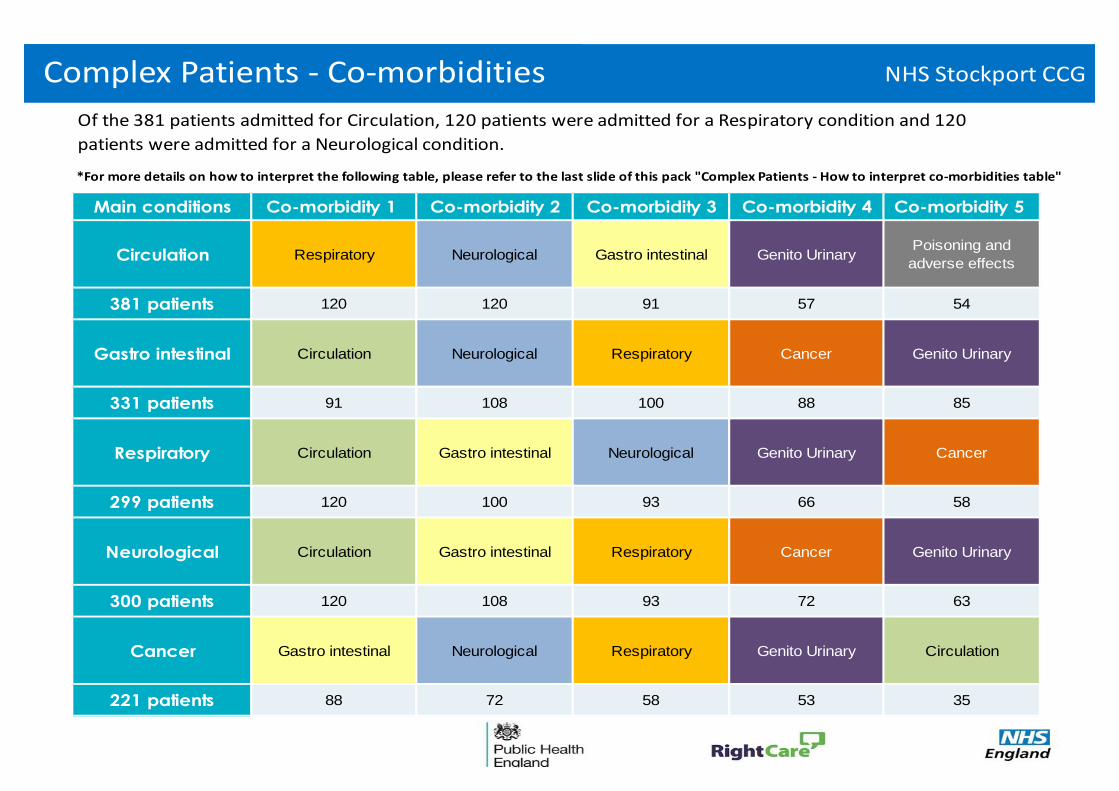
Gastro intestinal
381 patients
Main conditions
Poisoning and
adverse effects
Neurological
299 patients
Respiratory
331 patients
Circulation
Neurological
Respiratory
Gastro intestinal
108
120 54
120
Genito Urinary
Cancer
Genito Urinary
Circulation
Respiratory
85
Circulation
Co-morbidity 2Co-morbidity 1 Co-morbidity 5 Co-morbidity 4Co-morbidity 3
88
Gastro intestinal CirculationRespiratory
221 patients
Cancer
300 patients
Genito Urinary
72 53
Genito Urinary
88
57
Circulation
Respiratory
120
91
Neurological
100
91
Neurological
Neurological
Cancer
120
Genito Urinary
Cancer
Gastro intestinal
108
100
Gastro intestinal
*For more details on how to interpret the following table, please refer to the last slide of this pack "Complex Patients - How to interpret co-morbidities table"
Of the 381 patients admitted for Circulation, 120 patients were admitted for a Respiratory condition and 120
patients were admitted for a Neurological condition.
72
66 58
63
35
93
93
58
Complex Patients - Co-morbidities NHS Stockport CCG
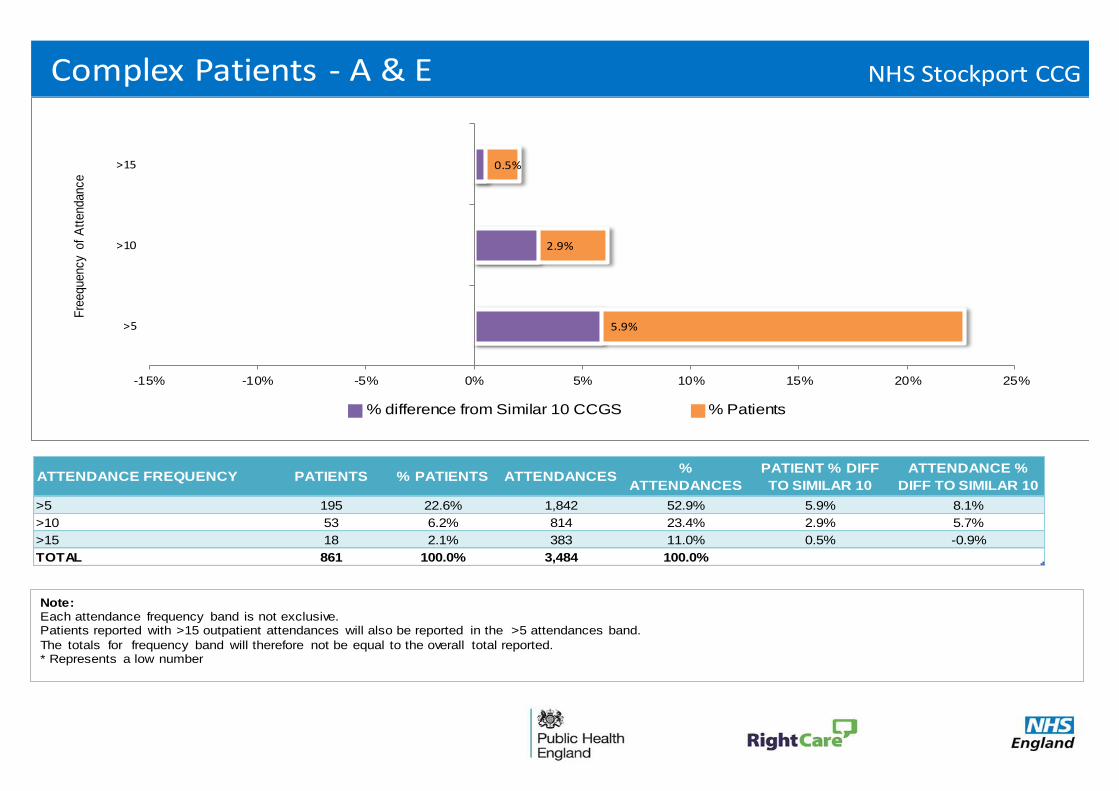
Complex Patients - A & E NHS Stockport CCG
5.9%
2.9%
0.5%
-15% -10% -5% 0% 5% 10% 15% 20% 25%
>5
>10
>15
Fre
equency o
f A
ttendance
Note:Each attendance frequency band is not exclusive. Patients reported with >15 outpatient attendances will also be reported in the >5 attendances band.
The totals for frequency band will therefore not be equal to the overall total reported.* Represents a low number
% difference from Similar 10 CCGS % Patients
ATTENDANCE FREQUENCY PATIENTS % PATIENTS ATTENDANCES%
ATTENDANCES
PATIENT % DIFF
TO SIMILAR 10
ATTENDANCE %
DIFF TO SIMILAR 10
>5 195 22.6% 1,842 52.9% 5.9% 8.1%
>10 53 6.2% 814 23.4% 2.9% 5.7%
>15 18 2.1% 383 11.0% 0.5% -0.9%
TOTAL 861 100.0% 3,484 100.0%
1
2
3
4
5
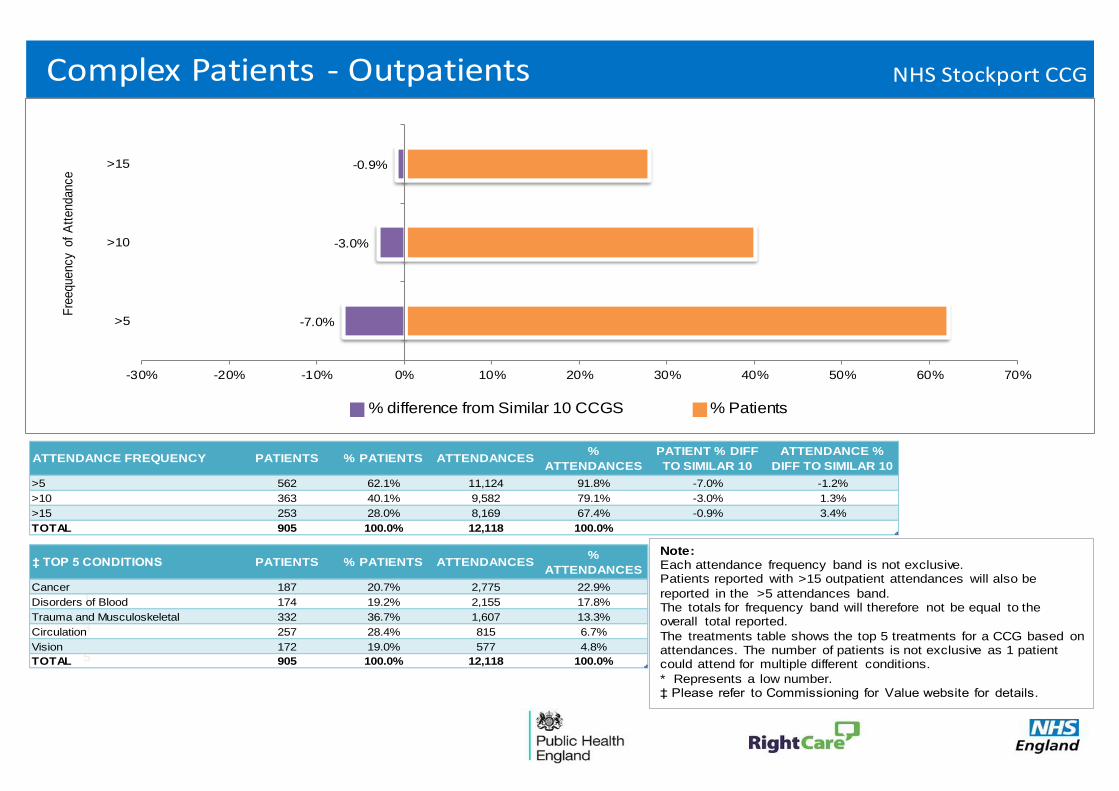
Complex Patients - Outpatients NHS Stockport CCG
-7.0%
-3.0%
-0.9%
-30% -20% -10% 0% 10% 20% 30% 40% 50% 60% 70%
>5
>10
>15
Fre
equency o
f A
ttendance
Note:Each attendance frequency band is not exclusive. Patients reported with >15 outpatient attendances will also be
reported in the >5 attendances band.The totals for frequency band will therefore not be equal to the overall total reported.
The treatments table shows the top 5 treatments for a CCG based on attendances. The number of patients is not exclusive as 1 patient could attend for multiple different conditions.
* Represents a low number.‡ Please refer to Commissioning for Value website for details.
% difference from Similar 10 CCGS % Patients
ATTENDANCE FREQUENCY PATIENTS % PATIENTS ATTENDANCES%
ATTENDANCES
PATIENT % DIFF
TO SIMILAR 10
ATTENDANCE %
DIFF TO SIMILAR 10
>5 562 62.1% 11,124 91.8% -7.0% -1.2%
>10 363 40.1% 9,582 79.1% -3.0% 1.3%
>15 253 28.0% 8,169 67.4% -0.9% 3.4%
TOTAL 905 100.0% 12,118 100.0%
‡ TOP 5 CONDITIONS PATIENTS % PATIENTS ATTENDANCES%
ATTENDANCES
Cancer 187 20.7% 2,775 22.9%
Disorders of Blood 174 19.2% 2,155 17.8%
Trauma and Musculoskeletal 332 36.7% 1,607 13.3%
Circulation 257 28.4% 815 6.7%
Vision 172 19.0% 577 4.8%
TOTAL 905 100.0% 12,118 100.0%
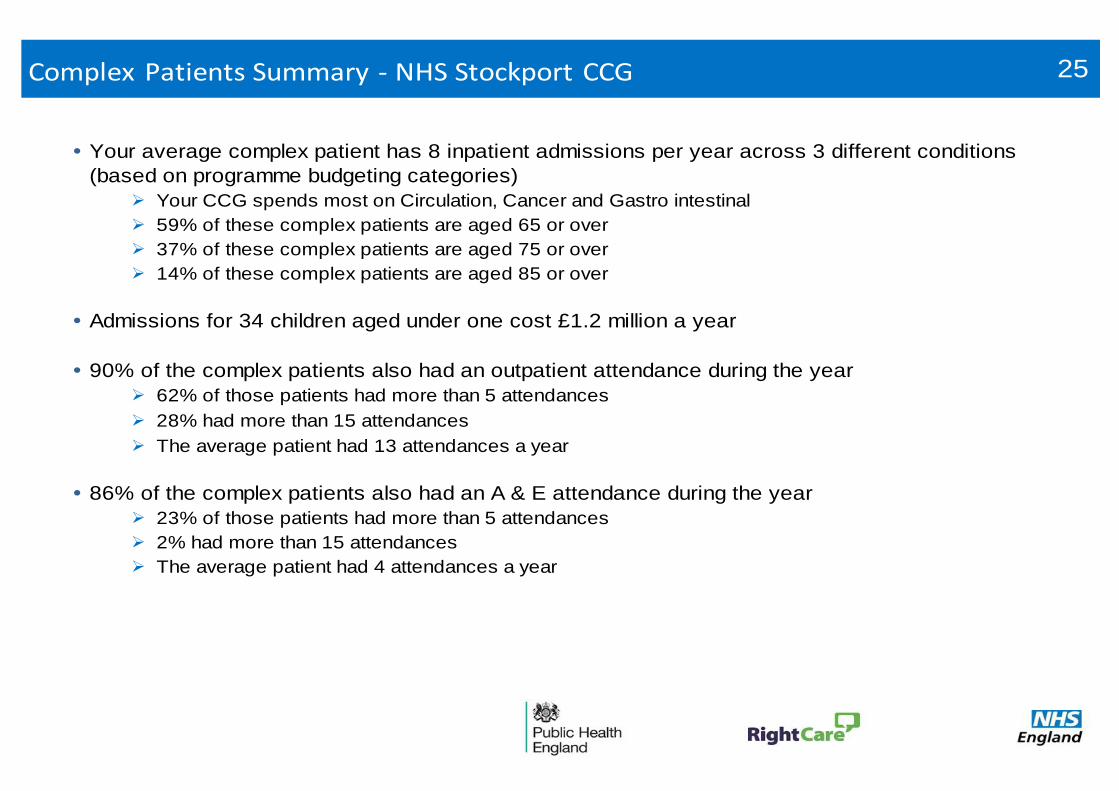
• Your average complex patient has 8 inpatient admissions per year across 3 different conditions
(based on programme budgeting categories)
Your CCG spends most on Circulation, Cancer and Gastro intestinal
59% of these complex patients are aged 65 or over
37% of these complex patients are aged 75 or over
14% of these complex patients are aged 85 or over
• Admissions for 34 children aged under one cost £1.2 million a year
• 90% of the complex patients also had an outpatient attendance during the year
62% of those patients had more than 5 attendances
28% had more than 15 attendances
The average patient had 13 attendances a year
• 86% of the complex patients also had an A & E attendance during the year
23% of those patients had more than 5 attendances
2% had more than 15 attendances
The average patient had 4 attendances a year
25Complex Patients Summary - NHS Stockport CCG
NHS Stockport CCG
01C
01D
01E
01F
01G
01H
01J
01K
01M
01N
01R
01T
01V
01W
01X
02A
NHS Stockport CCG
Complex patients: Case Study – Wigan Borough CCG • Wigan Borough CCG adopted the RightCare approach in 2012. They identified the need to target their
most complex care patients and highest users of services.
• The CCG developed a risk stratification tool, based on the Blackpool model, and localised it for use in Wigan’s primary and community care sectors.
• The tool identified the optimal opportunities to improve patient care and well-being for individual high users of NHS services.
• The local GP community embraced the aim of the improvement programme and began to target support
to the individuals that the risk tool highlighted.
• As a consequence, 6,000 more residents of Wigan are now actively supported with care plans and case management. Most of these were previously extensive users of the urgent care part of Wigan’s healthcare system.
• The next phase of the programme is to specify the optimal care plan and clinical guidelines to support
this. This will ensure that all 6,000, and more in time, always receive the best care possible wherever they are in the system, and reduce unnecessary variation.
• The above reform can be replicated locally, including primary, community and social care involvement
to ensure integration.
26
Identifying opportunities to improve population health
03D
03E
03F
03G
03H
03J
03K
03L
03M
03N
03R
03T
03V
03W
03X
03Y
NHS Stockport CCG
Identifying opportunities to improve population health
CCGs and Local Authorities may wish to consider the following next steps:
Tease out the questions that this pack raises across the health and social care system
• What role could prevention play in improving outcomes?
• Is there evidence of unmet need, e.g. recorded to estimated prevalence indicators, high emergency admissions?
• Are there opportunities for secondary prevention within primary, secondary and social care?
• Do current plans (including Better Care Fund) and service provision take account of these opportunities?
• Is there a role for ‘joined up’ commissioning across the system or integrated services
Triangulate the intelligence in this pack with other sources
• Look at the pathways on a page packs which will tell you more about the prevention of long term conditions in your CCG
• Look at your Joint Strategic Needs Assessment
• Consider local intelligence about use of commissioned services – for example is the population with greatest need accessing preventative services?
27
The NHS RightCare approach - Next steps
05F
05G
05H
05J
05N
05Q
05R
05T
05V
05W
05X
05Y
06A
06D
06K
06L
NHS Stockport CCG
The NHS RightCare approach - Next steps
CCGs may wish to consider the following next steps:
• Identify the priority programmes and complex patients in your locality and compare with current reform activity and improvement plans
• Engage with clinicians and other local stakeholders, including public health teams in local authorities and commissioning support organisations
• Link with the planning round and discuss at governing body and Health and Wellbeing Board level: Design optimal system – make case – decide – deliver
• Explore the Commissioning for Value online tool at http://ccgtools.england.nhs.uk/cfv/flash/atlas.html and compare your data with that of your peers. Re-visit regularly to explore the updates
• Explore other resources, such as the ‘how to’ videos, CVD Intelligence Network focus pack and NICE resources. See the NHS Right Care website at http://www.rightcare.nhs.uk/ for links
• Commission a deep dive pack. If CVD is a priority area, use the CVD focus packs at http://www.yhpho.org.uk/default.aspx?RID=199884 otherwise, commission local packs
• Identify local support to move on to phase 2 of the NHS Right Care approach: What to Change. Work with local transformation teams to support and deliver service redesign, as captured in the principles of phase 3 of the NHS Right Care approach: How to Change
28
Commissioning for Value workshops
07R
07T
07V
07W
07X
07Y
08A
08C
08D
08E
08F
08G
08H
08J
08K
08L
NHS Stockport CCG
To support CCGs and local partners to use and understand their packs to their maximum benefit, NHS England, NHS Right Care and Public Health England are holding a series of regional workshops throughout March.
Numbers at each event are limited. Please book your place online using the links below.
Each event will bring together CCGs, health and wellbeing boards, local government, public health teams, commissioning support services, intelligence networks, NICE and area teams. The events will:
• give CCGs an opportunity to discuss their pack findings with experts and their local health communities;
• enable delegates to hear from quality and transformation leaders about the benefits of value-based commissioning; and
• showcase real life examples of the Commissioning for Value model delivering improvement and financial sustainability.
The full-day workshops will be held on:
• Tuesday 10 March in Leeds. Click http://www.events.england.nhs.uk/all/382 for more information
• Wednesday 11 March in London. Click http://www.events.england.nhs.uk/all/383 for more information
• Tuesday 17 March in Birmingham. Click http://www.events.england.nhs.uk/all/381 for more information
• Wednesday 18 March in Basingstoke. Click http://www.events.england.nhs.uk/all/380 for more information
• Tuesday 24 March in Manchester. Click http://www.events.england.nhs.uk/all/384 for more information
Commissioning for Value workshops 29
Further support and information
09J
09L
09N
09P
09W
09X
09Y
10A
10C
10D
10E
10H
10J
10K
10L
10M
NHS Stockport CCG
Further support and information
The Commissioning for Value benchmarking tool, full details of all the data used, and links to other useful tools are available online at: http://www.england.nhs.uk/resources/resources-for-ccgs/comm-for-value/
The NHS Right Care website offers resources to support CCGs in adopting the Commissioning for Value approach. These include:
• Online videos and ‘how to’ guides
• Case studies with learning from other CCGs
• Tried and tested process templates (coming soon)
• Advice on how to produce ‘deep dive’ packs locally (coming soon)
These can be found at: http://www.rightcare.nhs.uk/index.php/commissioning-for-value/
The NHS England Learning Environment which includes a directory of support offers; a case study pinboard; and a peer-to-peer learning exchange can be found at: https://learnenv.england.nhs.uk/
If you have any questions or require any further information or support you can email the Commissioning for Value support team direct at: [email protected]
30
Annex: Full list of indicators
12D
12F
13P
99A
99C
99D
99E
99F
99G
99H
99J
99K
99N
00K
00M
00Q
00R
01Y
02N
03Q
04K
04R
05A
05L
05P
06F
06H
06M
08Y
10G
10N
10W
NHS Stockport CCG
Annex: Full list of indicators 31
Annex: Full list of indicators (continued)
NHS Stockport CCG
Annex: Full list of indicators (continued) 32
Annex: Full list of indicators (continued)
NHS Stockport CCG
Annex: Full list of indicators (continued) 33
Complex Patients - How to interpret co-morbidities table
NHS Stockport CCG
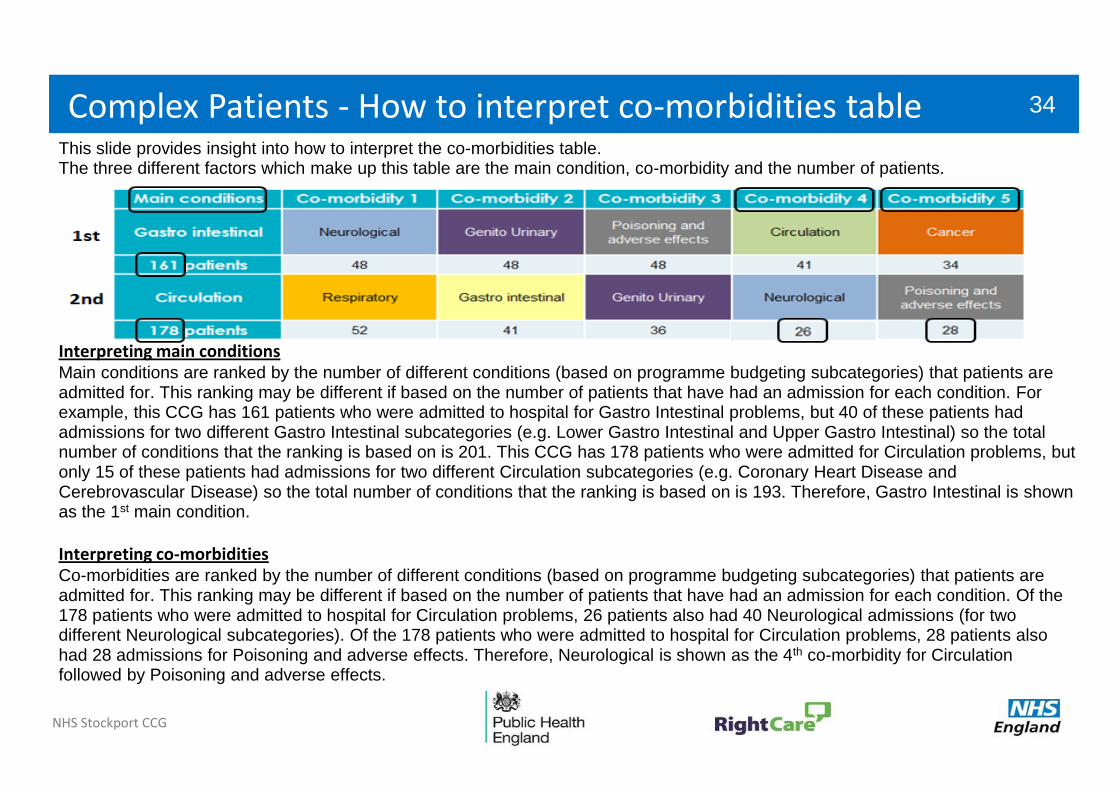
This slide provides insight into how to interpret the co-morbidities table. The three different factors which make up this table are the main condition, co-morbidity and the number of patients.
Complex Patients - How to interpret co-morbidities table 34
Interpreting main conditions Main conditions are ranked by the number of different conditions (based on programme budgeting subcategories) that patients are admitted for. This ranking may be different if based on the number of patients that have had an admission for each condition. For example, this CCG has 161 patients who were admitted to hospital for Gastro Intestinal problems, but 40 of these patients had admissions for two different Gastro Intestinal subcategories (e.g. Lower Gastro Intestinal and Upper Gastro Intestinal) so the total number of conditions that the ranking is based on is 201. This CCG has 178 patients who were admitted for Circulation problems, but only 15 of these patients had admissions for two different Circulation subcategories (e.g. Coronary Heart Disease and Cerebrovascular Disease) so the total number of conditions that the ranking is based on is 193. Therefore, Gastro Intestinal is shown as the 1st main condition.
Interpreting co-morbidities Co-morbidities are ranked by the number of different conditions (based on programme budgeting subcategories) that patients are admitted for. This ranking may be different if based on the number of patients that have had an admission for each condition. Of the 178 patients who were admitted to hospital for Circulation problems, 26 patients also had 40 Neurological admissions (for two different Neurological subcategories). Of the 178 patients who were admitted to hospital for Circulation problems, 28 patients also had 28 admissions for Poisoning and adverse effects. Therefore, Neurological is shown as the 4th co-morbidity for Circulation followed by Poisoning and adverse effects.