Neil Wallace The Centennial A Stable Phillips Curve .../media/files/pubs/region/13-12/... · A...
34
Published Quarterly by the Federal Reserve Bank of Minneapolis December 2013 Neil Wallace The Centennial A Stable Phillips Curve? Research Digest: Quid Pro Quo in China Careers, Firms & Earnings
Transcript of Neil Wallace The Centennial A Stable Phillips Curve .../media/files/pubs/region/13-12/... · A...

Published Quarterly by the Federal Reserve Bank of Minneapolis
December 2013
Neil Wallace
The Centennial
A Stable Phillips Curve?
Research Digest:Quid Pro Quo in China
Careers, Firms & Earnings

Volume 27 Number 4December 2013ISSN 1045-3369
Executive Editor: Kei-Mu YiSenior Editor: David FettigEditor: Douglas ClementManaging Editor: Jenni C. SchoppersSenior Writer: Phil DaviesDesigners: Rick Cucci, Lori Korte, Mark Shafer
The RegionFederal Reserve Bank of MinneapolisP.O. Box 291Minneapolis, MN 55480-0291
Email: [email protected]: minneapolisfed.org
The Region is published by the Federal Reserve Bank of Minneapolis. The views expressed here are not necessarily those of the Federal Reserve Bank of Minneapolis or the Federal Reserve System. Articles may be reprinted if the source is credited and the Public Affairs Department of the Minneapolis Fed is provided with copies. Permission to photocopy is unrestricted.
Cover photograph by Peter Tenzer
The Region
2 Ninth District Notes Fed marks 100 years Narayana Kocherlakota
4 Is There a Stable Phillips Curve After All?Regional analysis suggests a consistent inflation-unemployment trade-offTerry Fitzgerald, Brian Holtemeyer and Juan Pablo Nicolini
12 Interview with Neil WallaceDouglas Clement
26 Research DigestTech Capital Transfers & Chinese MarketsLearning and Earning in FirmsThomas Holmes, Ellen McGrattan and Edward Prescott
Phil Davies
33 Virtual FedJoe Mahon
In the absence of central bank response to local conditions, a regional shock that affects unemployment in just a single region can therefore help identify the existence and size of a structural relationship between current labor market conditions and future inflation.
Regional shocks make inflation rates and unemployment rates vary across regions. To simplify, we assume that regionsare the same for the most part, but each faces different local disturbances, or shocks.
2010 Unemployment / Inflation
New York8.7 / 1.4
Philadelphia8.7 / 1.4
Boston7.2 / 0.6
Detroit13 / 0.6
Kansas City8.7 / 1.7
Milwaukee8.2 / 2.7
Minneapolis7.0 / 1.4
St. Louis9.5 / 2.5
Atlanta10 / 0.8Dallas
8.1 / -0.1
Houston8.4 / 1.8
Miami11 / 0.7
Tampa12 / 1.3
Baltimore6.2 / 1.3
Denver9.0 / 2.0
Los Angeles12 / 0.8
Phoenix9.5 / 0.4
Portland10 / 0.9
San Diego11 / 1.2
San Francisco10 / 1.1
Seattle9.4 / 0.3
Cleveland8.5 / 2.0
Cincinnati9.2 / 1.5
Chicago9.7 / 0.8
Pittsburgh7.3 / 1.2
Anchorage6.7 / 1.0
Honolulu5.7 / 1.7
S O U R C E : B U R E A U O F L A B O R S TAT I S T I C S

DECEMBER 2013
Fed Marks 100 Years
2
N I N T H D I S T R I C T
Narayana Kocherlakota
PresidentFederal Reserve Bank of Minneapolis
One hundred years ago, on Dec. 23, 1913, President Woodrow Wilson signed the Federal Reserve Act into law. There is something about the century mark that causes people to pause and review. In the case of the Federal Reserve, for example, people might wonder why Congress created the institution in the first place. Or they might wonder how the Fed evolved into the System we have today. Or perhaps more importantly, they might speculate about pos-sible changes to the System in the future.
All of these questions, and the discussions that ensue, are exactly what the Federal Reserve hopes to promote in 2014 and on into the next 100 years. This spirit of discussion and education is the driving force behind regional and national efforts to com-memorate the System’s centennial.
For their part, the 12 Federal Reserve Banks and the Board of Governors in Washington, D.C., have worked together to develop a new website dedicated to Federal Reserve history [federalreservehistory.org]. The site takes a look at Fed history through key events and people, including a comprehensive timeline, as well as through a discussion of the cen-tral bank’s purpose. Essays, pictures and videos—in addition to links to numerous resources—make this new website an important contribution to under-standing the history of the Federal Reserve. I en-courage you to visit the site and to return often, as information will be added in the future. This effort is not intended as a static attempt to define the past, but rather as an ongoing dynamic educational tool.
Here at the Federal Reserve Bank of Minneapo-lis, we are also commemorating the Fed’s centennial by expanding our efforts to connect with the Ninth District. For example, while I often take a number of trips throughout the district during the course of a year, I will be visiting all six of our states in 2014.
While traveling in 2014, I will meet with the pub-lic in a number of formats, including speeches with question-and-answer sessions and small group dis-cussions with people from all walks of life. I have participated in many of these events since becom-ing president of the Minneapolis Fed over four years ago, and people are always eager to talk about what the Fed is doing and what it plans to do about a host of issues. That focus on the present and the future is, for me, the key meaning of commemorating the Fed’s centennial. I greatly look forward to these coming visits.
But I am not the only Minneapolis Fed em-ployee reaching out to Ninth District constituents this coming year. We have initiated a series of pub-lic meetings with senior Minneapolis Fed officials on topics ranging from bank regulation to financial payments. Known as “Conversations with the Fed,” these events are listed on our website [minneapolisfed.org/news_events/events/conversa tions/index.cfm], and we encourage you to attend and join in the discussions. In addition, we are expanding our tour program to offer more opportu-nities for school and civic groups, as well as members of the public, to visit the Bank and learn more about the Federal Reserve.
I often tell people that one of the most gratifying elements of being president of the Federal Reserve Bank of Minneapolis is the interest that citizens have in their central bank. I expect—and hope!—that your interest will grow during the Fed’s centennial year, and I look forward to continuing our discus-sion about the role of the Federal Reserve. R

DECEMBER 20133
ExplorE100 yEars of
fEd History
More
than
11,000
artifactsBiographies
videos
and
photos
essaYs on
KeY events
in our historY
Visit federalreservehistory.org to lEarn morE
visit federalreservehistory.org to learn more

* The authors thank Narayana Kocherlakota for asking the question that led to this research and Sam Schulhofer-Wohl for comments. All errors are the authors’.
Economic Policy Papers are based on policy-oriented research by Minneapolis Fed staff and consultants. The papers are an occasional series for a general audience. Views expressed are those of the authors, not necessarily of others in the Federal Reserve System.
ABSTRACT
The Phillips curve refers to a negative (or inverse) re-lationship between unemployment and inflation in an economy—when unemployment is high, inflation tends to be low, and vice versa. This inflation-unemployment link has been observed in many countries during many times, most famously by William Phillips in 1958 looking at historical data for the United Kingdom. If this relation-ship is stable (or “structural”)—meaning that it holds regardless of changes in the economic environment, in-cluding policy adjustment—then policymakers might be able to trade off increases in inflation to achieve lower unemployment, or the inverse.
However, research over the past 40 years has thrown a great deal of doubt onto whether a stable Phillips curve relationship exists. Economists have documented large changes over time in the relationship between un-employment and inflation. In addition, theoretical work has shown that the existence of an empirical associa-tion does not necessarily mean that policymakers can exploit that relationship; there may be a statistical cor-relation—but not a causal link—between inflation and unemployment.
In this essay, we revisit the stability of the Phillips curve. Our key insight is that if the analysis incorporates a central bank seeking to stabilize inflation, national data are likely to provide little information about the existence (or absence) of a stable relationship. We show that regional data can overcome this obstacle. While es-timates of Phillips curves using national U.S. data are highly unstable over the past 40 years, we find that esti-mates based on regional data are remarkably stable. Our results suggest that a 1-percentage-point-lower unem-ployment rate is associated with higher inflation of 0.3 percentage points over the next year, and the stability of the relationship suggests that it might provide a viable tool for policymakers
Is There a Stable Phillips Curve After All?
Regional analysis suggests a consistent inflation-unemployment trade-off
Terry Fitzgerald*Federal Reserve Bank of Minneapolis
Brian HoltemeyerFederal Reserve Bank of Minneapolis
Juan Pablo NicoliniFederal Reserve Bank of Minneapolis
IntroductionThe Federal Reserve has been given a dual man-date by Congress in its conduct of monetary policy: Pursue price stability and maximum employment. Similar inflation and employment goals are common among central banks worldwide. On the price stabil-ity mandate, the performance of the Federal Reserve since the early 1990s has been remarkably successful. Over the past 20 years, U.S. inflation has averaged 1.9 percent per year, with a maximum 12-month rate of 4.2 percent and a minimum of -1.2 percent. If food and energy components (typically quite volatile) are excluded, inflation has run between 1 percent and 2.9 percent throughout this period.
That central banks can play a central role in affect-ing prices is widely accepted, but whether monetary policy has a reliable influence on employment is much more controversial. Work on the relationship between inflation and unemployment dates back to Irving Fisher in 1926, who documented a statistical relationship using data from the United States. The topic attracted much more attention when William Phillips published research in 1958 showing a nega-tive relationship between unemployment and the
DECEMBER 2013 4

In the absence of central bank response to local conditions, a regional shock that affects unemployment in just a single region can therefore helpidentify the existence and size of a structural relationship between current labor market conditions and future inflation.
Regional shocks make inflation rates and unemployment rates vary across regions. To simplify, we assume that regionsare the same for the most part, but each faces different local disturbances, or shocks.
2010 Unemployment / Inflation
New York8.7 / 1.4
Philadelphia8.7 / 1.4
Boston7.2 / 0.6
Detroit13 / 0.6
Kansas City8.7 / 1.7
Milwaukee8.2 / 2.7
Minneapolis7.0 / 1.4
St. Louis9.5 / 2.5
Atlanta10 / 0.8Dallas
8.1 / -0.1
Houston8.4 / 1.8
Miami11 / 0.7
Tampa12 / 1.3
Baltimore6.2 / 1.3
Denver9.0 / 2.0
Los Angeles12 / 0.8
Phoenix9.5 / 0.4
Portland10 / 0.9
San Diego11 / 1.2
San Francisco10 / 1.1
Seattle9.4 / 0.3
Cleveland8.5 / 2.0
Cincinnati9.2 / 1.5
Chicago9.7 / 0.8
Pittsburgh7.3 / 1.2
Anchorage6.7 / 1.0
Honolulu5.7 / 1.7
S O U R C E : B U R E A U O F L A B O R S TAT I S T I C S

growth rate of nominal wages—the Phillips curve. The importance of this relationship for the de-
sign of monetary policy is clear: If the relationship between unemployment and inflation is structural (meaning it is stable regardless of changes in the economic environment, such as changes in mon-etary policy), it justifies active monetary policy that reduces some fluctuations in employment and pro-vides a tool by which the Federal Reserve can pur-sue its employment mandate.
We emphasize if because there has been consid-erable debate over the past 40 years over whether the Phillips curve relationship is truly structural. Research against this claim includes the fact that es-timates of the relationship between unemployment and inflation are sensitive to the time period and monetary policy regime. For example, the relation-ship in postwar U.S. data changes substantially de-pending on the period analyzed (see, for example, Atkeson and Ohanian 2001, and Fisher, Liu and Zhou 2002).
In addition, the approach to monetary policy also appears to have changed substantially. For example, when unemployment and inflation both rose dramatically during the 1970s, Federal Reserve Chair Paul Volcker instituted a new policy regime calling for substantial interest rate hikes, resulting in a decline in inflation.
On the theoretical side, research has shown that observed relationships in the data do not imply sta-ble, exploitable relationships by policymakers. In a highly influential 1972 paper, Robert Lucas argued that because people are aware of policy changes, any such changes will affect their expectations for the future. If a central bank changes its policy, there-fore, firms and households may well adjust their economic behavior, thereby disrupting observed past relationships in the data (and possibly render-ing ineffective the newly implemented policy).
This policy paper makes two central points.
• First, we show that including a central bank that aims to stabilize inflation into the analysis has dramatic implications for understanding the Phillips curve. It implies that national data on inflation and unemployment provide little in-formation about whether a structural relation-ship exists. In fact, our theory predicts that the
relationship will appear unstable as policy goals change, even if a structural relationship exists.
• Second, we show that a remarkably stable rela-tionship between unemployment and inflation emerges when regional, rather than national, data are analyzed, because less-aggregated data allow the analysis to address complica-tions raised by changes in monetary policy. Our results show that a 1-percentage-point-lower unemployment rate is associated with a higher inflation rate of roughly 0.3 percentage points over the next year. The stability of this relationship suggests that it might indeed be exploitable by policymakers.
Instability of the U.S. Phillips curveThe relationship between inflation and unemploy-ment over the past 40 years has not been stable in the United States in the sense that it varies widely depending on the time period analyzed. The stan-dard procedure for examining this relationship is a statistical analysis of the relationship between cur-rent unemployment and future inflation. Research-ers use many different formulations of the Phillips curve, varying by the specific data and functional forms used and the time horizon. In Table 1, we report the estimated unemployment coefficient—meaning the amount by which future inflation is predicted to change given a specific change in cur-rent employment—of four typical versions over four different time periods. Specifics can be found in Fitzgerald and Nicolini (2013).
Note that the coefficient for each version is sub-
DECEMBER 2013 6
Table 1Estimated unemployment coefficients at national level
Four models and four time periods
U.S. PHILLIPS CURVES 1977-1984 1985-1990 1991-2000 2001-2010
Version 1 -1.81** -1.47** 0.04 -0.26
Version 2 -0.47 -0.62 -0.30 0.36
Version 3 -1.10* -0.14 0.23 -1.21**
Version 4 -1.04 -0.84 -0.58 -0.55
Notes: “Unemployment coefficient” interpretation varies by version. For Version 1, it is the percentage point amount by which inflation over the next year is predicted to change given a 1-percentage-point change in the current unemployment rate.
The indicators * and ** mean statistically significant at the 5 percent level and 1 percent level, respectively.

stantially different in each time period. For exam-ple, in Version 1, the 1977-1984 coefficient found in national data is -1.81, which in this version means that a 1-percentage-point decline in the current un-employment rate is associated with a 1.81-percent-age-point increase in future inflation. But the coef-ficient is near zero in the 1990s (0.04) and during the 2000s (-0.26). This unemployment and future inflation relationship varies substantially across time periods for each version of our Phillips curve. That is, for a variety of standard formulations, there is no apparent structural or stable Phillips curve relationship—a statistical association that appears strong one decade may be weak the next.
A simple theory of monetary policyTo see why this variability by time period exists, we examine the implication of incorporating central bank policy for the observed behavior of inflation and its relationship to unemployment. In particu-lar, we ask whether aggregate data generated by an economy where the central bank uses policy to sta-bilize inflation can be fruitfully used to learn about any structural relationship between inflation and unemployment. We argue that the answer is no.
Imagine a case where the central bank is con-cerned about price stability only and sets monetary policy to achieve a specific target rate of annual inflation of, say, 2 percent per year. Suppose also that future inflation depends on current unemploy-ment, as the Phillips curve notion suggests, but also on monetary policy and on other macroeconomic variables and unexpected events, or “shocks.”
To illustrate our point graphically, first consider what happens if policy does not respond to changes in current data in an attempt to stabilize inflation. This is shown in Figure 1, where current unemploy-ment is shown on the horizontal axis and future in-flation on the vertical axis. The downward sloping curve represents the relationship between current unemployment and future inflation, given values for other variables, such as current inflation, and given policy variables, such as the federal funds rate.
In this formulation, policy does not respond in a systematic fashion to observed unemployment or inflation, meaning that policymakers don’t change monetary policy in reaction to observed data. Over time, then, there would be a clear, negative struc-
tural relationship, as shown in Figure 1. In this case, every time unemployment is u(1), the average value of inflation in the next period will be inf(1), and ev-ery time unemployment is u(2), the average value of future inflation will be inf(2).
What impact will there be on this relationship if we incorporate central bank responses to a Phillips curve trade-off?
Again, assume that the central bank cares about stabilizing annual inflation at 2 percent (leaving aside, for now, the Fed’s “maximum employment” mandate). The central bank observes the current unemployment rate, and it understands the Phil-lips curve relationship illustrated in Figure 1. In addition, it knows this inflation-unemployment trade-off can be used to achieve its inflation target. By setting an expansionary monetary policy, it can shift the curve outward—meaning that by changing interest rates, the central bank can achieve its future inflation target despite higher unemployment. Al-ternatively, it could set a restrictive policy to shift the curve inward, achieving its 2 percent inflation target with lower unemployment.
Thus, if current unemployment is u(1), the cen-tral bank will choose policy so as to shift the curve to the right and achieve 2 percent average future inflation, as shown in Figure 2. Similarly, if unem-ployment is u(2), the central bank will set policy so as to shift the curve to the left and attain average future inflation of 2 percent.
DECEMBER 20137
future inflation
current unemploymentu(2) u(1)
inf(1)
inf(2)
National unemployment-inflation curve with nonresponsive policy
Figure 1

How will inflation behave in this economy? It will, on average, equal 2 percent per year. And the deviations of actual future inflation from 2 percent will be uncorrelated with macroeconomic variables that affect inflation, such as oil price hikes or past inflation. Most crucial to the question addressed in this paper: The current unemployment rate, in particular, will have no correlation with inflation. In sum, data generated by this economy will exhibit no statistical relationship between any of the macro-economic variables mentioned and future inflation, despite the fact that future inflation is assumed to depend on current unemployment along with other variables.
Why is future inflation uncorrelated with its fun-damentals? Because the central bank is following its legislatively set mandate—price stability. It is using policy to keep inflation at 2 percent despite changes in the underlying economy, including movements in the unemployment rate.
According to this theory, the estimated coeffi-cient of the Philips curve should always be zero—that is, there should be no measurable relationship between unemployment and inflation. This stark result reflects the fact that we are considering a cen-tral bank with a single mandate. But, in reality, the Federal Reserve has a dual mandate: to stabilize in-flation and maximize employment. If a central bank is charged with a dual mandate, the estimated coef-ficient of the Phillips curve in our theory depends
on how much weight it puts on each objective. If it is concerned to any extent about its employment mandate, then the estimated coefficient of the Phil-lips curve will be negative—a trade-off between in-flation and unemployment will exist.
Note a general pattern seen in Table 1. The esti-mated slope of the Phillips curve is higher for the first subperiod (1977-1984) and goes down (the negative relationship approaches zero) over time. This is consistent with the view that the weight on the employment mandate was high in the 1970s—so there is evidence of a negative Phillips curve us-ing aggregate data—but declined starting with Paul Volcker’s term in 1979—so it became harder to find a negative Phillips curve coefficient in national-level data for the United States. Furthermore, the view that the weight on the employment mandate has fallen is consistent with annual inflation being stabilized pretty tightly around 2 percent over the past 20 years.
Stability of regional Phillips curvesOnce an active central bank is incorporated into the analysis, it becomes clear that national data on inflation and unemployment are not useful for exploring whether a structural, or stable, Phillips curve relationship exists. In order to account for the complications raised by incorporating a central bank, we make use of regional data on unemploy-ment and inflation.
We imagine an economy composed of numerous regions and a single central bank. Regional shocks make inflation rates and unemployment rates vary across regions. To simplify, we assume that regions are the same for the most part, but each faces differ-ent local disturbances, or shocks.
As before, the central bank aims to stabilize the inflation rate, which, for the central bank, is the av-erage rate over all regions. Policy will therefore move to stabilize average national inflation. Monetary pol-icymakers will react strongly to national shocks that affect inflation in all regions, but react very little to a shock that increases inflation in one region only, since this has little impact on the average. In the ab-sence of central bank response to local conditions, a regional shock that affects unemployment in just a single region can therefore help identify the exis-tence and size of a structural relationship between
DECEMBER 2013 8
future inflation
current unemploymentu(2) u(0) u(1)
inf(*)=2%
National unemployment-inflation curve with single-mandate policy
Figure 2

current labor market conditions and future inflation.To frame the analysis graphically, consider Figure
3, which plots the regional-national differences for future inflation and current unemployment. Thus, the vertical axis displays the gap between future in-flation in a given region and the inflation target set by the central bank; the difference between current un-employment in the same region and average national unemployment is plotted on the horizontal axis.
The curve crosses the origin (where the X axis and Y axis intersect), meaning that future inflation in a region matches the central bank’s national in-flation target when unemployment in that region equals the national unemployment figure. The key feature of monetary policy in our theory is that the central bank reacts only when average national in-flation rises above or drops below the target; it does not respond to changes in individual regional infla-tion rates. Thus, in regions where unemployment is lower than the national average, inflation will be higher than the national average and in regions where unemployment is higher than the national average, future inflation will be lower than the na-tional average.
One difficulty with our approach is that we need a measure of the inflation target for the cen-tral bank. The Federal Reserve did not provide an explicit inflation target until 2012. To address this issue, we look at three Phillips curve models. In our first model, we assume that the inflation tar-
get is constant during the entire period from 1977 onward—clearly an unrealistic assumption since we include the high inflation of the 1970s. In the second model, we assume that the target for the next year is the past year’s inflation rate. In the third model, we include a time period variable, which can be interpreted as a period-by-period estimate of the inflation target.
Table 2 presents our results. Except for the first two numbers in the first column—the period of extremely high unemployment and inflation—the results are remarkable in their consistency. The co-efficients across models all have the same interpre-tation, strongly suggesting a slope around -0.3, with a tight range from -0.39 to -0.20 across models in the final three time periods. These estimates there-fore indicate that if unemployment is 1 percentage point higher, inflation over the next year will be 0.3 percentage points lower.
DECEMBER 20139
regional unemployment minusnational unemployment
regional inflation minusnational inflation
Regional unemployment-inflation curve with single-mandate policy
Figure 3
Table 2Estimated unemployment coefficients at regional level
Three models and four time periods
REGIONAL PHILLIPS CURVES 1977-1984 1985-1990 1991-2000 2001-2010
Constant inflation target -0.02 -0.27 -0.28** -0.20*
Past-year inflation target -0.06 -0.34* -0.20* -0.27*
Variable inflation target -0.29** -0.39** -0.37** -0.24**
Notes: “Unemployment coefficient” is the percentage point amount by which regional inflation is predicted to differ from the national inflation target over the next year given a 1-percentage-point difference in the current unemployment rate.
The indicators * and ** mean statistically significant at the 5 percent level and 1 percent level, respectively.
Results reported are obtained using ordinary least squares. To address potential issues regarding endogenous regressors, in Fitzgerald and Nicolini (2013), we also estimate the slope using two-stages least squares. The results are similar.
An interesting independent outcome from the third model, with a variable inflation target, is an estimation of the Fed’s implicit inflation target. We plot the estimated values of that target since 1977 to 2010 in Figure 4, together with average values for each for the four subperiods we are considering.
The assumption of a constant or past-year infla-tion target seems implausible for the 1977-1984 pe-riod. We think this also explains why the first two models’ coefficients for the 1977-1984 period are so different from other model and period estimates, and why the model results are so similar over the past 20 years.

SummaryIn summary, we argue that the instability of the Phillips curve seen in U.S. data from recent decades is exactly what theory predicts when monetary policymakers pursue a dual mandate while chang-ing emphasis on inflation and unemployment over time. Statistical calculations that use U.S. data on unemployment and inflation provide little evidence as to the underlying relationship between these variables precisely because the central bank is ac-tively seeking to achieve specific policy goals and thereby dampening effects of structural links that may exist.
In contrast, our theory predicts that regional Phillips curve analysis is immune to policy chang-es made to achieve average national goals. Our data analysis shows that, indeed, the estimates of a Phillips curve trade-off are remarkably stable over the same multidecade period and show a consistent negative relationship between regional unemployment and inflation. This suggests that policymakers may be able to exploit a trade-off between mandates.
DECEMBER 2013 10
1977 19871982 19971992
Annu
al p
erce
nt
20072002 2012
-2
0
14
10
8 7.5
3.7
2.5 2.4
6
4
2
12
16
Model estimates of inflation targetAverages by time period given by dotted lines
Figure 4

DECEMBER 201311
ReferencesAtkeson, Andrew, and Lee E. Ohanian. 2001. “Are Phillips Curves Useful for Forecasting Inflation?” Federal Reserve Bank of Minneapolis Quarterly Review (Winter): 2-11. minneapolisfed.org/research/qr/qr2511.html
Fisher, Irving. 1926. “A Statistical Relationship Between Unem-ployment and Price Changes.” International Labor Review 13 (June): 785-92. Reprinted in 1973 as “I Discovered the Phillips Curve.” Journal of Political Economy 81 (March-April): 496-502.
Fisher, Jonas D. M., Te Liu Chin and Ruilin Zhou. 2002. “When Can We Forecast Inflation?” Journal of Economic Perspectives 26 (1): 30-42.
Fitzgerald, Terry, and Juan Pablo Nicolini. 2013. “Is There a Stable Relationship Between Unemployment and Future Inflation? Evidence from U.S. Cities.” Working Paper. Federal Reserve Bank of Minneapolis. Forthcoming.
Lucas, R. E., Jr. 1972. “Expectations and the Neutrality of Money.” Journal of Economic Theory 4: 103-24.
Nicolini, Juan Pablo. 2012. “Monetary Policy and the Quantity Theory of Money.” Mimeo. Federal Reserve Bank of Minneapolis.
Phillips, A. W. 1958. “The Relation Between Unemployment and the Rate of Change of Money Wage Rates in the United Kingdom, 1861-1957.” Economica 25 (100): 283-99. people.virginia.edu/~lc7p/202/Phillips58.pdf

SEPTEMBER 2013 28
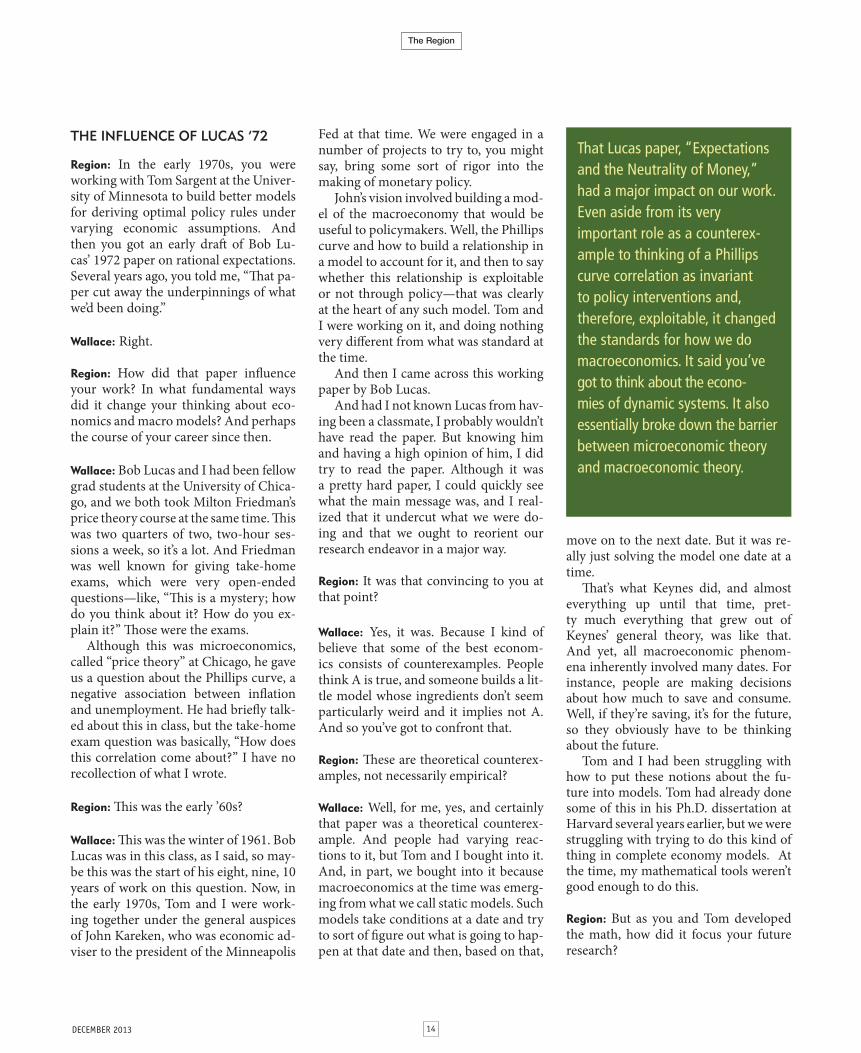
Neil Wallace thinks about money a lot. That might be true of all economists,
of course, but Wallace is widely considered the father of money’s “microfoundations,”
which is to say, its very essence—how families and firms conceive of and use it. Without
that base, many believe, macroeconomic theory and policy stand on unsteady ground.
But once solid micro-level fundamentals are established, predictions about the impact of
change at macroeconomic levels can be made with greater certainty.
Wallace began working on monetary microfoundations in the early 1970s after
reading a paper by former classmate Robert Lucas, an early proponent. The so-called
Lucas critique, says Wallace in the following interview, “essentially broke down the barrier
between microeconomic theory and macroeconomic theory.” Ever since, he has been
building crucial monetary bridges from one to the other.
In his early years at the University of Minnesota, often in partnership with the
Minneapolis Fed, Wallace collaborated frequently with Tom Sargent. They, with Chris Sims
and Ed Prescott, were soon anointed the “Four Horsemen” of Minnesota economics and
viewed as leaders of a new wave in economic theory. Prescott, Sargent and Sims recently
won Nobel awards for research begun at Minnesota.
Wallace is far more modest about the value of his early work, pioneering though
it was. “I learned all my serious economics very slowly at the University of Minnesota.
And I’m still learning. I started at such a low base,” he jokes, “and I’ve been pretty lazy.”
Few agree with that assessment, of course, and the following conversation gives a
glimpse of the range and insights of his prodigious research, from analyses of government
guarantees and risk-taking to the impact of quantitative easing and why foreign currency
markets are different from all others.
PHOTOGRAPHS BY PETER TENZER

SEPTEMBER 201313 DECEMBER 2013
14DECEMBER 2013
THE INFLUENCE OF LUCAS ’72
Region: In the early 1970s, you were working with Tom Sargent at the Univer-sity of Minnesota to build better models for deriving optimal policy rules under varying economic assumptions. And then you got an early draft of Bob Lu-cas’ 1972 paper on rational expectations. Several years ago, you told me, “That pa-per cut away the underpinnings of what we’d been doing.”
Wallace: Right.
Region: How did that paper influence your work? In what fundamental ways did it change your thinking about eco-nomics and macro models? And perhaps the course of your career since then.
Wallace: Bob Lucas and I had been fellow grad students at the University of Chica-go, and we both took Milton Friedman’s price theory course at the same time. This was two quarters of two, two-hour ses-sions a week, so it’s a lot. And Friedman was well known for giving take-home exams, which were very open-ended questions—like, “This is a mystery; how do you think about it? How do you ex-plain it?” Those were the exams.
Although this was microeconomics, called “price theory” at Chicago, he gave us a question about the Phillips curve, a negative association between inflation and unemployment. He had briefly talk-ed about this in class, but the take-home exam question was basically, “How does this correlation come about?” I have no recollection of what I wrote.
Region: This was the early ’60s?
Wallace: This was the winter of 1961. Bob Lucas was in this class, as I said, so may-be this was the start of his eight, nine, 10 years of work on this question. Now, in the early 1970s, Tom and I were work-ing together under the general auspices of John Kareken, who was economic ad-viser to the president of the Minneapolis
Fed at that time. We were engaged in a number of projects to try to, you might say, bring some sort of rigor into the making of monetary policy.
John’s vision involved building a mod-el of the macroeconomy that would be useful to policymakers. Well, the Phillips curve and how to build a relationship in a model to account for it, and then to say whether this relationship is exploitable or not through policy—that was clearly at the heart of any such model. Tom and I were working on it, and doing nothing very different from what was standard at the time.
And then I came across this working paper by Bob Lucas.
And had I not known Lucas from hav-ing been a classmate, I probably wouldn’t have read the paper. But knowing him and having a high opinion of him, I did try to read the paper. Although it was a pretty hard paper, I could quickly see what the main message was, and I real-ized that it undercut what we were do-ing and that we ought to reorient our research endeavor in a major way.
Region: It was that convincing to you at that point?
Wallace: Yes, it was. Because I kind of believe that some of the best econom-ics consists of counterexamples. People think A is true, and someone builds a lit-tle model whose ingredients don’t seem particularly weird and it implies not A. And so you’ve got to confront that.
Region: These are theoretical counterex-amples, not necessarily empirical?
Wallace: Well, for me, yes, and certainly that paper was a theoretical counterex-ample. And people had varying reac-tions to it, but Tom and I bought into it. And, in part, we bought into it because macroeconomics at the time was emerg-ing from what we call static models. Such models take conditions at a date and try to sort of figure out what is going to hap-pen at that date and then, based on that,
move on to the next date. But it was re-ally just solving the model one date at a time.
That’s what Keynes did, and almost everything up until that time, pret-ty much everything that grew out of Keynes’ general theory, was like that. And yet, all macroeconomic phenom-ena inherently involved many dates. For instance, people are making decisions about how much to save and consume. Well, if they’re saving, it’s for the future, so they obviously have to be thinking about the future.
Tom and I had been struggling with how to put these notions about the fu-ture into models. Tom had already done some of this in his Ph.D. dissertation at Harvard several years earlier, but we were struggling with trying to do this kind of thing in complete economy models. At the time, my mathematical tools weren’t good enough to do this.
Region: But as you and Tom developed the math, how did it focus your future research?
That Lucas paper, “Expectations and the Neutrality of Money,” had a major impact on our work. Even aside from its very important role as a counterex-ample to thinking of a Phillips curve correlation as invariant to policy interventions and, therefore, exploitable, it changed the standards for how we do macroeconomics. It said you’ve got to think about the econo-mies of dynamic systems. It also essentially broke down the barrier between microeconomic theory and macroeconomic theory.

15 DECEMBER 2013
Wallace: Well, that Lucas paper, “Expec-tations and the Neutrality of Money,”—which, by the way, I’ve heard Lucas say at a conference, speaking publicly, that he regards as having been a waste of his time—had a major impact on our work.
Even aside from its very important role as a counterexample to thinking of a Phillips curve correlation as invariant to policy interventions and, therefore, ex-ploitable for policy, that paper did other things.
It changed the standards for how we do macroeconomics. It not only said you’ve got to think about the economies of dynamic systems and solve for the whole path of outcomes, not thinking about solving it just one date at a time, but it also essentially broke down the barrier between microeconomic theory and macroeconomic theory.
Region: Which is why establishing mi-crofoundations became crucial.
Wallace: Yes, right. Now, the idea of es-tablishing microfoundations for macro-economics had been in the air for a long, long time. But people were often doing it—and you still see some of this in what I think of as bad textbooks—by taking the equations that come out of Keynes-ian economics and trying to tell stories about those equations, one equation at a time. But those separate stories don’t add up to a coherent view of an economy.
Lucas became convinced that to build a model in which agents have a reason-able view about what’s going on in the world, you have to start with a coherent underlying view of an entire economy. Microeconomics had been doing that for a long time. I think Bob’s paper in-fluenced many people in the direction of thinking we have to do that in macro-economics as well.
EXISTENCE OF MONEY
Region: Let me ask you about money. Ordinary people don’t question its ex-istence. It simply is. And it’s very useful
to have. But economists are not satis-fied with that easy acceptance and have developed a number of theories about its existence and utility, as a measure of value, medium of exchange and so on.
As a monetary theorist, you’ve studied money far more deeply than most. Many economists consider you the intellectual father of money’s microfoundations.
When you introduce this topic to students, how do you discuss the issues involved? Maybe it makes sense here to quote from your 2008 discussion of fiat money in Palgrave, where you wrote, “Money is helpful when there are ab-sence-of-double-coincidence difficul-ties that cannot be easily overcome with credit; and a good money has de-sirable physical properties—recogniz-ability, portability and divisibility.” [See Wallace 2008.]
I don’t know if that’s a good starting point, but …
Wallace: It’s a reasonable starting point. Every few years I’ve ended up writing something about how we should think about money, and that paper was one such piece.
Region: So, how do you introduce these issues if you’re sitting down with under-grads who, like most of us, simply take money, literally, at face value?
Wallace: Well, one of the things I say is, just because a thing is around doesn’t mean we understand it. Cancer is around. Does that mean we don’t want to do research on it? And then I talk a little bit about the history of thought on this absence-of-double-coincidence notion.
Region: In a word or two, what is the ab-sence of double coincidence?
Wallace: A professor at Texas A&M put me onto a 1923 book called Monetary Theory Before Adam Smith. It was a Harvard Ph.D. dissertation on the his-tory of thought concerning money. And its author, Arthur Eli Monroe, asks, did
Aristotle have this absence-of-double-coincidence notion? Probably not. But he finds someone named Paulus, a Ro-man jurist in the second or third century A.D., who said something like, when two people meet, it’s often the case that one has something that the other person wants, but not vice versa. And without money, nothing can happen.
Region: Trade will not occur.
Wallace: Trade will not occur.
Region: So there’s one coincidence, not two? In this example, at least, one guy wants what the other’s got, but not vice versa.
Wallace: Right. Yes. My [University of Minnesota] colleague Leo Hurwicz al-ways objected to the “double coinci-dence” terminology, even though it’s commonplace. He said the word “coin-cidence” itself means two. So “double co-incidence,” he would say, is a redundant term. But it’s standard usage somehow. It’s very helpful to have this notion of single coincidence, meaning that I have something that you want. That is a kind of coincidence. So Paulus said this.
I don’t know about the last edition, but one edition of [Frederic] Mishkin’s very popular undergraduate money and bank-ing textbooks has Mary or Alice as an economics professor. If she wants some apples, without money, she’d have to find an apple grower who wants an econom-
When two people meet, it’s often the case that one has something that the other person wants, but not vice versa. And without money, nothing can happen. Trade will not occur. Now, this story is incomplete.

16DECEMBER 2013
ics lecture—and he didn’t go on and say almost no one wants an economics lec-ture, so she’s really in trouble [laughter]. In any case, that’s what the textbooks say, and this has been repeated.
Now, this story is incomplete. That’s what I tell students: It’s incomplete. Why is it incomplete? Well, think about some isolated pioneer family. At times, someone is going to not feel so well, so he or she isn’t going to be able to chop down wood for a fire. There’ll be lots of absence of double coincidences that arise in that family situation, many cases where one family member is called on to do a favor for another family member. Well, are they going to get paid for doing this favor?
Region: Of course not, not in a family.
Wallace: Right. Now think about Robin-son Crusoe, after he meets Friday. They don’t need money, but again, there might be plenty of absence of double coinci-dences. Now think further. Here we are in the middle of Pennsylvania. There are
lots of Amish communities around here. When they’re isolated, the usual story about an Amish community—or an iso-lated Israeli kibbutz—is that they didn’t use money.
Region: Trust was their currency.
Wallace: Well, that’s a word that Douglas Gale used, but it’s probably not the best word. [See Gale 1978.] Think about this Amish community. The vision is, if my barn burns down, then everybody will come and help me rebuild it. In econom-ics, we try to rationalize behavior without altruism, if we’re able to; so what makes that work without altruism? Everybody notices who shows up to help rebuild it.
Region: A sort of credit accounting.
Wallace: Yes. And the guy who doesn’t show up, if he does that repeatedly, will get kicked out eventually. This can work without money because people remem-ber what people have done in the past.
Region: So, money is memory.
Wallace: Yes, “money is memory” is a ca-sual way to state that. Now, that’s a huge-ly powerful idea that I and other people have been working with.
Region: Kocherlakota [1998], Ostroy [1973] and Townsend [1989], for in-stance.
Wallace: Right. And I think a lot more needs to be done. Let me mention one thing sort of related to that. People ask, what is money? Friedman and [Anna] Schwartz, in their monetary history, right at the beginning have a long discussion about money. Of course, he’s written about it extensively. So, what is money? They make a decision that they’re going to use, if I recall correctly, what we would call M2. You’ve heard of these subscript things?
Region: Sure, categories of money in the total stock of money. [See Bernanke
2006.] The Fed publishes monthly re-ports, for example, on quantities of M1 and M2, as they’re termed.
Wallace: Right. Now, I think the idea of adding up these quantities into some ag-gregate is a really bad idea.
“Money is memory” is a better idea. It leads you to think about various kinds of payment instruments in terms of the kind of informational structure that supports them. The money that is the best current counterpart to the “money is memory” idea is currency. You don’t need much of an informational network for currency; in fact, you probably don’t need any, except for worrying about counterfeiting.
When you use a credit card, you’re is-sued a loan. Why are you able to receive one? Because there’s an informational network behind your card. Your bank is actually guaranteeing your credit pay-ment up to probably some large amount, as large as you mostly use. And they’re doing that because they know something about you.
Region: So that’s a form of memory about a person’s past transactions.
Wallace: Right.
Region: In a paper you just presented at the Minneapolis Fed, you wrote, “Money is potentially useful in trade between strangers. It is not needed when every-one knows what everyone else has done in the past.” Now, if you’ve got a credit card, the bank is keeping …
Wallace: … pretty good tabs on what you do.
A CASHLESS SOCIETY
Region: That leads to another question about technological advances and po-tentially a cashless society. We’ve got electronic payments, debit and credit cards. Now people use smartphones for retail purchases; soon we might use our
“Money is memory” is a hugely powerful idea. It leads you to think about various kinds of payment instruments in terms of the kind of informational structure that supports them.
When you use a credit card, you’re issued a loan. Why are you able to receive one? Because there’s an informational network behind your card. Your bank is actually guaranteeing your credit payment because they know something about you. The bank is keeping pretty good tabs on what you do.

17 DECEMBER 2013
The idea of a cashless economy, both in theory and in those examples of an isolated Amish community or an Israeli kibbutz, shouldn’t trouble us. We know about that already, in some sense. And maybe we’re headed that way.
And so, what is left for central banking in that kind of world? Well, that’s a matter of—I would say—some dispute in the profession. It almost goes back to Phillips curve issues.

18DECEMBER 2013
fingerprints. They all reduce the need for cash and checks, so an even less physical representation of that M2 or whatever.
Does that mean that money itself is becoming less important—even as a re-cordkeeping device? If cash is less im-portant, how does that change monetary theory?
Wallace: Well, you asked me earlier how I introduced money to undergraduates, and there I talk about an Israeli kibbutz where there’s no money. The vision of that is a small community, which makes it easy for us to remember. But the idea of remembering actions, well, it doesn’t have to be a small community. It’s an ab-stract idea and, with the technology we now have, a lot can be remembered.
Region: Too much?
Wallace: It may be too much. But the idea of a cashless economy, both in the-ory and in those examples of an isolated Amish community or an Israeli kibbutz, shouldn’t trouble us. We know about that already, in some sense. And maybe we’re headed that way.
And so, what is left for central bank-ing in that kind of world? Well, that’s a matter of—I would say—some dispute in the profession. It almost goes back to Phillips curve issues, because it goes back to issues about whether prices are sticky or not, which was sort of at the heart of Phillips curve theories.
Region: And it still is central in a lot of New Keynesian work.
Wallace: Absolutely, it still is.
DEPOSIT INSURANCE, TBTF, MORAL HAZARD
Region: Let me ask you about a differ-ent area of your research, something you’re very well known for. And again, it involved John Kareken. The two of you pioneered thinking about how govern-ment guarantees for bank deposits cre-
ate moral hazard, that they encourage undue risk-taking and therefore ineffi-cient resource allocation. But at the same time, government guarantees for depos-its are considered essential for banking.
These issues were central to some parts of the recent financial crisis, and then Dodd-Frank legislation tried to ad-dress some of that. I know you are reluc-tant to weigh in on specific policy issues, so I won’t push it that way, but I wonder what general thoughts you’ve had about the factors behind this particular finan-cial crisis and then the evolving relation-ships between financial institutions and the government since then.
Wallace: In some circles, Kareken and I get some credit for pointing out this risk-taking incentive of deposit insur-ance. But I don’t know, it was pretty well known in some sense.
Region: You formalized the thinking on it.
Wallace: Maybe a bit, not all that well, but a bit. But let me introduce a second literature that’s relevant to this question. Going way back, one of the issues that had troubled economists and that they weighed in on is the issue of fractional reserve banking or, more generally, how do we think about an illiquid banking system?
Region: Where a bank holds cash on hand just a portion of what customers have deposited.
Wallace: Sure, and you can think about this in terms of term-structure risk, so, in general, you want to describe bank-ing illiquidity as a balance sheet which is unbalanced in terms of maturities: short-term liabilities and, on average, longer-term assets. Now, economists have weighed in on this for a long time. Some have said this is a natural thing. This is what banks are for.
Others have said this is dangerous, and we ought to regulate it out of exis-tence. Henry Simons, for example, wrote
a book called Economic Policy for a Free Society. And Friedman [1967] often credits him [with this idea]. Simons said it’s not enough to force banks to hold 100 percent reserves. He said we should prevent limited liability institutions, like corporations, from issuing debt. (Now that’s fairly ironic because what is the use of limited liability if you can’t borrow?)
But he said you can tell people over and over again that a certain bond is risky, yet they’re not going to act like it’s risky. And then, when it fails to pay off, because they haven’t anticipated that that might happen, it’s chaos. So that’s what he said, writing in the 1930s.
So on one side is a bunch of people who are saying banking system illiquid-ity—and maybe illiquidity more gener-ally—is harmful; we ought to regulate it out of existence. And on the other side were people who vaguely said, “It’s natu-ral, that’s the function of banks.”
In 1983, Doug Diamond and Phil Dy-bvig published what to me was an eye-opening paper, a very simple, stripped down model, but one whose elements all seem quite reasonable. One element is that people can’t fully plan the pattern of their future expenditures, so they want something like a demand deposit to be able to spend at any time. A spending opportunity might arise that they hadn’t anticipated, so they want the flexibility of being able to spend at any time.
But giving them that flexibility in, say, the form of a demand deposit, allowing
In general, you want to describe banking illiquidity as a balance sheet which is unbalanced in terms of maturities: short-term liabilities and, on average, longer-term assets. Some [economists] have said this is a natural thing. This is what banks are for.

19 DECEMBER 2013
them to withdraw whenever they want, means they might also withdraw not just when they want to spend but because they’re worried about the [safety of that financial] institution.
Region: And if they withdraw for that reason, lots of other depositors might as well, creating a bank run.
Wallace: Right. Now, one element in the model is people’s desire for flexibility. It’s a little bit technical, but in the model, the realization of the spending desire is private information. So, as an example, when you go up to the bank window to make a withdrawal, it’s not written on your forehead whether you genuinely want to make a payment or whether you’re worried about the solvency of the bank. That information is private. Then a second element in the model is that the technology is such that longer-term investments have bigger payoffs than short-term investments.
Region: That’s the maturity transforma-tion, from short-term deposits to longer-term lending with higher returns. That’s where the bank wants to put all those short-term deposits.
Wallace: That’s why it’s socially a good idea for those deposits to be used to fi-nance this long-term investment. It’s like wine, if you leave it in, it’s going to turn good. If you withdraw it quickly, it’s go-ing to be just the grape juice that you started out with.
Region: A great analogy. So who steps in and makes sure that that transformation is possible?
Wallace: In some sense, this is a con-troversial model of banking. Certainly many, many people liked the Diamond-Dybvig model.
Earlier I said that Lucas’ paper was a microeconomically coherent model of the entire economy. Well, so is Dia-mond-Dybvig, because it allows you to
think about what it would mean to im-pose 100 percent reserves. You can do that in that model, and then you can trace back to the welfare of the people in the model who are really, essentially, just the depositors. You can trace back to them the consequences of that policy in that model.
That’s a huge accomplishment. The literature on banking has always been—like that on money—a troublesome liter-ature. This goes back to economists’ feel-ings that the general competitive model, often labeled the Arrow-Debreu model, is the main model in economics. It’s very general. We don’t need to have a special theory of production for bookcases and a special theory for bottled water.
But when people try to shove banking into this model, it’s hugely unsuccess-ful. Why? Because anything that banks might be viewed as doing is redundant in that model. According to the Arrow-De-breu model, you face prices at which you can costlessly trade anything for any-thing. More generally, no activity that we see in the economy that has to do with transacting fits comfortably within that model. In particular, nothing in the GDP accounts that falls under the FIRE head-ing—finance, insurance, real estate—fits into that model.
Diamond-Dybvig overcame that. It was at the cost of abstracting from de-tails that some people think are quite im-portant. But still, it was a major break-through. It pointed out, for the first time, a social role for an entire illiquid finan-cial system. Not just one bank, not just the banking system, it is a model of an entire economy. And it points out a so-cial role for this economy to have a spe-cific property of illiquidity—namely, if all these depositors try to withdraw at once, it’s in trouble.
Region: So there’s a social role for this kind of banking system, but it won’t ex-ist unless that private information that people might have, their worries about the bank’s solvency, unless it’s reassured by government, by deposit insurance.
Wallace: Now we have this Diamond-Dybvig model, which, if you buy into it, says some degree of illiquidity in the financial system plays a desirable social role. But we’ve also got this other side of things that says various loan guarantees potentially lead to too much risk-taking.
Region: That’s the moral hazard.
Wallace: That risk-taking often takes the form of illiquidity. You read about what Bear Stearns was doing, what Lehman was doing. They were borrowing very short and financing long-term asset po-sitions. You read casual accounts about Wall Street people going to pension funds and selling like they’re used car salesmen. I mean, the way to overstate the quality of what you’re selling in this area is to say it’s safe and liquid.
Now, look at liquidity in a financial
Others have said this is dangerous, and we ought to regulate it out of existence. The literature on banking has always been—like that on money—a troublesome literature.
I don’t know any research that answers the question, “Are we seeing the right degree of illiquidity?” This has come up repeatedly. Is that an instance of the right kind of maturity trans-formation that Diamond-Dybvig says has a social role? Or is it really just a combination of this risk-taking incentive—the moral hazard aspect of government guarantees—and this overselling of the quality?
20DECEMBER 2013
system. On the one hand, this Diamond-Dybvig model says that some degree of system illiquidity is desirable. But we’ve also got this moral hazard aspect of vari-ous explicit and implicit forms of insur-ance and we’ve got this general desire to oversell, to overstate the quality of what you’re trying to peddle.
When we look at the whole financial system, well, I don’t know any research that answers the question, “Are we see-ing the right degree of illiquidity?” This has come up repeatedly. In the Asian fi-nancial crisis, people were investing in these countries, but rather than making direct equity investments, they were giv-ing short-term loans. Is that an instance of the right kind of maturity transfor-mation that Diamond-Dybvig says has a social role? Or is it really just a com-bination of this risk-taking incentive—the moral hazard aspect of government guarantees—and this overselling of the quality of what you have?
Region: So legislation is hard-pressed to ensure the “right” degree of illiquidity.
Wallace: It is.
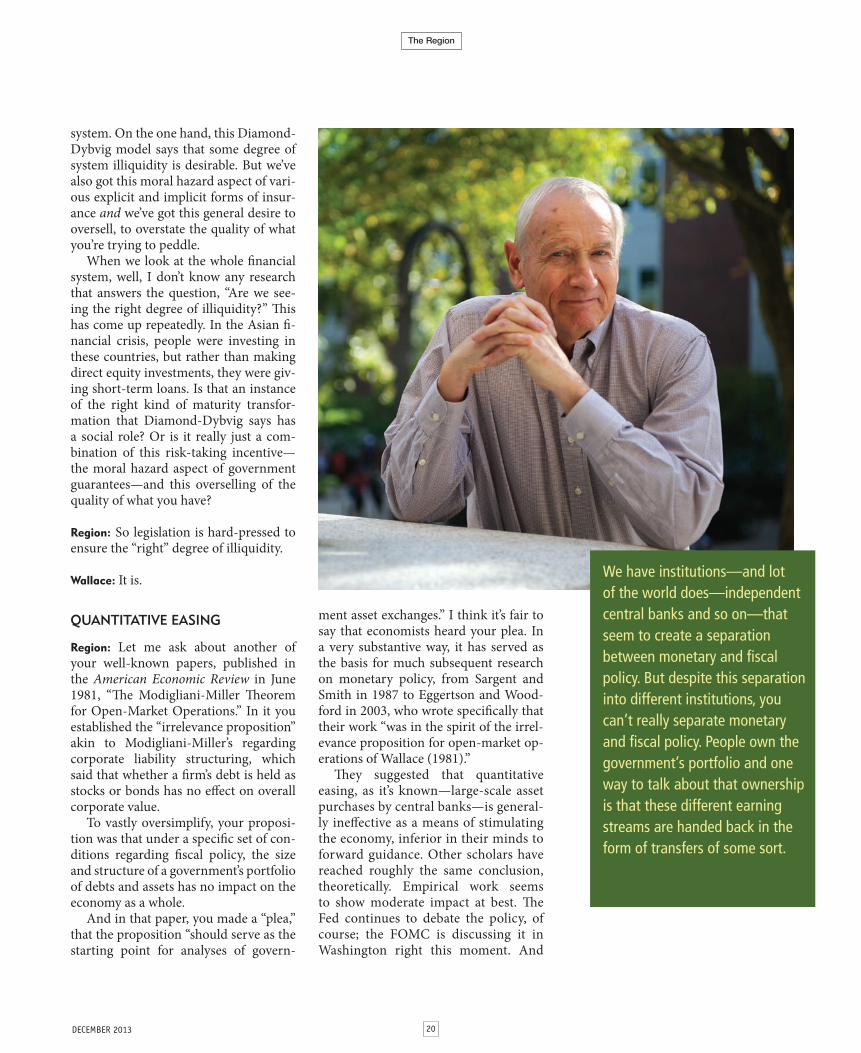
QUANTITATIVE EASING
Region: Let me ask about another of your well-known papers, published in the American Economic Review in June 1981, “The Modigliani-Miller Theorem for Open-Market Operations.” In it you established the “irrelevance proposition” akin to Modigliani-Miller’s regarding corporate liability structuring, which said that whether a firm’s debt is held as stocks or bonds has no effect on overall corporate value.
To vastly oversimplify, your proposi-tion was that under a specific set of con-ditions regarding fiscal policy, the size and structure of a government’s portfolio of debts and assets has no impact on the economy as a whole.
And in that paper, you made a “plea,” that the proposition “should serve as the starting point for analyses of govern-
ment asset exchanges.” I think it’s fair to say that economists heard your plea. In a very substantive way, it has served as the basis for much subsequent research on monetary policy, from Sargent and Smith in 1987 to Eggertson and Wood-ford in 2003, who wrote specifically that their work “was in the spirit of the irrel-evance proposition for open-market op-erations of Wallace (1981).”
They suggested that quantitative easing, as it’s known—large-scale asset purchases by central banks—is general-ly ineffective as a means of stimulating the economy, inferior in their minds to forward guidance. Other scholars have reached roughly the same conclusion, theoretically. Empirical work seems to show moderate impact at best. The Fed continues to debate the policy, of course; the FOMC is discussing it in Washington right this moment. And
We have institutions—and lot of the world does—independent central banks and so on—that seem to create a separation between monetary and fiscal policy. But despite this separation into different institutions, you can’t really separate monetary and fiscal policy. People own the government’s portfolio and one way to talk about that ownership is that these different earning streams are handed back in the form of transfers of some sort.

21 DECEMBER 2013
markets these days react sharply to any talk of “tapering” QE.
What are your general thoughts about quantitative easing policies for large asset sales when we’re at the zero bound?
Wallace: I’m kind of surprised at the re-cent attention that this paper has got-ten. Chris Sims, for example, remarked about it in his AEA presidential lecture. [See Sims 2013.] It’s right that the back-ground model of that paper has money holding its own in terms of rate of re-turn. That means that money has a high enough return that it is being held as an investment. When interest rates are at the zero lower bound, that’s certainly an example of money holding its own, in terms of rate of return.
Again, when I use the word “mon-ey” in this context, we might as well be thinking about currency. It’s very differ-ent from a situation where, say, T-bills are yielding 8 percent nominal and cur-rency is yielding nothing.
So, that paper assumed that these as-sets were holding their own in terms of rate of return, which, by the way, is what the Modigliani-Miller theorem assumes about bonds and equities. It’s assuming that bonds and equities are packages of claims, and there’s a complete contingent market in claims, and these things are just bundles of claims.
Merton Miller is a very nice, modest guy. He has said something like, “Should I have really gotten a Nobel Prize for say-ing ‘no matter how you slice up a pie, it’s still a pie?’” That’s the way he character-izes the Modigliani-Miller theorem.
I was extending that conclusion to include currency, when the economy is at the zero lower bound. When it is, the Fed’s monopoly on currency becomes ir-relevant, because there are short-term se-curities which are perfect substitutes for it because they have the same rate of return. Other people can issue those claims, hold them and so on, so there’s nothing special about the Fed’s monopoly on issuing cur-rency in those circumstances.
Region: Which means that such asset-purchase policies should be pretty inef-fective.
Wallace: Yes, they should be pretty in-effective. Part of that involves thinking about the interaction between monetary and fiscal policy. We have institutions—and lot of the world does—independent central banks and so on—that seem to create a separation between monetary and fiscal policy. Some people think that’s very important.
Region: The independence of central banks.
Wallace: Yes. I don’t really have a view on that. I think it would take some rather deep political economy model to really rationalize that, but maybe it’s good. I don’t know, but despite this separation into different institutions [the central bank, Congress and the administration], you can’t really separate monetary and fiscal policy.
Region: It’s just dividing the pie different ways.
Wallace: Yes. If interest rates are positive and the Fed buys some Treasury bills and hands out zero-interest currency or zero-interest bank reserves, the way it used to be, there are fiscal consequences because the Fed turns over its interest payments, its earnings, to the Treasury.
The standard assumption that most policy models made about this was that when the Fed made this kind of open-market purchase, lump-sum tax-es fell to leave the effect on the bud-get unchanged. Well, you can make that assumption in a model, but is that what really goes on?
But this 1981 paper said, in effect, that people own the government’s portfolio and one way to talk about that ownership is that these different earning streams are handed back in the form of transfers of some sort, and so it really is like a Modi-gliani-Miller theorem.
FOREIGN EXCHANGE MARKETS
Region: Just a month before you pub-lished your AER paper on open-mar-ket operations, your article with John Kareken on exchange rates appeared in the Quarterly Journal of Economics. That paper with Kareken was closely linked to your 1979 Minneapolis Fed Quarter-ly Review piece, which had a much less technical title, which I love: “Why Mar-kets in Foreign Exchange Are Different from Other Markets.”
Wallace: Does that title mean anything to you? Do you know where it comes from? Well, I’m Jewish by background, and at the Jewish holiday, Passover, there are meals called Seders, and there are these things called the four questions.
I don’t know what they are, exactly, but one of the kids at the table is sup-posed to ask, “Why is this night differ-ent from other nights? Why are we eat-ing unleavened bread?” So I thought of that title, and I thought it was too good to waste!
The models in which the invisible hand works, they don’t have fiat currencies. They’ve got cars and apples, where the value of these things is grounded in what we can do with them and that we like to eat them and things like that. You can’t do that with this stuff: money. So you don’t have this usual appeal. The key idea is potential perfect substitutability among different currencies, a potential that I expect to be realized unless there are legal restrictions that inhibit it.

22DECEMBER 2013
Region: Many of your other titles, like that one, are wonderful. “Float on a Note” is another example. Well, in that QR piece, you said fiat money is different and “we should at least consider pursu-ing an explicit policy directed toward cooperative and permanent exchange market intervention or toward controls on asset holdings.”
That’s a pretty controversial statement, then and now, although I should mention that Minneapolis Fed economists took up that cause for a good decade.
Wallace: Did they?
Region: Art Rolnick and Warren Weber wrote their 1989 Annual Report essay, “A Case for Fixing Exchange Rates,” based on your work. [See Rolnick and Weber 1990.] But I think it’s fair to say that that proposition for market intervention in foreign exchange has little traction among economists generally, and policymakers, certainly. Why do you think that is, and do you still believe in the proposition, “indeterminacy,” as you’ve termed it?
Wallace: I do. Suppose Greece left the euro system and started up its own cur-rency.
Region: Let’s call it the drachma.
Wallace: Sure. Greece returns to its old currency. Well, would it be easy to fore-cast what the demand for that currency would be? I mean, are we going to use one of Milton Friedman’s estimated demand functions for money to forecast that? I don’t think it’s so easy to do. You’d prob-ably try to put in some restrictions to pre-vent people from continuing to use euros.
Region: But that’s intervention.
Wallace: Right. When there was agitation for an independent Quebec, the party advocating independence actually said, “We’re going to still use the Canadian dollar.” But suppose it had said, “No, we’re going to have our own currency.”
What would the demand for it be? The point of that article is to say, in part … Well, had I thought about it, the U.S. has at several times tried to introduce a $1 coin. One of those attempts was the Susan B. Anthony coin. So here’s another cute title, “Why Call the Susan B. a One?” Why not let it float? These currencies are different. When we say, let the market operate …
Region: For cars or oranges.
Wallace: Yes. What’s that a reference to? That’s a reference to what economists call the first welfare theorem, which is the invisible hand. But the models in which the invisible hand works, they don’t have fiat currencies in them. They’ve got cars and apples in them, where the value of these things is grounded in what we can do with them and that we like to eat them and things like that. You can’t do that with this stuff: money. So you don’t have this usual appeal.
Now, if you read Milton Friedman carefully, you’ll sometimes find state-ments that sound like he’s appealing to the same thing he would appeal to for not regulating the prices of cars in terms of apples. But to be fair to him, he is mostly thinking differently. He’s going back to sticky prices, saying, why have millions of nominal prices change when we need to have international adjustment, as we would need to have if we had fixed ex-change rates or a single currency? Why not let this just one price change? Let the drachma fall in terms of the euro. There’s essentially no formalization of that idea, but it is there.
The issue is why are different cur-rencies other than perfect substitutes? Think about the border between the U.S. and Canada. There is a legal border. But what is the border regarding usage of the U.S. and Canadian dollar? Why does it have to correspond to the legal border? The more deeply it extends into Canada, the lower is the demand for Canadian currency, and with fixed supplies, the lower must be the relative
value of the Canadian dollar. And vice versa, if the border for currency usage extends into the U.S.
Hence, the key idea is potential per-fect substitutability among different cur-rencies, a potential that I expect to be re-alized unless there are legal restrictions that inhibit it.
REMAINING QUESTIONS IN MONETARY THEORY
Region: Let me ask you a question about remaining questions. Your research has addressed central issues in monetary theory, and in a 1985 Minneapolis Fed working paper (281), “Some Unsolved Problems for Monetary Theory,” you raised two key policy issues in monetary theory that remained at that point to be answered; we’ve talked about them both briefly today: Should interest be paid on money? And, should currency provision be in the hands of the government, rath-er than the market?”
Have they finally been resolved to your satisfaction?
Despite rules intended to prevent the support of government bond markets in member states, the ECB [European Central Bank] seems to be doing just that. In the U.S., the Fed should maintain an orderly market in government securities. It seems a bit far-fetched to reconcile orderliness with default, but maybe. Thus, while one can imagine arrangements in which control of the price level is maintained in the presence of large and unsustainable govern-ment deficits, it rarely happens.

23 DECEMBER 2013
Wallace: When I wrote those things in the 1985 paper, and when I wrote that 1981 paper on the irrelevance proposition, I was not working within models in which money is substituting for memory. Or to put it somewhat differently, I wasn’t working within models that I would now defend as models in which money really has a beneficial role in the economy. For the past 15 years or so, I think I’ve been doing that.
Region: So we’re closer.
Wallace: Well, I think we’re closer.
FISCAL-MONETARY POLICY INTERDEPENDENCE
Region: We’ve spoken about the interac-tion of fiscal and monetary policy. You established that inherent link in “Some
Unpleasant Monetarist Arithmetic,” with Tom Sargent, showing that because of that interdependence, price levels are determined by fiscal policy as well as central bank policy.
What implications does this have with respect to current budget deficits and the steady growth of entitlement expendi-tures? And do you have any thoughts on the notion that if a government were to permit sovereign default, theoretically, the central bank still could control price levels, at the risk of output drops?
Wallace: Yes, we can imagine arrange-ments under which large fiscal deficits are not monetized. In particular, when countries were on a gold standard, some may have gone through debt defaults while remaining on the gold standard. However, temporary suspensions from the gold standard were more common
for important countries—Britain during the Napoleonic Wars and at other times; the U.S. during the Civil War.
And despite rules intended to prevent the support of government bond mar-kets in member states, the ECB [Euro-pean Central Bank] seems to be doing
One way that we advance in economics is someone invents a model for one purpose and then we see other purposes for it. A model was not originally designed to address those issues. And yet, the model allows us to think about those things.
Publications
Prolific author of research articles published in refereed journals on an array of subjects related to monetary economics; co-author (with George McCandless) of Introduction to Dynamic Economic Theory: An Overlapping Generations Approach, Harvard University Press, 1991; co-editor (with John Kareken) of Models of Monetary Economies and The Overlapping Generations Model of Fiat Money, both published by the Federal Reserve Bank of Minneapolis in 1980
Education
University of Chicago, Ph.D., economics, 1964
Columbia University, B.A., economics, 1960
Current Positions
Professor of Economics, Pennsylvania State University, since 1997
Consultant, Federal Reserve Bank of Minneapolis, since 1969
Previous Positions
Professor, University of Miami, 1994-97
Professor, University of Minnesota, 1974-94; Associate Professor, 1969-74; Assistant Professor, 1964-69
Honors
Distinguished Fellow, American Economic Association, since 2012
Distinction in the Social Sciences, College of Liberal Arts, Penn State, since 2005
Fellow, American Academy of Arts and Sciences, since 2005
Fellow, Econometric Society, since 1981
Honorary Degree, Universidad del Pacifico, Lima, Peru, 1995
More About Neil Wallace

24DECEMBER 2013
Region: Well, thank you for talking with us about all these things. I’ve really en-joyed this.
—Douglas ClementSept. 18, 2013
just that. In the U.S., as I recall, the Fed-eral Reserve Act says that the Fed should maintain an orderly market in govern-ment securities. It seems a bit far-fetched to reconcile orderliness with default, but maybe.
Thus, while one can imagine arrange-ments in which control of the price level is maintained in the presence of large and unsustainable government deficits, it rarely happens.
FAVORITE RESEARCH
Region: You’re well known for a number of key contributions to economics. We’ve talked about some of that work today: “Unpleasant Monetarist Arithmetic,” the irrelevance proposition, your deposit in-surance paper and the foreign exchange research, among other work. But other papers—some still unpublished—are far less known.
Looking back, which of your papers do you most like and which do you con-sider less valuable? Is this like picking among children? I don’t want to put you in that position.
Wallace: No. It’s not. It’s kind of easy for me to answer.
Region: This is the only question where you haven’t paused at considerable length before giving your answer!
Wallace: As I sort of indicated earlier, I went to good schools, went to Columbia as an undergraduate and it was a good experience. I mean, it was intellectually eye opening in a certain way. I went to the Bronx High School of Science, which is a good high school, but that wasn’t intellectually eye opening at all. Then I went to the University of Chicago. It was an exciting place.
But I learned all my serious econom-ics very slowly at the University of Min-nesota. And I’m still learning. And I say this because I think my recent work is my best work.
I think that’s possible for me because I started at such a low base [laughs] and I’ve been pretty lazy, so it’s easy for me to improve because that’s just the way it is.
Region: Well, I don’t think many economists would agree with you. So, which papers? The one you just pre-sented at the Minneapolis Fed? That was a draft, a working paper, “Alter-native Neo-Keynesian Models for the Study of Optimal Monetary Policy.”
Wallace: Yeah, that’s a draft. You shouldn’t use that title. I’ve actually changed the title of that thing, and I don’t know whether I’m going to submit it anywhere. But the substance, yeah, I kind of liked that.
Region: Other papers come to mind?
Wallace: I’m fond of a little paper I did on the denomination structure of mon-ey. [See Wallace 2005.]
Region: Why do you like that one in par-ticular?
Wallace: Well, one way that we advance in economics—and in other fields I think, too, but certainly in economics—is some-one invents a model for one purpose and then we see other purposes for it.
Both that denomination structure pa-per and “Float on a Note” use a model that’s been around for a while. They may not be dealing with the most important issues, but they use a model that was not originally designed to address those is-sues. And yet, the model allows us to think about those things. That’s a fun and interesting thing.
Region: And it shows the utility of the model.
Wallace: That’s right. It shows the value of the model because these were things that, you know, could not previously be talked about.

25 DECEMBER 2013
ReferencesBernanke, Ben S. 2006. “Monetary Aggregates and Monetary Policy at the Federal Reserve: A Historical Perspective.” Speech at the Fourth ECB Central Banking Conference, Frankfurt, Germany, Nov. 10.
Friedman, Milton. 1967. “The Monetary Theory and Policy of Henry Simons.” Journal of Law and Economics 10: 1-13.
Gale, Douglas. 1978. “The Core of a Monetary Economy without Trust.” Journal of Economic Theory 19: 456-91.
Kocherlakota, Narayana. 1998. “Money Is Memo-ry.” Journal of Economic Theory 81: 232-51.
Ostroy, Joseph M. 1973. “The Informational Efficiency of Monetary Exchange.” American Economic Review 63: 597-610.
Rolnick, Arthur J., and Warren E. Weber. 1990. “A Case for Fixing Exchange Rates.” 1989 Annual Report. Federal Reserve Bank of Minneapolis. minneapolisfed.org/publications_papers/pub_display.cfm?id=677
Sims, Christopher A. 2013. “Paper Money.” American Economic Review 103: 563-84.
Townsend, Robert M. 1989. “Currency and Credit in a Private Information Economy.” Journal of Political Economy 97: 1323-44.
Wallace, Neil. 2008. “Fiat Money.” In The New Palgrave Dictionary of Economics, 2nd ed., edited by Steven N. Durlauf and Lawrence E. Blume.
Wallace, Neil (author), Manjong Lee and Tao Zhu. 2005. “Modeling Denomination Structures.” Econometrica 73: 949-60.

SEPTEMBER 2012
Research Digest
DECEMBER 2013 26
Thomas Holmes Ellen McGrattan Edward Prescott
This Research Digest discusses two recent papers by Minneapolis Fed economists. The first research paper is by Fed economists Thomas Holmes, Ellen McGrattan and Edward Prescott, who look to China’s technology transfer policy for the explanation behind small flows of foreign direct investment between China and the United States, Japan and Europe. China benefits significantly from its quid pro quo requirement, find the economists, but its trading partners suffer losses—a result consistent with observations of small investment flows.
The second piece of research, by Elena Pastorino, examines the mechanisms that determine patterns in pay and job promotions within firms, and reveals the long-term interplay of skill acquisition and learning about worker ability behind career advancement and compensation growth.
Quid pro quo: Technology capital transfers for market access in ChinaForeign direct investment (FDI) flows between China and technologically advanced countries are surprisingly small. Why is this so? This digest looks at this issue in light of China’s quid pro quo policy that makes technology transfer a precondition of foreign firms selling in China. Minneapolis Fed economists Thomas Holmes, Ellen McGrattan and Edward Prescott find that the policy provides significant gains for China, but losses to its FDI partners.

Research Digest
SEPTEMBER 2012 DECEMBER 201327
Evidence for the mechanismQuid pro quo is a precondition for many multinationals to operate in China. Prior to China’s accession to the World Trade Organization, the policy was explicit (Walsh 1999). After accession, which prohibits technology transfer requirements for market access, quid pro quo became implicit policy, according to surveys of multinationals. For example, in its 2012 survey of members, the U.S.-China Business Council found that “85 percent of companies report that they are at least somewhat concerned about transferring tech-nology to China” and “36 percent of respondents indicated they were asked in the past three years to make such a transfer as a requirement for gaining an investment, project, product or market entry approval” (U.S.-China Business Council 2012).
We provide new evidence about the terms of quid pro quo from pat-ents filed in China by joint ventures (patents that list the name of both a foreign multinational firm and a lo-cal Chinese partner). We find from these examples that joint owner-ship of ideas within China does not extend outside China.
technology to the local partner, ensuring that the Chinese firm has ownership rights within China, though not abroad. In particular, if the Chinese partner attempts to sell goods based on this technology in the United States, GE will enforce its ownership rights in the United States to keep the Chinese company out.
This mechanism is at least qualitatively consistent with the observation of small bilateral FDI flows between advanced countries and China. The technology transfer requirement acts like a tax, making China a less attractive investment for a high-tech company like GE. Hence, inflows from advanced nations are lower than they would be otherwise. However, even these diminished transfers cumulate over time. We estimate significant total amounts transferred over the past 20 years.
The mechanism is also consistent with small outflows from China, es-pecially to countries like the United States. If Chinese partners tried to sell in the United States, U.S. com-panies would use their ownership rights on the technology to block Chinese partners.
Over the past two decades, China’s economy has grown
rapidly and the nation has become a major destination for foreign direct investment. Surprisingly, however, relatively little of China’s FDI inflow comes from technologically ad-vanced, dominant players in global investment, such as the United States, Europe and Japan (Prasad and Wei 2007 and Branstetter and Foley 2010). Moreover, while there has been an explosion of patenting in China by domestic applicants, FDI outflows from China to the United States, Europe and Japan remain small.
In recent research published as Minneapolis Fed Staff Reports 486-488, we highlight the importance of China’s quid pro quo policy in un-derstanding these FDI flows. Quid pro quo is a long-standing policy of China requiring foreign firms to transfer technology to China in return for access to its market. We estimate that China has enjoyed significant gains from this policy, at the expense of countries doing FDI in China.
A key feature of quid pro quo deals is that typically the property rights being exchanged in a technol-ogy transfer transaction apply inside China, not outside. For example, GE might agree to a joint venture in China with a local partner in return for access to the Chinese market. GE will likely be required to transfer
A key feature of quid pro quo deals is that typically the property rights being exchanged in a technology transfer transaction apply inside China, not outside. For example, GE might agree to a joint venture in China with a local partner in return for access to the Chinese market.

Research Digest
SEPTEMBER 2012DECEMBER 2013 28
ing out the implications of an eco-nomic model because much of what is transferred from multinationals to Chinese partners—something we call technology capital—is difficult to measure directly.
Technology capital is nonrival-rous capital that can be used across locations; once a firm makes an investment in technology capital in its home country, it can take that technology capital to other markets as countries open up to FDI inflows. Examples include accumulated know-how from investments in R&D, brands and organizations that are not specific to any one establish-ment or location. For the most part, these investments are not included in national accounts, but magnitudes can be inferred if we assume that
cases (87 percent), the Chinese firm that is a co-owner of the patent in China is dropped from the owner-ship list in the patent that goes outside China.
As one example, for the joint venture between telecommunica-tions multinational Alcatel-Lucent and Chinese firm Shanghai Bell, 97 of their jointly owned patents went outside China in the form of WIPO applications. Nearly all (92) of those applications specified that Shanghai Bell shared ownership only in China, with Alcatel-Lucent the sole owner in all other countries.
Quantitative impact of quid pro quo policyInferring the quantitative impact of quid pro quo policy requires work-
In the accompanying table, we analyze a sample of patents that were first filed in China. Column 1 shows the percentages of these patents that link outside China, as listed by owner. Row 1 considers patents jointly owned by a foreign multina-tional and a domestic partner. Row 2 shows patents owned by 114 large foreign multinationals, as ranked by domestic Chinese sales. Row 3 is for patents of the top 100 Chinese patenters.
We ask two questions about these patents. First, do the patents go out-side China? We measure this by de-termining whether the same patent in China also has been filed as either a U.S. patent application or a World Intellectual Property Organization (WIPO) application. Second, in cases where patents go outside, are the Chinese firms included in the owner list on the outside applications?
In terms of the first question, we find that the fraction of jointly owned patents first filed in China that go outside is only 1.5 percent. In contrast, 10.1 percent of the Chinese patents owned by the foreign mul-tinationals and 16.5 percent owned by the top Chinese patenters are also linked to patent applications outside China. Thus, there is a striking difference between patents that are shared and those that are not shared.
As to the second question, we find that of the patents shared in China that do go outside, in most
Patents first filed in China, by owner, 2005-10
Owners Patent goes outside Goes outside with China? (%) Chinese name? (%)Jointly owned 1.5 0.2
Foreign multinationals 10.1 0
Top Chinese patenters 16.5 16.5
Notes. The sample of foreign multinationals is constructed from the top 500 foreign affiliates in 2007, ranked by domestic sales in China. After consolidating business units of the same firms and excluding firms from Taiwan, we are left with 114 large foreign multinationals. The sample of Chinese firms is the top 100 domestic patenters. Only invention patents are included. A patent “goes outside China” if it has also been filed as either a U.S. or WIPO patent application. A patent goes outside “with a Chinese name” if the Chinese firms are included in the owner list on the outside application.
There are 10,075 jointly owned patents, 12,446 patents first filed in China that are owned by multinationals and 79,518 patents of the top Chinese patenters. See Holmes, McGrattan and Prescott (2013) for details.
Research Digest
SEPTEMBER 2012 DECEMBER 201329
multinationals invest only to the degree that it is profitable to do so.
We incorporate technology capital and its potential transfer through quid pro quo arrangements into a multicountry model that includes China, the United States, Europe, Japan and other countries that have significant investments in China. We assume that the quid pro quo arrangements restrict property rights outside China.
We then compare a version with the policy to a version without it. In both versions, parameters are chosen so that predictions about country gross domestic products (GDPs) and total inward foreign investments match magnitudes and trends seen in the data.
There are two main findings. First, we find that even though FDI flows into China have been small from the United States, Europe and Japan, the model predicts a signifi-cant volume of foreign technology capital is accumulated by China over the period 1990-2010, with
ReferencesBranstetter, L., and C. F. Foley. 2010. “Facts and Fallacies about U.S. FDI in China.” In China’s Growing Role in World Trade, edited by R. C. Feenstra and S.-J. Wei. Chicago: University of Chicago Press.
Holmes, T. J., E. R. McGrattan and E. C. Prescott. 2013. “Quid Pro Quo: Technology Capital Transfers for Market Access in China.” Research Department Staff Reports 486-488, Federal Reserve Bank of Minneapolis.
Prasad, E., and S.-J. Wei. 2007. “The Chinese Approach to Capital Inflows: Patterns and Possible Explanations.” In Capital Controls and Capital Flows in Emerging Economies: Policies, Practices, and Consequences, edited by S. Edwards. Chicago: University of Chicago Press.
U.S.-China Business Council. 2012. USCBC 2012 China Business Environment Survey Results and Supplement, uschina.org.
Walsh, K. A. 1999. “U.S. Commercial Technology Transfers to the People’s Republic of China, A Report to the Office of Strategic Industries and Economic Security.” Bureau of Export Administration, bis.doc.gov.
the stock at close to three times the capital stock arising from invest-ments in technology capital made by domestic Chinese firms.
Second, we find that the welfare gains of following the policy have been high for China, about 4.5 percent per year in annual con-sumption. In contrast, for countries that invest in China, the policy has led to welfare losses when compared with the alternative case in which technology transfer is not a precon-dition to investing in China. For
Technology capital is nonrivalrous capital that can be used across locations; once a firm makes an investment in technology capital in its home country, it can take that technology capital to other markets as countries open up to FDI inflows.
example, U.S. and European losses are around -0.5 percent per year in annual consumption with a quid pro quo requirement in place.
It is no surprise, then, that China continues to promote quid pro quo policy, at least implicitly, while other nations insist that it be prohibited.
—Thomas Holmes, Ellen McGrattan and Edward Prescott
(Editor’s note: A version of this Research Digest appears on voxeu.org.)

SEPTEMBER 2012
Research Digest
DECEMBER 2013 30
Elena Pastorino
The office as proving groundWhat jobs reveal about workers’ abilities affects career-long earnings
The fortunes of individuals often diverge in the modern work-
place. Some workers ride an elevator from the cubicle up to the execu-tive suite, garnering big pay raises along the way. Other seemingly similar workers take a slower career path, marked by lateral moves and incremental wage increases. The least fortunate suffer demotions and terminations.
Differences in career paths and wage growth—why some work-
further into the dynamics of career advancement and compensation.
In “Careers in Firms: Estimating a Model of Learning, Job Assign-ment, and Human Capital Acquisi-tion” (Minneapolis Fed Staff Report 469, online at minneapolisfed.org), Pastorino shows how two processes—acquiring new skills and learning about workers’ abilities—intertwine to determine pay and promotion patterns in firms. Both are key to understanding aspects of labor markets such as varying levels of career attainment, worker turnover and wage inequality.
Her model, based on the career experiences of U.S. workers, highlights the role of learning. She finds that learning about ability substantially affects wages, primarily through job changes—the positions workers are assigned to by employ-ers at various points in their careers. A job is not just a means of produc-ing goods and services; it’s a testing ground for workers that helps determine future earnings.
Two types of learningOne factor that affects the earning potential of workers is the accumu-lation of productive knowledge—economists call it human capital. Some workers acquire more human capital through experience or train-ing than others and are rewarded with pay raises and promotions.
But many researchers believe
Acquiring new skills and learning about workers’ abilities intertwine to determine pay and promotion patterns in firms. Both are key to understanding aspects of labor markets such as varying levels of career attainment, worker turnover and wage inequality.
ers in a particular firm or industry advance further and earn higher pay over the course of their working lives than their peers—have long intrigued labor economists. Thirty years of research indicates that it’s not simply a matter of merit or seniority being rewarded. Recent research by Elena Pastorino, a visit-ing scholar at the Federal Reserve Bank of Minneapolis and a recently appointed assistant professor at the University of Minnesota, delves

Research Digest
SEPTEMBER 2012 DECEMBER 201331
perform required duties, although college grades, job references and other credentials establish baseline beliefs. If the worker performs well in a low-level job, supervisors gain confidence in his or her capabilities, and pay raises and promotions fol-low. An employee perceived as tal-ented may also opt to leave the firm for a higher-paying job elsewhere.
Alternatively, one who demon-strates scant ability does not ascend
set, Pastorino attempts to identify these mechanisms and quantify the respective effects of learning and human capital acquisition. “If we want to look seriously at which process of information acquisition can explain what we see in the data, we have to understand what hap-pens at the firm level,” she said in an interview.
In her model, the behavior of workers and firms plays out ac-
that human capital alone isn’t a sufficient explanation for why one worker fares better than another with similar education and skills. For example, some workers contin-uously employed by the same firm experience pay cuts despite their years of experience. And workers frequently switch firms, sacrificing firm-specific knowledge.
Since the 1970s, economists such as Boyan Jovanovic (now at New York University) have posited another type of learning that influ-ences career paths and wages.
In addition to human capital, workers (and their employers) gather information capital—knowl-edge about which tasks and jobs are best suited to workers’ abilities. A worker’s productivity is revealed gradually, by performance on the job. Those who prove themselves worthy contributors to a firm’s bot-tom line receive higher wages and promotions.
Assessing the impact of informa-tion capital on careers and wages is difficult; learning entails not only complex interactions between work-ers and firms, but also among firms competing for labor. Measuring the effect of these interactions requires detailed information about the experiences of individual workers—the jobs they hold, how well they perform them and the wages they earn during their careers.
Drawing on just such a rich data
One factor that affects the earning potential of workers is the accumulation of productive knowledge—economists call it human capital. Some workers acquire more human capital through experience or training than others and are rewarded with pay raises and promotions.
cording to rules estimated from personnel data of an anonymous U.S. company in a service industry. The records chronicle the career progress of the firm’s individual managers (also unnamed) over 20 years, beginning in the late 1960s. To account for the pattern of promotions and wages in the data, the model assumes that workers in-crease their stock of human capital over time. Then it incorporates the concept of learning, the feeling-out process that occurs between work-ers and firms.
When a worker is first hired, neither the worker nor the firm is sure about that individual’s ability to
the pay scale or the corporate ladder. The worker may leave the firm—ei-ther voluntarily or with pink slip in hand—to take a lower-paying posi-tion requiring less skill.
Experimenting with jobsBy integrating learning with human capital acquisition, the model repro-duces the main patterns seen in the personnel data, including features that cannot be explained by human capital alone— in particular, wage decreases even for some long-time employees.
A key finding of Pastorino’s research is that learning accounts for more than one-quarter of wage
Research Digest
SEPTEMBER 2012DECEMBER 2013 32
making for more productive job matches and faster wage increases later on. (In a subsequent paper, Pastorino shows that the large pay raises that often accompany promo-tions are in part compensation for the lower information value of higher-wage jobs.)
Pastorino doesn’t dispute the strong influence of human capital acquisition on promotions and wages. It’s responsible for the bulk of wage growth and explains why rela-tively few workers are demoted or fired: Firms value the accumulated know-how of even poor-performing employees. But her work focuses attention on a vital process—dis-counted by many researchers—by which firms find suitable workers and workers find jobs commensu-rate with their talents.
“Learning about ability does matter,” she said. “Previous research found conflicting evidence on the importance of learning for career attainment and wage growth. I hope my work encourages other researchers, using the latest data and techniques, to reexamine the impact of learning on wages and careers.”
— Phil Davies
growth over the first seven years of employment, with the remainder due to increased human capital. Virtually all the impact of learn-ing on wages comes through job changes—promotions—rather than wage changes at a given job level. The learning process leads capable workers to advance more quickly to higher-level positions that pay higher wages. “Where learning really matters is in determining the kind of job that you’re assigned to, based on the information that is revealed about you,” Pastorino said.
The converse is also true: Job as-signment has a bearing on learning, because some jobs are more infor-mative than others. Another impor-tant finding of her research is the extent to which firms experiment by assigning workers to jobs that are most likely to reveal ability. Certain entry-level jobs, for example, may not contribute much in terms of firm profitability, but they provide insight into important attributes such as discipline and communica-tion skills that are also important to productivity in higher positions.
In the Pastorino model, workers assigned to low-paying jobs remain at that level for up to five years after joining a firm—consistent with the wage data and the personal experi-ences of many workers just starting out. The payoff for this arrested advancement—for both worker and firm—is greater insight into ability,
“Where learning really matters is in determining the kind of job that you’re assigned to, based on the information that is revealed about you,” Pastorino said.

Virtual Fed
The stuff of legends
Not long ago, many thought geography was a dead discipline. The Age of Exploration was over, and every corner of the earth had been charted. But with the proliferation of geographically detailed data from the government and other sources, along with the continued development of computer graphics, something of a mapping renaissance has emerged.
Federal Reserve Banks have gotten in on the action, rolling out interactive data-mapping tools, a few of which have been featured by Virtual Fed. Map Your Community is another one that’s too good to overlook. To create it, the Richmond Fed’s Community Development department teamed up with PolicyMap, a web-based mapping firm that produces tools to monitor economic and financial indicators of communities.
On its Map Your Community site, the Richmond Fed has packaged maps to focus on states in its district, but the last tab covers the entire United States down to county or census tract levels, and color legends tell the data tale. The site’s goal is to help businesses, banks, investors and community development organizations make more informed decisions, but it’s also helpful (and user-friendly) for those who want to know more about where they live.
For more, navigate your way to: richmondfed.org/community_development/resource_centers/data_mapping/index.cfm.
—Joe Mahon
December 201333