The Phillips Curve
7
Chapter 17 Copyright ©2010 by South-Western, a division of Cengage Learning. All rights reserved 1 The Phillips Curve LO 4 Inverse relationship – Unemployment rate – Rate of change in nominal wages (inflation) Short-run Phillips curve Long-run Phillips curve
-
Upload
kenyon-lane -
Category
Documents
-
view
44 -
download
2
description
The Phillips Curve. Inverse relationship Unemployment rate Rate of change in nominal wages (inflation) Short-run Phillips curve Long-run Phillips curve. LO 4. Exhibit 5. LO 4. Hypothetical Phillips Curve. c. b. a. d. - PowerPoint PPT Presentation
Transcript of The Phillips Curve
Chapter 17 Copyright ©2010 by South-Western, a division of Cengage Learning. All rights reserved 1
The Phillips Curve
LO4
Inverse relationship– Unemployment rate– Rate of change in
nominal wages (inflation) Short-run Phillips curve Long-run Phillips curve
Chapter 17 Copyright ©2010 by South-Western, a division of Cengage Learning. All rights reserved 2
Hypothetical Phillips Curve
c
d
a
b
Phillips curve
Unemployment rate (percent)5 100
5
10
Infla
tion
rate
(pe
rcen
t ch
ange
in p
rice
leve
l)
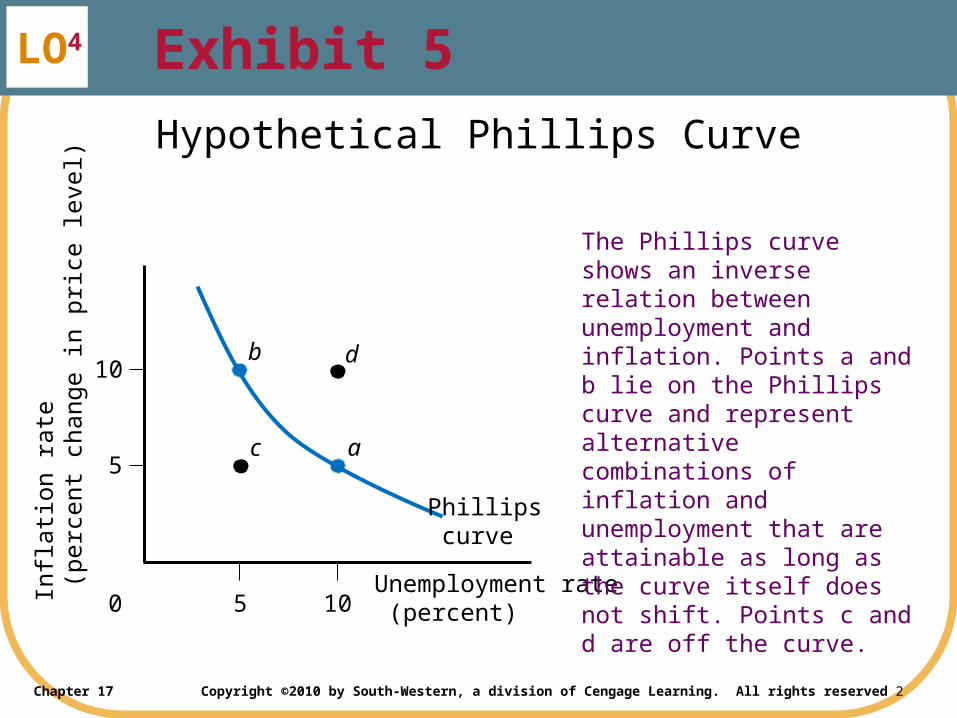
The Phillips curve shows an inverse relation between unemployment and inflation. Points a and b lie on the Phillips curve and represent alternative combinations of inflation and unemployment that are attainable as long as the curve itself does not shift. Points c and d are off the curve.
LO4
Exhibit 5
Chapter 17 Copyright ©2010 by South-Western, a division of Cengage Learning. All rights reserved 3
The Short-Run Phillips Curve
LO4
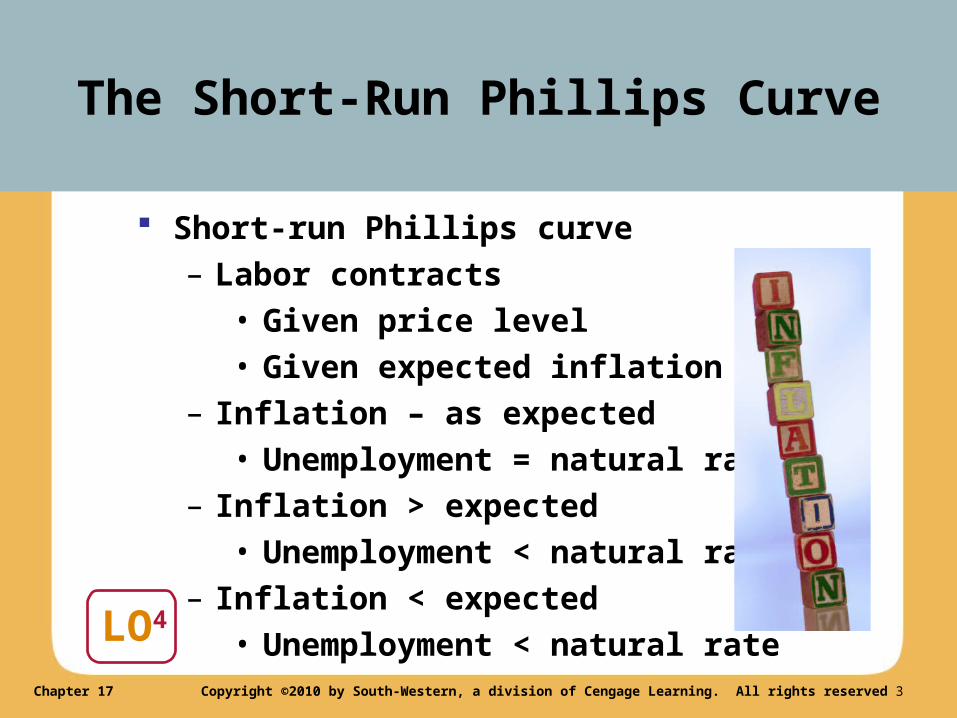
Short-run Phillips curve– Labor contracts
• Given price level• Given expected inflation
– Inflation – as expected• Unemployment = natural rate
– Inflation > expected• Unemployment < natural rate
– Inflation < expected• Unemployment < natural rate
Chapter 17 Copyright ©2010 by South-Western, a division of Cengage Learning. All rights reserved 4
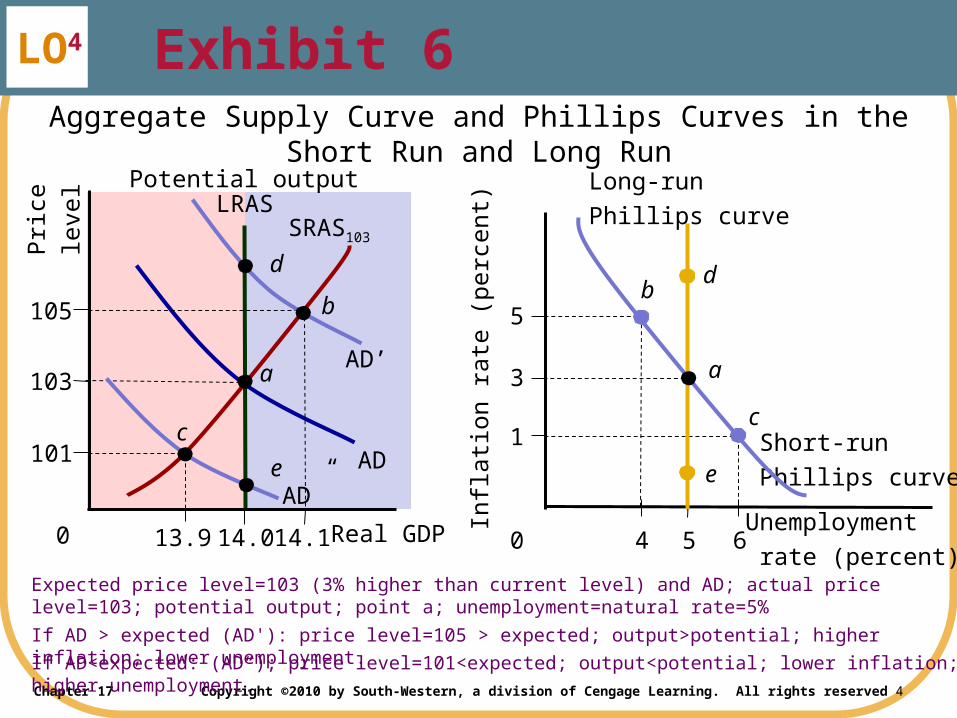
Aggregate Supply Curve and Phillips Curves in the Short Run and Long Run
Expected price level=103 (3% higher than current level) and AD; actual price level=103; potential output; point a; unemployment=natural rate=5%
If AD > expected (AD'): price level=105 > expected; output>potential; higher inflation; lower unemployment.
If AD<expected: (AD“); price level=101<expected; output<potential; lower inflation; higher unemployment.
LO4
Exhibit 6
AD
Potential outputLRAS
Pric
e
leve
l
103
105
101
Real GDP0 14.0 14.113.9
SRAS103
aAD’
b
AD”
c
d
e
3
5
Infla
tion
rate
(pe
rcen
t)
1
Unemployment
rate (percent)4 60 5
Short-run
Phillips curve
d
e
Long-run
Phillips curve
a
c
b
Chapter 17 Copyright ©2010 by South-Western, a division of Cengage Learning. All rights reserved 5
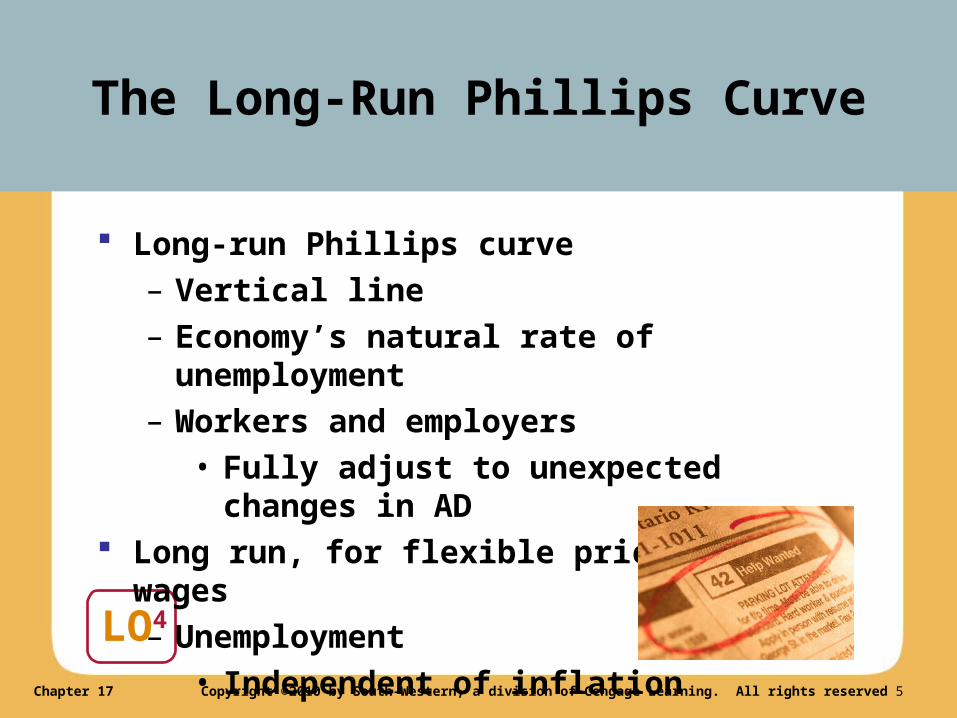
The Long-Run Phillips Curve
LO4
Long-run Phillips curve– Vertical line– Economy’s natural rate of unemployment– Workers and employers
• Fully adjust to unexpected changes in AD Long run, for flexible prices and wages
– Unemployment• Independent of inflation
Chapter 17 Copyright ©2010 by South-Western, a division of Cengage Learning. All rights reserved 6
The Natural Rate Hypothesis
LO4
Long run– Natural rate of unemployment
• Independent of AD stimulus• Fiscal policy
• Monetary policy Optimal policy in long run
– Results in low inflation
Chapter 17 Copyright ©2010 by South-Western, a division of Cengage Learning. All rights reserved 7
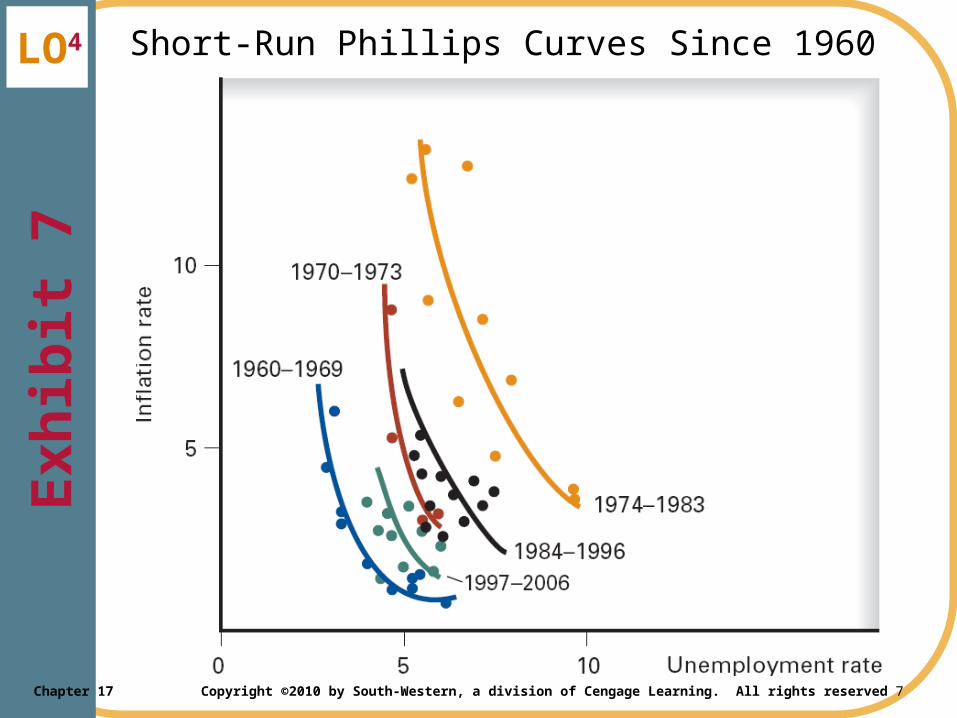
Short-Run Phillips Curves Since 1960LO4
Exhibit 7