NCSX Vacuum Vessel Stress Analysis FDR Fred Dahlgren 17 May 2004.
62
NCSX Vacuum Vessel Stress Analysis FDR Fred Dahlgren 17 May 2004
-
Upload
edith-baldwin -
Category
Documents
-
view
217 -
download
1
Transcript of NCSX Vacuum Vessel Stress Analysis FDR Fred Dahlgren 17 May 2004.

NCSX Vacuum Vessel
Stress Analysis FDRFred Dahlgren
17 May 2004

NCSX Vacuum VesselStress Analysis - FDRNCSX Vacuum VesselStress Analysis - FDR
Fred Dahlgren
Art Brooks
Peter Titus
NCSX Final Design Review
May 19-20, 2004
PPPL
Fred Dahlgren
Art Brooks
Peter Titus
NCSX Final Design Review
May 19-20, 2004
PPPL
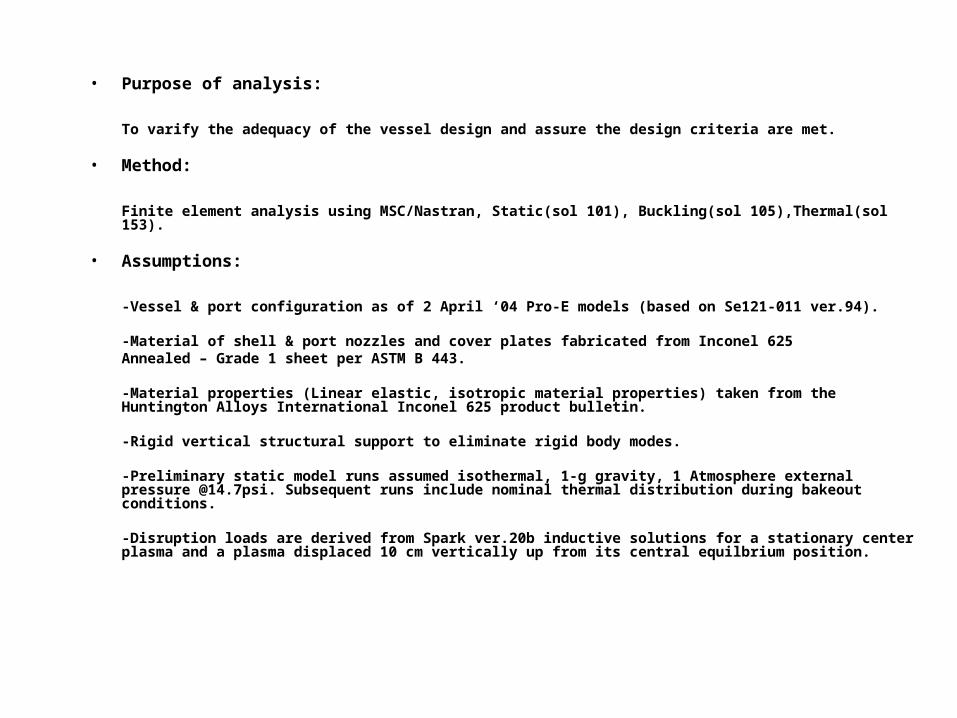
• Purpose of analysis:
To varify the adequacy of the vessel design and assure the design criteria are met.
• Method:
Finite element analysis using MSC/Nastran, Static(sol 101), Buckling(sol 105),Thermal(sol 153).
• Assumptions:
-Vessel & port configuration as of 2 April ‘04 Pro-E models (based on Se121-011 ver.94).
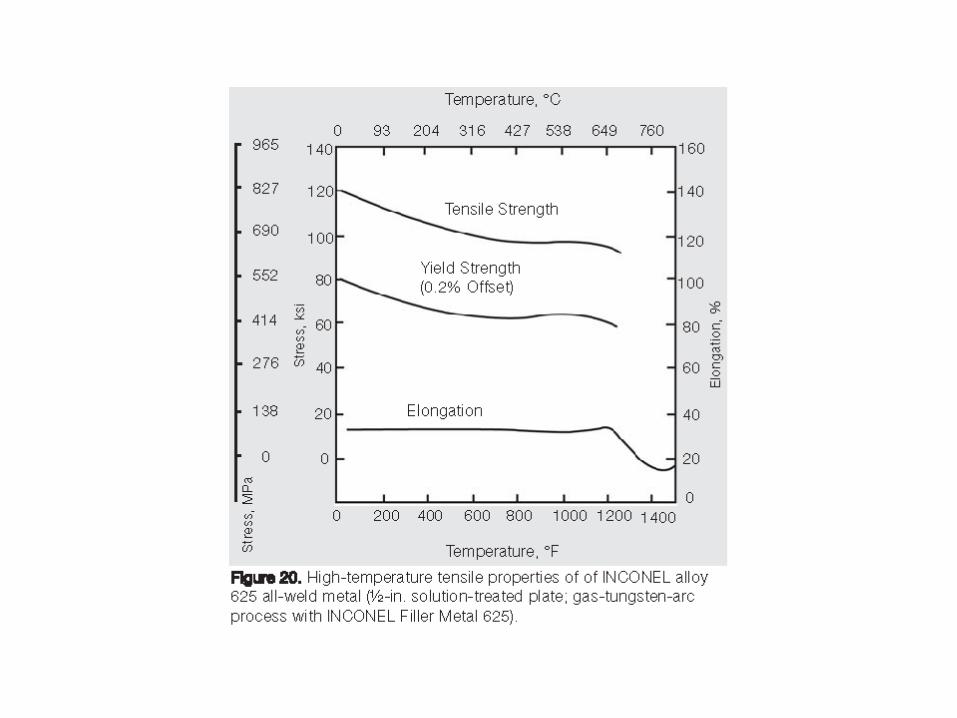
-Material of shell & port nozzles and cover plates fabricated from Inconel 625 Annealed – Grade 1 sheet per ASTM B 443.
-Material properties (Linear elastic, isotropic material properties) taken from the Huntington Alloys International Inconel 625 product bulletin.
-Rigid vertical structural support to eliminate rigid body modes.
-Preliminary static model runs assumed isothermal, 1-g gravity, 1 Atmosphere external pressure @14.7psi. Subsequent runs include nominal thermal distribution during bakeout conditions.
-Disruption loads are derived from Spark ver.20b inductive solutions for a stationary center plasma and a plasma displaced 10 cm vertically up from its central equilbrium position.

• Material Properties(@ 200 deg.C - 392 deg.F):-Youngs Modulus 28.7e6 psi-Shear Modulus 11.1e6 psi-Poissons’ Ratio 0.286-Density 0.305 lbs/cu. in.-Coeff. of Thermal Exp. 7.3e-6 in./in.-deg.F
• Material Properties (@ 400 deg.C – 750 deg.F):-Youngs Modulus 27.1e6 psi-Shear Modulus 10.5e6 psi-Poissons’ Ratio 0.294-Density 0.305 lbs/cu. In.-Coeff. of Thermal Exp. 7.6e-6 in./in.-deg.F
(From Huntington Alloys/Specialty Metals publication for Inconel 625)

Values from Pro-E Model used
Material Thicknesses & port diameters for VV model ( inches):Part Thickness diameterShell 0.375Port 2 0.125Port 3 0.125Port 4 0.500Port 6 0.250Port 7 0.125Port 8 0.125Port 9 0.125Port 10 0.125Port 11 0.125Port 12 0.500Port 15 0.125RF-Turret 0.188*Port 17 0.125Port 18 0.125
Main Flange Dimensions: 0.65 wide x 0.85 deep, 0.375 weld

Model Details:38,906 DOF’s7782 GRID POINTS7,228 CQUAD41,018 CTRIA340 MPC’s4 SPC’s
Boundary Conditions:Cylic-Symmetry @ welded edgevia MPC’s, vertically fixed @ topclevis, circumferentially top & bot.of NB port
Normal Operating Loads:Uniform external 14.7 psiGravity – 1gTemperature 200 deg.C (max.)Bakeout: 400 deg.C (max)
Off-Normal (EM Disruption) Loads:320kA Plasma @ 1.7T210kA Plasma @ 2.0T (High Beta)320kA Plasma @ 1.7T @dZ=10cm(Inductively coupled solutions)
MPC’s (cyclic-symm.)
NCSX VACUUM VESSEL NASTRAN 120 DEG. FEA MODEL

DISPLACEMENTS FOR 1 ATMOSPHERE LOADINGRun 120bbe3: 1 Atmosphere External Pressure Only

Peak Shell Displacement .125”
Run 120bbe3: 1 Atmosphere External Pressure Only

Peak Tresca Stress @ Vertical Restraint 18 ksi
Run 120bbe3: 1 Atmosphere External Pressure Only

Peak Tresca Stress@Outer Surface Z215.2 ksi
Run 120bbe3: 1 Atmosphere External Pressure Only

Run 120bbe3: Tresca Stresses in the flange and weld areas are 1 to 7 ksi

Attempts to stiffen the shell locally – not very effective
Added 2 Ribs .5 x 1” high Added 3rd Rib .5 x 1” high

Peak shell deflection 0.085 for 0.5” thk. Shell & 1 Atmosphere Load

Run 120bbe3g – 1 Atmosphere External Pressure + 1g Gravity Loading

Added internal reinforcing Tee ribs
Max. displacements less than 0.088”
Port-9
Port-2
Shell Reinforcement
1” typ.
0.375
Run 120bbe2a-tribsf
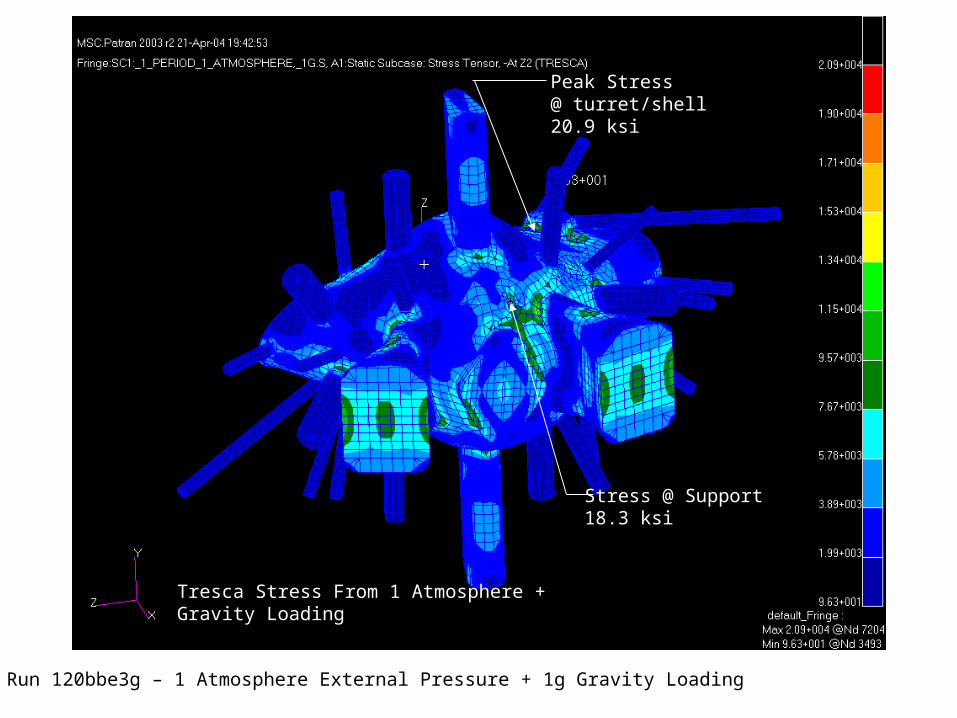
Tresca Stress From 1 Atmosphere + Gravity Loading
Stress @ Support18.3 ksi
Peak Stress@ turret/shell20.9 ksi
Run 120bbe3g – 1 Atmosphere External Pressure + 1g Gravity Loading
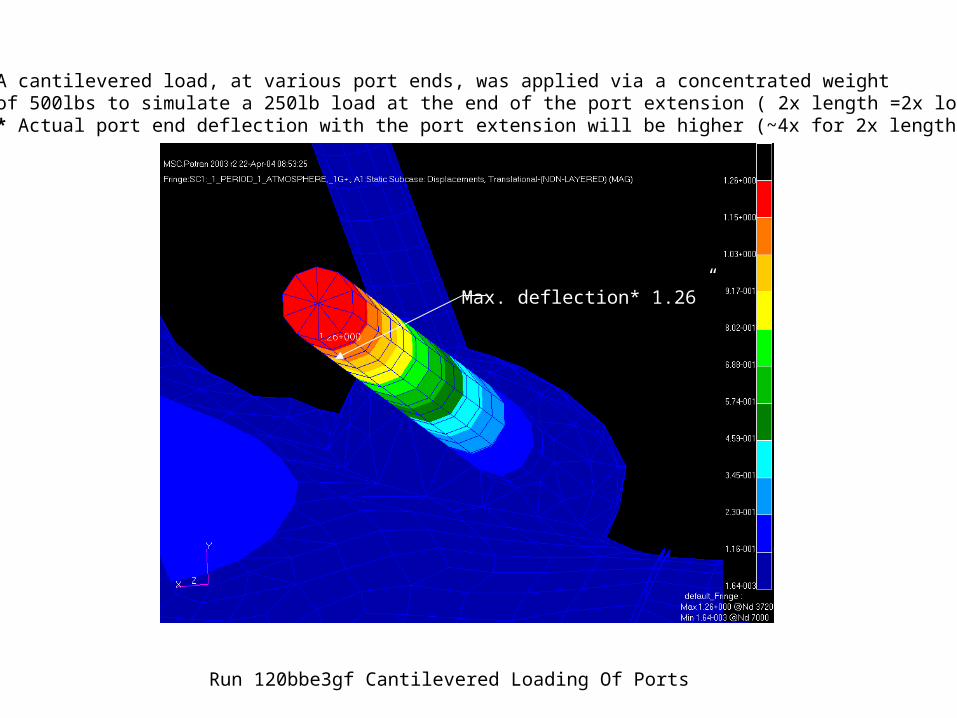
A cantilevered load, at various port ends, was applied via a concentrated weightof 500lbs to simulate a 250lb load at the end of the port extension ( 2x length =2x load)* Actual port end deflection with the port extension will be higher (~4x for 2x length).
Max. deflection* 1.26”
Run 120bbe3gf Cantilevered Loading Of Ports

Outer Surface (Z2) Tresca Stress From 500lb Cantilevered Load on Port Ends
34.2ksi Tresca Stress
Run 120bbe3gf – 1 Atmosphere External Pressure + 1g Gravity Loading + 500lbs cantilevered

Inner Surface Tresca Stress 46.8 ksiDue To 500lb Cantilevered Load @ port18/turret intersection
Run 120bbe3gf – 1 Atmosphere External Pressure + 1g Gravity Loading + 500lbs cantilevered
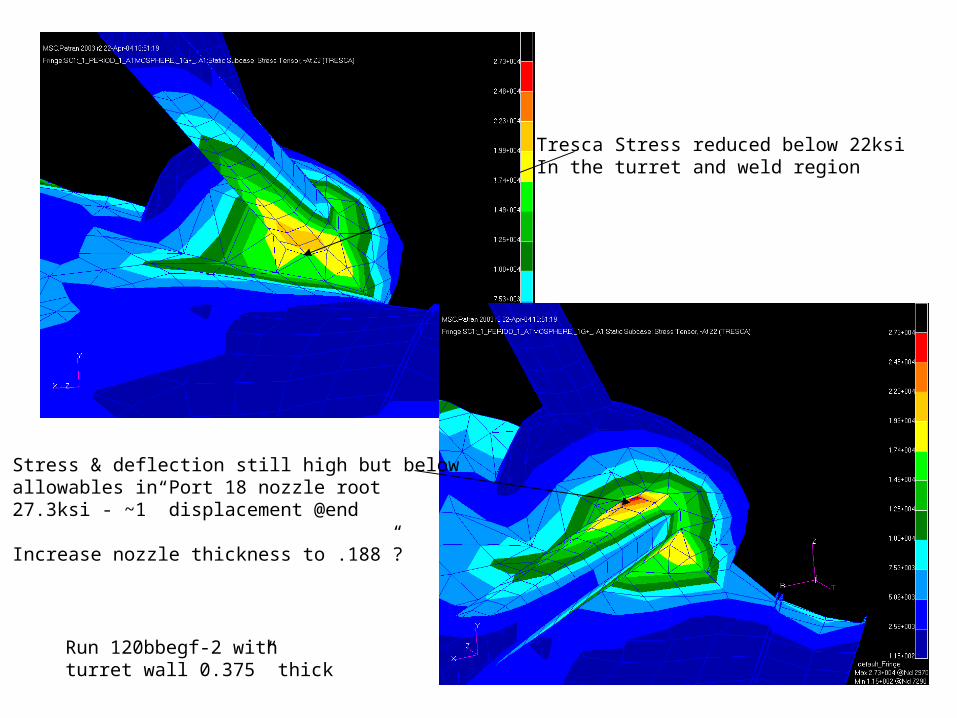
Tresca Stress reduced below 22ksiIn the turret and weld region
Stress & deflection still high but belowallowables in Port 18 nozzle root27.3ksi - ~1” displacement @end
Increase nozzle thickness to .188”?
Run 120bbegf-2 with turret wall 0.375” thick

Nominal bakeout temperature distribution: 400 deg.C uniform shell, 150 deg.C @ Port Flanges
Run 120bbe2a-Thermal4 – Steady State Bakeout
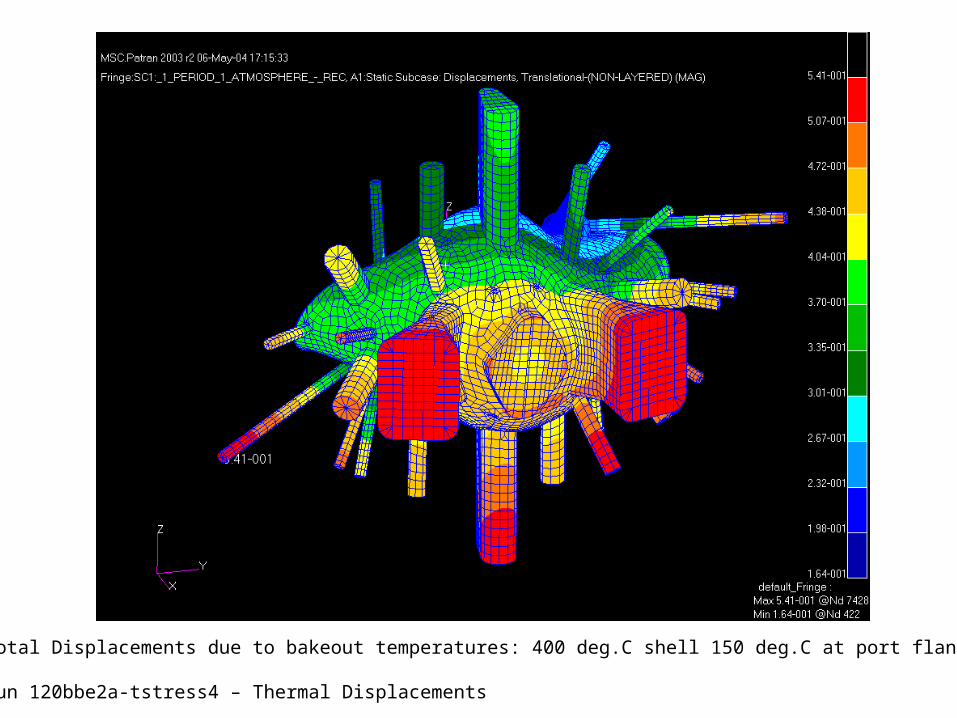
Total Displacements due to bakeout temperatures: 400 deg.C shell 150 deg.C at port flanges
Run 120bbe2a-tstress4 – Thermal Displacements

X-dir. Displacements due to bakeout temperatures: 400 deg.C shell 150 deg.C at port flanges
Run 120bbe2a-tstress4 – Thermal Displacements
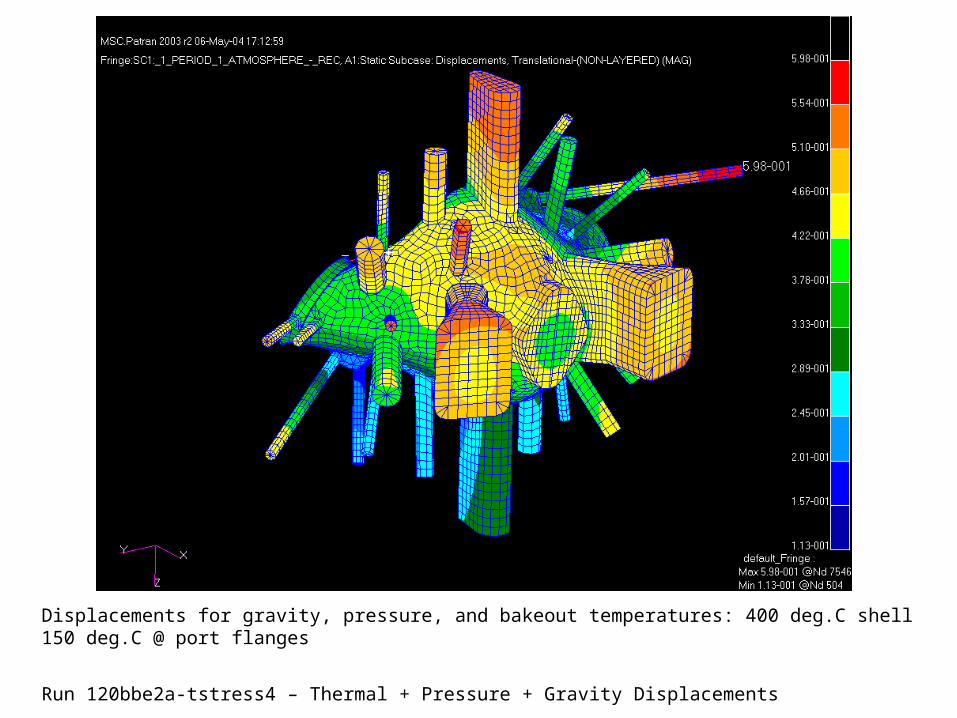
Displacements for gravity, pressure, and bakeout temperatures: 400 deg.C shell 150 deg.C @ port flanges
Run 120bbe2a-tstress4 – Thermal + Pressure + Gravity Displacements

Tresca Stress Z1 Inner Surface due to gravity, pressure, and bakeout temperatures,
400 deg.C shell 150 deg.C at port flanges
Run 120bbe2a-tstress4 – Thermal + Pressure + Gravity

Tresca Stress Z2 Outer Surface due to gravity, pressure, and bakeout temperatures, 400 deg.C shell 150 deg.C at port flanges
Run 120bbe2a-tstress4 – Thermal + Pressure + Gravity

Buckling Eigenvalue = 12.99 - for 1 Atmosphere loading
Run 120bbe3-buckle – Pre-load: 1 Atmosphere, Eigenvalue extraction method: Lanczos

Buckling mode shape local displacement between ports 9 & 2
Run 120bbe3-buckle

Poor CTRIA3 element orientation
Reoriented elements produced higher critical load factor ~ 15.7
Run 120bbe3-buckle
Run 120bbe2a-buckle
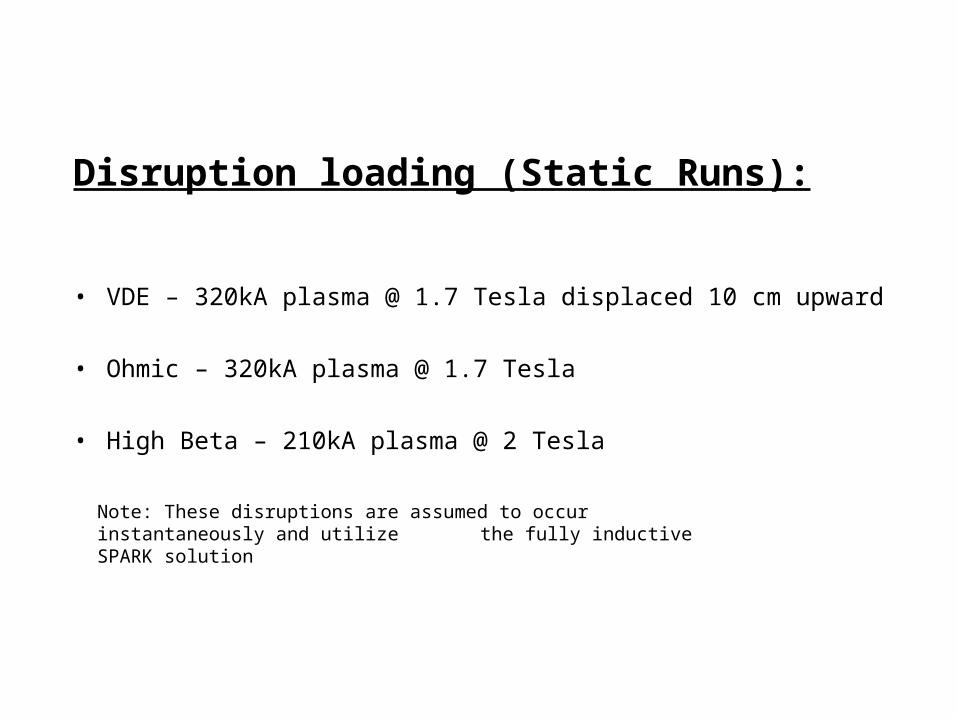
• VDE – 320kA plasma @ 1.7 Tesla displaced 10 cm upward
• Ohmic – 320kA plasma @ 1.7 Tesla
• High Beta – 210kA plasma @ 2 Tesla
Disruption loading (Static Runs):
Note: These disruptions are assumed to occur instantaneously and utilize the fully inductive SPARK solution

Force Distribution From VDE-UP(Self Forces) – 1.7 Tesla, 320kA Plasma Current Stationary @ 10cm

Force Distribution From VDE-UP(External Field Forces) – 1.7 Tesla, 320kA Plasma Current Stationary @ 10cm
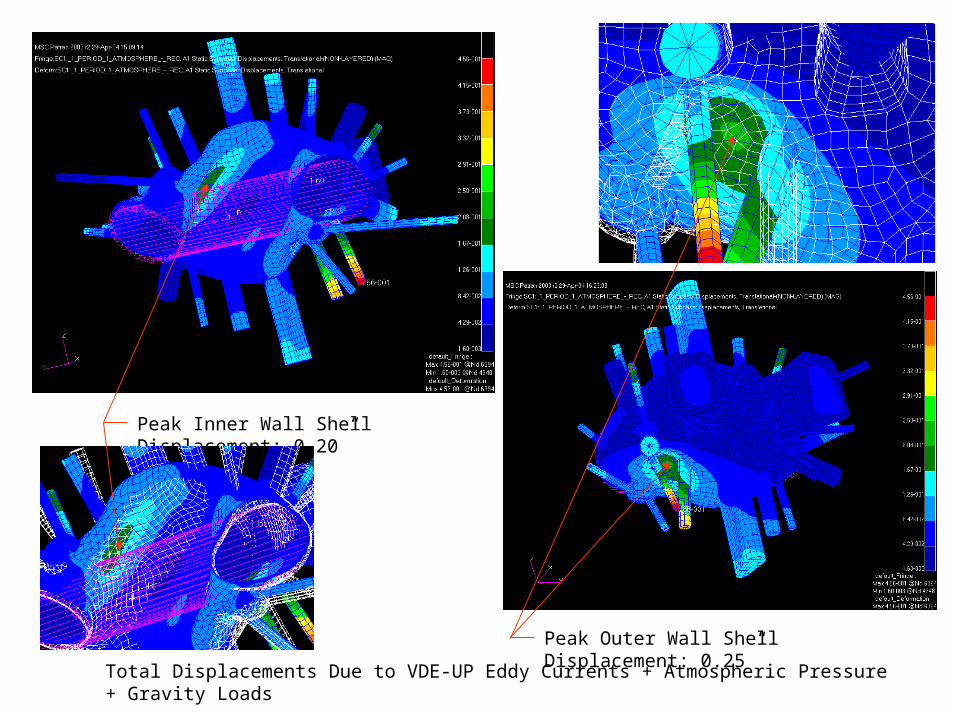
Total Displacements Due to VDE-UP Eddy Currents + Atmospheric Pressure + Gravity Loads
Run: 120bbe2a-VDE
Peak Inner Wall Shell Displacement: 0.20”
Peak Outer Wall Shell Displacement: 0.25”

Tresca Stresses-Z1 (outer) Shell Surface For VDE-UP Eddy Currents + Atmospheric Pressure + Gravity
Run: 120bbe2a-VDE
22.2 ksi Peak Stress17.6 ksi
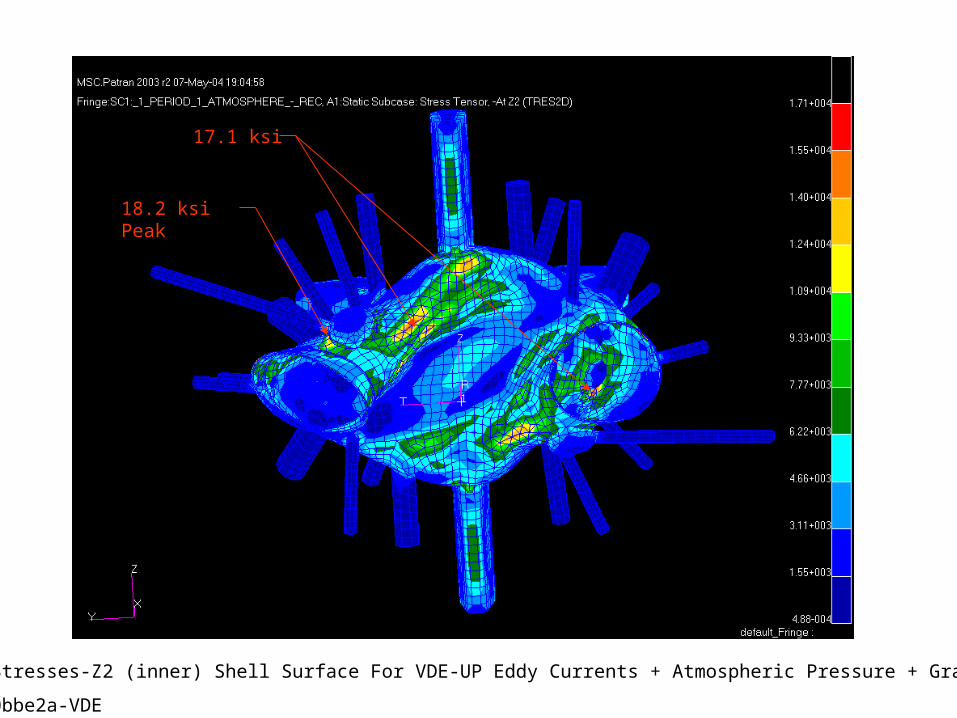
Tresca Stresses-Z2 (inner) Shell Surface For VDE-UP Eddy Currents + Atmospheric Pressure + Gravity
Run: 120bbe2a-VDE
17.1 ksi
18.2 ksi Peak

Peak Tresca Stresses-Z2 @ Flange For VDE-UP Eddy Currents + Atmospheric Pressure + Gravity
Run: 120bbe2a-VDE
Peak Stress 27.6ksi

Peak Tresca Stresses-Z1 @ Flange For VDE-UP Eddy Currents + Atmospheric Pressure + Gravity
Run: 120bbe2a-VDE
Peak Stress 22.2ksi

Force Distribution From OHMIC(Self Forces) – 1.7 Tesla, 320kA Plasma Current Stationary

Force Distribution From OHMIC (External Field Forces) – 1.7 Tesla, 320kA Plasma Current Stationary
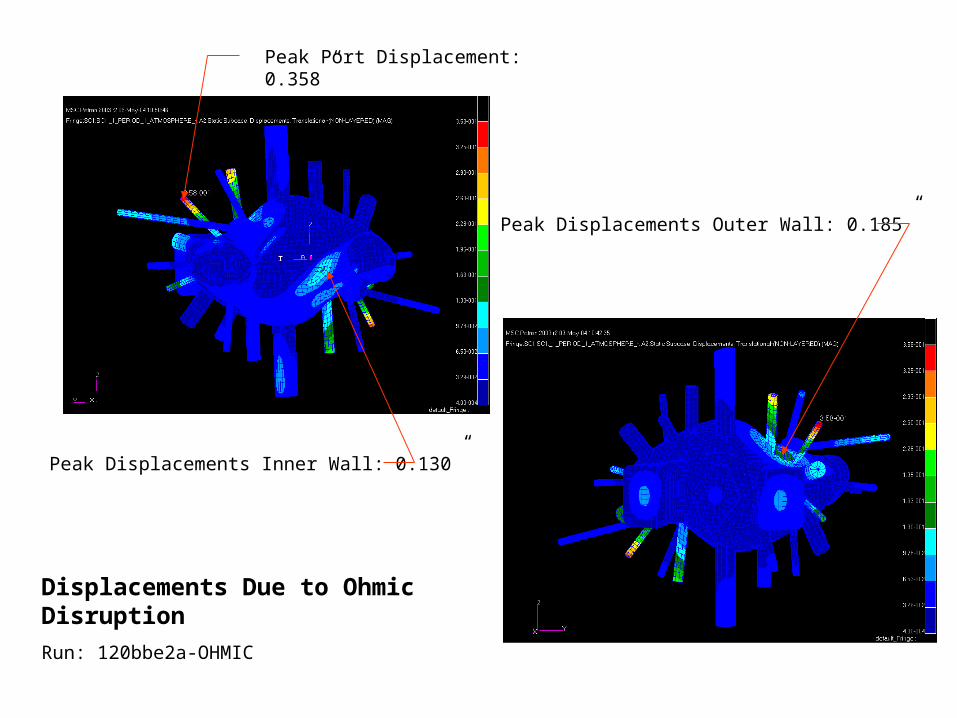
Peak Displacements Inner Wall: 0.130”
Displacements Due to Ohmic Disruption
Run: 120bbe2a-OHMIC
Peak Displacements Outer Wall: 0.185”
Peak Port Displacement: 0.358”

Tresca Stresses-Z1 (Outer) Surface For Ohmic Eddy Currents + Atmospheric Pressure + Gravity
Run: 120bbe2a-OHMIC
Peak Stress 13.6 ksi

Tresca Stresses-Z2 (inner) Surface For Ohmic Eddy Currents + Atmospheric Pressure + GravityRun: 120bbe2a-OHMIC
Peak Stress
16.1 ksi
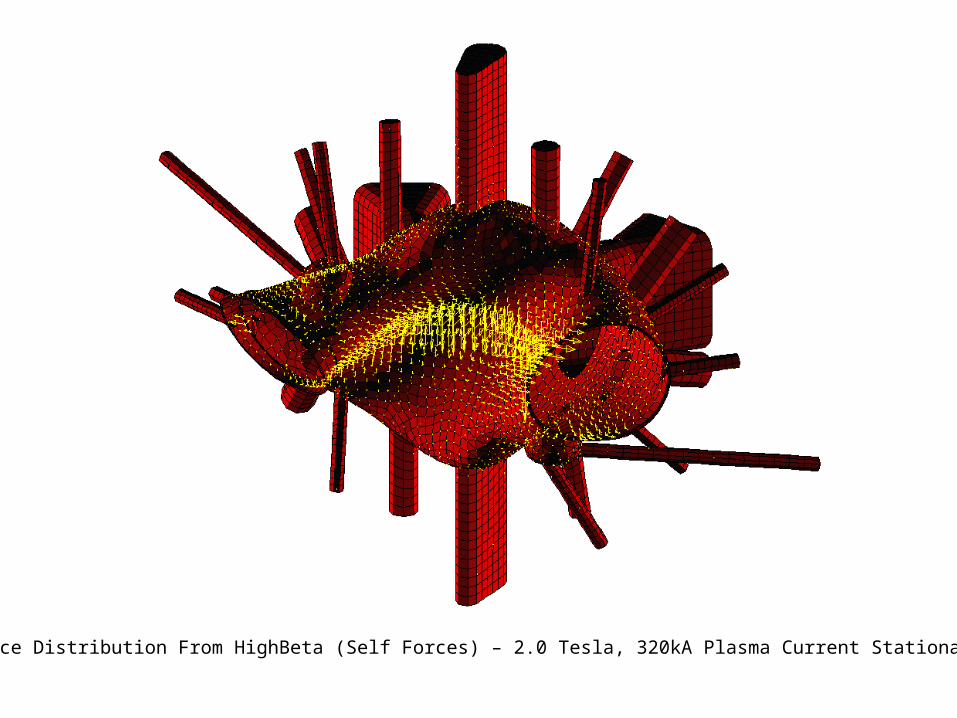
Force Distribution From HighBeta (Self Forces) – 2.0 Tesla, 320kA Plasma Current Stationary

Force Distribution From HighBeta (External Field) – 2.0 Tesla, 320kA Plasma Current Stationary

Displacements Due to High Beta DisruptionRun: 120bbe2a-HighBeta
Peak Displacements Inner Wall: 0.138”
Peak Displacements Outer Wall: 0.166”

Tresca Stresses-Z2 (inner) Shell Surface For High Beta Eddy Currents + Atmospheric Pressure + GravityRun: 120bbe2a-HighBeta
Peak Stress 14.7 ksi

Tresca Stresses-Z1 (outer) Shell Surface For High Beta Eddy Currents + Atmospheric Pressure + GravityRun: 120bbe2a-HighBeta
Peak Stress 16.1 ksi

Lowest Frequency Rocking mode ( 0.8 Hz)

Dynamic loading effects due to disruptions:
-Assume a worst case amplification of the most severe disruption loading: 2 x VDE
Statically applied, this will be an upper bound on the structural response ( structural damping and off-resonance attenuation will produce a much less severe response).
Peak Stress Z2- outer surf. 28.3 ksi Peak Stress Z1- inner surf. 29.1 ksi
Run: 120bbe2a-VDE-2X

Peak Tresca Z2 Stress @ exterior Flange edge49.1 ksi
Peak Tresca Z1 Stress @ interior Flange edge47.2 ksi
Run: 120bbe2a-VDE-2X

Critical Buckling under disruption loading
• Use the three previous disruption load cases together with external atmospheric pressure and gravity applied as a pre-load to determine differential stiffness for deriving the critical buckling load factor.
• To account for any dynamic effects use a factor of 2 for the upper bound (worst case) dynamic loading component (ie. Twice the eddy current EM loads).
• Determine the critical buckling load factor derived from the lowest positive root of the eigenvalue analysis.
• ASME generally recommends a minimal load factor of 4 to 5

1 X VDE Eddy Current Loads, Eigenvalue = 12.0 2 X VDE Eddy Current Loads, Eigenvalue = 8.5
For a 2X dynamic amplification of a VDE disruption
load, the critical load factor still exceeds 8X

1 X OHMIC Eddy Current Loads, Eigenvalue = 15.9 2 X OHMIC Eddy Current Loads, Eigenvalue = 10.5
For Ohmic disruptions the critical load factor is reduced to 10.5 using the 2X dynamic loading.

1 X HighBeta Eddy Current Loads, Eigenvalue = 14.7 2 X HighBeta Eddy Current Loads, Eigenvalue = 12.9
For High Beta disruptions the critical load factor is reduced to 12.9 using the 2X dynamic loading.
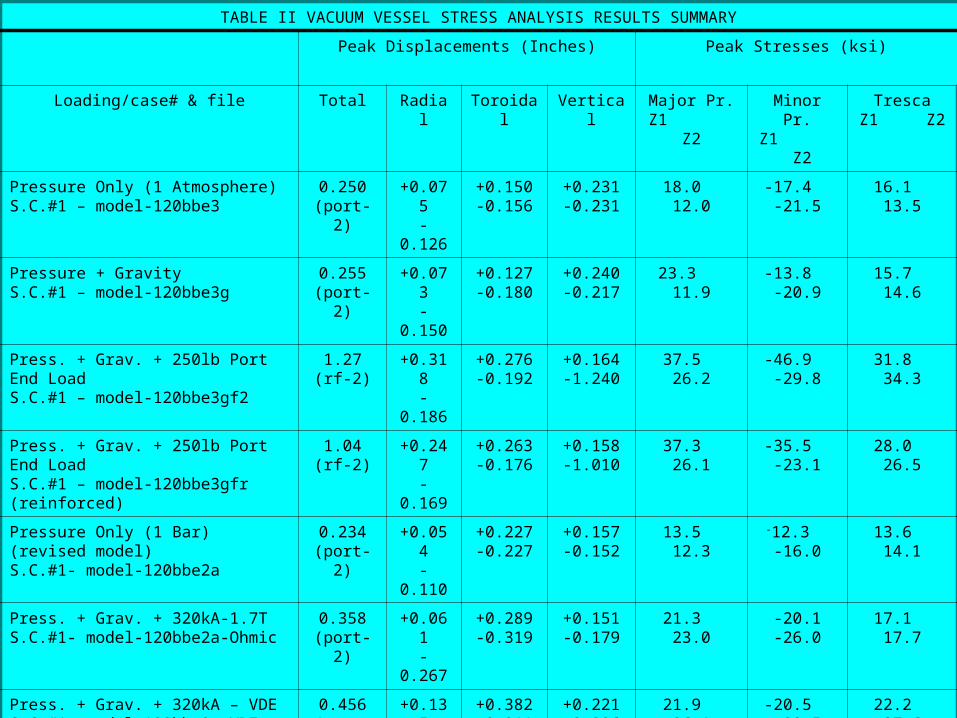
TABLE II VACUUM VESSEL STRESS ANALYSIS RESULTS SUMMARY
Peak Displacements (Inches) Peak Stresses (ksi)
Loading/case# & file Total Radial Toroidal Vertical Major Pr.Z1 Z2
Minor Pr.Z1 Z2
TrescaZ1 Z2
Pressure Only (1 Atmosphere)S.C.#1 – model-120bbe3
0.250(port-2)
+0.075-0.126
+0.150-0.156
+0.231-0.231
18.0 12.0 -17.4 -21.5 16.1 13.5
Pressure + GravityS.C.#1 – model-120bbe3g
0.255(port-2)
+0.073-0.150
+0.127-0.180
+0.240-0.217
23.3 11.9 -13.8 -20.9 15.7 14.6
Press. + Grav. + 250lb Port End LoadS.C.#1 – model-120bbe3gf2
1.27(rf-2)
+0.318-0.186
+0.276-0.192
+0.164-1.240
37.5 26.2 -46.9 -29.8 31.8 34.3
Press. + Grav. + 250lb Port End LoadS.C.#1 – model-120bbe3gfr (reinforced)
1.04(rf-2)
+0.247-0.169
+0.263-0.176
+0.158-1.010
37.3 26.1 -35.5 -23.1 28.0 26.5
Pressure Only (1 Bar) (revised model)S.C.#1- model-120bbe2a
0.234(port-2)
+0.054-0.110
+0.227-0.227
+0.157-0.152
13.5 12.3 -12.3 -16.0 13.6 14.1
Press. + Grav. + 320kA-1.7TS.C.#1- model-120bbe2a-Ohmic
0.358(port-2)
+0.061-0.267
+0.289-0.319
+0.151-0.179
21.3 23.0 -20.1 -26.0 17.1 17.7
Press. + Grav. + 320kA – VDES.C.#1- model-120bbe2a-VDE
0.456(port-2L)
+0.135-0.347
+0.382-0.211
+0.221-0.206
21.9 26.1 -20.5 -29.5 22.2 27.6
Press. + Grav. + 210kA- 2.0TS.C.#1- model-120bbe2a-HighBeta
0.303(port-10)
+0.045-0.223
+0.246-0.274
+0.114-0.153
18.7 19.7 -16.1 -22.1 16.1 14.7
Press. + Grav. + 320kA – 2 x VDE S.C.#1- model-120bbe2a-VDE-2Xa
0.722(port-2L)
+0.330-0.613
+0.553-0.193
+0.374-0.369
43.0 32.7 -33.0 -48.3 47.2 49.1
Press. + Grav. + 210kA- 2.0T – 2 x H.B.S.C.#1- model-120bbe2a-HighBeta-2X
Press. + Grav. + 320kA-1.7T – 2 x OhmicS.C.#1- model-120bbe2a-Ohmic-2X
Press. + Grav. + Thermal BakeoutS.C.#1 –model-120bbe2a-tstress4
0.598(port-2L)
+0.492-0.058
+0.390-0.355
+0.201-0.460
18.7 16.1 -23.0 -37.0 31.0 27.0

Table 2B – Section II of the ASME BPVC indicates a design stress intensity (Sm) of 30.4 ksi at the maximum operating temperature of 750 deg.F (~400 deg.C).
For normal operations the maximum operating shell or nozzle temperature will be 400 deg.F (~200 deg.C), for which Sm is 33.4 ksi.
Appendix 4, Section VIII – Division 2 the general stress criteria and categories for vessel design based on stress analysis:
Category Description Not to exceed
Pm Primary membrane Stress (Average across solid section, 1.0k x Sm
produced only by body forces and mechanical loads).
PL Local Primary membrane Stress (Average stress across solid 1.5k x Sm*
section, includes discontinuities but not Stress concentrations).
Pb Primary bending stress (Stresses proportional to the distance from 1.5k x Sm*
the centroid of a solid section – excludes discontinuities & str.conc.).
Q Secondary Membrane + bending stresses, self equilibrating, due 3.0k x Sm**
to thermal or mechanical loads, or discontinuities (excludes local
stress concentrations.
F Incremental stress added by stress concentrations (notch), thermal
stresses producing thermal fatigue.
* Pl or Pl + Pb < 1.5k x Sm, ( k typically = 1.0), ** PL + Pb + Q < 3.0k x Sm (stress intensity range)
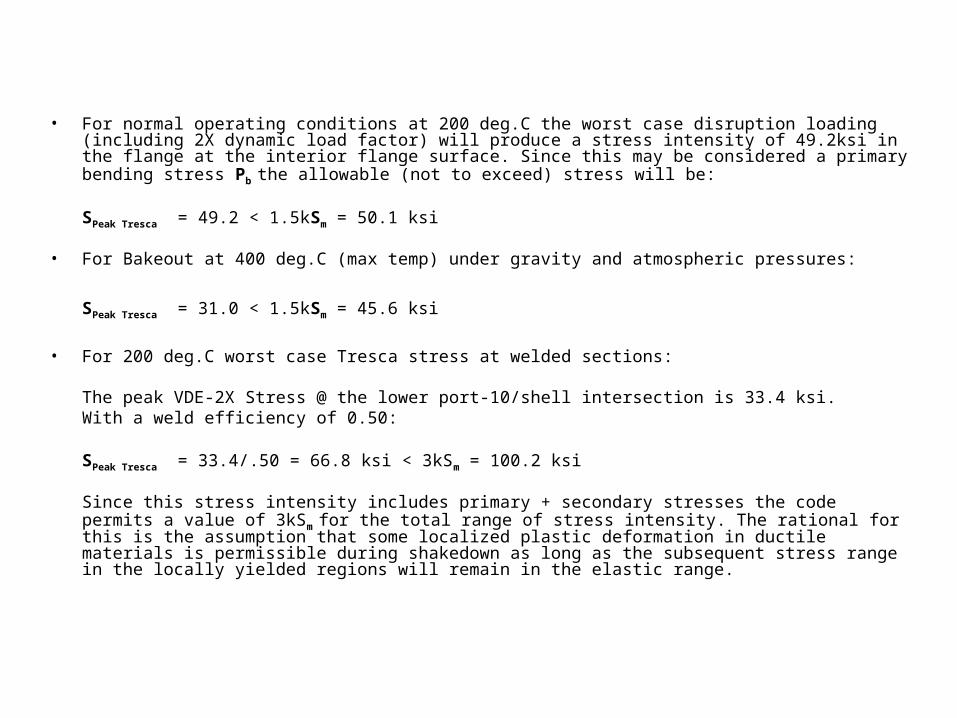
• For normal operating conditions at 200 deg.C the worst case disruption loading (including 2X dynamic load factor) will produce a stress intensity of 49.2ksi in the flange at the interior flange surface. Since this may be considered a primary bending stress Pb the allowable (not to exceed) stress will be:
SPeak Tresca = 49.2 < 1.5kSm = 50.1 ksi
• For Bakeout at 400 deg.C (max temp) under gravity and atmospheric pressures:
SPeak Tresca = 31.0 < 1.5kSm = 45.6 ksi
• For 200 deg.C worst case Tresca stress at welded sections:
The peak VDE-2X Stress @ the lower port-10/shell intersection is 33.4 ksi. With a weld efficiency of 0.50:
SPeak Tresca = 33.4/.50 = 66.8 ksi < 3kSm = 100.2 ksi
Since this stress intensity includes primary + secondary stresses the code permits a value of 3kS m for the total range of stress intensity. The rational for this is the assumption that some localized plastic deformation in ductile materials is permissible during shakedown as long as the subsequent stress range in the locally yielded regions will remain in the elastic range.


Status:
-The static runs for normal operations are completed.
-A run with the bakeout thermal distribution and one with the normal
operating temperature distribution are complete.
-Runs with disruption loads are completed.
-Runs for static buckling with pressure, gravity and disruption loading complete.
-Buckling runs with upper bound dynamic loading (2 x disruption loads) complete.
-Static runs with 2X disruption load factor are complete.
-A 360 degree model (prior vessel) was used to evaluate asymmetric loading conditions and
evaluate any global buckling conditions.
Conclusions:
-Stresses from the normal operating load runs in the shell and ports are below the
allowable stress with the exception of the Port-18 cantilevered loading requirement.
Recommend either thickening the turret wall and port nozzle to reduce stress at the
nozzle/port intersection and to reduce vertical deflections of the port, or implement
a radially compliant vertical nozzle support off the cryostat. Port-15 also needs support.
-Shell displacements are generally low with the exception of the area between port2
and port9 which indicate a displacement of 0.125” total. May be reduced by thickening or reinforcing the shell locally to reduce these deflections.