NCSX Modular Coil Flange Joint Cryogenic Tension Tests …€¦ · I. Superbolt Instructions 17 ......
23
NCSX Modular Coil Flange Joint Cryogenic Tension Tests Report Prepared By: ______________________________ L. Dudek NCSX Outboard Shim Cryogenic Tension Tests Page 1 of 23 Tuesday, October 7, 2008
Transcript of NCSX Modular Coil Flange Joint Cryogenic Tension Tests …€¦ · I. Superbolt Instructions 17 ......

NCSX Modular Coil Flange Joint Cryogenic Tension Tests Report
Prepared By: ______________________________L. Dudek
NCSX Outboard Shim Cryogenic Tension Tests
Page 1 of 23 Tuesday, October 7, 2008

Object 4
Summary 4
Introduction 4
Equipment and method 4
Figure 1: Photo Test Setup 4
Figure 2: Photo Foam dewar and test specimens 5
Data and results 6
Figure 3 Stud Tension / Strain Data 7
Table 1: Stud Tension vs Joint Compression Surrogate 1 8
Table 2: Stud Tension vs Joint Compression Surrogate 2 8
Table 3: Stud Tension vs Joint Compression Surrogate 3 8
Table 4: Stud Tension vs Joint Compression Surrogate 4 9
Figure 4: Supernut Torque vs Stud Load 9
Figure 5: Run 1, Stud 1 & Stud 2 Tension vs Temperature 10
Figure 6: Run 2, Stud 1 Tension vs. Temperature 11
Figure 7: Run 2, Stud #2 Tension vs Temperature 12
Figure 8: Run 3 Stud 1 Tension vs Temperature 13
Figure 9: Run 3 Stud 2 Tension vs Temperature 14
Figure 10: Run 4, Stud 1 & 2, G10 Shims, Tension vs LN2 Level 15
Figure 11: Run 5, Stud 1 & 2, G-10 Shims Tension vs Temperature 16
Conclusions and recommendations 16
Appendix A 17
I. Superbolt Instructions 17
II. Data from the Strain Gage Calibration 18
III. Run #1 Data 19
NCSX Outboard Shim Cryogenic Tension Tests
Page 2 of 23 Tuesday, October 7, 2008

IV. Data from Run #2 20
V. Data from Run #3 22
NCSX Outboard Shim Cryogenic Tension Tests
Page 3 of 23 Tuesday, October 7, 2008

1. ObjectThe object of these tests was to:
1.Determine deflection of joint under axial preload2.Confirm Supernut torque-load curve and accuracy of Ultrasonic tester3.Determine change in preload when cooled to 80K4.Determine change in preload due to thermal cycling5.Determine change in preload due to relaxation at room temperature
If there is noticeable relaxation at RT, re-tighten the assembly and determine if there is any subsequent change.
Disassemble and inspect the surfaces and edges of the shims for damage2. Summary
Sample joints were prepared using the stock parts fabricated for the modular coil joint and surrogate flange sections made from Stellalloy casting material. The parts were tensioned to 80 kips and tension measurements were taken over time and after thermal cycling to LN2 temperature to determine if relaxation of the joint tension occurs.
Tests were also conducted to develop a torque vs load curve for the Supernut fasteners.3. Introduction
The NCSX Modular Coils are held together using a stud and shim connection. Each of the shims at each stud utilizes a metal core (stainless steel) with a G-10 insulator on each side for electrical isolation. The shear connection requires a tension of 72 kips to ensure that there is compression on the G-10 and stainless steel surfaces to ensure adequate friction forces.4. Equipment and method
Two stud kits were assembled using the parts shown on drawing SE140-090-r2. All of the parts in the load path were used and the two surrogate flange surfaces were fabricated using 1.5” thick Stellalloy material taken from one of the NCSX Prototype castings. The first two assemblies were tested using alumina coated (by White Engineering) shims. One of the assemblies used a threaded surrogate flange (stud #1) and the other assembly was through bolted using a hexnut on one end and a Supernut on the other (stud #2). All of the washers and shims were production articles. Each stud was fitted with a resistance strain gage to measure the strain directly.
Figure 1: Photo Test Setup
NCSX Outboard Shim Cryogenic Tension Tests
Page 4 of 23 Tuesday, October 7, 2008

The cryogenic tests were conducted in a foam insulated dewar fabricated especially for these tests. Temperature compensation was accomplished using a thermocouple mounted to a dummy stud inside the dewar cavity. The test articles were mounted about 1-2” above the floor of the dewar.
Figure 2: Photo Foam dewar and test specimensThe long stud was tensioned in the 100 kip MTS machine to 80-85 kips to derive the
calibration curve (Figure 3) for load vs strain indication on the strain gages. A compensating gage was used on the short stud. The test was conducted by running the load up to 85 kips and back down to zero (0) kips while reading the strain gage values using a bridge.
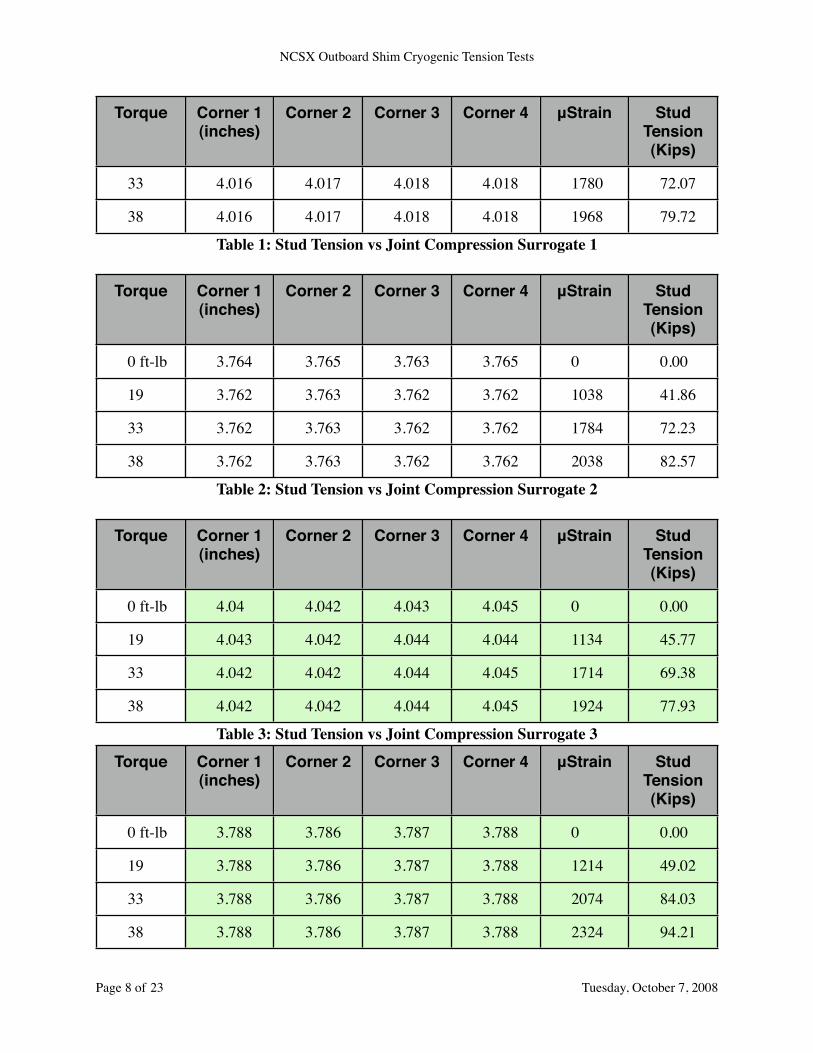
The stud kits and surrogate flanges were then assembled using the assembly sequence shown on the drawing. The Supernuts were torqued to achieve 80-85 kips and were verified using the calibrated strain gages attached to each stud. Torques were applied using a “click” type torque wrench set to the indicated values. Note that later calibration of the torque wrench against a standard indicated a 4 ft-lb offset. The torquing method used was that specified in the Supernut assembly instructions. Measurments on the outside corners of the surrogate flanges were taken as the parts were tensioned to get an indication of how much the joint compressed under load. The data recorded for each assembly is shown on Tables 1 through 4.
Once the parts were properly torqued they were mounted inside the LN2 dewar as shown in Figure 2 and cooled to 77 K using liquid nitrogen. The first run was cooled by flooding the volume around the test specimens with LN2 to quickly bring the parts down to temperature. For the first run a reference TC junction was not installed so the temperatures recorded for the first test were approximate for indication only.
MTS MachineMTS Systems Corp.10 Kip servo-hydraulic tension and compression testing machineModel 204.61Serial # 245Load cellMTS Systems Corp.
NCSX Outboard Shim Cryogenic Tension Tests
Page 5 of 23 Tuesday, October 7, 2008

Model 661-21A-02Serial # 1273Calibrated 02/12/07 Strain Gage BridgeVishay model P-350A portable strain indicator
5. Data and resultsThe data taken during the test runs is provided in the Appendix. The first Run (Figure 5) was
taken using a thermocouple without a reference junction so the temperatures are approx. The pieces were cooled by flooding with LN2. This chilled the parts quickly and provided a worst case scenario. The tension in the studs rose quickly during the transients but returned to near starting tensions once at LN2 temperatures and then again once warmed back up to room temperature. The second test run (Figures 6 & 7) was conducted using a fairly slow cooldown (approximately 8 hrs) to demonstrate a more realistic scenario for the tension in the joint. As expected the tension spike initially but quickly returned to normal values. Upon warming to room temperature the tension returned to the baseline value. The third run (Figures 8 & 9) was a repeat of the second test but was only held conducted using a similar cooldown rate but was held at temperature for 3 days. All of the first 3 runs were conducted with the alumina coated shim. The last 2 runs #4 & 5 (Figures 10 & 11) were conducted using the G-10 / SS sandwich style shims.
NCSX Outboard Shim Cryogenic Tension Tests
Page 6 of 23 Tuesday, October 7, 2008

Figure 3 Stud Tension / Strain Data
Torque Corner 1 (inches)
Corner 2 Corner 3 Corner 4 μStrain Stud Tension (Kips)
0 ft-lb 4.02 4.018 4.025 4.02 0 0.00
19 4.016 4.017 4.019 4.018 1012 40.80
0 20 40 60 80
0
500
1000
1500
2000
2500
Load (Kips)
Stu
d M
icro
str
ain
(!
in
/ i
n)
Stud Tension vs Strain Data
Microstrain Run #1
MicroStrain Run #2
NCSX Outboard Shim Cryogenic Tension Tests
Page 7 of 23 Tuesday, October 7, 2008
Torque Corner 1 (inches)
Corner 2 Corner 3 Corner 4 μStrain Stud Tension (Kips)
33 4.016 4.017 4.018 4.018 1780 72.07
38 4.016 4.017 4.018 4.018 1968 79.72
Table 1: Stud Tension vs Joint Compression Surrogate 1
Torque Corner 1 (inches)
Corner 2 Corner 3 Corner 4 μStrain Stud Tension (Kips)
0 ft-lb 3.764 3.765 3.763 3.765 0 0.00
19 3.762 3.763 3.762 3.762 1038 41.86
33 3.762 3.763 3.762 3.762 1784 72.23
38 3.762 3.763 3.762 3.762 2038 82.57
Table 2: Stud Tension vs Joint Compression Surrogate 2
Torque Corner 1 (inches)
Corner 2 Corner 3 Corner 4 μStrain Stud Tension (Kips)
0 ft-lb 4.04 4.042 4.043 4.045 0 0.00
19 4.043 4.042 4.044 4.044 1134 45.77
33 4.042 4.042 4.044 4.045 1714 69.38
38 4.042 4.042 4.044 4.045 1924 77.93
Table 3: Stud Tension vs Joint Compression Surrogate 3
Torque Corner 1 (inches)
Corner 2 Corner 3 Corner 4 μStrain Stud Tension (Kips)
0 ft-lb 3.788 3.786 3.787 3.788 0 0.00
19 3.788 3.786 3.787 3.788 1214 49.02
33 3.788 3.786 3.787 3.788 2074 84.03
38 3.788 3.786 3.787 3.788 2324 94.21
NCSX Outboard Shim Cryogenic Tension Tests
Page 8 of 23 Tuesday, October 7, 2008

Figure 4: Supernut Torque vs Stud Load
NCSX Outboard Shim Cryogenic Tension Tests
Page 9 of 23 Tuesday, October 7, 2008
0 5
10
15
20
25
30
35
40
0
10
20
30
40
50
60
70
80
90
Torque (ft–lb)
Tensio
n K
ips
Supernut Torque vs Stud Load

Figure 5: Run 1, Stud 1 & Stud 2 Tension vs Temperature
NCSX Outboard Shim Cryogenic Tension Tests
Page 10 of 23 Tuesday, October 7, 2008
30
–N
ov 1
7:5
5
30
–N
ov 1
8:0
0
30
–N
ov 1
8:0
5
30
–N
ov 1
8:1
0
30
–N
ov 1
8:1
5
30
–N
ov 1
8:1
7
30
–N
ov 1
8:2
0
30
–N
ov 1
8:2
5
30
–N
ov 1
8:3
0
30
–N
ov 1
8:3
5
30
–N
ov 1
8:4
0
30
–N
ov 1
8:4
5
30
–N
ov 1
8:5
0
3–
De
c 1
0:0
0
3–
De
c 1
5:0
0
3–
De
c 1
7:3
0
4–
De
c 9
:30
0
40
80
120
160
200
–10.00
0.00
10.00
20.00
Date & Time
Kip
s
Run 1Strain vs Time, Temperature
Micro Strain 1
Micro Strain 2
Tc1
TC
ou
tpu
t in
mil
liv
olt
s(u
nc
om
pe
ns
ate
d T
C)
Boiling Stopped

Figure 6: Run 2, Stud 1 Tension vs. Temperature
NCSX Outboard Shim Cryogenic Tension Tests
Page 11 of 23 Tuesday, October 7, 2008
0
20
40
60
80
100
–200.0
–100.0
0.0
100.0
200.0
60
70
80
90
100
110
120
Time (Hours)
Stu
d L
oad
(K
ips)
Load vs Temp. Data Stud 1, Run 2(thru hole flange)
Stud Temperature (deg. C)
Stud Load (Kips)
Stu
d T
em
p. (d
eg
. C
)

Figure 7: Run 2, Stud #2 Tension vs Temperature
NCSX Outboard Shim Cryogenic Tension Tests
Page 12 of 23 Tuesday, October 7, 2008
0 20 40 60 80 100–200.0
–100.0
0.0
100.0
200.0
60
70
80
90
100
110
120
Time (Hours)
Stu
d L
oad
(K
ips)
Load vs Temp Data Stud 2, Run 2(threaded flange)
Stud Temperature (deg. C)
Stud Load (Kips)
Stu
d T
em
pera
ture
(d
eg
. C
)
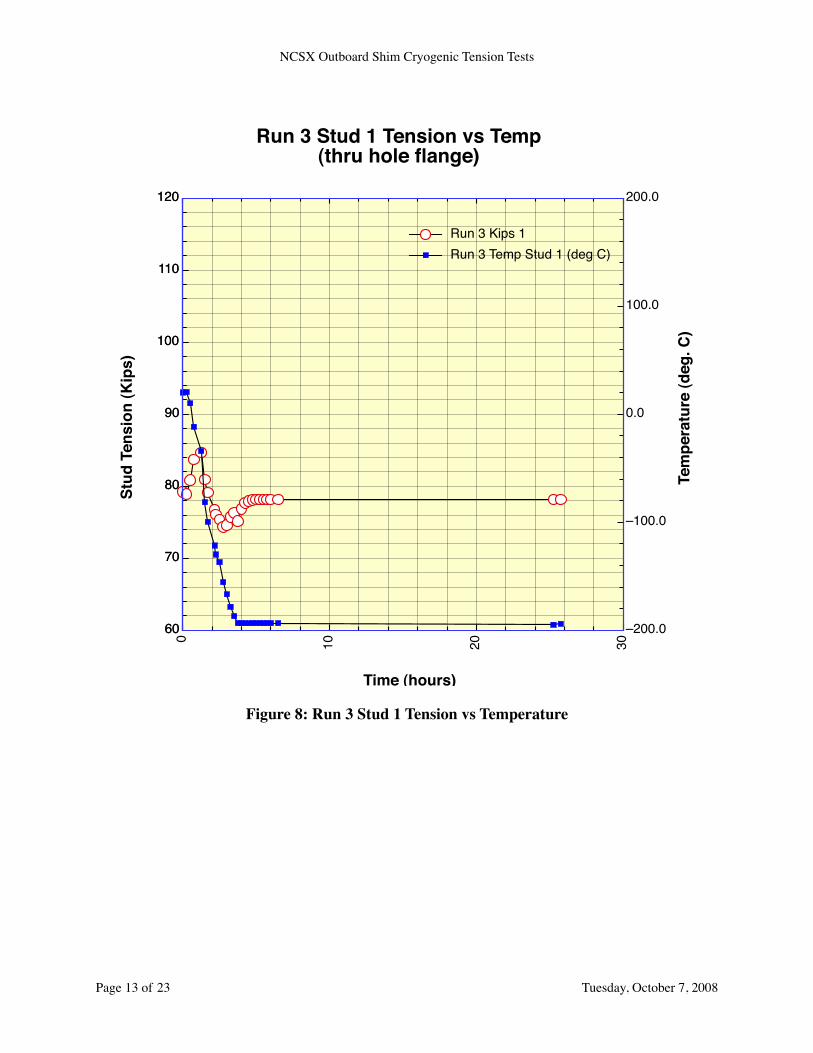
Figure 8: Run 3 Stud 1 Tension vs Temperature
NCSX Outboard Shim Cryogenic Tension Tests
Page 13 of 23 Tuesday, October 7, 2008
0
10
20
30
60
70
80
90
100
110
120
–200.0
–100.0
0.0
100.0
200.0
60
70
80
90
100
110
120
Time (hours)
Stu
d T
en
sio
n (
Kip
s)
Run 3 Stud 1 Tension vs Temp(thru hole flange)
Run 3 Kips 1
Run 3 Temp Stud 1 (deg C)
Tem
pera
ture
(d
eg
. C
)

0
10
20
30
60
70
80
90
100
110
120
–200.0
–100.0
0.0
100.0
200.0
60
70
80
90
100
110
120
Time (hours)
Stu
d T
en
sio
n (
Kip
s)
Run 3 Stud 2 Tension vs Temp(threaded hole flange)
Run 3 Kips 2
Run 3 Stud 2 (deg C)
Te
mp
era
ture
(d
eg
. C
)
Figure 9: Run 3 Stud 2 Tension vs Temperature
NCSX Outboard Shim Cryogenic Tension Tests
Page 14 of 23 Tuesday, October 7, 2008

Figure 10: Run 4, Stud 1 & 2, G10 Shims, Tension vs LN2 Level
NCSX Outboard Shim Cryogenic Tension Tests
Page 15 of 23 Tuesday, October 7, 2008
0 2 4 6
80
100
120
140
0.0
4.0
8.0
12.0
Time (Hours)
Stu
d #
1 T
ensio
n (
Kip
s)
Run 4 G10 Shims Stud #1 & #2 Tension vs LN2 Level
Stud #1 Tension (Kips)
Stud #2 Tension (Kips)
LN2 Level
LN
2 L
iquid
Level

Figure 11: Run 5, Stud 1 & 2, G-10 Shims Tension vs Temperature6. Conclusions and recommendations
The tests demonstrated that both the alumina and G-10 sandwich style shims maintain tension during a cooldown cycle and return to room temperature. No significant changes in the parts were observed upon disassembly and inspection after completion of the tests.
NCSX Outboard Shim Cryogenic Tension Tests
Page 16 of 23 Tuesday, October 7, 2008
0 10 20 300
50
100
150
–200.0
–100.0
0.0
100.0
200.0
300.0
Time (Hours)
Tensio
n K
ips
Run 5 G10 Shims Stud #1 & #2 Tension vs TIme
Stud 1 Kips
Stud 2 Kips
Stud 1 Temp C
Stud 2 Temp C

7. Appendix AI. Superbolt Instructions
NCSX Outboard Shim Cryogenic Tension Tests
Page 17 of 23 Tuesday, October 7, 2008

II. Data from the Strain Gage Calibration
Load (Kips) Microstrain Run #1
MicroStrain Run #2
Calculated Kips
00.5151015202530354045505560657075808580706050403020100.5
0 0 -0.4016 20 0.4128 36 1.07
120 128 4.81244 248 9.70370 370 14.66492 494 19.71616 618 24.76738 742 29.81862 866 34.86982 994 40.07
1110 1120 45.201230 1240 50.081350 1360 54.971470 1480 59.851590 1600 64.741710 1720 69.621840 1840 74.511960 1970 79.802080 2090 84.691960 1970 79.801730 1730 70.031500 1500 60.671260 1260 50.901020 1020 41.12766 764 30.70514 510 20.36258 258 10.1020 20 0.41
NCSX Outboard Shim Cryogenic Tension Tests
Page 18 of 23 Tuesday, October 7, 2008

III. Run #1 Data
Date & Time Micro Strain Stud 1
Kips Stud 1
Micro Strain Stud 2
Kips Stud 2
Tc1 Tc2 Notes
Nov 30, 2008 5:55 PMNov 30, 2008 6:00 PMNov 30, 2008 6:05 PMNov 30, 2008 6:10 PMNov 30, 2008 6:15 PMNov 30, 2008 6:17 PMNov 30, 2008 6:20 PMNov 30, 2008 6:25 PMNov 30, 2008 6:30 PMNov 30, 2008 6:35 PMNov 30, 2008 6:40 PMNov 30, 2008 6:45 PMNov 30, 2008 6:50 PM
Dec 3, 2008 10:00 AM
Dec 3, 2008 3:00 PMDec 3, 2008 5:30 PMDec 4, 2008 9:30 AM
1978 80.13 2000 81.02 -0.1 -0.2 Start of LN2 pour1994 80.78 2110 85.50 -0.1 -0.22122 85.99 2256 91.44 0 -0.42374 96.25 2558 103.74 -0.4 -0.83776 153.32 4006 162.69 -0.7 -1.23616 146.81 3922 159.27 -1.4 -1.63560 144.53 3850 156.34 -3.3 -3.12038 82.57 2294 92.99 -6.4 -10.11872 75.81 2040 82.65 -10.1 -10.11866 75.57 2034 82.41 -10.1 -10.11866 75.57 2034 82.41 -10.1 -10.11874 75.89 2042 82.73 -10.1 -10.11874 75.89 2042 82.73 -10.1 -10.1 Test Concluded, left
in LN2 over weekend
1818 73.61 1864 75.48 -6.1 -6.1 In Chamber , warming up
1864 75.48 1910 77.36 -3.3 -3.2 Warming up1912 77.44 1954 79.15 -2.2 -2.2 Warming up1946 78.82 1988 80.53 -0.5 -0.5 Warming up
NCSX Outboard Shim Cryogenic Tension Tests
Page 19 of 23 Tuesday, October 7, 2008

IV. Data from Run #2
Date & Time Time (Hours)
MicroStrain 1
Kips 1 Microstrain 2
Kips 2 Temp Stud 1 (deg. C)
Temp Stud 2
(deg. C)Dec 6, 2007 10:05 AMDec 6, 2007 10:15 AMDec 6, 2007 10:30 AMDec 6, 2007 10:45 AMDec 6, 2007 11:15 AMDec 6, 2007 11:22 AMDec 6, 2007 11:30 AMDec 6, 2007 11:45 AMDec 6, 2007 12:00 PMDec 6, 2007 12:30 PMDec 6, 2007 12:46 PMDec 6, 2007 12:53 PMDec 6, 2007 1:00 PMDec 6, 2007 1:30 PMDec 6, 2007 1:35 PMDec 6, 2007 1:46 PMDec 6, 2007 2:00 PMDec 6, 2007 2:15 PMDec 6, 2007 2:21 PMDec 6, 2007 2:30 PMDec 6, 2007 2:46 PMDec 6, 2007 3:00 PMDec 6, 2007 3:06 PMDec 6, 2007 3:15 PMDec 6, 2007 3:30 PMDec 6, 2007 3:45 PMDec 6, 2007 4:00 PMDec 6, 2007 4:08 PMDec 6, 2007 4:15 PMDec 6, 2007 4:30 PMDec 6, 2007 4:45 PMDec 6, 2007 5:00 PMDec 6, 2007 5:06 PMDec 6, 2007 5:15 PMDec 6, 2007 5:30 PMDec 7, 2007 9:15 AMDec 7, 2007 10:15 AMDec 7, 2007 11:30 AMDec 7, 2007 12:30 PMDec 7, 2007 1:30 PMDec 7, 2007 2:30 PM
0 1956 79.23 2040 82.65 19.7 19.60.17 1850 74.92 2412 97.79 17.4 18.10.42 1889 76.50 2362 95.76 2.8 7.10.67 1896 76.79 2396 97.14 -9.5 0.51.17 1882 76.22 2444 99.10 -24.4 -10.91.28 1894 76.71 2606 105.69 -29.2 -15.11.42 1872 75.81 2616 106.10 -39.4 -21.11.67 1746 70.68 2616 106.10 -75.6 -30.91.92 1684 68.16 2614 106.02 -89.2 -39.62.42 1624 65.71 2608 105.77 -102.4 -51.42.68 1600 64.74 2596 105.29 -107.7 -57.8
2.8 1632 66.04 2744 111.31 -112.1 -61.42.92 1588 64.25 2736 110.99 -121.2 -68.43.42 1530 61.89 2714 110.09 -140.3 -86.6
3.5 1580 63.92 2770 112.37 -142.3 -90.33.68 1574 63.68 2688 109.03 -152.2 -109.43.92 1562 63.19 2534 102.76 -161.4 -135.04.17 1550 62.70 2542 103.09 -167.7 -139.44.27 1608 65.06 2568 104.15 -170.0 -142.74.42 1610 65.14 2438 98.85 -175.3 -160.04.68 1618 65.47 2374 96.25 -180.9 -173.04.92 1628 65.88 2350 95.27 -184.3 -179.15.02 1672 67.67 2360 95.68 -185.4 -171.35.17 1686 68.24 2384 96.65 -187.3 -183.85.42 1702 68.89 2390 96.90 -188.9 -186.75.67 1704 68.97 2390 96.90 -189.7 -187.95.92 1696 68.65 2374 96.25 -190.0 -188.56.05 1700 68.81 2350 95.27 -193.4 -193.66.17 1724 69.79 2384 96.65 -193.4 -193.76.42 1740 70.44 2400 97.31 -193.4 -193.56.67 1742 70.52 2400 97.31 -193.4 -193.46.92 1742 70.52 2400 97.31 -193.4 -193.27.02 1750 70.84 2402 97.39 -193.4 -193.47.17 1750 70.84 2416 97.96 -193.2 -193.37.42 1750 70.84 2416 97.96 -193.1 -193.0
23.17 1624 65.71 2364 95.84 -179.5 -170.324.17 1620 65.55 2364 95.84 -178.1 -168.425.42 1534 62.05 2290 92.83 -172.4 -160.226.42 1510 61.07 2268 91.93 -165.9 -152.927.42 1510 61.07 2262 91.69 -159.4 -145.528.42 1556 62.95 2246 91.04 -147.1 -137.9
NCSX Outboard Shim Cryogenic Tension Tests
Page 20 of 23 Tuesday, October 7, 2008

Date & Time Time (Hours)
MicroStrain 1
Kips 1 Microstrain 2
Kips 2 Temp Stud 1 (deg. C)
Temp Stud 2
(deg. C)Dec 10, 2007 9:30 AM 95.42 1942 78.66 2030 82.24 19.3 19.2
NCSX Outboard Shim Cryogenic Tension Tests
Page 21 of 23 Tuesday, October 7, 2008

V. Data from Run #3
Date & Time Time (hours)
MicroStrain 1
Kips 1 MicroStrain 2
Kips 2 Temp Stud 1 (deg C)
Stud 2 (deg C)
LN2 Level
Dec 10, 2007 10:30 AMDec 10, 2007 10:45 AMDec 10, 2007 11:00 AMDec 10, 2007 11:15 AMDec 10, 2007 11:45 AMDec 10, 2007 12:00 PMDec 10, 2007 12:12 PMDec 10, 2007 12:40 PMDec 10, 2007 12:45 PMDec 10, 2007 1:00 PMDec 10, 2007 1:15 PMDec 10, 2007 1:30 PMDec 10, 2007 1:45 PMDec 10, 2007 2:00 PMDec 10, 2007 2:15 PMDec 10, 2007 2:30 PMDec 10, 2007 2:45 PMDec 10, 2007 3:00 PMDec 10, 2007 3:15 PMDec 10, 2007 3:30 PMDec 10, 2007 3:45 PMDec 10, 2007 4:00 PMDec 10, 2007 4:15 PMDec 10, 2007 4:30 PMDec 10, 2007 5:00 PMDec 11, 2007 11:45 AMDec 11, 2007 12:15 PMDec 11, 2007 4:00 PMDec 12, 2007 10:00 AMDec 12, 2007 10:30 AMDec 12, 2007 1:00 PMDec 12, 2007 5:00 PMDec 12, 2007 5:25 PMDec 13, 2007 10:00 AMDec 13, 2007 11:15 AMDec 13, 2007 12:00 PMDec 13, 2007 1:05 PMDec 13, 2007 2:15 PMDec 13, 2007 3:15 PMDec 13, 2007 4:10 PMDec 13, 2007 5:00 PM
0.00 1956 79.23 2054 83.22 20.1 20.00.25 1948 78.90 2050 83.06 20.5 20.3 0.00.50 1996 80.86 2200 89.16 10.1 10.6 0.40.75 2066 83.71 2320 94.05 -11.6 -6.6 1.31.25 2090 84.69 2406 97.55 -34.1 -19.4 2.01.50 1998 80.94 2492 101.05 -81.4 -39.1 2.51.70 1954 79.15 2516 102.03 -99.6 -50.5 2.82.17 1894 76.71 2550 103.41 -121.6 -71.1 3.02.25 1878 76.06 2550 103.41 -129.9 -79.5 3.12.50 1862 75.40 2548 103.33 -136.9 -88.6 3.42.75 1836 74.35 2526 102.44 -155.4 -110.5 3.63.00 1842 74.59 2250 91.20 -166.7 -152.0 3.83.25 1870 75.73 2182 88.43 -178.2 -169.1 4.13.50 1884 76.30 2164 87.70 -186.9 -182.0 4.83.75 1856 75.16 2148 87.05 -193.4 -187.8 5.34.00 1898 76.87 2128 86.23 -193.5 -194.0 5.84.25 1918 77.68 2144 86.88 -193.5 -194.0 6.54.50 1924 77.93 2150 87.13 -193.5 -194.0 7.04.75 1928 78.09 2154 87.29 -193.4 -193.9 7.45.00 1930 78.17 2156 87.37 -193.4 -193.9 8.05.25 1930 78.17 2156 87.37 -193.4 -193.9 8.55.50 1930 78.17 2156 87.37 -193.5 -193.9 9.15.75 1930 78.17 2156 87.37 -193.4 -193.9 9.66.00 1930 78.17 2156 87.37 -193.4 -193.8 10.06.50 1930 78.17 2156 87.37 -193.4 -193.8 20.0
25.25 1930 78.17 2144 86.88 -194.9 -194.9 9.025.75 1930 78.17 2150 87.13 -194.1 -194.4 13.529.50 1930 78.17 2150 87.13 -195 -194.4 14.547.50 1930 78.17 2150 87.13 -194.1 -195.248.00 1926 78.01 2154 87.29 -194.9 -194.450.50 1924 77.93 2156 87.37 -194.9 -195.054.50 1930 78.17 2160 87.54 -195 -195.154.92 1930 78.17 2160 87.54 -194.1 -194.571.50 1930 78.17 2160 87.54 -194.9 -195.172.75 1930 78.17 2150 87.13 -193.7 -194.073.50 1930 78.17 2148 87.05 -193.5 -193.974.58 1930 78.17 2146 86.97 -193.6 -193.975.75 1930 78.17 2140 86.72 -193.5 -194.076.75 1930 78.17 2140 86.72 -193.5 -193.977.67 1930 78.17 2130 86.31 -193.5 -194.078.50 1930 78.17 2130 86.31 -193.4 -194.0
NCSX Outboard Shim Cryogenic Tension Tests
Page 22 of 23 Tuesday, October 7, 2008

Date & Time Time (hours)
MicroStrain 1
Kips 1 MicroStrain 2
Kips 2 Temp Stud 1 (deg C)
Stud 2 (deg C)
LN2 Level
Dec 14, 2007 9:15 AMDec 14, 2007 1:00 PMDec 14, 2007 3:30 PMDec 14, 2007 5:15 PMDec 17, 2007 10:00 AMDec 17, 2007 1:00 PM
94.75 1610 65.14 1960 79.39 -167.6 -150.798.50 1694 68.56 1958 79.31 -143.1 -133.7
101.00 1722 69.70 1976 80.04 -133.1 -125.1102.75 1676 67.83 1850 74.92 -112.9 -109.2167.50 1960 79.39 2064 83.63 18.1 18.1170.50 1960 79.39 2056 83.30 20 19.9
NCSX Outboard Shim Cryogenic Tension Tests
Page 23 of 23 Tuesday, October 7, 2008