NASA TECHNICAL MEMORANDUM 109044 Fatigue Life and Crack ...
48
_r- , ,? NASA TECHNICAL MEMORANDUM 109044 Fatigue Life and Crack Growth Prediction Methodology J. C. Newman, Jr., E. P. Phillips, and R. A. Everett, Jr. (NASA-TM-1090_4) FATIGUE LIFE AND N94-23279 CRACK GROWTH PREDICTIgN METHODOLOGY (NASA) 4? p Unclas G3/24 020Z254 October 1993 National Aeronautics and Space Administration LANGLEY RESEARCH CENTER Hampton, Virginia 23681.0001 Downloaded from http://www.everyspec.com
Transcript of NASA TECHNICAL MEMORANDUM 109044 Fatigue Life and Crack ...

_r- , ,?
NASA TECHNICAL MEMORANDUM 109044
Fatigue Life and Crack Growth Prediction Methodology
J. C. Newman, Jr., E. P. Phillips, and R. A. Everett, Jr.(NASA-TM-1090_4) FATIGUE LIFE AND N94-23279CRACK GROWTH PREDICTIgN METHODOLOGY
(NASA) 4? p Unclas
G3/24 020Z254
October 1993
National Aeronautics andSpace Administration
LANGLEY RESEARCH CENTERHampton, Virginia 23681.0001
Downloaded from http://www.everyspec.com

Downloaded from http://www.everyspec.com
FATIGUE LIFE AND CRACK GROWTHPREDICTION METHODOLOGY
O. C. Newman, Jr.
E. P. Phillips
Mechanics of Materials Branch
NASA Langley Research Center
Hampton, Virginia 23681
USA
R. A. Everett, Jr.
Vehicle Structures Directorate
U. S. Army Research Laboratory
Hampton, Virginia 23681
USA
SUMMARY
This paper reviews the capabilities of a plasticity-induced crack-
closure model and life-prediction code to predict fatigue crack growth and
fatigue lives of metallic materials. Crack-tip constraint factors, to
account for three-dimensional effects, were selected to correlate large-
crack growth rate data as a function of the effective-stress-intensity
factor range (_Kef f) under constant-amplitude loading. Some modifications
to the AKeff-rate relations were needed in the near-threshold regime to fit
small-crack growth rate behavior and endurance limits. The model was then
used to calculate small- and large-crack growth rates, and in some cases
total fatigue lives, for several aluminum and titanium alloys under
constant-amplitude, variable-amplitude, and spectrum loading. Fatigue lives
were calculated using the crack-growth relations and microstructural
features like those that initiated cracks. Results from the tests and
analyses agreed well.
a
aib
B
c
c i
Fj
Kmax
KOL
KULN
LIST OF SYMBOLS
Crack length in thickness (B) direction, mm
Initial defect or crack length in B-direction, mm
Defect or void half-height, mm
Specimen thickness, mm
Crack length in width (w) direction, mm
Initial defect or crack length in w-direction, mm
Boundary correction factor
Maximum stress-intensity factor, MPaJm
Overload stress-intensity factor, MPaJm
Underload stress-intensity factor, MPaJm
Number of cycles
Downloaded from http://www.everyspec.com
NfR
r
Sl
So
Smax
Smf
Smi nt
_g_C
aK
AKef f
Number of cycles to failure
Stress ratio (Smin/Smax)Notch or hole radius, mm
Applied stress, MPa
Crack-opening stress, MPa
Maximum applied stress, MPa
Mean flight stress, MPa
Minimum applied stress, MPa
Specimen thickness for through or corner crack and half-
thickness for surface crack, mmConstraint factor
Global constraint factor from finite-element analysis
Crack extension in c-direction, mm
Stress-intensity factor range, MPaJm
Effective stress-intensity factor range, MPaJm
(aKeff)th Small crack _Kef f threshold, MPaJm
AKth
P
a 0
ays
au
Large-crack aK threshold, MPaJm
Plastic-zone size, mm
Flow stress (average of ay s and au), MPa
Yield stress (0.2 percent offset), MPa
Ultimate tensile strength, MPa
Cyclic-plastic-zone size, mm
INTRODUCTION
The use of damage-tolerance and durability design concepts based on
fatigue-crack growth in aircraft structures is well established (Ref I and
2). The safe-life approach, using standard fatigue analyses, is also used
in many designs. In conventional metallic materials, crack-growth anomalies
such as the small-crack effect and the various crack-tip shielding
mechanisms (Ref 3 and 4) have improved our understanding of the crack-growth
process but have complicated life-prediction methods. In the new metallic
materials, such as the aluminum-lithium alloys, crack shielding and failure
mechanisms are more complex than in conventional materials due to crack
growth along tortuous crack paths (Ref 5). Over the past decade, the
intense experimental studies on small or short crack growth behavior in
these metallic materials have led to the realization that fatigue life of
many materials is primarily "crack growth" from microstructural features,
2
Downloaded from http://www.everyspec.com

such as inclusion particles, voids or slip-band formation. Concurrently,the improved fracture-mechanics analyses of someof the crack-tip shieldingmechanisms, such as plasticity- and roughness-induced crack closure, andanalyses of surface- or corner-crack configurations have led to moreaccurate crack growth and fatigue life prediction methods.
On the basis of linear-elastic fracture mechanics (LEFM), studies onsmall cracks (10 pm to ] mm)have shownthat small cracks grow much fasterthan would be predicted from large crack data (Ref 3 and 4). This behavioris illustrated in Figure ], where the crack-growth rate, da/dN or dc/dN, isplotted against the linear-elastic stress-intensity factor range, AK. Thesolid (sigmoidal) curve showstypical results for large cracks in a givenmaterial and environment under constant-amplitude loading (R - Smin/Smax-constant). The solid curve is usually obtained from tests with largecracks. At low growth rates, the threshold stress-intensity factor range,AKth, is usually obtained from load-reduction (AK-decreasing) tests. Sometypical results for small cracks in plates and at notches are shownby thedashed curves. These results showthat small cracks grow at AK levels belowthe large-crack threshold and that they also can grow faster than largecracks at the sameAK level above threshold. Small-crack effects have beenshown to be more prevalent in tests which have compressive loads, such asnegative stress ratios (Refs 6-8).
During the last decade, research on small- or short-crack effects hasconcentrated on three possible explanations for the behavior of such cracks.They are plasticity effects, metallurgical effects and crack closure (Ref 3and 4). All of these features contribute to an inadequacy of LEFMand theuse of the AK-concept to correlate fatigue crack growth rates.
Someof the earliest small-crack experiments were conducted at highstress levels which were expected to invalidate LEFMmethods. Nonlinear orelastic-plastic fracture mechanicsconcepts, such as the J-integral and anempirical length parameter (Ref g), were developed to explain the observedsmall-crack effects. Recent research on the use of AJ as a crack-drivingparameter suggest that plasticity effects are small for manyof the earlyand more recent small-crack experiments (Ref 10). But the influence ofplasticity on small-crack growth and the appropriate crack-driving parameteris still being debated.
Small cracks tend to initiate in metallic materials at inclusionparticles or voids, in regions of intense slip, or at weak interfaces and
Downloaded from http://www.everyspec.com
grains. In these cases, metallurgical similitude (see Ref 11) breaks downfor these cracks (which meansthat the growth rate is no longer an averagetaken over many grains). Thus, the local crack growth behavior iscontrolled by metallurgical f_ures. If the material is markedlyanisotropic (differences in modulus and yield stress in differentcrystallographic directions), the local grain orientation will stronglyinfluence the rate of growth. Crack front irregularities and smallparticles or inclusions affect the local stresses and, therefore, the crackgrowth response. In the case of large cracks (which have large fronts), allof these metallurgical effects are averaged over manygrains, except in verycoarse-grained materials. LEFMand nonlinear fracture mechanics conceptsare only beginning to explore the influence of metallurgical features onstress-intensity factors, strain-energy densities, J-integrals and othercrack-driving parameters.
Very early in small-crack research, the phenomenonof fatigue-crackclosure (Ref 12) was recognized as a possible explanation for rapid small-crack growth rates (see Ref 13). Fatigue crack closure is caused byresidual plastic deformations left in the wake of an advancing crack. Onlythat portion of the load cycle for which the crack is fully open is used incomputing an effective stress-intensity factor range (aKeff) from LEFMsolutions. A small crack initiating at an inclusion particle, a void or aweak grain does not have the prior plastic history to develop closure.Thus, a small crack maynot be closed for as muchof the loading cycle as alarger crack. If a small crack is fully open, the stress-intensity factorrange is fully effective and the crack-growth rate will be greater thansteady-state crack-growth rates. (A steady-state crack is one in which theresidual plastic deformations and crack closure along the crack surfaces arefully developed and stabilized under steady-state loading.) Small-crackgrowth rates are also faster than steady-state behavior because these cracksmay initiate and grow in weak microstructure. In contrast to small-crackgrowth behavior, the development of the large-crack threshold, asillustrated in Figure 1, has also been associated with a rise in crack-opening load as the applied load is reduced (Ref 14 and 15). Thus, thesteady-state crack-growth behavior may lie between the small-crack andlarge-crack threshold behavior, as illustrated by the dash-dot curve.
The purpose of this paper is to review the capabilities of aplasticity-induced crack-closure model (Ref 16 and 17) to correlate and to
Downloaded from http://www.everyspec.com

predict small- and large-crack growth rate behavior in several aluminum andtitanium alloys under various load histories. Test results from theliterature on aluminum alloys 2024-T3 (Refs 7, 18 and 19), 7075-T6 (Ref 20),LCgcs (Ref 20) and 7475-T7351 (Refs 21 and 22) and on titanium alloys Ti-6AI-4V (Ref 23 and 24), IMI-685 (Refs 23-25) and Ti-]7 (Refs 23 and 24)under constant-amplitude loading were analyzed with the closure model toestablish an effective stress-intensity factor range against crack growthrate relation. The effective stress-intensity factor range against crackgrowth rate relations were then used in the closure model to predict large-crack growth under a single spike overload, an overload and underload,repeated spike overloads every 1000 cycles, TWIST (Ref 26) and Mini-TWIST(Ref 27) loading. Using the closure model and some microstructuralfeatures, a total fatigue life prediction method is demonstrated on atitanium alloy under constant-amplitude loading and on several aluminumalloys under various load histories. The load histories considered were theFALSTAFF(Ref 28), Gaussian (Ref 29), TWIST(Ref 26) and Mini-TWIST (Ref27). The crack configurations used in these analyses were through-crackconfigurations, such as center-crack and compact specimens, and three-dimensional crack configurations, such as a corner crack in a bar and asurface or corner crack at a semi-circular notch.
PLASTICITY-INDUCED CRACK-CLOSURE MODEL
The crack-closure model (Refs 16 and 30) was developed for a central
through-crack in a finite-width specimen subjected to remote applied stress.
The model was later extended to a through-crack emanating from a circular
hole and applied to the growth of small cracks (Ref 15 and 31). The model
was based on the Dugdale model (Ref 32), but modified to leave plastically
deformed material in the wake of the crack. A schematic of the model is
shown in Figure 2. Here a crack is growing from a hole in an elastic body
(Region I). At the maximum applied stress, Sma x, the material in the
plastic zone, p, (Reg!on 2) carries the stress, :a o . The constraint
factor, e, accounts for the influence of stress state on tensile yielding at
the crack front. The flow stress ao is the average between the yield stress
and ultimate tensile strength. For plane-stress conditions, _ is equal to
unity (original Dugdale model); and for simulated plane-strain conditions, a
is equal to 3. Although the strip-yield model does not model the correct
yield-zone pattern for plane-strain conditions, the model with a high
5
Downloaded from http://www.everyspec.com

constraint factor is able to produce crack-surface displacements and crack-opening stresses quite similar to those calculated from an elastic-plasticfinite-element analysis of crack growth and closure for a finite-thicknessplate (see Ref 33). As the crack grows under cyclic loading, residual-plastic deformed material (Region 3) is left on the crack surfaces. Duringunloading, these surfaces contact each other at the minimumapplied stress.The material in the plastic zone and along the contacting surfaces wasassumed to yield at -ao. (In the original model, the contacting surfaceswere assumed to reduce the effectiveness of the crack and reduce theconstraint around the crack front. On the basis of three-dimensionalfinite-element analyses, however, this assumption may need to be studiedfurther but this is beyond the scope of the present paper.) Using thecontact stresses, the crack-opening stress is calculated. The crack-openingstress is the applied stress level S at which the crack surfaces are fully
I
open and is denoted as So . The model is able to predict crack-opening
stresses as a function of crack length and load history. The crack-opening
stress is then used to calculate the effective stress-intensity factor
range, aKef f (Ref 12). In turn, the crack-growth rate is calculated using a
aKeff-against-crack-growth-rate relation.
In conducting fatigue-crack growth analyses, the constraint factor a
was used to elevate the flow stress at the crack tip to account for three-
dimensional stress states. At present, the constraint factor is used as a
fitting parameter to correlate crack-growth rate data against AKef f under
constant-amplitude loading for different stress ratios. However, tests
conducted under single-spike overloads seem to be more sensitive to state-
of-stress effects and may be a more appropriate test to determine the
constraint factor.
Effective Stress-lntensity Factor Range
For most damage tolerance and durability analyses, the linear-elastic
analyses have been found to be adequate. However, for high stress-intensity
factors, proof testing, and low-cycle fatigue conditions, the linear-elastic
analyses are inadequate and nonlinear crack-growth parameters are needed
(see Ref 10). Herein, the linear-elastic effective stress-intensity factor
range, developed by Elber (Ref 12), was used and is given by
AKef f = (Smax - S_) Jwc Fj (I)
Downloaded from http://www.everyspec.com

!
where Sma x is the maximum applied stress, So is the crack-opening stress,
and Fj is the usual boundary-correction factor.
Constraint Variations
As a crack grows in a finite-thickness body under cyclic loading
(constant stress range), the plastic-zone size at the crack front increases.
At low stress-intensity factor levels, plane-strain conditions should
prevail but as the plastic-zone size becomes large compared to sheet
thickness, a loss of constraint is expected. This constraint loss has been
associated with the transition from flat-to-slant crack growth, as
illustrated in Figure 3. Schijve (Ref 34) has shown that the transition
occurs at nearly the same crack-growth rate over a wide range in stress
ratios for an aluminum alloy. Later, Schijve (Ref 35), using Elber's crack-
closure concept, proposed that the transition should be controlled by AKef f.
This observation has been used to help select the constraint-loss regime
(see Ref 31).
In a related effort to study constraint variations using a three-
dimensional, elastic-plastic, finite-element analysis, some results are
included here to help resolve the constraint-loss issue (see Ref 36). The
finite-element code, ZIP3D (Ref 37), was used to analyze center-crack-
tension and bend specimens made of a material with an elastic-perfectly-
plastic stress-strain behavior. The analyses were conducted on a 2.5 mm-
thick sheet with various half-widths (w) and a c/w ratio of 0.5. The crack
front was flat and straight-through the thickness. The finite-element model
(one-eighth of the specimen) had six layers through the half-thickness with
the layer on the centerline of the specimen being 0.15B and the layer on the
free surface being 0.025B. The smallest element size around the crack front
was about 0.03 mm. The number of elements was 5706 and the number of nodes
was 7203. The finite-element model of the specimen was subjected to
monotonic loading until the plastic zone extended across the net section.
Because the current mode] uses a constant flow stress in the plastic
zone, a global constraint factor, =g, was defined as the average of the
normal stress to flow stress (ayy/ao) ratio in the plastic zone. Figure 4
shows a comparison of ag as a function of the normalized applied K level fortension and bend specimens. The symbols show the results from the finite-
element analyses for various specimen sizes. The upper dashed lines show
the results under plane-strain conditions; the lower dashed line shows the
Downloaded from http://www.everyspec.com

plane-stress condition. The global constraint factor was nearly a uniquefunction of the applied K level. Someslight differences were observed nearthe plane-stress conditions (high K levels). These results show that theglobal constraint factor rapidly drops as the K level increases (plastic-zone size increases) and approaches a value near the plane-stress condition.The solid line is a simple fit to the finite-element results and shows thatthe constraint-loss regime maybe defined by a unique set of K values undermonotonic loading and, possibly, AKeff under cyclic loading. In the currentmodel, the constraint-loss regime is defined by a set of crack-growth ratesbecause the transition from flat-to-slant crack growth seems to occur atunique rates. This assumption also implies that a unique set of AKeffvalues define the constraint-loss regime.
Constant-Amplitude LoadingIn Reference 38, crack-opening stress equations for constant-amplitude
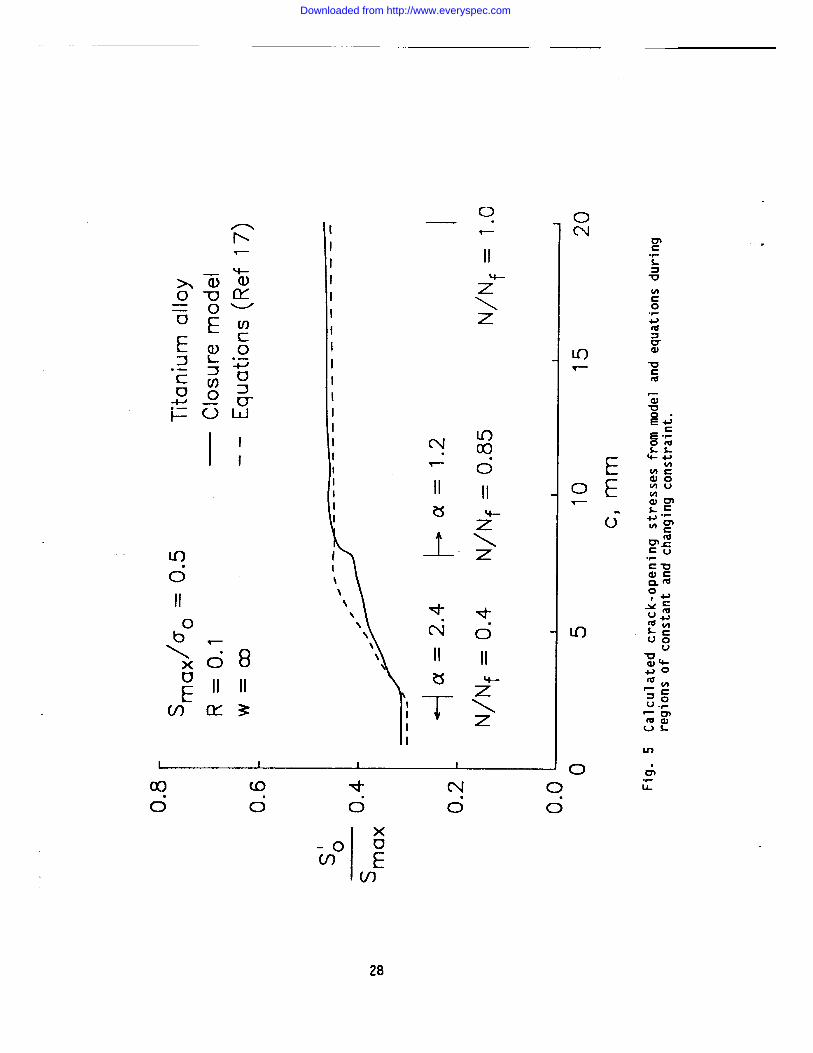
loading were developed from crack-closure model calculations for a center-crack tension specimen. These equations give crack opening stresses as afunction of stress ratio (R), maximum stress level (Smax/ao) and theconstraint factor (_). To correct the previous crack-opening stressequations for extremely high crack-growth rates, a modification wasdeveloped in Reference 17. The new equations give crack-opening stressesthat agree fairly well with results from the modified closure model. Theseequations are used to develop the baseline AKeff-rate relations that areused in the life-prediction code FASTRAN-II(Ref 39) to makecrack-growthand fatigue-life predictions. A typical comparison between the model andthe equations for a crack in a titanium alloy is shownin Figure S. Thisfigure shows crack-opening stresses as a function of crack length for acrack in an infinite plate at low R. To severely test the equations with arapid change in constraint, e was selected to be 2.4 for rates less thanIE-04 mm/cycle; and e was 1.2 for rates greater than IE-03 mm/cycle. Thesolid curve shows the calculations from the model. To use the crack-openingstress equations, the R ratio, the Smax/Oo ratio and the constraint factormust be knowna priori. In this example, the constraint factor is unknownas a function of crack length. Because rates are used to control theconstraint factor in the model, the crack-growth rate must be known tocalculate the crack-openlng stress. The crack-length-against-cycles results
8
Downloaded from http://www.everyspec.com
from the model were therefore used to determine the rate for a given cracklength. Knowing the rate, then the constraint factor is calculated from
= _2 + (_I _2)[log(dc/dN) - log(r2)]/[log(r I) - log(r2)] (2)
for r I < dc/dN < r 2 where el and e2 are the constraint factors, and r I andr 2 are the rates, at the beginning and end of the constraint-loss regime,respectively. For rates less than r], e = el and for rates greater than r2,
= e2 " Oncethe constraint factor has been determined, then the crack-opening stress is calculated from the equations (dashed curve). Forconstant e regions, the results from the equations agreed well with themodel. Somedifferences were observed in the transition region between_ =2.4 to 1.2, but the maximumerror in calculating AKeff was only 4 percent.The small vertical lines indicate the corresponding life ratio (N/Nf), inaddition to indicating regions of constant constraint.
SpectrumLoadingFor variable-amplitude and spectrum loading, the crack-closure model
must be used to compute the crack-opening stress history. Sometypicalcrack-opening stresses under the Mini-TWIST load sequence for a smallsurface crack in a single-edge-notch-tension (SENT) specimenare showninFigure 6. In the small-crack simulation, an initial defect size of ai - 3
pm and ci - 9 _m was used. This size corresponds to inclusion-particle
sizes that initiate cracks in some aluminum alloys (Refs 7 and 8). Variable
constraint was selected for this simulation. The constraint factor (_) was
1.8 for crack-growth rates less than 7E-04 mm/cycle and 1.2 for rates
greater than 7E-03 mm/cycle. The figure shows crack-opening stress
(normalized by the maximum stress in the spectrum) plotted against the ratio
of applied cycles to cycles-to-failure (N/Nf). The predicted cycles to
failure, Nf, was about 800,000 cycles. These results show that the opening
stresses start near the minimum stress in the spectrum and rise as the crack
grows. Crack-opening stresses tended to level off for N/Nf between 0.7 and!
0.9. The rapid jump in So/Sma x for an N/Nf ratio of about 0.92 was caused
by the change in constraint from 1.8 to 1.2 at the higher crack-growth
rates. The surface crack became a through crack (a/t - 1) at an N/Nf ratio
of about 0.9.
9
Downloaded from http://www.everyspec.com
LARGE-CRACK GROWTHBEHAVIOR
To make life predictions, _Kef f as a function of the crack-growth rate
must be obtained for the material of interest. Fatigue crack-growth rate
data should be obtained over the widest possible range in rates (from
threshold to fracture), especially if spectrum load predictions are
required. Data obtained on the crack configuration of interest would be
helpful but it is not essential. The use of the nonlinear crack-tip
parameters is only necessary if severe loading (such as low cycle fatigue
conditions) are of interest. Most damage-tolerant life calculations can be
performed using the linear elastic stress-intensity factor analysis with
crack-closure modi fications.
Constant-Amplitude Loading
Under constant-amplitude loading, the only unknown in the analysis is
the constraint factor, a. The constraint factor is determined by finding
(by trial-and-error) an a value that will correlate the constant-amplitude
fatigue-crack-growth-rate data over a wide range in stress ratios, as shown
in References 30 and 38. This correlation should produce a unique
relationship between AKef f and crack-growth rate. In the large-crack-growth
threshold regime for some materials, the plasticity-induced closure model
may not be able to collapse the threshold (AK-rate) data onto a unique
AKeff-rate relation because of other forms of closure. Roughness- and
oxide-induced closure (see Ref 40) appear to be more relevant in the
threshold regime than plasticity-induced closure. This may help explain why
the constraint factors needed to correlate crack-growth rate data in the
near threshold regime, that is, plane-strain conditions, are 1.7 to 1.9 for
aluminum alloys, 1.8 to 2 for titanium alloys and 2.5 for steel. However,
further study is needed to assess the interactions between plasticity-,
roughness- and oxide-induced closure in this regime. If the plasticity-
induced closure model is not able to give a unique AKeff-rate relation in
the threshold regime, then high stress ratio (R _ 0.7) data may be used to
establish the AKeff-rate relation.
In the following, the AKeff-rate relations for one aluminum alloy and
two titanium alloys will be presented and discussed. Similar procedures
were used to establish the relationships for all materials used in this
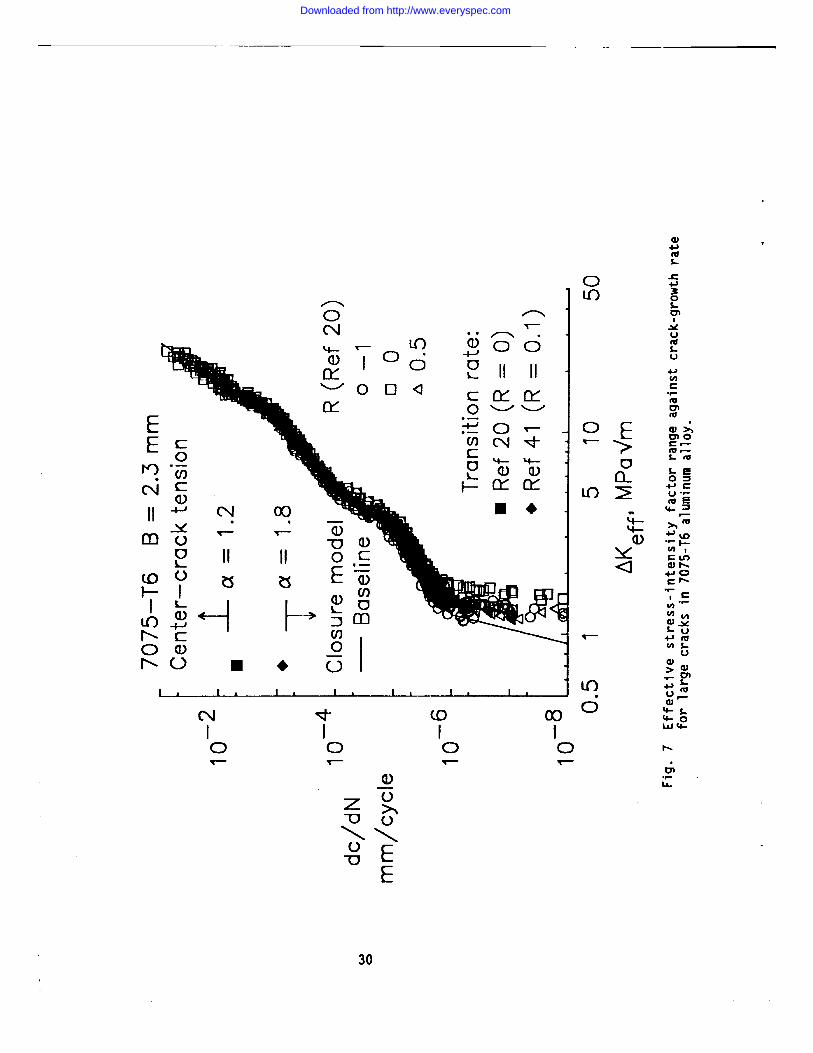
study. The large-crack results for 7075-T6 aluminum alloy are shown in
Figure 7 for data generated at two different laboratories and at three
I0
Downloaded from http://www.everyspec.com

stress ratios (Ref 20). The data collapsed into a narrow band with severaltransitions in slope occurring at about the samerate for all stress ratios.Some differences were observed in the threshold regime. For thesecalculations, a constraint factor e of 1.8 (nearly equivalent to Irwin'splane-strain condition) was used for rates less than 7E-04 ram/cycle (start
of transition from flat-to-slant crack growth) and e equal to 1.2 was used
for rates greater than 7E-03 mm/cycle (end of transition from flat-to-slant
crack growth). For intermediate rates, e was varied linearly with the
logarithm of crack-growth rate. The values of e were selected by trial-and-
error. The solid symbols (see upper left-hand portion of figure) denote
measured rates at the end of transition from flat-to-slant crack growth
(Refs 20 and 41). It has been proposed in Reference 31 that the flat-to-
slant crack-growth transition region may be used to indicate a change from
nearly plane-strain to plane-stress behavior and, consequently, a change in
constraint. In the low crack-growth rate regime, near and at threshold,
some tests (Ref 14) and analyses (Ref 15) have indicated that the threshold
develops because of a rise in the crack-opening-stress-to-maximum-stress
ratio due to the load-shedding procedure. In the threshold regime then, the
actual AKeff-rate data would lie at lower values of AKef f because the rise
in crack-opening stress was not accounted for in the current analysis. For
the present study, an estimate was made for this behavior and it is shown by
the solid line below rates of about 2.0E-6 mm/cycle. The baseline relation
shown by the solid line will be used later to predict small-crack growth
rates and fatigue lives under constant-amplitude loading.
Figure 8 shows the AKeff-rate data for corner cracks in 10 mm-thick Ti-
6AI-4V titanium alloy (Ref 23). In these tests, the initial defect size was
a 250 pm-quarter-circular electrical-discharged machined notch. The data
correlated quite well with a constant constraint factor of l.g. For thick
materials, the loss of constraint, as shown for the thin 7075-T6 alloy (Fig
?), may occur at higher values of AKef f than those shown for the thinner
material. Consequently, a constant constraint factor was used over the
whole rate range. The solid symbols show the results of 13 mm-thick compact
specimens (Ref 42) tested over a wide range of R ratios and down to much
lower rates than the corner-crack tests. The baseline relation (solid
line), fit to the corner-crack results in the mid-region and the compact
results in the low-rate regime, will be used later to predict crack-growth
rates for tests with spike overloads repeated every 1000 cycles.
11
Downloaded from http://www.everyspec.com

The AKeff-rate results for IMI-685 titanium alloy compact specimens(Refs 23 and 25) are shown in Figure 9. This material was selected to beanalyzed because "roughness-induced" closure was expected to be prevalent.These data also illustrate two difficulties with correlating test data usingthe linear-elastic effective stress-intensity factor ranges and theplasticity-induced closure model. First, the high R ratio results tend todeviate from the low R ratio results near the end of the tests. Thesespecimens were cycled to failure and the last few data points were takenimmediately before the specimen failed. The maximum stress level for thehigh R ratio test was considerably higher than that used for the low R ratiotest; and plasticity effects would have been greater in the high R test thanthe low R, resulting in higher rates for a given value of elastic AKeff.However, fitting the AKeff relation to the low R ratio results (solid line)will allow accurate life prediction for both the low and high R ratioconditions, because the high R ratio tests are predicted to fail at a AKeffvalue of 23 MPaJm(fracture toughness Kc = 80 MPaJm). Thus, accuratelymodelling the upper tail of the high R ratio test would not have greatlyaffected the number of cycles to failure. The second difficulty with themodel occurs in the threshold regime and shows that threshold data (load-reduction tests) begin to form bands of data as a function of R, especiallyfor materials where roughness-induced closure mayoccur. The steady-statecrack-opening stress equations do not account for any load-reduction effectsnor roughness-induced closure which is expected to be dominate in the IMI-685 alloy. Because cracks in the high R ratio tests are expected to befully open, these results were used to determine the AKeff relation at thelow rates. The baseline relation will be used later to makecrack growthpredictions under repeated spike overloads.
Spike Overload and UnderloadFor variable-amplitude or spectrum load crack-growth predictions, the
constraint factor should also be verified by some simple tests, such ascrack growth after a single-spike overload. Constraint factors appear to bemore sensitive to crack-growth delays caused by single-spike overloads thanto crack growth under constant-amplitude loading at different stress ratios.Higher values of a will cause less load-interaction effects, such as
retardation or acceleration, than lower values of constraint. Thus, spike-
12
Downloaded from http://www.everyspec.com
overload tests may be more useful in establishing values of e than constant-
amplitude tests. However, the constraint factors determined by spike-
overload tests should also correlate constant-amplitude data (see Ref 43).
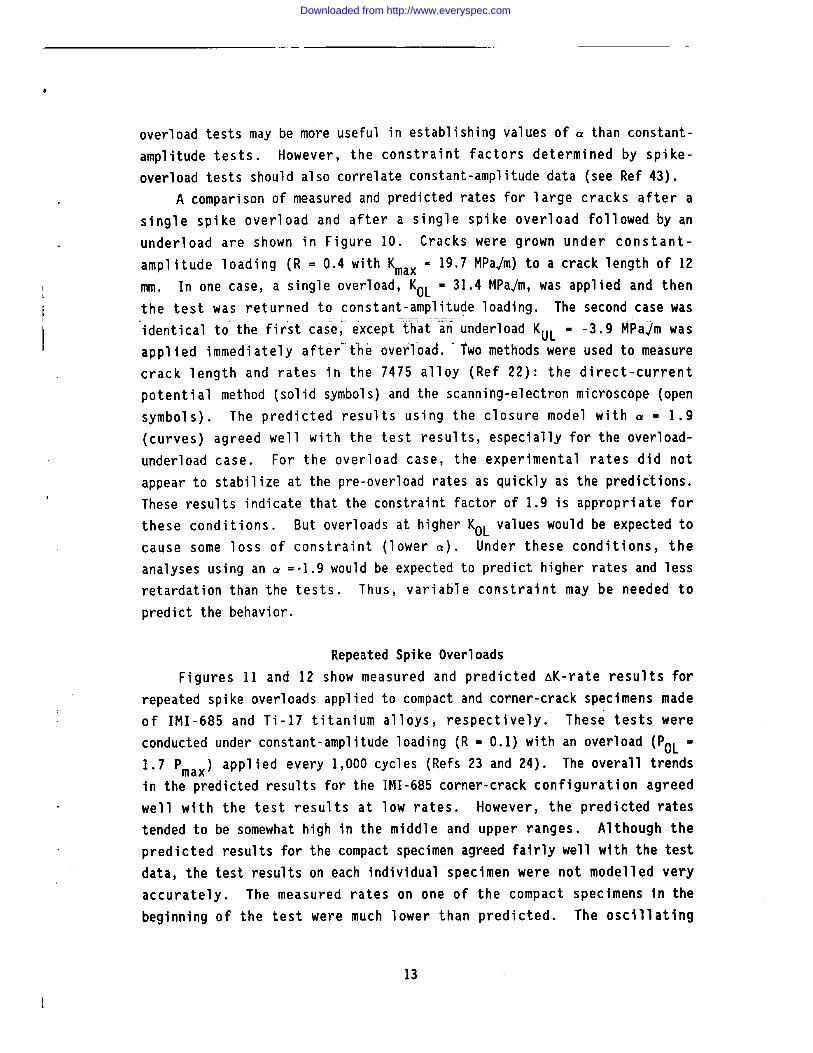
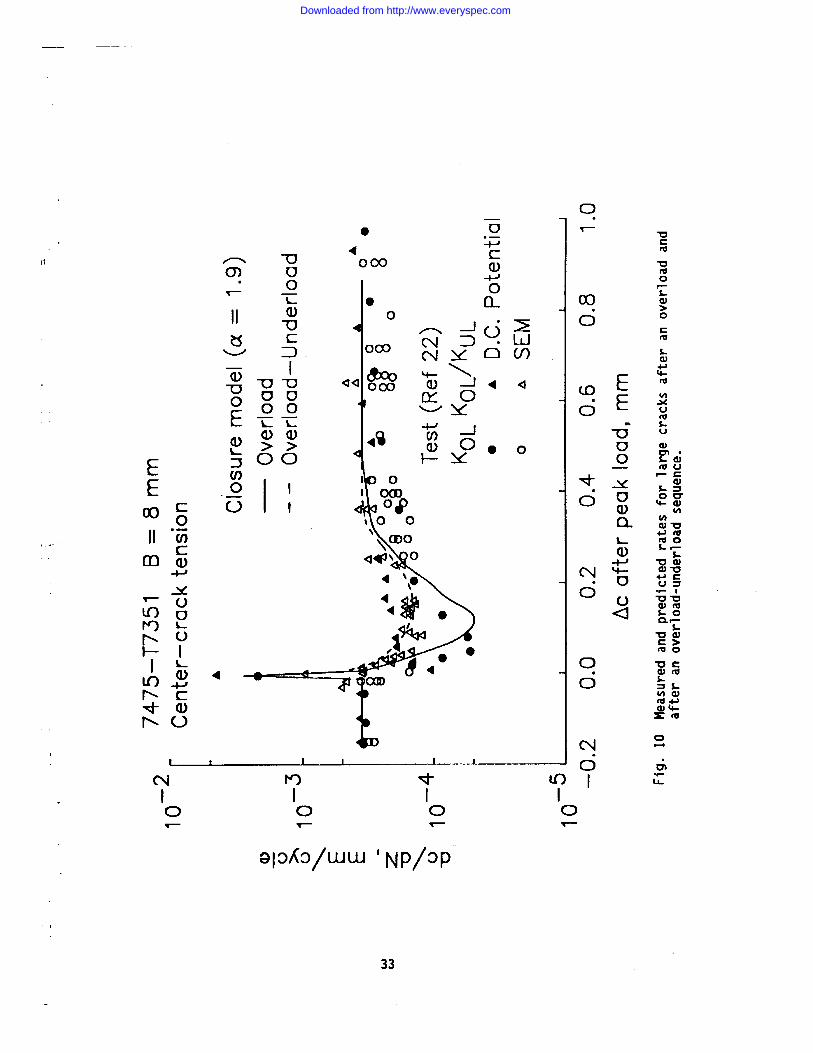
A comparison of measured and predicted rates for large cracks after a
single spike overload and after a single spike overload followed by an
underload are shown in Figure 10. Cracks were grown under constant-
amplitude loading (R = 0.4 with Kma x = 19.7 MPaJm) to a crack length of 12
mm. In one case, a single overload, KOL = 31.4 MPav/m, was applied and then
the test was returned to constant-amplitude loading. The second case was
_identical to the first cas_el'e:xcept:_at:_a_n underioad KUL = -3.9 MPa_/m was
applied immediately after-t_he overload. _Two methods were used to measure
crack length and rates in the 7475 alloy (Ref 22): the direct-current
potential method (solid symbols) and the scanning-electron microscope (open
symbols). The predicted results using the closure model with _ = 1.g
(curves) agreed well with the test results, especially for the overload-
underload case. For the overload case, the experimental rates did not
appear to stabilize at the pre-overload rates as quickly as the predictions.
These results indicate that the constraint factor of 1.9 is appropriate for
these conditions. But overloads at higher KOL values would be expected to
cause some loss of constraint (lower _). Under these conditions, the
analyses using an e =.1.g would be expected to predict higher rates and less
retardation than the tests. Thus, variable constraint may be needed to
predict the behavior.
Repeated Spike Overloads
Figures 11 and 12 show measured and predicted AK-rate results for
repeated spike overloads applied to compact and corner-crack specimens made
of IMI-685 and Ti-17 titanium alloys, respectively. These tests were
conducted under constant-amplitude loading (R = 0.1) with an overload (POL "
1.7 Pmax ) applied every 1,000 cycles (Refs 23 and 24). The overall trends
in the predicted results for the IMI-685 corner-crack configuration agreed
well with the test results at low rates. However, the predicted rates
tended to be somewhat high in the middle and upper ranges. Although the
predicted results for the compact specimen agreed fairly well with the test
data, the test results on each individual specimen were not modelled very
accurately. The measured rates on one of the compact specimens in the
beginning of the test were much lower than predicted. The oscillating
13
Downloaded from http://www.everyspec.com

behavior in the predicted results at high rates was caused by averagingrates over less than 1000 cycles, thus accelerations and retardations duringand after the spike overload are being shown. The comparison of measuredand predicted rates on the Ti-17 alloy agreed quite well (Fig 12). Acomparison of predicted-to-test lives (Np/Nt) for these titanium alloys andTi-6AI-4V, for the two crack configurations, ranged from 0.57 to 2.12 butmost results were within about 20 percent of the test results. Theseresults are presented and discussed in Reference 24.
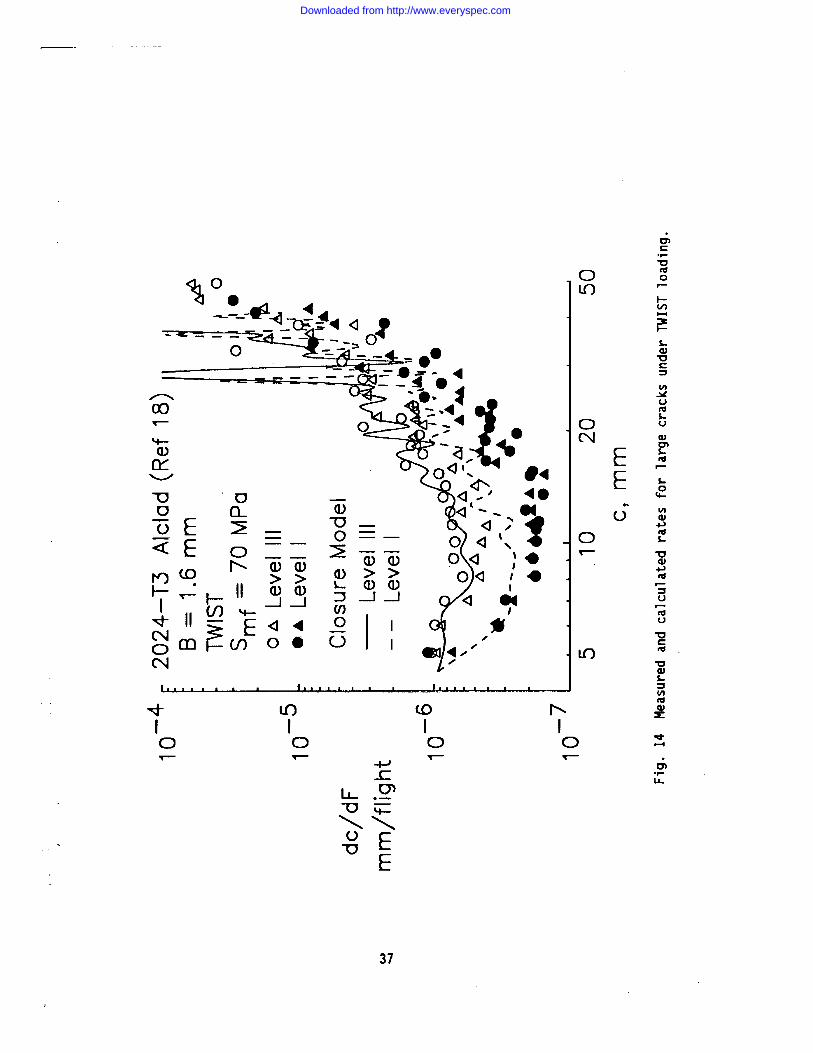
Spectrum LoadingWanhill (Ref 18) conducted spectrum crack-growth tests on center-crack
tension specimens made of 2024-T3 Alclad material in two thicknesses (B =1.6 and 3.1 mm). Tests were conducted under the TWISTspectrum clipped atLevels I and Ill with Smf= 70 MPa. The initial crack starter notch half-length was 3.5 mm. Comparisonsare madebetweenexperimental and calculatedcrack length against flights For Level Ill; and experimental and calculatedcrack length against crack-growth rate for Levels I and Ill.
Crack-length-against-flight data on the 3.1 mm-thick specimens testedunder the TWIST(Level Ill) loading are shownin Figure 13. The solid curveis the calculated results from the closure model with the variable-constraint condition (_ = 2 to I) using the baseline AKeff-rate relation andconstraint-loss regime established in Reference 44. To illustrate why thevariable-constraint conditions are necessary, examplecalculations were madefor constant constraint conditions of either _ = ! or 2 (dashed-dot curves).The model with a low constraint condition (e = I) predicted much longerflights to a given crack length than the test data. Conversely, thepredicted results for the higher constraint condition (_ = 2) greatly underpredicted the behavior except in the early stages of growth. Thus, theplacement of the constraint-loss regime is crucial to making accurate crack-growth predictions under aircraft spectrum loading.
Figure 14 shows a comparison between experimental (Ref 18) andcalculated results of crack length against dc/dF under the TWISTloading(Levels I and Ill) for the 1.6 mm-thick specimens. The crack-growth rate,dc/dF, is the change in crack length per flight. For both levels, theclosure model was able to calculate the initial rates quite accurately(curves). Calculated results under Level Ill agreed with the test results
14
Downloaded from http://www.everyspec.com
over nearly the complete range of crack lengths. The calculated resultsunder Level I, however, began to deviate from the test results after a cracklength of about 12 mm. The ratio of calculated life to test life from aninitial crack length of 3.5 mmto failure was 0.61 for Level I.
SMALL-CRACKGROWTH BEHAVIOR
In the following, comparisons are made between measured and predicted
crack-shape changes and crack-growth rates for small surface cracks at a
notch in 7075-T6 aluminum alloy under constant-amplitude loading.
Comparisons are also presented on measured and predicted rates for small
corner cracks at a notch in LC9cs clad aluminum alloy under both constant-
amplitude and Mini-TWIST spectrum loading. The plastic-replica method was
used to measure the initiation and growth of the small cracks and these
results are presented and discussed in Reference 20.
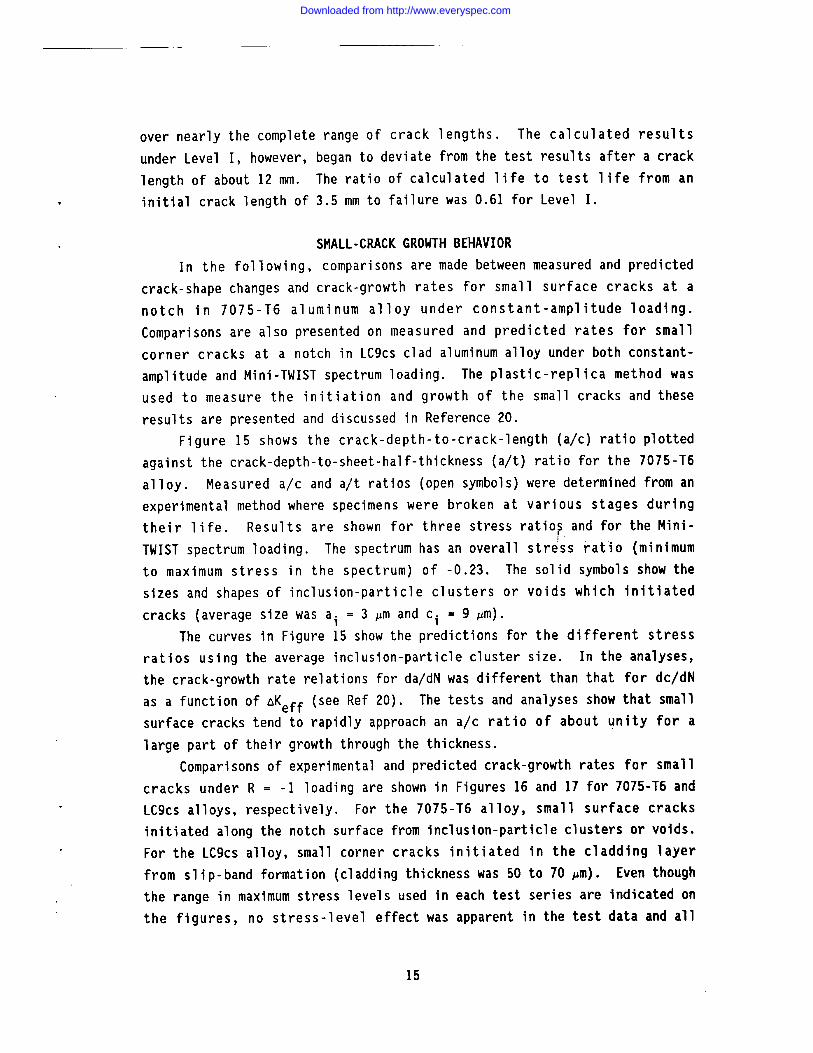
Figure 15 shows the crack-depth-to-crack-length (a/c) ratio plotted
against the crack-depth-to-sheet-half-thickness (a/t) ratio for the 7075-T6
alloy. Measured a/c and a/t ratios (open symbols) were determined from an
experimental method where specimens were broken at various stages during
their life. Results are shown for three stress ratios and for the Mini-
TWIST spectrum loading. The spectrum has an overall stress ratio (minimum
to maximum stress in the spectrum) of -0.23. The solid symbols show the
sizes and shapes of inclusion-particle clusters or voids which initiated
cracks (average size was ai = 3 _m and ci = 9 _m).
The curves in Figure 15 show the predictions for the different stress
ratios using the average inclusion-particle cluster size. In the analyses,
the crack-growth rate relations for da/dN was different than that for dc/dN
as a function of AKef f (see Ref 20). The tests and analyses show that small
surface cracks tend to rapidly approach an a/c ratio of about unity for a
large part of their growth through the thickness.
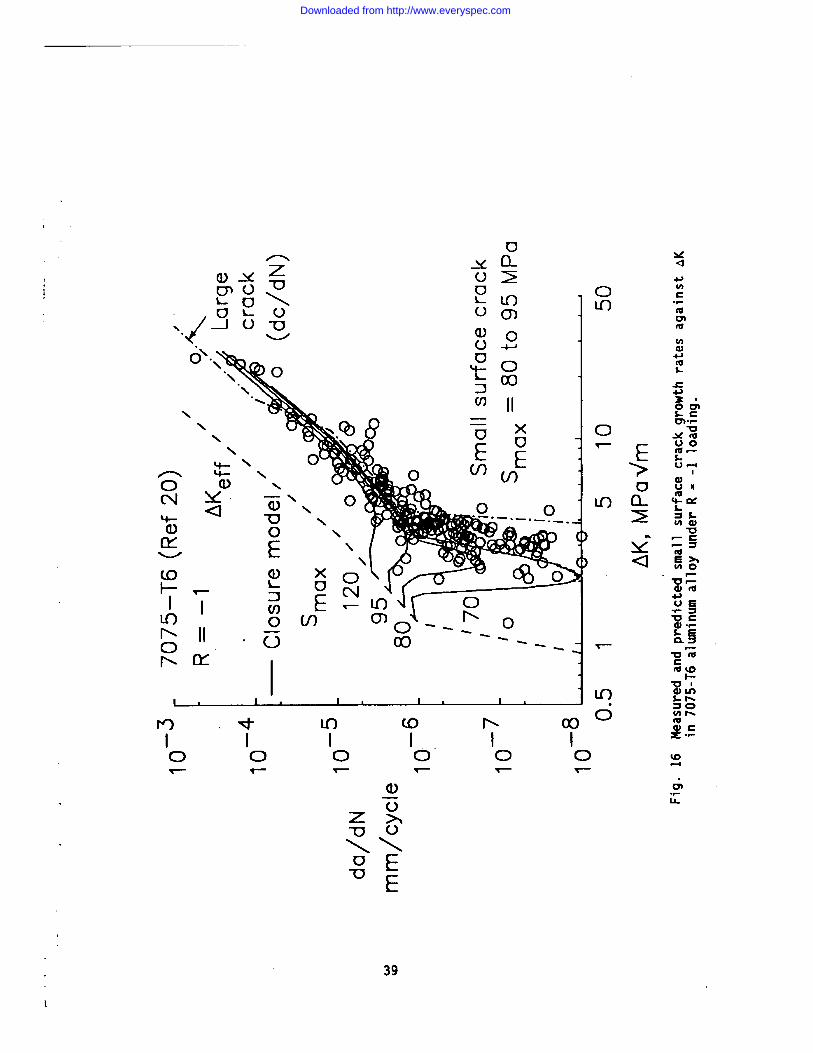
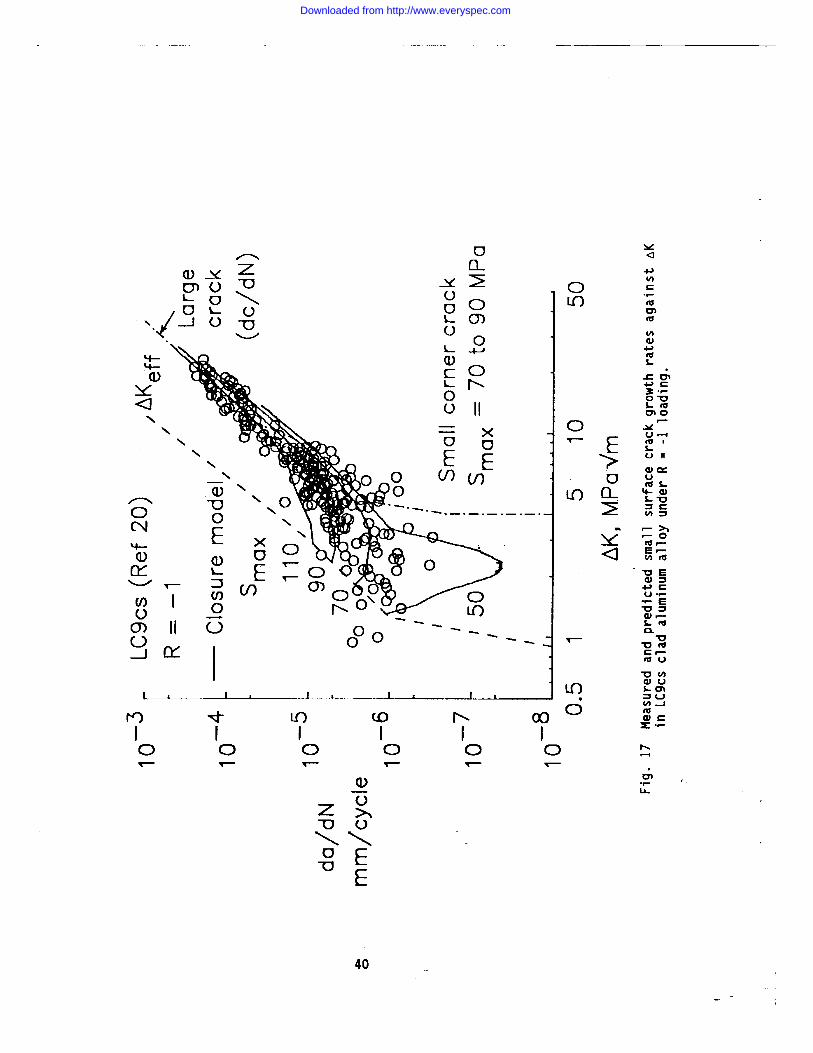
Comparisons of experimental and predicted crack-growth rates for small
cracks under R : -1 loading are shown in Figures 16 and 17 for 7075-T6 and
LCgcs alloys, respectively. For the 7075-T6 alloy, small surface cracks
initiated along the notch surface from inclusion-particle clusters or voids.
For the LCgcs alloy, small corner cracks initiated in the cladding layer
from slip-band formation (cladding thickness was 50 to 70 pm). Even though
the range in maximum stress levels used in each test series are indicated on
the figures, no stress-level effect was apparent in the test data and all
15
Downloaded from http://www.everyspec.com
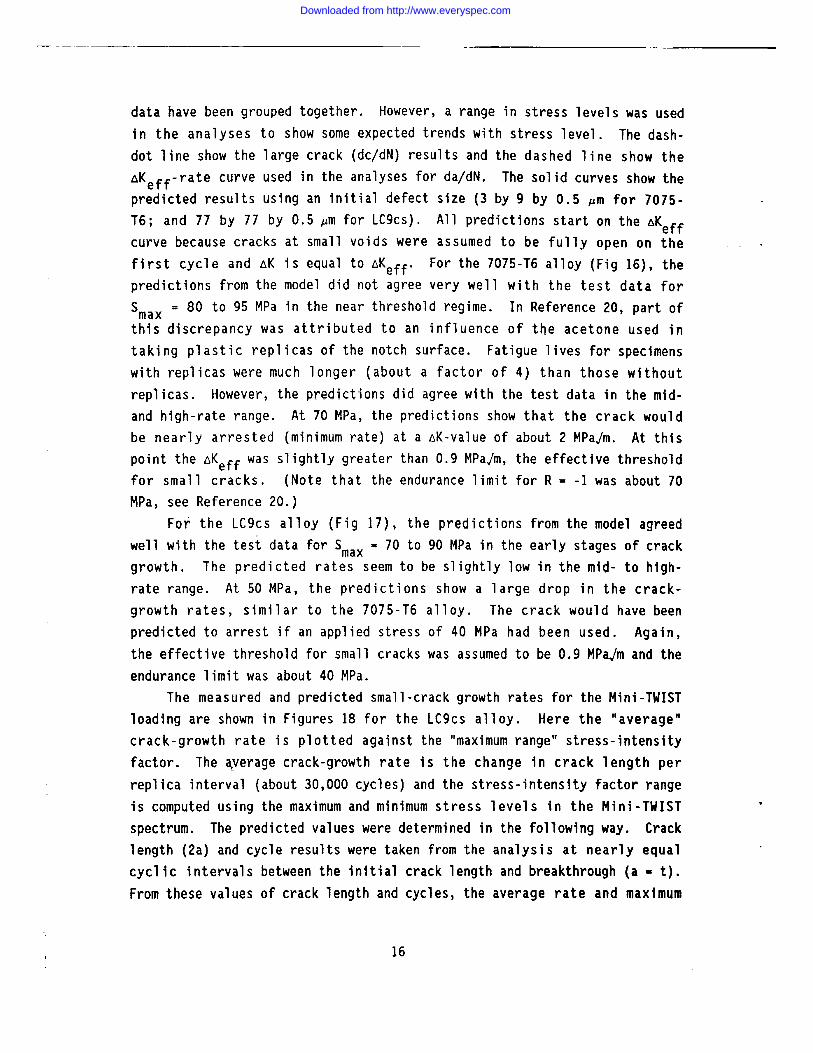
data have been grouped together. However, a range in stress levels was usedin the analyses to show someexpected trends with stress level. The dash-dot line show the large crack (dc/dN) results and the dashed line show theaKeff-rate curve used in the analyses for da/dN. The solid curves show thepredicted results using an initial defect size (3 by 9 by 0.5 pm for 7075-T6; and 77 by 77 by 0.5 _m for LCgcs). All predictions start on the aKeffcurve because cracks at small voids were assumed to be fully open on thefirst cycle and aK is equal to AKeff. For the 7075-T6 alloy (Fig 16), thepredictions from the model did not agree very well with the test data forSmax = 80 to 95 MPain the near threshold regime. In Reference 20, part ofthis discrepancy was attributed to an influence of the acetone used intaking plastic replicas of the notch surface. Fatigue lives for specimenswith replicas were much longer (about a factor of 4) than those withoutreplicas. However, the predictions did agree with the test data in the mid-and high-rate range. At 70 MPa, the predictions show that the crack wouldbe nearly arrested (minimumrate) at a aK-value of about 2 MPaJm. At thispoint the aKeff was slightly greater than 0.9 MPaJm,the effective thresholdfor small cracks. (Note that the endurance limit for R = -I was about 70MPa, see Reference 20.)
For the LC9cs alloy (Fig 17), the predictions from the model agreedwell with the test data for Smax = 70 to 90 MPain the early stages of crackgrowth. The predicted rates seemto be slightly low in the mid- to high-rate range. At 50 MPa, the predictions show a large drop in the crack-growth rates, similar to the 7075-T6 alloy. The crack would have beenpredicted to arrest if an applied stress of 40 MPa had been used. Again,the effective threshold for small cracks was assumedto be o.g MPaJmand theendurance limit was about 40 MPa.
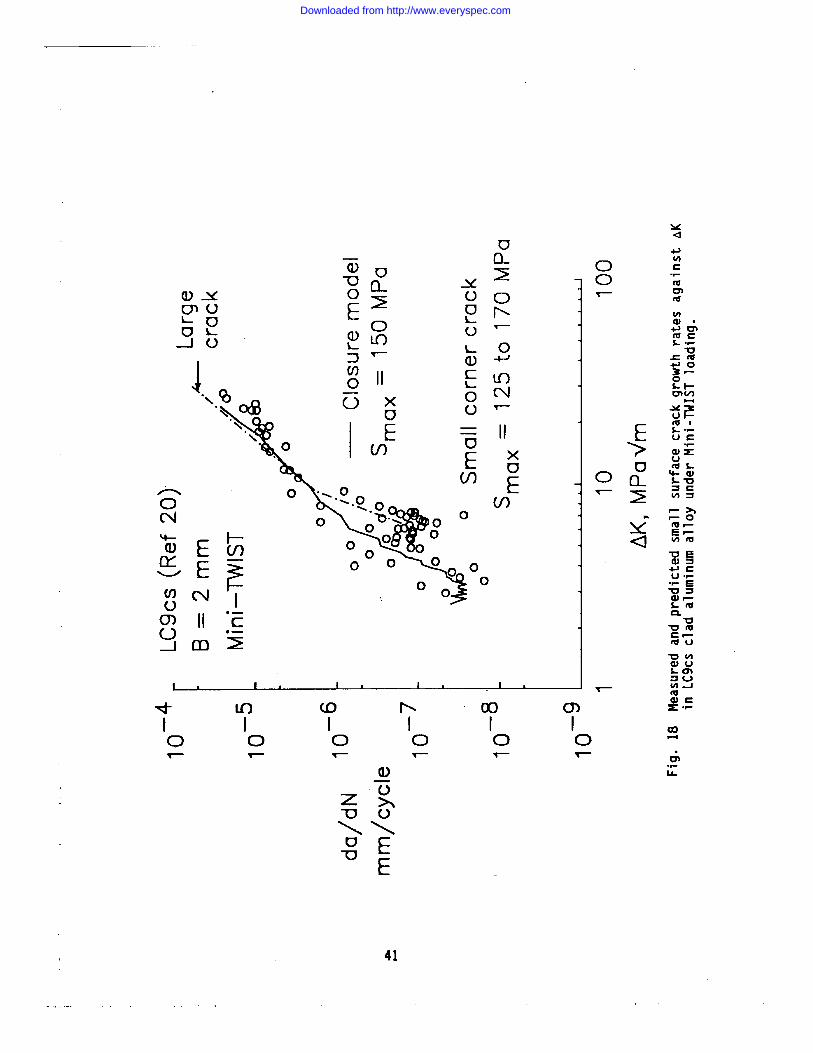
The measured and predicted small-crack growth rates for the Mini-TWISTloading are shownin Figures 18 for the LCgcs alloy. Here the "average"crack-growth rate is plotted against the "maximumrange" stress-intensityfactor. The Eyerage crack-growth rate is the change in crack length perreplica interval (about 30,000 cycles) and the stress-intensity factor rangeis computed using the maximumand minimumstress levels in the Mini-TWISTspectrum. The predicted values were determined in the following way. Cracklength (2a) and cycle results were taken from the analysis at nearly equalcyclic intervals between the initial crack length and breakthrough (a = t).From these values of crack length and cycles, the average rate and maximum
16
Downloaded from http://www.everyspec.com

range stress-intensity factor were calculated. The predicted rates (solidcurve) agreed well with the experimental data for both small- and large-crack behavior.
FATIGUE-LIFEPREDICTIONSAt this point, all of the elements are in place to assess a total
fatigue-life prediction methodology based solely on crack propagation frommicrostructural features. In this approach, a crack is assumedto initiateand grow from a microstructural feature on the first cycle. The crack-closure model and the baseline AKeff-rate curves are used to predict crack
growth from the initial crack size to failure. Comparisons are made with
fatigue tests conducted on the single- or double-edge-notch tension
specimens. Results are presented for three aluminum alloys and one titanium
alloy under either constant-amplitude or various spectrum loadings.
Constant-Amplitude Loading
Fatigue life (S-N) data for 7075-T6 aluminum alloy are shown in Figure
19 for constant-amplitude loading. A symbol indicates a failure and a
symbol with an arrow indicates that a test was terminated before failure.
In the analysis, the initial crack size was ai - 3 pm, ci = 9 _m and b = 0.5
pm (defect or void half-height). This crack size is the average inclusion-
particle or void size that was measured at actual crack-initiation sites.
The effective stress-intensity factor range against rate relation used in
the analysis is given in Reference 20 and (nKeff)th was assumed to be 0.9
MPaJm. Using the life-prediction code (Ref 39), predictions were made for
constant-amplitude loading. The solid curves show the predicted number of
cycles to failure. The predicted lives were in reasonable agreement with
the test lives. In addition to predicting fatigue life, the analysis
methodology was also able to fit the endurance limit as a function of stress
ratio.
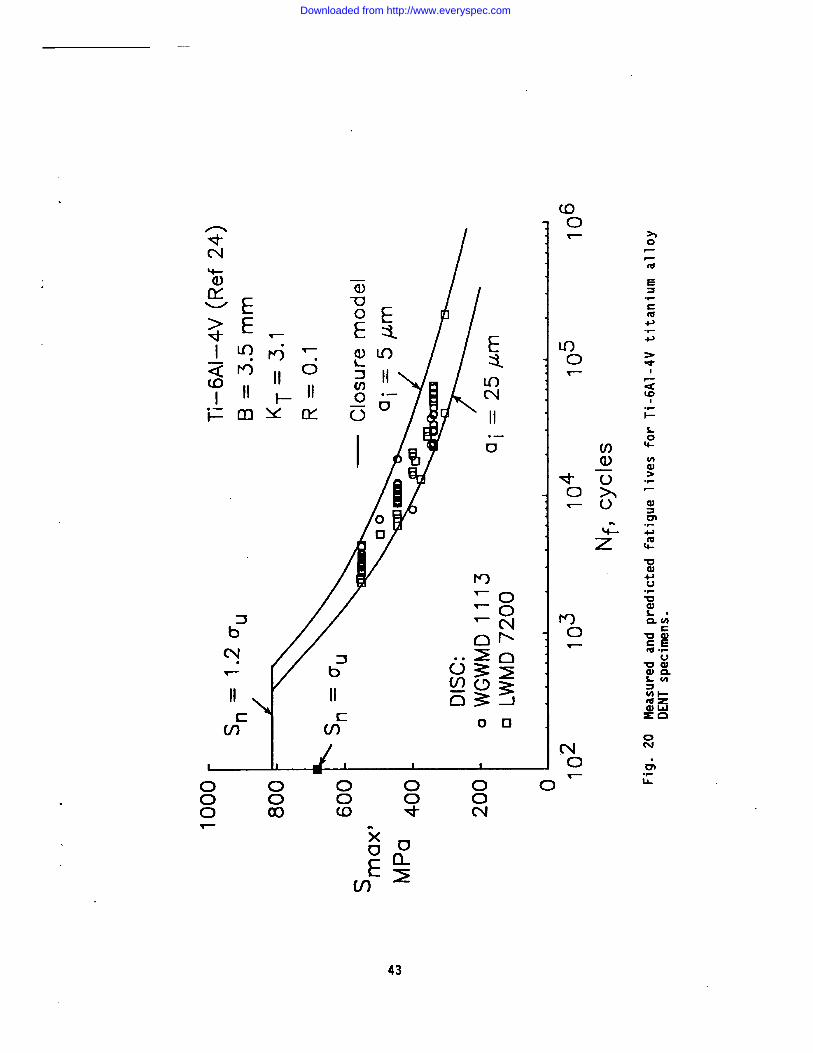
Fatigue tests were conducted on Ti-6AI-4V titanium alloy double-edge-
notch tension (DENT) specimens in the AGARD Engine Disc Cooperative Test
Programme (Ref 24). These results (symbols) are shown in Figure 20 for two
fan disc forgings. To make fatigue life calculations, the baseline nKef f-
rate relation, shown in Figure 8, was used to calculate the life of the
titanium specimens. Because no information on crack-initiation behavior was
given in Reference 24, life calculations were made on initial crack sizes
17
Downloaded from http://www.everyspec.com

that would bound the experimental data, like the equivalent-initial-flawsize (EIFS) concept (Ref 46). The solid curves showthe calculations for aninitial semi-circular surface crack of ai = 5 and 25 pm at the notch root.The solid symbol on the stress axis denotes where the net-section stress isequal to the ultimate tensile strength. Becauseof the notch configuration,notch strengthening is expected and the upper plateau is an estimate for themaximumnet-section stress based on the results from the finite-elementanalyses (see Fig 4 at the high K levels). In a microstructural analysis,Wanhill and Looije (Ref 45) found that the primary _ grains were about 10 _min diameter and the transformed and aged # grains were about 20 pm indiameter for these fan disc materials. Further study is needed on thesematerials to see if cracks of these sizes would be present early in life orto see if the baseline curve (Fig 8) is appropriate for small cracks. Forlow aKef f values, small cracks in the titanium alloys may grow faster thanlarge cracks, as observed by Lanciotti and Galatolo (Ref 47).
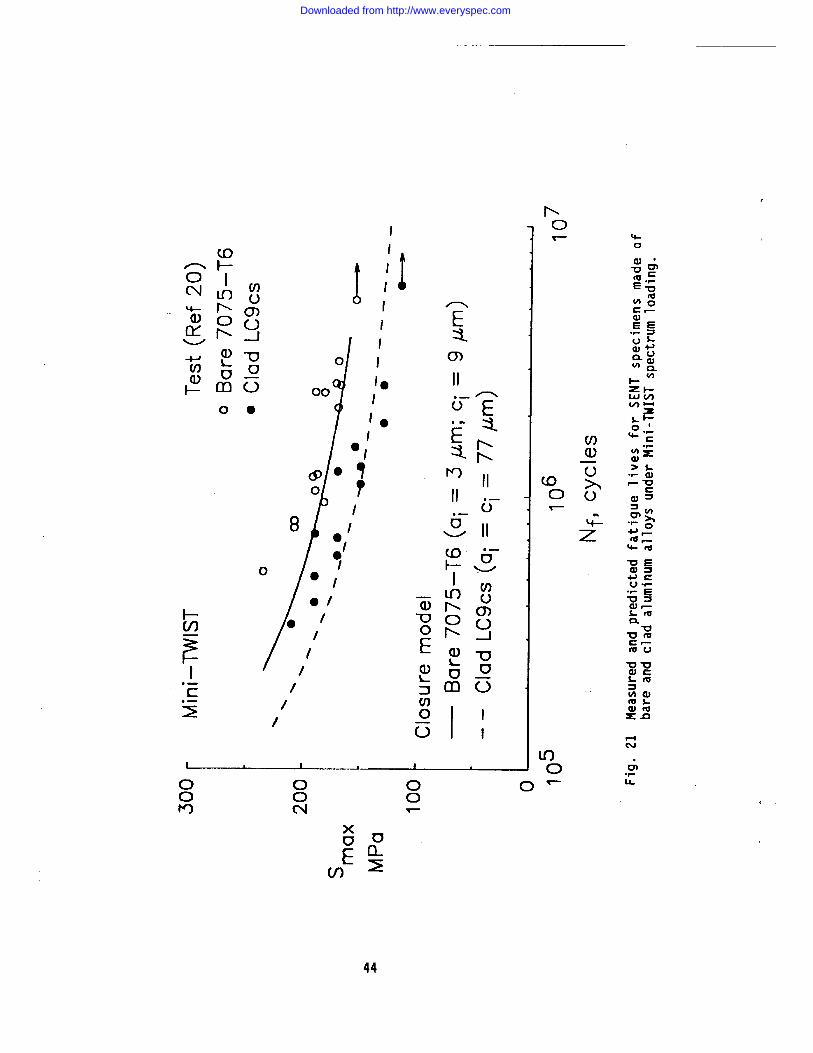
Spectrum LoadingExperimental and predicted results for fatigue tests conducted on 7075-
T6 bare and LCgcs clad alloy specimens under the Mini-TWIST spectrum areshown in Figure 2]. These tests were conducted on SENTspecimens (Ref 20).The solid and dashed curves show predictions for each alloy using theinitial defect sizes shown. The defect size for 7075-T6 was the averageinclusion-particle size that initiated cracks, whereas the initial cracksize for the clad alloy LC9cswas somewhatlarger than the cladding-layerthickness (50 to 70 pm). The predicted lives were in reasonable agreementwith the test results (symbols) but the predicted lives tended to fall onthe lower bound of the test data.
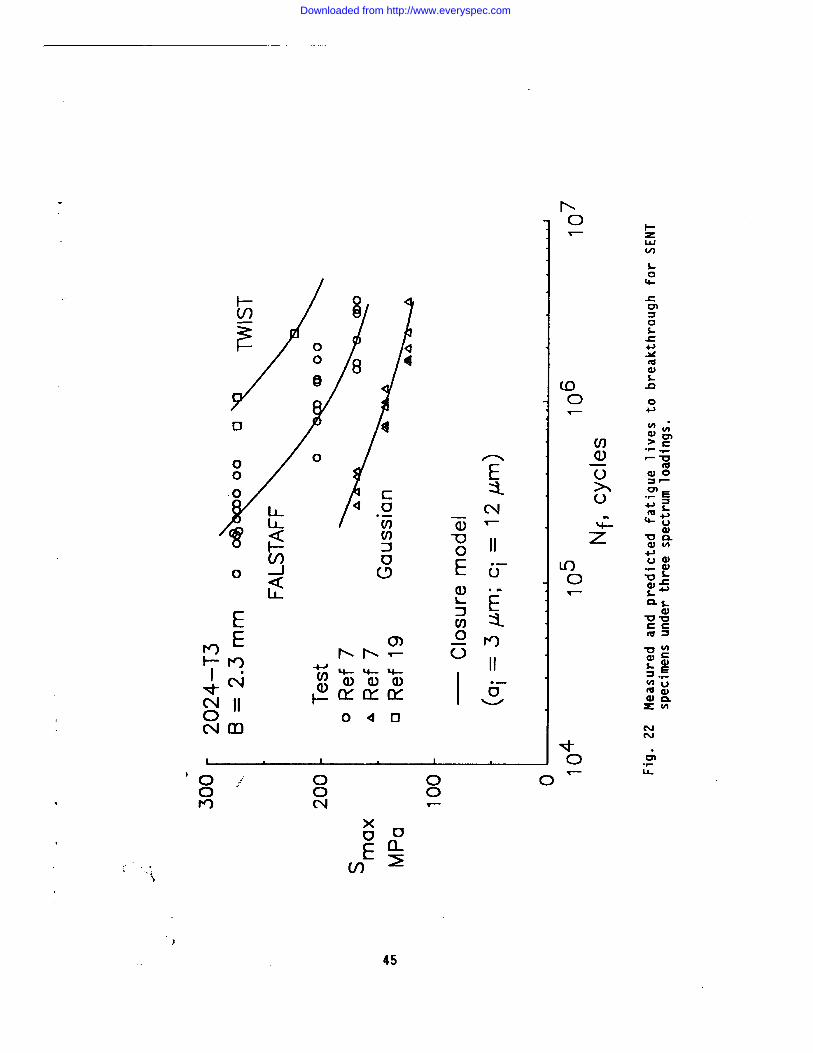
Comparisons of experimental and predicted fatigue lives of notched2024-T3 aluminum alloy sheet specimens under FALSTAFF,Gaussian and TWISTload sequences are shownin Figure 22. These tests were conducted on SENTspecimens (Refs 7 and 19) but they were cycled until a crack had grownacross the full sheet thickness instead of failure. The predictions weremade using an initial crack size that was the average inclusion-particlesize that initiated cracks. The predicted lives agreed well with the testdata.
18
Downloaded from http://www.everyspec.com

CONCLUDING REMARKS
The "plasticity-induced" crack-closure model was used to correlate
large-crack data on several aluminum and titanium alloys under constant-
amplitude loading. A constraint factor, which accounts for three-
dimensional state-of-stress effects, was used in determining the effective
stress-intensity factor range against rate relations. These relations were
then used to predict large-crack growth under variable-amplitude and
spectrum loading. Comparisons made between measured and predicted small-
crack growth rates in two aluminum alloys showed that the closure model
could predict the trends that were observed in the tests. Using the closure
model and some microstructural features, such as inclusion-particle sizes
and cladding-layer thickness, a total fatigue-life prediction method was
demonstrated. Fatigue life of notched specimens made of three aluminum
alloys were compared with predicted lives under either constant-amplitude or
spectrum loading. The predicted results were well within a factor of two of
the test data. Fatigue lives for Ti-6AI-4V titanium alloy could also be
bounded by using initial crack sizes of 5 and 25 pm in the life-prediction
method.
Further study is needed to determine constraint variations along
fatigue crack fronts in various materials and thicknesses. These constraint
variations are needed to improve life predictions under aircraft spectrum
loading, especially for thin-sheet materials. At low rates, the development
of the large-crack threshold and its significance for design life
calculations also needs further study.
REFERENCES
I. Gallagher, J. P.; Giessler, F. J.; Berens, A. P. and Engle, R. M., Jr.,"USAF Damage Tolerant Design Handbook: Guidelines for the Analysis andDesign of Damage Tolerant Aircraft Structures", AFWAL-TR-82-3073, May1984.
2. Manning, S. D. and Yang, J. N., "USAF Durability Design Handbook:Guidelines for the Analysis and Design Aircraft Structures", AFWAL TR-83-3027, January 1984.
3. Small Fatique Cracks, R. O. Ritchie and J. Lankford, eds., TheMetallurgical Society, Inc., Warrendale, PA, 1986.
4. The Behaviour of Short Fatique Cracks, K. J. Miller and E. R. de losRios, eds., European Group on Fracture, Publication No. 1, 1986.
19
Downloaded from http://www.everyspec.com
5. Rao, K. T. V. and Ritchie, R. 0., "Fatigue of Aluminum-Lithium Alloys,Lawrence Berkeley Laboratory", LBL-30176, January 1991.
6. Behaviour of Short Cracks in Airframe Components, H. Zocher, ed., AGARDCP-328, 1983.
7. Newman, J. C. Jr. and Edwards, P. R., "Short-Crack Growth Behaviour in anAluminum Alloy - an AGARD Cooperative Test Programme", AGARD R-732, 1988.
8. Short-Crack Growth Behavior in Various Aircraft Materials, P. R. Edwardsand J. C. Newman, Jr., eds., AGARD Report No. 767, 1990.
9. El Haddad, M. H.; Dowling, N. E.; Topper, T. H. and Smith, K. N., "JIntegral Application for Short Fatigue Cracks at Notches", InternationalJournal of Fracture, Vol. 16, No. I, 1980, pp. 15-30.
10. Newman, J. C., Jr., "Fracture Mechanics Parameters for Small FatigueCracks", Small Crack Test Methods, ASTM STP I149, J. Allison and J.Larsen, eds., 1992, pp. 6-28.
11. Leis, B. N.; Kanninen, M. F.; Hopper, A. T.; Ahmad, J. and Broek, D.,"Critical Review of the Short Crack Problem in Fatigue", EngineeringFracture Mechanics, Vol. 23, 1986, pp. 883-898.
12. Elber, W., "The Significance of Fatigue Crack Closure", Damaqe Toleranc?in Aircraft Structures, ASTM STP 486, 197], pp. 230-242.
13. Nisitani, H. and Takao, K. I., "Significance of Initiation, Propagationand Closure of Microcracks in High Cycle Fatigue of Ductile Materials",Engineering Fracture Mechanics, Vol. 15, No. 3-4, 1981, pp. 455-456.
14. Minakawa, K. and McEvily, A. J., "On Near-Threshold Fatigue Crack Growthin Steels and Aluminum Alloys", Proceedings of the InternationalConference on Fatigue Thresholds, Vol. 2, 1981, pp. 373-390.
15. Newman, J. C., Jr., "A Nonlinear Fracture Mechanics Approach to theGrowth of Small Cracks", Behaviour of Short Cracks in AirframeComponents, AGARD CP-328, 1983, pp. 6.1-6.26.
16. Newman, J. C., Jr., "A Crack-Closure Model for Predicting Fatigue CrackGrowth under Aircraft Spectrum Loading", Methods and Models forPredictinq Fatique Crack Growth under Random Loadinq, J. B. Chang and C.M. Hudson, eds., ASTM STP 748, 1981, pp. 53-84.
17. Newman, J. C., Jr., Poe, C. C., Jr. and Dawicke, D. S., "Proof Test andFatigue Crack Growth Modeling on 2024-T3 Aluminum Alloy", FourthInternational Conference on Fatigue and Fatigue Thresholds, 1990, pp.2407-2416.
18. Wanhill, R. J. H., "Flight Simulation Fatigue Crack PropagationEvaluation of Candidate Lower Wing Skin Materials with ParticularConsideration of Spectrum Truncation", NLR TR 77092 U, July 1977.
20
Downloaded from http://www.everyspec.com
19. Blom, A. F., "Short Crack Growth under Realistic Flight Loading: ModelPredictions and Experimental Results for AL 2024 and AL-LI 2090", Short-Crack Growth Behavior in Various Aircraft Materials, P. R. Edwards andJ. C. Newman, Jr., eds., AGARD Report No. 767, 1990, pp. 6.1-6.15.
20. Newman, J. C., Jr.; Wu, X. R.; Swain, M. H.; Zhao, W.; Phillips, E. P.and Ding, C. F., "Small-Crack Growth Behavior in High-Strength AluminumAlloys - A NASA/CAE Cooperative Program", 18th Congress InternationalCouncil of the Aeronautical Sciences, Sept. 20-25, 1992, ICAS-92-5.4.3.
21. Zhang, S.; Marissen, R.; Schulte, K.; Trautmann, K. -H.; Nowak, H. andSchijve, J., "Crack Propagation Studies on Al 7475 on the Basis ofConstant Amplitude and Selective Variable Amplitude Loading Histories",Fatigue and Fracture of Engineering Materials and Structures, Vol. 10,I987, pp. 315-332.
22. Zhang, S.; Doker, H.; Nowak, H.; Schulte, K. and Trautmann, K. H.,"Improvements of Crack Propagation Analysis by More Exact Determination
of Kop-Levels", Second Symposium on Fatigue Lifetime Predictive
Techniques, ASTM, Pittsburgh, PA., 1992.
23. Raizenne, M. D., "AGARD SMP Sub-Committee 33 Engine Disc Test ProgrammeFatigue Crack Growth Rate Data and Modeling Cases for Ti-6AI-4V, IMI-685and Ti-17", LTR-ST-1785, National Research Council Canada, Nov. 1990.
24. AGARD Enqine Disc Cooperative Test Programme, Mom, A. J. A. andRaizenne, M. D., eds., AGARD Report No. 766, 1988; Pardessus, T., Jany,E. and Raizenne, M. D., eds., AGARD Report No. 766 (Addendum), 1993.
25. Hicks, M. A.; Jeal, R. H. and Beevers, C. J., "Slow Fatigue Crack Growthand Threshold Behaviour in IMI 685", Fatigue _nd Fracture of EngineeringMaterials and Structures, Vol. 6, No. I, 1983, pp. 51-65.
26. deJonge, J. B.; Schutz, D.; Lowak, H. and Schijve, J., "A StandardizedLoad Sequence for Flight Simulation Tests on Transport Aircraft WingStructures (TWIST)", NLR TR-73029 U, Nationaal Lucht-en Ruimtevaart-laborium, 1973.
27. Lowak, H.; deJonge, J. B.; Franz, J. and Schutz, D., "Mini-TWIST--AShortened Version of TWIST", LBF Report No. TB-146, Laboratorium furBetriebsfestigkeit, 1979.
28. van Dijk, G. M. and deJonge, J. B., "Introduction to a Fighter LoadingStandard for Fatigue Evaluation--FALSTAFF", NLR MP 75017 U, NationaalLucht-en Ruimtevaartlaborium, May 1975.
29. Huck, M.; Schutz, W.; Fischer, R. and Kobler, H. G., "A Standard RandomLoad Sequence of Gaussian Type Recommended for General Application inFatigue Testing", IABG Report No. TF-570 or LBF Report No. 2909, 1976.
30. Newman, J. C., Jr., "Prediction of Fatigue-Crack Growth under Variable-Amplitude and Spectrum Loading using a Closure Model", Desiqn of Fatiqq_and Fracture Resistant Structures, P. R. Abelkis and C. M. Hudson, eds.,ASTM STP 761, 1982, pp. 255-277.
21
Downloaded from http://www.everyspec.com
31. Newman,J. C.; Swain, M. H. and Phillips, E. P., "An Assessment of theSmall-Crack Effect for 2024-T3", Small Fatique Cracks, Ritchie, R.O. andLankford, J., eds., ]986, pp.427-452.
32. Dugdale, D. S., "Yielding of Steel Sheets Containing Slits, Journal ofMechanics and Physics of Solids", Vol. 8, Vol. 2, 1960, pp. 100-104.
33. Blom, A. F., Wang, G. S. and Chermahini, R. G., "Comparison of CrackClosure Results Obtained by 3-D Elastic-Plastic FEM and Modified DugdaleModel", Proceedings 1st International Conference on Computer AidedAssessment and Control of Localized Damage, Portsmouth, England, June26-28, 1990, pp. 57-68.
34. Schijve, J., "Significance of Fatigue Cracks in Micro-Range and Macro-Range," Fat_que Crack Propaqation, ASTM STP 415, 1967, pp. 415-459.
35. Schijve, J., "Shear Lips on Fatigue Fractures in Aluminum Alloy SheetMaterial," Delft University of Technology, Report LR-287, Sept. 1979.
36. Newman, J. C., Jr., Bigelow, C. A. and Shivakumar, K. N., "Three-Dimensional Elastic-Plastic Finite-Element Analyses of ConstraintVariations in Cracked Bodies", Engineering Fracture Mechanics, Vol. 46,No. I, 1993, pp. 1-13.
37. Shivakumar, K. N. and Newman, J. C., Jr., "ZIP3D - An Elastic andElastic-Plastic Finite-Element Analysis Program for Cracked Bodies,"NASA TM 102753, Nov. 1990.
38. Newman, J. C., Jr., "A Crack-Opening Stress Equation for Fatigue CrackGrowth", International Journal of Fracture, Vol. 24, 1984, RI31-RI35.
39. Newman, J. C., Jr., "FASTRAN II - A Fatigue Crack Growth StructuralAnalysis Program", NASA TM 104159, February 1992.
40. Ritchie, R. O. and Yu, W., "Short Crack Effects in Fatigue: AConsequence of Crack Tip Shielding", Small Fatique Cracks, R. O. Ritchieand J. Lankford, eds., 1986, pp. 167-189.
41. Vogelesang, L. B., The Effect of Environment on the Transition fromTensile Mode to Shear Mode during Fatigue Crack Growth in AluminumAlloys, Delft Report LR-286, Delft University of Technology, 1979.
42. Powell, B. E. and Henderson, I., "The Conjoint Action of High and LowCycle Fatigue, AFWAL-TR-83-4119, Nov. 1983.
43. Newman, J. C., Jr. and Dawicke, D. S., "Prediction of Fatigue-CrackGrowth in High-Strength Aluminum Alloy under Variable-AmplitudeLoading", Advances in Fracture Research, K. Salama, K. Ravi-Chandar, D.M. R. Taplin and P. R. Rao, eds., Vol. 2, 1989, pp. 945-952.
44. Newman, J. C., Jr., "Effects of Constraint on Crack Growth underAircraft Spectrum Loading", Fatique of Aircraft Materials, A. Beukers,Th. de Jong, J. Sinke, A, Vlot and L. B. Vogelesang, eds., DelftUniversity Press, 1992, pp. 83-109.
22
Downloaded from http://www.everyspec.com
45. Rudd, J. L., Yang, J. N., Manning, S. D. and Garver, W. R., "DurabilityIt
Design Requirements and Analysis for Metallic AirframeSp, Desiqn QfFatique and Fracture Resistant Structures, ASTM STP 761, . R. Abelkisand C. M. Hudson, eds., 1982, pp. 133-15].
46. W anhill, R. J. H. and Looije, C. E. W., "Fractographic andMicrostructural Analysis of Fatigue Crack Growth in Ti-6AI-4V Fan DiscForgings", AGARD Enqine Disc Cooperative Test Proqramme, AGARD Report766 (addendum), 1993.
47. Lanciotti, A. and Galatolo, R., "Short Crack Observations in Ti-6AI-4Vunder Constant-Amplitude Loading", Short-Crack Growth Behaviour inVarious Aircraft Materials, P. R. Edwards and J. C. Newman, Jr., eds.,AGARD R-767, 1990, pp. 10.1-10.7.
23
Downloaded from http://www.everyspec.com

(/')___ O9U ©C_ 4-'
<3
C-,.l_a
<3
rll
c
r"-
II'I
o
r_4_
-_
CLI
r_L
e-
30Tb.
I
Ur_LU
!G_
r_
u_
u
°_,.,
24
Downloaded from http://www.everyspec.com

x X
+
_E _ "
_,o o
E-_-
d
X
+
• 1
-.___
X
EE
v
!
I
d,e-°w"
o
uor,-
u
u
L
o
t_
o
ur_Lu
o
u-m,,-
n_EoJe.-u
,e-
Lm_
25
Downloaded from http://www.everyspec.com

LL
0
oE
e-qa_
0
r----r-
cc]j
o
¢1-
co-r--4.z
wu
Ii-
U
I-u
,r,-I1
26
Downloaded from http://www.everyspec.com

I
c I I !
• • •
C0 o []
•_ v l vc I I ICD 0 [] <k--
/
I
!3
c',lI
0'!
(Dk_
if}
cU
Cl
u2.O
c,4 II
rrl _
o
u_
O
,¢-.--
Ob
o-r'--
l,. ¢_O'T"
_ E
v,i
e- e-_ .r..EL--
E
e-E_OE
c
r_
c_•w- e-
c
C -w-ou c
o N
u_
27
Downloaded from http://www.everyspec.com
000
4--
F: e o
c v) oo o _
II,
O
II4---
Z
Z
{7. co_" O
II I!
10 _ _
c5
I I I
¢0 _ c,Jd d d
OO
X-O
Crl
Ot'N
if)
d
O
e-
l-
e-o.p..
G}
e.-E4.--
5,. l,,.
_ e=
_ U
L e-
_-,.-e-
e- u.p-
o
u+.)
Lc(J o
o
ul
oU°r=.
.p-
28
Downloaded from http://www.everyspec.com

I I
O
0
29
Downloaded from http://www.everyspec.com
| II | •
[] •
c,4IO,it---
IO
m
UZ >,"lJ U
IO,it--
0OIOT--
Otl')
121cl
u_ _
u_d
Y<]
r-
3ol-
u
Lu
c.IF--
Cr'--_r--L ¢lJ
LE
•i_ e"U°r-_E
"l_tO
CU'_
-t,,-,
I-
Ur--
30
Downloaded from http://www.everyspec.com

0
L
31
Downloaded from http://www.everyspec.com

4- _-- I_')LO r--.
oooo
0°0 I , E _ _ou
I 0 _ Im_ m rJ rO _ I n"
I l I .,,i I J I l
I I I I I0 0 0 0 0
(..)Z >,,o c)
-u
u
L
' <1 g_,
_cL°T-
,o_ U
tl- I-
&._-,.
3Z
Downloaded from http://www.everyspec.com
I t I I I a
I I I0 0 0
glO,_o/uJw ' Np/op
C9m •
O3d
C9
"0
C]_
cD
• 00
0<3
C)-d
0u0 I
I0
e,-e_
0
1-
:>o
c
G)4J
um
u
G_
u
o _"
_j-__J mm 0l..r_
!-
4-_ e-
l.- o_,r,-
!,.
e- :>o
m®_-
o
33
Downloaded from http://www.everyspec.com

o o[03
O n
r-j
_'6_ E -o__ _u o --_" _ o_d o__ u
_'J 70 _-- 0 F c c
O0 '_ (D 0 0_ o EE '-@ __ 0 0 _(30
I a_ 0_oo 00-- © 0 0 I____ I_ I--OD 0 I
I , I I ! , I _ I
cN l,O _1- LID _0I I I I I0 0 0 0 0
00
-0 0
0
-o
.5
I0
e-
u uc
E
u
,'-,.-o(_:imi-
LE_
c
m
G)Lo
L
cL
c
UE
u
0) m
OU
u..
34
Downloaded from http://www.everyspec.com

I . I , I
c',l r_ _I-I I I0 0 0
<.)Z >,-CJ 0
I
tOI0
I
I0qr-,=.
I'--I0xr=--
c:c_
c
o CTu
r-- ¢_0
r_r.-
E
-r- 0c
I
°_,pU
c_u
ui
d,°p-
35
Downloaded from http://www.everyspec.com

\
\\
©nD0
E
I ! I I i
0 0 0 0 0
J
0rQ
If)Cxl
0c',,I
!.13X'--
0
00
r'Q0
x
09-Mt'"0"_
IImm
LL
fll
qL
S,-0
Il-
l-(,2
U!
1/i!-
o_,--
!i-
t-Q,1
!
u
Lu
ui...
_ b..,4u_
t--
In U
i11 _.
&
36
Downloaded from http://www.everyspec.com
0
0
Ij | i • • • • • I. • | m • m | m !i. m • m • •
I I I0 0 0
..t..a
0L_
r,-.I0
c
mo
I-",4
%,-
c
u
ku
g,
L0
S-
U
U
C
L
+
,r--
h
37
Downloaded from http://www.everyspec.com

C_L.
0
(D
O0
I
u'3 0
II II I! '_em
rY rY rY _
C)
CJ,r-LL
38
Downloaded from http://www.everyspec.com
0
0
\
\
0
I I I Io o o o
(I)o
Z >,,
0
I0
000I0
c_n
v
.r,,.
s..
0L c
U 0
k
I_3U II
L
C
_0
us
LE
I--
_0
to
IJ.
39
Downloaded from http://www.everyspec.com
00 0
I
_0I
0Z >,,
E
0
0
F(/)
| |
I_ 00I I0
0!.0
0
I.r)
!.0
0
0
c)[£.
c",r =,
c_ °r,,,o'oL_o
u N
u
L'Oc
E_-
_E
•_- E
r_"O
Cr'-U
U
°_u_
4O
Downloaded from http://www.everyspec.com
I , I , I , I ,. I
I I I I I0 0 0 0 0
Z"C}
I0
<I
5,1
_._.s=-
L
_-®c,--- 0
<_ _-c
u.P-
e= ,.=..u
wU
_ (...)_,4.J
c
oO
i,
41
Downloaded from http://www.everyspec.com

O
O
[]
D
[]
D
/! |
O Ou_ O
O
IIO
O
III
O
I • I • I •
0 0 0If) 0 _
p,.O
O
7
0
O
0
0
E
e-or=,E
i
0
or;4.-
op,,,
0r-
U
"IO O
c6U
mZ_LU
U-
4Z
Downloaded from http://www.everyspec.com
m !
0 0 0 0 00 0 0 0 00 O0 CD _ 0,,I
0')
0
0
u')0
0r
0
0
0
0
Z
>,,o
E
°r-
e-
°r-
!
!-r-F--
0c4-
al
°r,-
U
i_1 °r-u
Er-_
0N
m,
43
Downloaded from http://www.everyspec.com
!I
C_
°-8 , _ ,.,
o _
/ / eo"E / _mo
° I ',, I _,°r I
0 0 00 0 0r_ c',,,I ,,--
x
V)
0
b-0
0
tr?0
co']©
0>.,0
Z
q-o
of,.E.._
t_o
c 0...--
E E
u $'-
I--Zl---
o i_-'_.
0p
e-
or- I_
•t_ e-_ °e,,°r- 1_
_ U
_-¢,,
N
.r=,ul
44
Downloaded from http://www.everyspec.com
,0 I-V,, /: .___ E
0 o _ acxlm
LZJf_oC_
! • |
"_ 0
0 0
X
| _
00
E
Cxl
IIe_
U
II_m
0
- 0
CO0
0
0
0
C_
I--z
5-0
f-
0
Lr_
0
°r- o_,..
¢0
,1_ t_
u _
"_"0c c
_ °f,..
N
i,
., 45
Downloaded from http://www.everyspec.com
REPORT DOCUMENTATION PAGE ro,m ApprovedOMB No. 0704-0r88
PuDI'c repor_ ncJ burden for thi_ collection of ,nformaUO_ ,s est_mate_i tO average ,! _nout p__Lr,r_otptmastel_,nn¢l_s:/_lgothme_=me frO_raervc_=w_in=g.t_t !_lO_S, searchingex_st_ng dataso_JrcL_.,: c m el n and revlewln tne _ot_ettJu v, u a v v = t> <, .,_ • uu u_n _t l_ u, _ y wn_r asDe_ OT _nls
qathecmg and malntammg the data needed, and o pl g g • " r_ r S rv " r_ u _. . _ !me f,
OavlsHtghway. Su*te 1204. Arhngto_t. VA z4zu_Juz, anu tu _-c _,,,_= v. ,.._ -._ _ _ . _ , c . - .,, _ ,
il. AGENCY USE ONLY ('Leave blank) 2. REPORT DATE 3. REPORT TYPE AND DATES COVEREDOctober 1993 TechnicalMemorandum
4. TITLE AIqD SUBTITLE S. FUNDING NUMBERS
Fatigue Life and Crack Growth Prediction Methodology WU 538-02-10-01
i i
6.' AUTHOR(S)
J. C. Newman, Jr., E. P. Phillips, and R. A. Everett, Jr.
7._ERFORMING ORGANIZATION NAME(S) AN'D ADDRESS(ES)
NASA Langley Research Center
Hampton, VA 23681-0001
9. SPONSORING/MONITORING AGENCY NAME{S) AND ADDRESS(ES)'
National Aeronautics and Space AdministrationWashington, DC 20546-0001
8. PERFORMING ORGANIZATIONREPORT NUMBER
10. SPONSORING/'MONITORINGAGENCY REPORT NUMBER
NASA TM 109044
11. SUPPLEMENTARYNOTESPresentedat the AGARD Structures and Materials Panel Workshop on An Assessment of FatigueDamage and Crack Growth lh'exlicdon Techniques, Bordeaux, France, September 29-30, 1993
12a. DISTRIBUTION/AVAILABILITYSTATEMENT
Unclassified -Unlimited
Subject Category - 24
12b DiSTRIBUTiON CODE
13. ABSTRACT (Maximum 200 words)
This paper reviews the capabilities of a plasticity-induced crack-closure model and life-prediction code to predict fatiguecrack growth and fatigue lives of metallic materials. Crack-tip constraint factors, to account for three-dimensionaleffects, were selected to correlate large-crack growth rate data as a function of the effective-stress-intensity factor range(AKeff) under constant-amplitude loading. Some modifications to the _ff-rate relations were needed in the near-threshold regime to fit small-crack growth rate behavior and endurance limits, the model was then used to calculatesmall- and large-crack growth rates, and in some cases total fatigue lives, for several aluminum and titanium alloysunder constant-amplitude, variable-amplitude, and spectrum loading. Fatigue lives were calculated using the crack-growth relations and microstructural features like those that initiated cracks. Results from the tests and analyses agreedwell.
14. SUBJECT TERMS
Fatigue; Crack propagation; Fracture; Small crack; Metals
17. SECURITYCLASSIFICATION 18. sECURITYCLASSIFICATIONOF REPORT OF THIS PAGE
Unclassif_d Unclassified
NSN 7540-01-280-$500
15. __MBER OF PAGES
16. PRICE CODE
..... A0319. 'SECL/RITY CLASSIFICATION 20. LIMITATION OF ABSTRACT
OF ABSTRACT
.... S"_'andard Form 298 (Rev 2-89)Preset=bed by ANSI _,td 139-1B298 i02
Downloaded from http://www.everyspec.com