ATIGUE STRENGTH AND FATIGUE CRACK PROPAGATION …
122
UNIVERSITY OF MISKOLC FACULTY OF MECHANICAL ENGINEERING AND INFORMATICS FATIGUE STRENGTH AND FATIGUE CRACK PROPAGATION DESIGN CURVES FOR HIGH STRENGTH STEEL STRUCTURAL ELEMENTS PHD THESES Prepared by Haidar Faisal Helal Mobark Agriculture and Machinery Equipments Engineering Techniques (BSc), Machine Design (MSc) ISTVÁN SÁLYI DOCTORAL SCHOOL OF MECHANICAL ENGINEERING SCIENCES TOPIC FIELD OF ENGINEERING MATERIALS SCIENCE, PRODUCTION SYSTEMS AND PROCESSES TOPIC GROUP OF MATERIALS ENGINEERING AND MECHANICAL TECHNOLOGY Head of Doctoral School Dr. Gabriella Bognár DSc, Full Professor Head of Topic Group Dr. Miklós Tisza DSc, Professor Emeritus Scientific Supervisor Dr. János Lukács CSc, PhD, Full Professor Miskolc 2020
Transcript of ATIGUE STRENGTH AND FATIGUE CRACK PROPAGATION …
UNIVERSITY OF MISKOLC
FACULTY OF MECHANICAL ENGINEERING AND INFORMATICS
FATIGUE STRENGTH AND FATIGUE CRACK PROPAGATION
DESIGN CURVES FOR HIGH STRENGTH STEEL STRUCTURAL
ELEMENTS PHD THESES
Prepared by
Haidar Faisal Helal Mobark Agriculture and Machinery Equipments Engineering Techniques (BSc),
Machine Design (MSc)
ISTVÁN SÁLYI DOCTORAL SCHOOL OF MECHANICAL ENGINEERING SCIENCES
TOPIC FIELD OF ENGINEERING MATERIALS SCIENCE, PRODUCTION SYSTEMS AND
PROCESSES
TOPIC GROUP OF MATERIALS ENGINEERING AND MECHANICAL TECHNOLOGY
Head of Doctoral School
Dr. Gabriella Bognár
DSc, Full Professor
Head of Topic Group
Dr. Miklós Tisza
DSc, Professor Emeritus
Scientific Supervisor
Dr. János Lukács
CSc, PhD, Full Professor
Miskolc
2020

CONTENTS
I
CONTENTS
CONTENTS .......................................................................................................................................................I
SUPERVISOR’S RECOMMENDATIONS ................................................................................................ III
LIST OF SYMBOLS AND ABBREVIATIONS ........................................................................................... V
1. INTRODUCTION, GLOBAL AIMS OF THE RESEARCH WORK ................................................ 1
2. HIGH STRENGTH STEELS ................................................................................................................. 3 2.1. Classification and trends of development.......................................................................................... 3
2.2. Production processes and their influences on welding ..................................................................... 6
2.2.1. Precipitation hardening ....................................................................................................... 12 2.2.2. Grain refinement and work hardening ................................................................................. 13
2.3. Application fields, requirements, loads and processing technologies ............................................. 14
2.3.1. First case study: H-shape beam ........................................................................................... 15 2.3.2. Second case study: boggi beam and dipper arm .................................................................. 16 2.3.3. Third case study: butt and fillet welds HSS of yield strength 350 – 960 MPa ..................... 17 2.3.4. Fourth case study: welding of advanced alloyed ................................................................. 18
2.4. Weldability questions, mismatching, cracking phenomena ............................................................. 18
2.4.1. Solidification cracking (hot cracking) ................................................................................. 20 2.4.2. Hydrogen-induced cracking (cold cracking) ....................................................................... 20 2.4.3. Lamellar tearing .................................................................................................................. 20 2.4.4. Case studies of different mismatches investigated ............................................................... 21
2.5. Recommendations to the aims ......................................................................................................... 22
3. CYCLIC LOADS ................................................................................................................................... 23 3.1. Failure statistics .............................................................................................................................. 23
3.2. Generalities, importance, classification .......................................................................................... 23
3.2.1. Fundamentals of assessment procedures ............................................................................. 23 3.2.2. Types of assessment procedures .......................................................................................... 25
3.3. High cycle fatigue (HCF) characteristics and fatigue strength curves ........................................... 28
3.3.1. Details of welding charachteristics, base materials (BM) and filler metals (FM) ............... 28 3.3.2. Fatigue resistance curves – as welded cases ....................................................................... 29 3.3.3. Fatigue resistance curves – weld improvement cases .......................................................... 31 3.3.4. S-N curve build up ............................................................................................................... 33
3.4. Fatigue crack growth (FCG) and characteristics ........................................................................... 34
3.4.1. Cases where one strength category of base materials was investigated .............................. 36 3.4.2. Cases where two strength categories of base materials was investigated ........................... 40 3.4.3. Cases where more strength categories of base materials was investigated ......................... 42
3.5. Recommendations to the aims ......................................................................................................... 43
4. SUMMARY, SPECIFIC AIMS OF THE RESEARCH WORK ....................................................... 44
5. CIRCUMSTANCES OF THE INVESTIGATIONS .......................................................................... 45 5.1. Characteristics of the base materials and filler metals ................................................................... 45
5.2. Testing matrix ................................................................................................................................. 47
5.3. Welding circumstances .................................................................................................................... 49
5.4. Results of hardness testing, the hardness distributions ................................................................... 53
CONTENTS
II
6. HIGH CYCLE FATIGUE (HCF) TESTS ........................................................................................... 56 6.1. Testing characteristics .................................................................................................................... 56
6.2. Results of HCF tests, „Mean” S-N curves ...................................................................................... 56
6.3. Determination of high cycle fatigue strength curves ....................................................................... 62
6.4. Conclusions ..................................................................................................................................... 65
7. FATIGUE CRACK GROWTH (FCG) TESTS .................................................................................. 67 7.1. Testing characteristics .................................................................................................................... 67
7.2. Results of FCG tests ........................................................................................................................ 68
7.3. Determination of fatigue crack propagation design or limit curves ............................................... 74
7.4. Conclusion ...................................................................................................................................... 80
8. THESES – NEW SCIENTIFIC RESULTS ......................................................................................... 83
9. SUMMARY ............................................................................................................................................ 85
10. APPLICATION POSSIBILITIES OF THE RESULTS .................................................................... 87
ACKNOWLEDGEMENTS ........................................................................................................................... 89
DEDICATION ................................................................................................................................................ 91
REFERENCES ............................................................................................................................................... 92
LIST OF PUPLICATIONS RELATED TO THE TOPIC OF THE RESEARCH FIELD ..................... 99
APPENDICES .............................................................................................................................................. 101
SUPERVISOR’S RECOMMENDATION
III
SUPERVISOR’S RECOMMENDATIONS
Haidar Faisal Helal Mobark was born in Babylon city (Iraq) on 27th April 1980; his
nationality is Iraqi. He is married since 2006 with three children, two girls and one boy.
He was a bachelor student between October 1998 and July 2002, studied at Agriculture and
Machinery Equipment Engineering Techniques Department at Technical College of Al-Mussaib
(T.C.M) in Babylon city. He got his BSc degree "First with Honor's" on average (74.09%) level.
After the graduation, from July 2002 to March 2004 he was worked together with his father in
their small market. He started a first governmental job in Babylon Directorate of Water
Resources. He was a member at Department of Water Regulators between March 2004 and
January 2006 deals with setup, maintenance, repairing of barriers, gates and dams work on water
i.e. canals, streams and rivers.
He was earned a new government job (and left the previous) under the Iraqi Ministry of
Higher Education and Scientific Research. He worked at the Department of Mechanical
Engineering / College of Engineering / University of Babylon between January 2006 and August
2010. He performed administration, practical and teaching activities at the department and
college as well. He did practical teaching activity for Bachelor Engineering Students form
different departments belong to the College of Engineering in workshops: welding place on
different welding machines, grinding machines place, and in turning place. He has made
practical teaching activities in computer laboratory also for training different class of Bachelor
Mechanical Engineering Students on Auto-CAD program for using in the design of machine
tools and engineering drawing.
He has been abroad in India between August 2010 and June 2012 for doing a Master of
Technology (M-Tech) during Indian Council for Cultural Relations (ICCR) scholarship. He
completed his master study in Machine Design, at Department of Mechanical Engineering,
Faculty of Engineering and Technology in JAMIA MILLIA ISLAMIA in New Delhi. He has
studied many subjects: Optimization Methods, Theoretical and Experimental Stress Analysis,
Advanced Mechanisms, Advanced Mechanical Engineering Design (Theoretical & Practical),
Advanced Mathematical (1st semester); Finite Element Methods (FEM) (Theoretical &
Practical), Mechatronics, Mechanical Vibration, Tribological System Design, Concurrent
Engineering (2nd semester); Robotics, Design of Experiment, Minor Project (3rd semester);
Dissertation (4th semester). However, he got "First with Honor's" in average (8.78 out of 10
CGPA) level and completed his study under several respected professors and doctors i.e. Prof.
Zahid Akhtar Khan, Prof. I. A. Khan, Prof. Rasheed Ahmed Khan, Prof. Mohammed Suhaib, Dr.
Sabah Khan, and Prof. Aas Mohammed how was his supervisor during his master study.
He has come back to his home and joined a new administration job at the same College of
Engineering / University of Babylon in between June 2012 and August 2013. On August 2013 he
converted his work location to another new governmental university also in Babylon city, right
SUPERVISOR’S RECOMMENDATION
IV
now his job concerning with Department of Soil and Water Resource at College of Agriculture at
Al-Qasim Green University till August 2016.
He was a Lecturer Assistant at his younger and renewing university, and he thought the BSc
students theoretically and practically in the subjects as follows: Tractors and Agriculture
Equipments, Computer Applications i.e. Auto-CAD application. Even with teaching activities,
he carried out different administration activities regarding their teaching staff, college employees
and students i.e. member and head in different groups: students’ examination committee,
computer maintenance committee, inspection and receipt committee, procurement committee.
During his governmental work (2004-2016) he earned (3) letters of thanks from Iraqi Minister
of Higher Education and Scientific Research, as well as (25) extra letters of thanks from
university presidents and deans i.e. “President of Babylon University”, “President of Al-Qasim
Green University” and “Dean of College of Engineering”, “Dean of College of Agriculture”.
He shared developing courses to improve his academic abilities and practical knowledge:
course of developing teaching skills, computer maintenance course, learning Ansys-5 course at
University of Babylon and course of education communication skills, the terminal seminar for
department teaching staff at Al-Qasim Green University.
From September 2016 till now he is a full-time PhD student in the framework of “Stipendium
Hungaricum Scholarship Programme” at István Sályi Doctoral School of Mechanical
Engineering Sciences; his affiliated organisation is Institute of Materials Science and
Technology / Faculty of Mechanical Engineering and Informatics.
Through his previous studies and industrial practice, he has had a wide knowledge in different
specializations, but he had not adequate and sufficient knowledge in the field of welding, fatigue
and fracture. Therefore, in the first period, he started to study the relevant literature focusing on
his research topic. He has selected systematically the subjects, hold presentations on research
seminars, and taken part in institutional research work.
We have planned his research work collectively, and built-up a research and investigation
plan (investigation matrix). He prepared and investigated welded joints through the academic
and assistant staff of the Institute, with different technological and testing parameters. Both high
cycle fatigue and fatigue crack growth tests were performed and evaluated, applying statistical
methods. As an evident consequence of cyclic loading conditions, the long testing period has
been predicted. He was active and persistent during that two and half years long work.
After the successful complex exam and reaching the first investigation results, his publication
activity has increased. The results of the research work have presented in doctoral seminars,
doctoral forums, and international conferences; scientific papers have prepared for journals and
conference proceedings. His self-dependence has developed in this field continuously.
During his PhD studies his knowledge, his affinity to research work, his ability and suitability
for the holding of presentations have developed significantly. He has acquired new knowledge
and competences, which can be utilised and individually developed his future work, his future
academic and scientific life.
I am sure that his Stipendium Hungaricum scholarship period will initiate new possibilities
for Haidar Faisal Helal Mobark in the near future.
Miskolc, 15th April 2020
Prof. Dr. János Lukács
Supervisor
LIST OF SYMBOLS AND ABBREVIATIONS
V
LIST OF SYMBOLS AND ABBREVIATIONS
GREEK LETTERS
α Ferrite (solid solution of iron alloy) N/A
α Shape parameter in Weibull-distribution function (Equation 7.1) –
β Scale parameter in Weibull-distribution function (Equation 7.1) –
γ Austenite (solid solution of iron alloy) N/A
ε Level of significance –
Thermal efficiency –
σ (Normal) stress MPa
(Normal) stress range Mpa
D (Constant amplitude) fatigue limit Mpa
Δσ1E07 Stress range belonging to 1×10⁷ cycles Mpa
ΔF Load range N
ΔJ Cyclic J-integral kJ/m2
K Stress intensity factor range Mpa m1/2
Kfc Fatigue fracture toughness Mpa m1/2
Kth Threshold stress intensity factor range Mpa m1/2
ΔW Strain energy range J
LATIN LETTERS
a Crack size or crack length mm
a Material constant of the Basquin equation (Equations 1.1 and 6.1) –
a0 Initial crack length (FCG specimens) mm
a0 Specimen width (HCF specimens) mm
A Elongation %
AC Air cooling mm
AcC Accelerated cooling N/A
AHSS Advance high strength steel N/A
b Material constant (Equation 1.1) –
b0 Specimen thickness (HCF specimens) mm
B Specimen thickness (FCG specimens) mm
BM Base material N/A
LIST OF SYMBOLS AND ABBREVIATIONS
VI
BWJ Butt welded joint N/A
BL Buffer layer N/A
C Constant of Paris-Erdogan equation –
Ci, Cj Constants of fatigue crack propagation equations (i = m, p; j = 1, 2) –
CE, Ceq Carbon equivalent %
CCT Centre cracked tension specimen (subchapter 3.4.) N/A
CCT Continuous Cooling Transformation (subchapter 2.4.) N/A
CR Controlled rolling N/A
CVN Charpy impact energy (V notched specimen) J
da/dN Fatigue crack propagation rate mm/cycle
Ev Linear energy J/mm
f Testing frequency Hz
FCG Fatigue crack growth N/A
FM Filler metal N/A
FCAW Flux cored arc welding N/A
F3 Shape factor of welded joint –
GMAW Gas metal arc welding N/A
h Specimen direction (HCF specimens) N/A
hhi High heat input N/A
HAZ Heat affected zone N/A
HCF High cycle fatigue N/A
HFMI High frequency mechanical impact N/A
HOP Heat treatment on-line process N/A
HS High strength N/A
HSLA High strength low alloyed N/A
HSS High strength steel N/A
HSSS High strength structural steel N/A
HTT High temperature tempering N/A
HV Vickers hardness –
I Welding current A
IIW International Institute of Welding N/A
JSME Japan Society of Mechanical Engineers N/A
k Specimen direction (HCF specimens) N/A
K Stress intensity factor MPa m1/2
Ki Stress intensity factor (i = I, II, III) MPa m1/2
Kc Critical stress intensity factor (Equation 3.3) MPa m1/2
lhi Low heat input N/A
LEFM Linear elastic fracture mechanics N/A
L-S, L-T Specimen orientations (FCG specimens) N/A
LIST OF SYMBOLS AND ABBREVIATIONS
VII
LTT Low temperature tempering (subchapter 2.4) N/A
LTT Low transformation temperature (Fig. 3.11) N/A
m Exponent of fatigue crack propagation equation (Equation 3.1) –
m Material constant of Basquin equation (Equation 6.1) –
mhi Medium heat input N/A
M-A Martensite - Austenite (island) N/A
MAG Metal active gas N/A
MMM Metal magnetic memory N/A
MMR Mismatch ratio N/A
M Matching N/A
n Exponent of Paris-Erdogan equation –
ni Exponents of fatigue crack propagation equations (i = 1, 2) –
N Number of cycles (FCG) cycle
N, Nfracture Number of cycles to failure (HCF) cycle
NGLW Narrow gap laser welding N/A
Nk Number of cycles for the break point of the S-N curve cycle
N0 Threshold parameter in Weibull-distribution function (Equation 7.1) –
OLAC On-line accelerated cooling N/A
OM Overmatching N/A
p Exponent of fatigue crack propagation equation (Equation 3.3) –
PWHT Post weld heat treatment N/A
P-GMAW Pulsed gas metal arc welding N/A
Q+T Quenched and tempered N/A
R, R Stress ratio –
RD Rolling direction N/A
RPC Relaxation precipitation control N/A
Ri Yield strength (i = y, p0.2) MPa
Rm Tensile strength MPa
SAW Submerged arc welding N/A
SD Standard deviation N/A
SP Specimen N/A
S-N Stress vs. number of cycles to failure curve N/A
S0 Cross section of the specimen (HCF specimens) mm2
t Plate or specimen thickness mm
t8/5. t8.5/5 Cooling time from 800°C to 500°C and 850°C to 500°C s
TM Thermomechanical(ly treated) N/A
TMCP Thermomechanical control process N/A
TMR Thermo-mechanical rolling N/A
TPB Three point bending test specimen N/A
TTT Time-temperature-transformation N/A
LIST OF SYMBOLS AND ABBREVIATIONS
VIII
T-L, T-S Specimen orientations (FCG specimens) N/A
U Welding voltage V
UHS Ultra-high strength N/A
UHSS Ultra-high strength steel N/A
UIT Ultrasonic impact treatment N/A
UM Undermatching N/A
v Specimen direction (HCF specimens) N/A
vw Welding speed cm/min
W Specimen width (FCG specimens) mm
WJ Welded joint N/A
WM Weld metal N/A
Y/T Ratio of the yield strength and tensile strength MPa/MPa
1W, 21W
3W, 23W
Notch and crack path orientations
(FCG specimens cut from welded joints) N/A
SUBSCRIPTS
eff effective N/A
ip interpass N/A
max maximum N/A
min minimum N/A
pre preheating N/A
INTRODUCTION, GLOBAL AIMS
1
1. INTRODUCTION, GLOBAL AIMS OF THE RESEARCH WORK
The term fatigue was mentioned for the first time by Braithwaite in 1854; he described many
service fatigue failures of water pumps, propeller shafts, crankshafts, railway axles, levers,
cranes, etc.. In 1870 Wӧhler presented his law (Wӧhler law), based on investigations of railway
axles. He composed as follows: “Material can be induced to fail by many repetitions of stresses,
all of which are lower than the static strength. The stress amplitudes are decisive for the
destruction of the cohesion of the material. The maximum stress is of influence only in so far as
the higher it is, the lower are the stress amplitudes which lead to failure”. In 1936 Wӧhler’s
successor presented the S-N curve, it is called Wӧhler curve, and Basquin represented the finite
life region of the Wöhler curve and described it by a simple formula [1]:
. (1.1)
After that Bauschinger mentioned for fatigue by his sentence “the change of the elastic limit
by often repeated stress cycles”. The first experiments to improve the fatigue strength of
components probably were carried out in the U.K. during the First World War [1].
From 1960 onwards the number of fatigue experts increased still further. This must also be
attributed to the rapid development of fracture mechanics, i.e. of fatigue-crack propagation. Paris
established that fatigue-crack propagation could be described by the following equation [2]:
, (1.2)
which equation soon set out on a veritable triumphant advance around the world [1]. The
complex process of crack propagation is undoubtedly described much too simply by this
equation; this fact however, did not prevent its – either undiscriminating or adding further
characteristics – use all over the world to this very day.
The most commonly used structural material for the construction of engineering structures is
steel, and the most widely used manufacturing technology is welding. Nowadays, steel providers
create a modern version of a high-strength base materials and filler metals with yield strength
start from 690 MPa and up. However, high strength lightweight structures with low cost of steel
weldments lead to apply in many manufacturing aspects (e.g. mobile cranes, hydropower plants,
offshores, trucks, earthmoving machines, and drums), because of an extensive reduction in
weight [3].
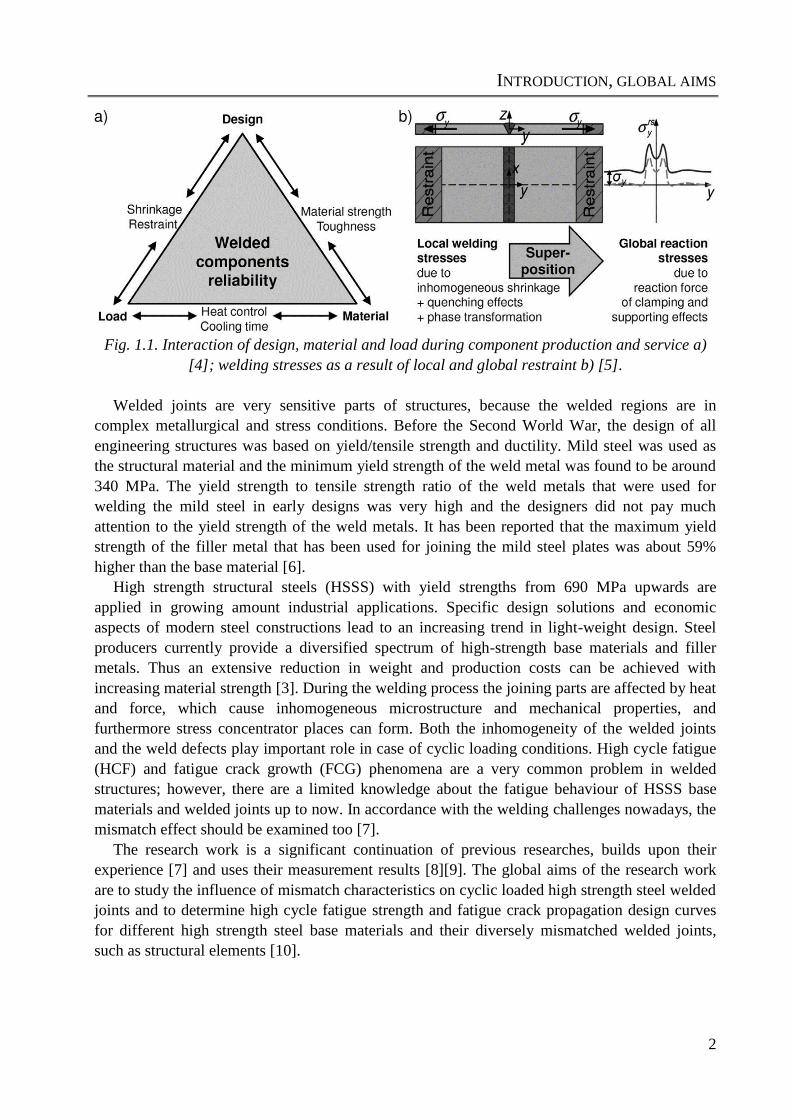
As in (Fig. 1.1 a) can be seen, the interaction of load, material, and design represents
reliability of welded components. A superposition of local and global welding stresses may lead
to high residual stress levels which are able to reduce the components safety (see Fig.1.1 b) [3].
INTRODUCTION, GLOBAL AIMS
2
Fig. 1.1. Interaction of design, material and load during component production and service a)
[4]; welding stresses as a result of local and global restraint b) [5].
Welded joints are very sensitive parts of structures, because the welded regions are in
complex metallurgical and stress conditions. Before the Second World War, the design of all
engineering structures was based on yield/tensile strength and ductility. Mild steel was used as
the structural material and the minimum yield strength of the weld metal was found to be around
340 MPa. The yield strength to tensile strength ratio of the weld metals that were used for
welding the mild steel in early designs was very high and the designers did not pay much
attention to the yield strength of the weld metals. It has been reported that the maximum yield
strength of the filler metal that has been used for joining the mild steel plates was about 59%
higher than the base material [6].
High strength structural steels (HSSS) with yield strengths from 690 MPa upwards are
applied in growing amount industrial applications. Specific design solutions and economic
aspects of modern steel constructions lead to an increasing trend in light-weight design. Steel
producers currently provide a diversified spectrum of high-strength base materials and filler
metals. Thus an extensive reduction in weight and production costs can be achieved with
increasing material strength [3]. During the welding process the joining parts are affected by heat
and force, which cause inhomogeneous microstructure and mechanical properties, and
furthermore stress concentrator places can form. Both the inhomogeneity of the welded joints
and the weld defects play important role in case of cyclic loading conditions. High cycle fatigue
(HCF) and fatigue crack growth (FCG) phenomena are a very common problem in welded
structures; however, there are a limited knowledge about the fatigue behaviour of HSSS base
materials and welded joints up to now. In accordance with the welding challenges nowadays, the
mismatch effect should be examined too [7].
The research work is a significant continuation of previous researches, builds upon their
experience [7] and uses their measurement results [8][9]. The global aims of the research work
are to study the influence of mismatch characteristics on cyclic loaded high strength steel welded
joints and to determine high cycle fatigue strength and fatigue crack propagation design curves
for different high strength steel base materials and their diversely mismatched welded joints,
such as structural elements [10].
HIGH STRENGTH STEELS AND THEIR WELDABILITY
3
2. HIGH STRENGTH STEELS
2.1. Classification and trends of development
For years, metallurgists have been searching ways of producing structural steels which would
have the highest (possible) mechanical properties and maintain satisfactory plastic properties at
the same time. Due to an increase in yield point, it is now possible to manufacture structures
consisting of smaller wall thickness elements, thus lighter and less expensive to transport. A
smaller wall thickness requires a smaller amount of filler metals and a shorter welding time,
simultaneously. An increase in the mechanical properties of steels may be obtained by an
appropriate selection of chemical composition through a classic process of toughening
(hardening and tempering) or by means of thermomechanical treatment. However, no matter
how high its mechanical properties might be, structural steel will only have practical application
if it can be welded by means of commonly used methods; toughened steels offer such a
possibility. Due to the appropriate selection of chemical composition and proper heat treatment,
these steels are characterised by very good mechanical properties as well as good weldability.
The modern development of structural steels has involved on the one hand toughened steels
such as S690Q, S890Q and S960Q, while on the other hand thermomechanically rolled steels of
lower mechanical properties but of a higher impact strength (S355M, S460M and S500M) [11].
Steels of 690 MPa yield have become commercial about three decades ago. In the last years
thermomechanical rolling followed by accelerated cooling becomes alternative production route.
Different techniques to increase high tensile properties of steel to yield point 690 MPa occurs by
martensitic hardening, precipitation hardening, work hardening, and grain refinement [11][12].
Due to very high mechanical properties, steels of a yield point in excess of 1100 MPa have
found application in the production of high-loaded elements of car lifts, travelling cranes and
special bridge structures. The advantages of using steels with high mechanical properties are
visible as regards the costs of transport, plastic working, cutting, and welding [11].
New methods have been developed since the seventies, when quenched and tempered (Q+T)
group appeared. With this heat treatment process, combined with alloying components, the
maximal yield strength can reach 1300 MPa. However, it should not be ignored that filler metals
are not available, up to now, for this extreme strength, only if undermatching (approximately 15-
20%) is allowed. It is important to note that applying undermatching during the selection of the
filler metal may have some additional positive effects (residual stress, fatigue properties, etc.).
Due to the above mentioned causes, instead of S1100Q and S1300Q, the S960Q is more
widespread, which can be welded by matched filler metals, as well. By the recent development
of the thermomechanical (TM) process, the yield strength of TM steels have approached Q+T
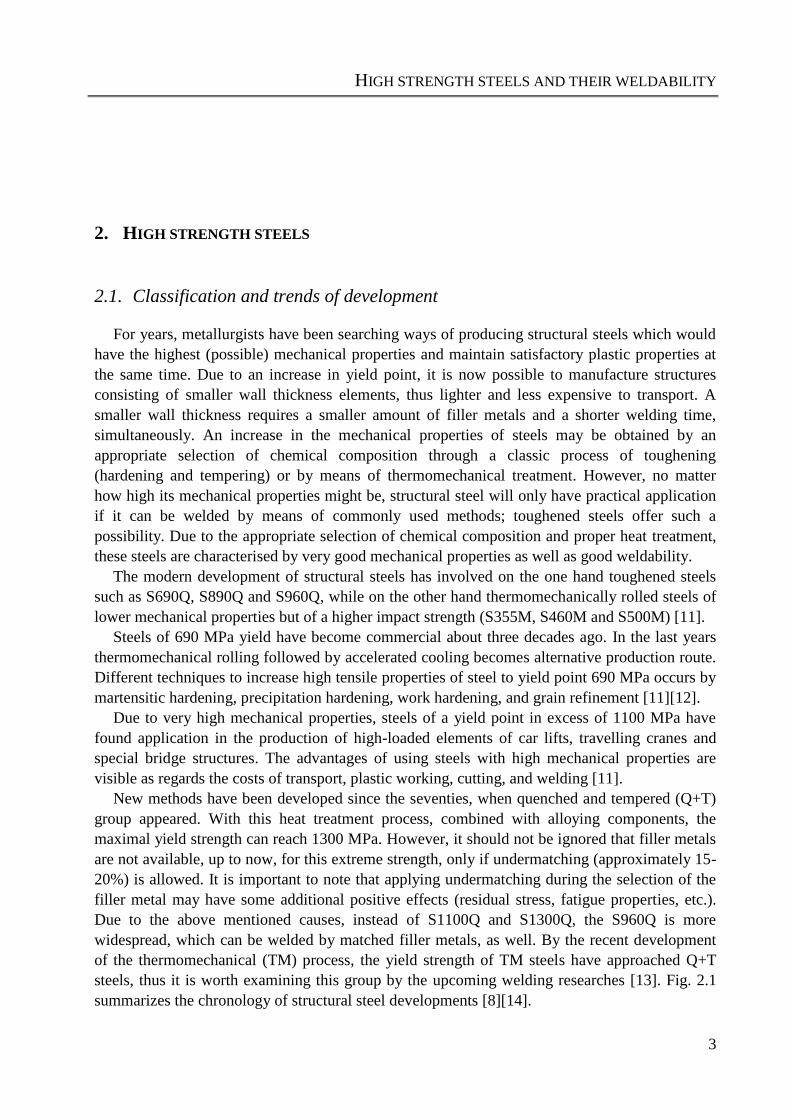
steels, thus it is worth examining this group by the upcoming welding researches [13]. Fig. 2.1
summarizes the chronology of structural steel developments [8][14].
HIGH STRENGTH STEELS AND THEIR WELDABILITY
4
Fig. 2.1. Chronology of structural steels developments [8][13][14].
According to steel manufacturing companies’ data the minimum yield strengths of (extra)
high strength steel plates stated for Q+T steels 1300 MPa [107][108] and for TM steels 1100
MPa [109]. These mean that hatched areas in Fig. 2.1 are nowadays available for users and
development trends have shifted for higher strengths.
For better mechanical properties and weldability of structural steels these occur during proper
chemical composition and by apply classical methods (Q+T, TMCP) improving microstructure
of steels. The competition between steelmakers to produce a thinner steel wall with higher
mechanical and plastic properties; lighter and low cost during transportation of components and
also low cost of welding technology by a decrease in filler metal and short time during welding
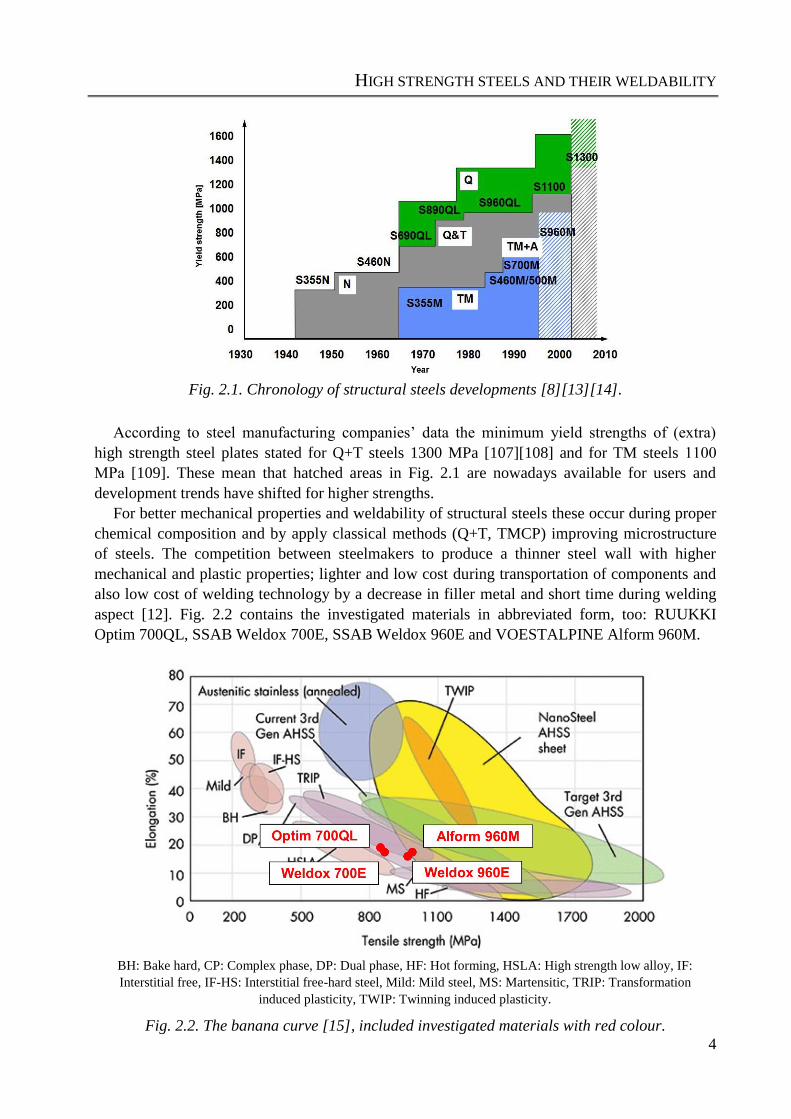
aspect [12]. Fig. 2.2 contains the investigated materials in abbreviated form, too: RUUKKI
Optim 700QL, SSAB Weldox 700E, SSAB Weldox 960E and VOESTALPINE Alform 960M.
BH: Bake hard, CP: Complex phase, DP: Dual phase, HF: Hot forming, HSLA: High strength low alloy, IF:
Interstitial free, IF-HS: Interstitial free-hard steel, Mild: Mild steel, MS: Martensitic, TRIP: Transformation
induced plasticity, TWIP: Twinning induced plasticity.
Fig. 2.2. The banana curve [15], included investigated materials with red colour.
HIGH STRENGTH STEELS AND THEIR WELDABILITY
5
The development of the metallurgical process obtained by decrease both production cost and
disadvantages impurities in structural steel to protect it from lamellar tearing or hot cracking
[16]. For example, yield point increased 130 MPa, carbon equivalent decrease by 0.05%, and
better weldability obtained by applying new production technology than conventional one. The
comparison between conventional and new technologies of production of structural steel belong
Q+T type occur by apply heat treatment and conditions of rolling and kept same chemical
composition. The range of structural steel thicknesses will grow along with the development of
metallurgical processes. In the case of these steels, one of the most important features of the
successfulness of the weldability is the heat input which can be described with the linear energy.
If the value of this is too low, the cooling rate of the welded joint may be too fast, and then cold
cracks can be developed. In the opposite case, strong coarse grain microstructure can be evolved
in the HAZ, which can be caused by the decreasing of the strength and toughness features [110].
The advantages of using steels with high mechanical properties are regards to the costs of
transport, plastic working, cutting, and welding [11].
There are different elements effects on chemical composition during metallurgical process of
Q+T steel [8][11][110] as follows.
Cr and Mo: decrease critical cooling rate and increase hardenability.
Nb: fine grains of austenite during rolling and thus very tiny lamellas of supersaturated ferrite
(martensite) after cooling. Tempering 600ºC, precipitation hardening of NbC or V4C3 develop
strength and impact resistance i.e. obtained a fine-grained structure with dispersive carbides.
Ni: improve impact strength.
Micro-addition of B below 0.005%: improve hardenability.
Sufficient amount of Ti: to bind nitride in TiN and avoid worsening the ductility of steel.
V: addition V levels 0%, 0.047%, 0.097% and 0.151% gives a strengthening to the steels,
tensile and yield strengths increase. The simulated HAZs of steels containing 0%, 0.047%V
exhibited good combination of strength and impact toughness. The simulated HAZs of steels
containing 0.097%, 0.15l%V showed higher strength and lower impact toughness. Size of
Martensite-Austenite (M-A) particle in HAZ increased with increasing V content. The largest
M-A constituent in HAZ of 0.151%V steel caused lowest impact toughness.
The essential advantages of TM steel developing are as follows [8][17][18][19][20].
Weight / volume reduction: light weight and smaller volume, which is cost-saving advantage.
Best cuttability: the low carbon content and homogeneous surface make HS, UHS steel grades
suitable for cutting methods.
Very good cold formability: improved forming behavior with more than twice the minimum
yield strength than conventional structural steels.
Outstanding weldability: combination of thermomechanical rolling and micro-alloying makes
very low carbon content. However lower maximum hardness in HAZ, reduced tendency to
temper softening in HAZ, and reduced susceptibility to cold cracking.
Excellent toughness: thermomechanical rolling and accelerated cooling lend steel grades a
fine-grained structure and excellent toughness.
Perfect flatness: excellent flatness is achieved through precisely controlled rolling processes in
combination with modern leveling units and production-route-based temper softening.
Clean surface: during a uniform layer of scale forms on the sheet surface following hot rolling
process.
HIGH STRENGTH STEELS AND THEIR WELDABILITY
6
2.2. Production processes and their influences on welding
One of the famous technology that absolutely used to development microstructural control
technology and has an essential role during welding process technology is thermomechanical
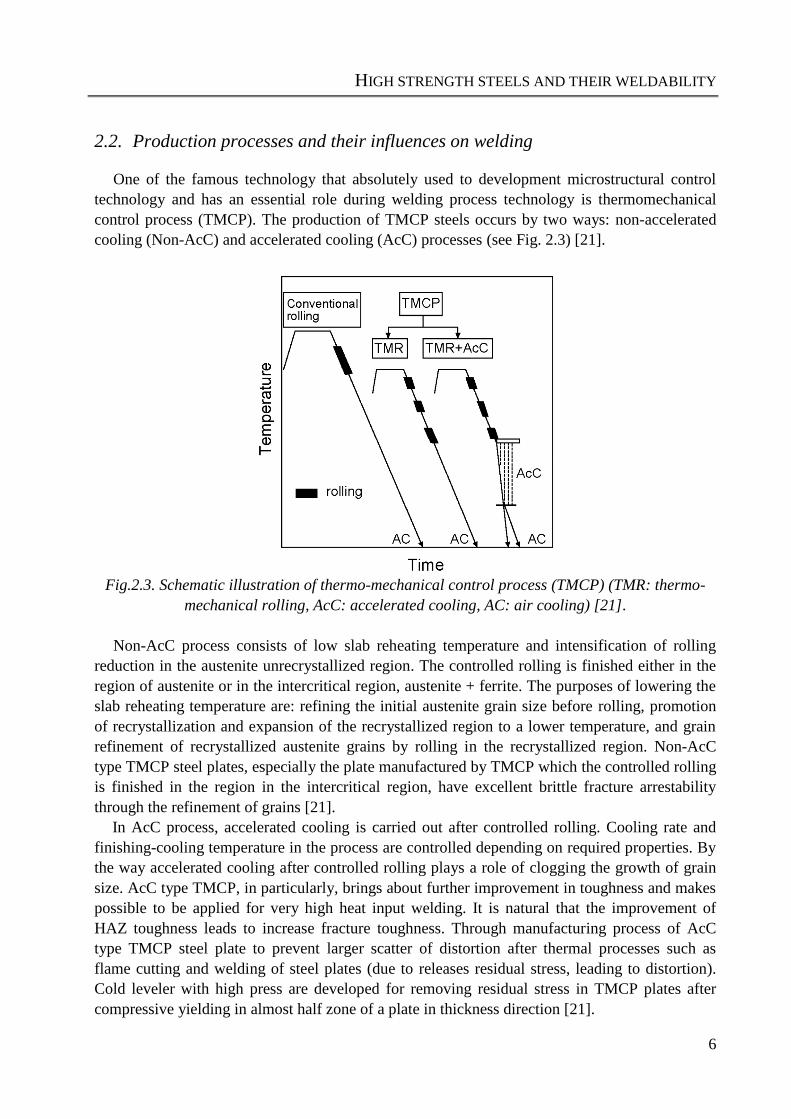
control process (TMCP). The production of TMCP steels occurs by two ways: non-accelerated
cooling (Non-AcC) and accelerated cooling (AcC) processes (see Fig. 2.3) [21].
Fig.2.3. Schematic illustration of thermo-mechanical control process (TMCP) (TMR: thermo-
mechanical rolling, AcC: accelerated cooling, AC: air cooling) [21].
Non-AcC process consists of low slab reheating temperature and intensification of rolling
reduction in the austenite unrecrystallized region. The controlled rolling is finished either in the
region of austenite or in the intercritical region, austenite + ferrite. The purposes of lowering the
slab reheating temperature are: refining the initial austenite grain size before rolling, promotion
of recrystallization and expansion of the recrystallized region to a lower temperature, and grain
refinement of recrystallized austenite grains by rolling in the recrystallized region. Non-AcC
type TMCP steel plates, especially the plate manufactured by TMCP which the controlled rolling
is finished in the region in the intercritical region, have excellent brittle fracture arrestability
through the refinement of grains [21].
In AcC process, accelerated cooling is carried out after controlled rolling. Cooling rate and
finishing-cooling temperature in the process are controlled depending on required properties. By
the way accelerated cooling after controlled rolling plays a role of clogging the growth of grain
size. AcC type TMCP, in particularly, brings about further improvement in toughness and makes
possible to be applied for very high heat input welding. It is natural that the improvement of
HAZ toughness leads to increase fracture toughness. Through manufacturing process of AcC
type TMCP steel plate to prevent larger scatter of distortion after thermal processes such as
flame cutting and welding of steel plates (due to releases residual stress, leading to distortion).
Cold leveler with high press are developed for removing residual stress in TMCP plates after
compressive yielding in almost half zone of a plate in thickness direction [21].
HIGH STRENGTH STEELS AND THEIR WELDABILITY
7
During welding aspect many different microstructures generate in HAZ depending on thermal
cycles due to welding and chemical composition of steel. The maximum hardness decreases as
Ceq is lowered and bead length becomes large. Since it has the possibility of generation of micro-
cracking in the HAZ if the maximum hardness becomes larger than 400HV or more [21].
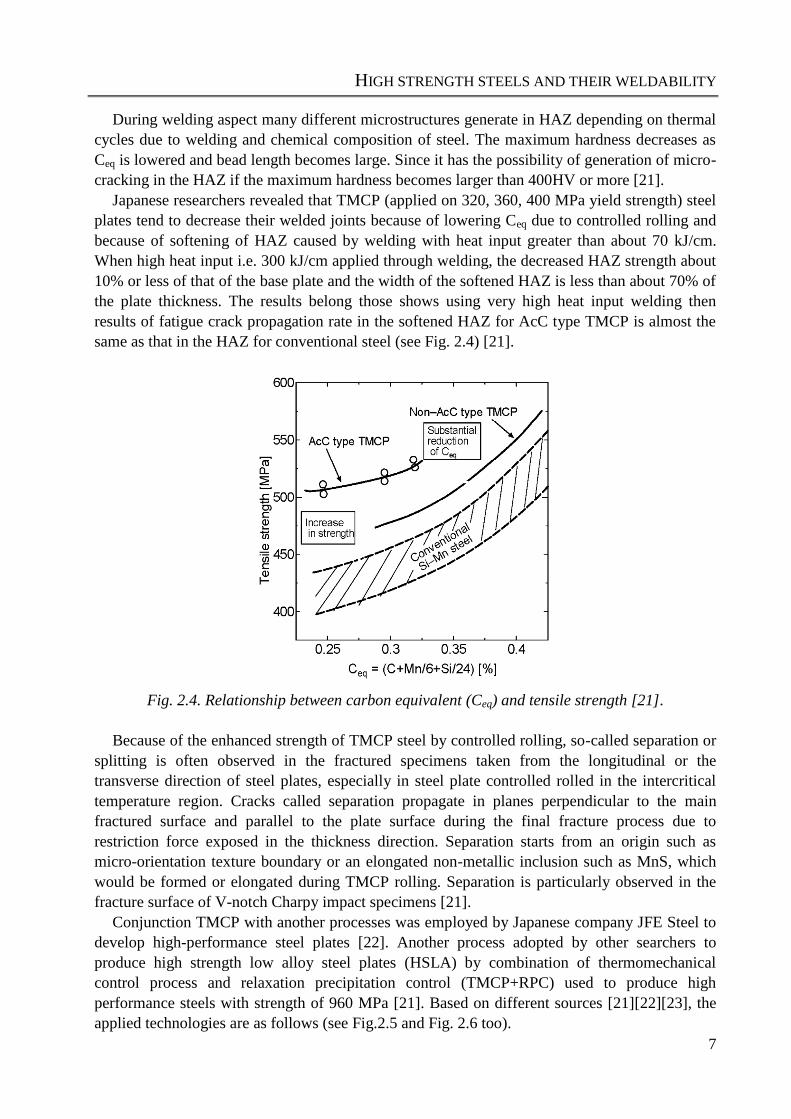
Japanese researchers revealed that TMCP (applied on 320, 360, 400 MPa yield strength) steel
plates tend to decrease their welded joints because of lowering Ceq due to controlled rolling and
because of softening of HAZ caused by welding with heat input greater than about 70 kJ/cm.
When high heat input i.e. 300 kJ/cm applied through welding, the decreased HAZ strength about
10% or less of that of the base plate and the width of the softened HAZ is less than about 70% of
the plate thickness. The results belong those shows using very high heat input welding then
results of fatigue crack propagation rate in the softened HAZ for AcC type TMCP is almost the
same as that in the HAZ for conventional steel (see Fig. 2.4) [21].
Fig. 2.4. Relationship between carbon equivalent (Ceq) and tensile strength [21].
Because of the enhanced strength of TMCP steel by controlled rolling, so-called separation or
splitting is often observed in the fractured specimens taken from the longitudinal or the
transverse direction of steel plates, especially in steel plate controlled rolled in the intercritical
temperature region. Cracks called separation propagate in planes perpendicular to the main
fractured surface and parallel to the plate surface during the final fracture process due to
restriction force exposed in the thickness direction. Separation starts from an origin such as
micro-orientation texture boundary or an elongated non-metallic inclusion such as MnS, which
would be formed or elongated during TMCP rolling. Separation is particularly observed in the
fracture surface of V-notch Charpy impact specimens [21].
Conjunction TMCP with another processes was employed by Japanese company JFE Steel to
develop high-performance steel plates [22]. Another process adopted by other searchers to
produce high strength low alloy steel plates (HSLA) by combination of thermomechanical
control process and relaxation precipitation control (TMCP+RPC) used to produce high
performance steels with strength of 960 MPa [21]. Based on different sources [21][22][23], the
applied technologies are as follows (see Fig.2.5 and Fig. 2.6 too).
HIGH STRENGTH STEELS AND THEIR WELDABILITY
8
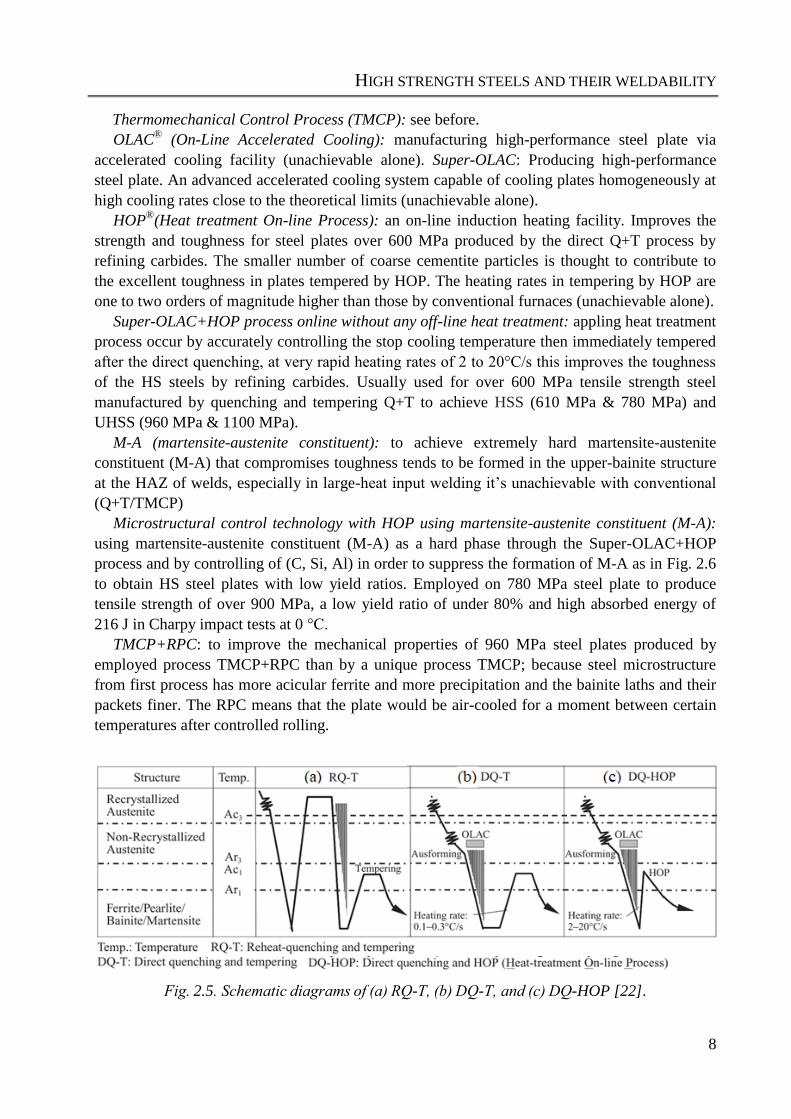
Thermomechanical Control Process (TMCP): see before.
OLAC®
(On-Line Accelerated Cooling): manufacturing high-performance steel plate via
accelerated cooling facility (unachievable alone). Super-OLAC: Producing high-performance
steel plate. An advanced accelerated cooling system capable of cooling plates homogeneously at
high cooling rates close to the theoretical limits (unachievable alone).
HOP®
(Heat treatment On-line Process): an on-line induction heating facility. Improves the
strength and toughness for steel plates over 600 MPa produced by the direct Q+T process by
refining carbides. The smaller number of coarse cementite particles is thought to contribute to
the excellent toughness in plates tempered by HOP. The heating rates in tempering by HOP are
one to two orders of magnitude higher than those by conventional furnaces (unachievable alone).
Super-OLAC+HOP process online without any off-line heat treatment: appling heat treatment
process occur by accurately controlling the stop cooling temperature then immediately tempered
after the direct quenching, at very rapid heating rates of 2 to 20°C/s this improves the toughness
of the HS steels by refining carbides. Usually used for over 600 MPa tensile strength steel
manufactured by quenching and tempering Q+T to achieve HSS (610 MPa & 780 MPa) and
UHSS (960 MPa & 1100 MPa).
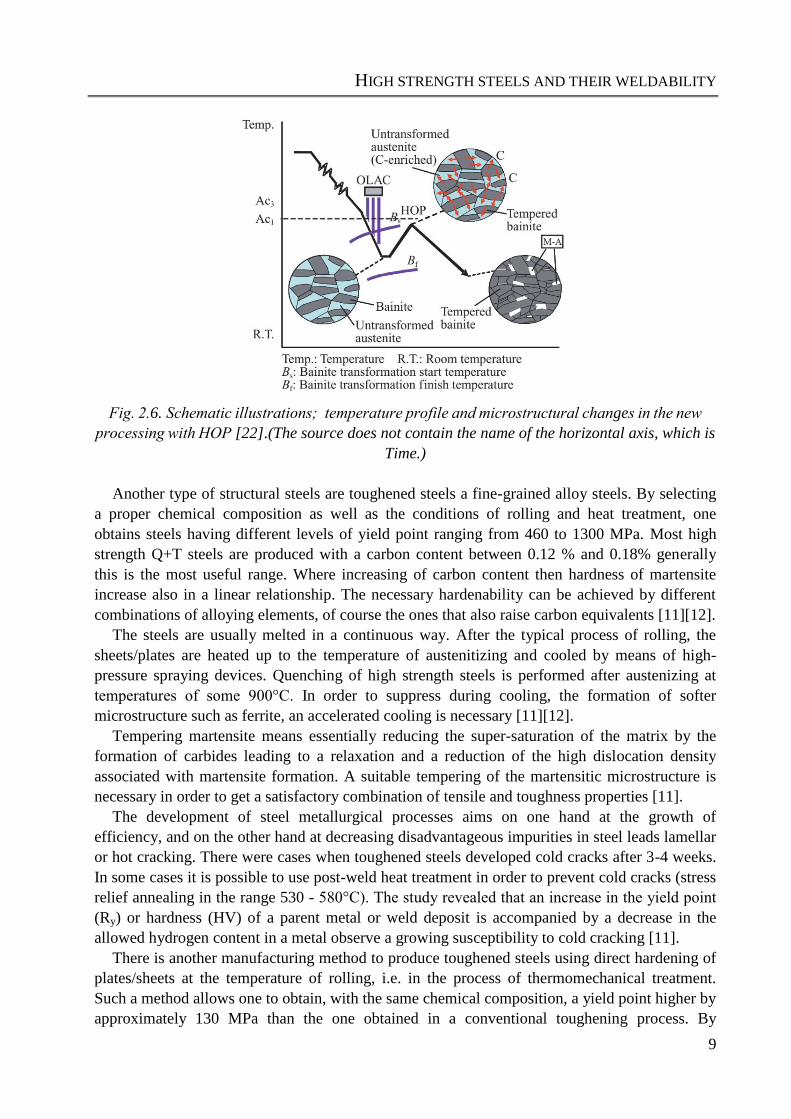
M-A (martensite-austenite constituent): to achieve extremely hard martensite-austenite
constituent (M-A) that compromises toughness tends to be formed in the upper-bainite structure
at the HAZ of welds, especially in large-heat input welding it’s unachievable with conventional
(Q+T/TMCP)
Microstructural control technology with HOP using martensite-austenite constituent (M-A):
using martensite-austenite constituent (M-A) as a hard phase through the Super-OLAC+HOP
process and by controlling of (C, Si, Al) in order to suppress the formation of M-A as in Fig. 2.6
to obtain HS steel plates with low yield ratios. Employed on 780 MPa steel plate to produce
tensile strength of over 900 MPa, a low yield ratio of under 80% and high absorbed energy of
216 J in Charpy impact tests at 0 °C.
TMCP+RPC: to improve the mechanical properties of 960 MPa steel plates produced by
employed process TMCP+RPC than by a unique process TMCP; because steel microstructure
from first process has more acicular ferrite and more precipitation and the bainite laths and their
packets finer. The RPC means that the plate would be air-cooled for a moment between certain
temperatures after controlled rolling.
Fig. 2.5. Schematic diagrams of (a) RQ-T, (b) DQ-T, and (c) DQ-HOP [22].
HIGH STRENGTH STEELS AND THEIR WELDABILITY
9
Fig. 2.6. Schematic illustrations; temperature profile and microstructural changes in the new
processing with HOP [22].(The source does not contain the name of the horizontal axis, which is
Time.)
Another type of structural steels are toughened steels a fine-grained alloy steels. By selecting
a proper chemical composition as well as the conditions of rolling and heat treatment, one
obtains steels having different levels of yield point ranging from 460 to 1300 MPa. Most high
strength Q+T steels are produced with a carbon content between 0.12 % and 0.18% generally
this is the most useful range. Where increasing of carbon content then hardness of martensite
increase also in a linear relationship. The necessary hardenability can be achieved by different
combinations of alloying elements, of course the ones that also raise carbon equivalents [11][12].
The steels are usually melted in a continuous way. After the typical process of rolling, the
sheets/plates are heated up to the temperature of austenitizing and cooled by means of high-
pressure spraying devices. Quenching of high strength steels is performed after austenizing at
temperatures of some 900°C. In order to suppress during cooling, the formation of softer
microstructure such as ferrite, an accelerated cooling is necessary [11][12].
Tempering martensite means essentially reducing the super-saturation of the matrix by the
formation of carbides leading to a relaxation and a reduction of the high dislocation density
associated with martensite formation. A suitable tempering of the martensitic microstructure is
necessary in order to get a satisfactory combination of tensile and toughness properties [11].
The development of steel metallurgical processes aims on one hand at the growth of
efficiency, and on the other hand at decreasing disadvantageous impurities in steel leads lamellar
or hot cracking. There were cases when toughened steels developed cold cracks after 3-4 weeks.
In some cases it is possible to use post-weld heat treatment in order to prevent cold cracks (stress
relief annealing in the range 530 - 580°C). The study revealed that an increase in the yield point
(Ry) or hardness (HV) of a parent metal or weld deposit is accompanied by a decrease in the
allowed hydrogen content in a metal observe a growing susceptibility to cold cracking [11].
There is another manufacturing method to produce toughened steels using direct hardening of
plates/sheets at the temperature of rolling, i.e. in the process of thermomechanical treatment.
Such a method allows one to obtain, with the same chemical composition, a yield point higher by
approximately 130 MPa than the one obtained in a conventional toughening process. By
HIGH STRENGTH STEELS AND THEIR WELDABILITY
10
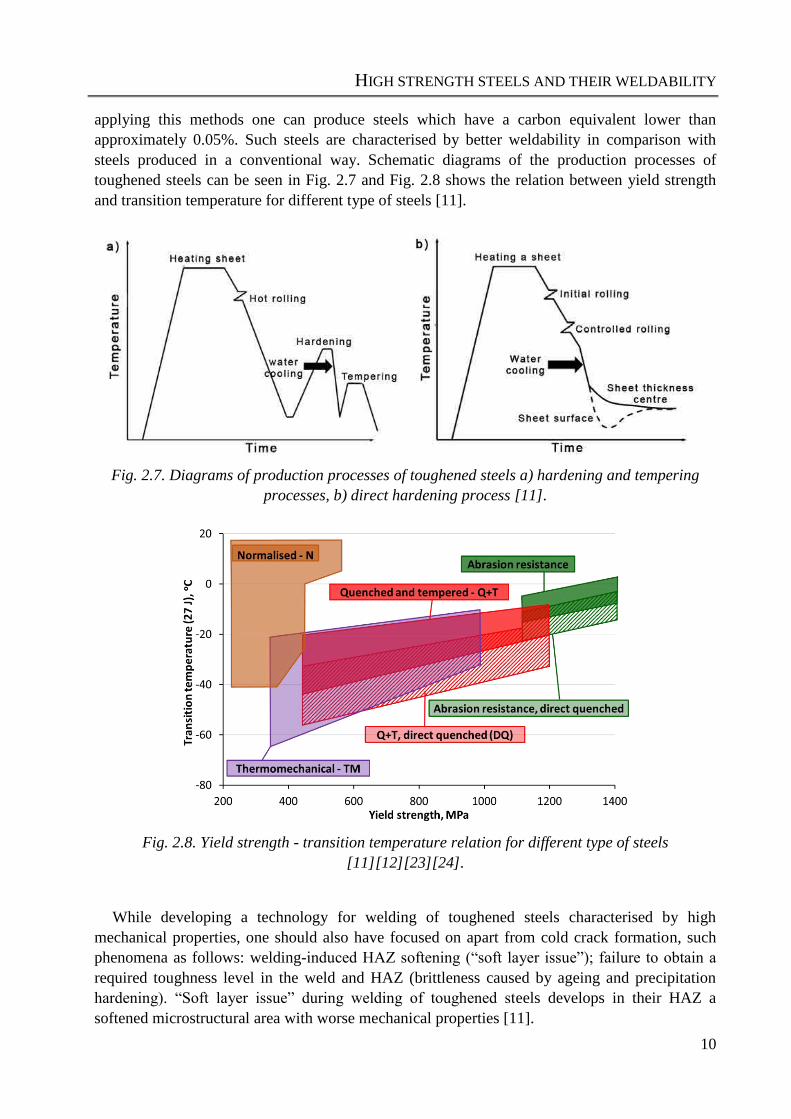
applying this methods one can produce steels which have a carbon equivalent lower than
approximately 0.05%. Such steels are characterised by better weldability in comparison with
steels produced in a conventional way. Schematic diagrams of the production processes of
toughened steels can be seen in Fig. 2.7 and Fig. 2.8 shows the relation between yield strength
and transition temperature for different type of steels [11].
Fig. 2.7. Diagrams of production processes of toughened steels a) hardening and tempering
processes, b) direct hardening process [11].
Fig. 2.8. Yield strength - transition temperature relation for different type of steels
[11][12][23][24].
While developing a technology for welding of toughened steels characterised by high
mechanical properties, one should also have focused on apart from cold crack formation, such
phenomena as follows: welding-induced HAZ softening (“soft layer issue”); failure to obtain a
required toughness level in the weld and HAZ (brittleness caused by ageing and precipitation
hardening). “Soft layer issue” during welding of toughened steels develops in their HAZ a
softened microstructural area with worse mechanical properties [11].
HIGH STRENGTH STEELS AND THEIR WELDABILITY
11
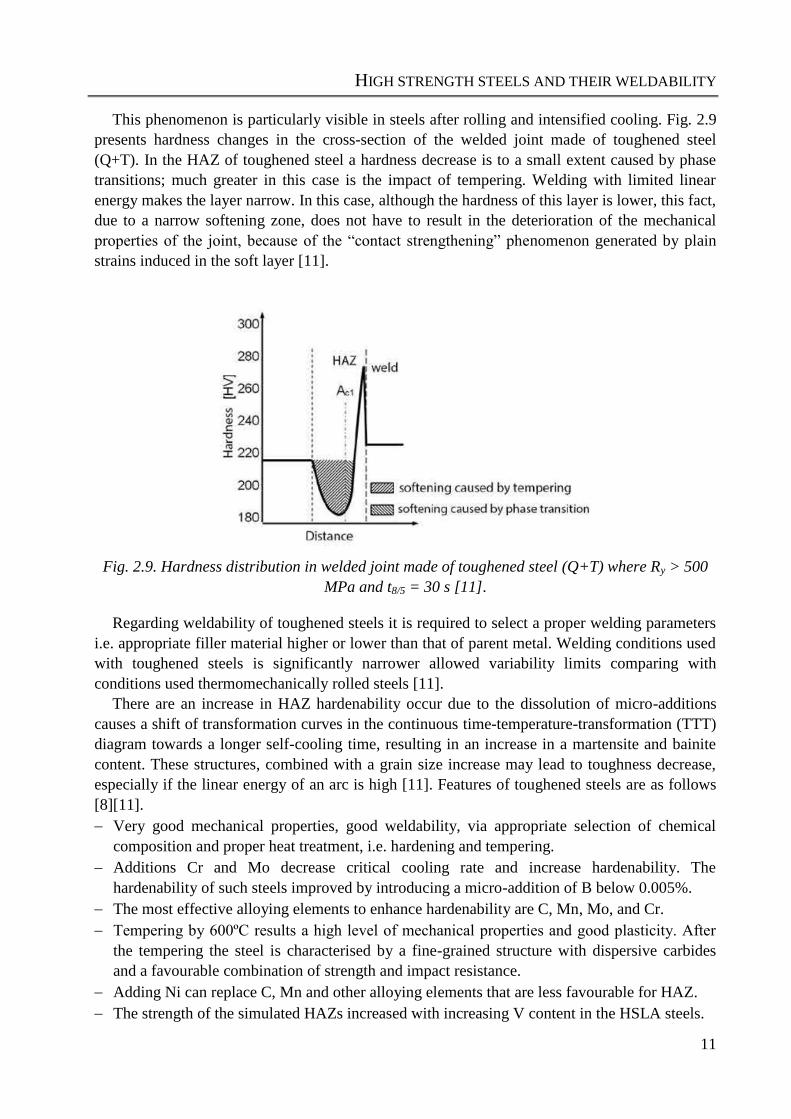
This phenomenon is particularly visible in steels after rolling and intensified cooling. Fig. 2.9
presents hardness changes in the cross-section of the welded joint made of toughened steel
(Q+T). In the HAZ of toughened steel a hardness decrease is to a small extent caused by phase
transitions; much greater in this case is the impact of tempering. Welding with limited linear
energy makes the layer narrow. In this case, although the hardness of this layer is lower, this fact,
due to a narrow softening zone, does not have to result in the deterioration of the mechanical
properties of the joint, because of the “contact strengthening” phenomenon generated by plain
strains induced in the soft layer [11].
Fig. 2.9. Hardness distribution in welded joint made of toughened steel (Q+T) where Ry > 500
MPa and t8/5 = 30 s [11].
Regarding weldability of toughened steels it is required to select a proper welding parameters
i.e. appropriate filler material higher or lower than that of parent metal. Welding conditions used
with toughened steels is significantly narrower allowed variability limits comparing with
conditions used thermomechanically rolled steels [11].
There are an increase in HAZ hardenability occur due to the dissolution of micro-additions
causes a shift of transformation curves in the continuous time-temperature-transformation (TTT)
diagram towards a longer self-cooling time, resulting in an increase in a martensite and bainite
content. These structures, combined with a grain size increase may lead to toughness decrease,
especially if the linear energy of an arc is high [11]. Features of toughened steels are as follows
[8][11].
Very good mechanical properties, good weldability, via appropriate selection of chemical
composition and proper heat treatment, i.e. hardening and tempering.
Additions Cr and Mo decrease critical cooling rate and increase hardenability. The
hardenability of such steels improved by introducing a micro-addition of B below 0.005%.
The most effective alloying elements to enhance hardenability are C, Mn, Mo, and Cr.
Tempering by 600ºC results a high level of mechanical properties and good plasticity. After
the tempering the steel is characterised by a fine-grained structure with dispersive carbides
and a favourable combination of strength and impact resistance.
Adding Ni can replace C, Mn and other alloying elements that are less favourable for HAZ.
The strength of the simulated HAZs increased with increasing V content in the HSLA steels.
HIGH STRENGTH STEELS AND THEIR WELDABILITY
12
Precipitation hardening of NbC or V4C3 leads to increase in mechanical properties. Impact
strength improving by adding Ni, and reduce impurities (S, P) the metallurgical processes of
toughened steels improved.
The aim of quenching and tempering (Q+T) is to produce a microstructure consisting mainly
in tempered martensite. Some amounts of lower bainite are also acceptable.
A homogenous hardness is achieved with a CE of 0.70% whereas a CE of 0.55% results in a
marked gradient in hardness.
From other side the limitations of toughened steels are as follows [8][11].
Worse plastic properties, thus cannot be used in pressure equipment. The high yield point of
these steels have susceptible to cold cracking.
Presence of Nb or V in these steels guarantees obtaining fine grains of austenite during rolling
and thus occur very tiny lamellas of supersaturated ferrite (martensite) after cooling.
Increasing temper parameter reason for lowered tensile properties are and raise of impact
toughness.
Steel of too low carbon content would tolerate ineffective tempering temperatures or soften.
Impact toughness of the simulated HAZs decreased with increasing V levels. Especially,
when V greater than 0.05% the impact toughness dropped remarkably.
Table 2.1. Development impact of metallurgical processes on the level of impurities in steels
[11]
Element
(ppm)
Metallurgical processes in the years
1950/1960 1980/1990 1990/20102)
Sulphur 100-300 50-80 60
Phosphorus 150-300 80-140 6
Hydrogen 4-6 3-5 –
Nitrogen 80-150 <60 –
Oxygen 60-80 <121)
– 1)
Technology made it possible to obtain the oxygen content at the amount <12 ppm however in
practice, the oxygen content in steel was higher. 2)
The manufacturers do not indicate the content of hydrogen, nitrogen and oxygen.
2.2.1. Precipitation hardening
Occurs by the formation of carbides and nitrides. Precipitation of microalloying elements (Nb,
V and Ti) can be used. As these precipitates are lowering the toughness in parent material and in
the HAZ the concentration of such microalloys is kept at low levels. Alloying elements Mo, Cr
are also forming carbides. The nature of these carbides (M3C, M2C, M23C6, and M7C3) and their
effect on secondary hardening depends on their volume and distribution. In some steels the
precipitation hardening of Cu is used (Cu ageing steels). Before the quenching equipment was
installed in the plate mills such NiCu-age steels were produced to reach high tensile properties in
the normalized+aged condition. For an optimized heat treatment 100 MPa can be gained by 1%
Cu [12].
HIGH STRENGTH STEELS AND THEIR WELDABILITY
13
2.2.2. Grain refinement and work hardening
Steels of 690 MPa yield strength can also be produced by thermomechanical rolling followed
by direct quenching or accelerated cooling. In this case rolling at low temperatures improves the
grain refinement and dislocation density. When considering the Hall-Petch correlation one could
gain 200 MPa “simply” by ferrite grain refinement from 20 µm to 2 µm grain diameter. With
normal TMCP process a grain diameter of 10µm can readily be produced, yet, other
strengthening mechanisms have to be added. The strengthening effect of work hardening and
grain refinement is lost in parts of the HAZ so that there in a risk of insufficient strength to occur
next to the weld. In particular, the welding of thin plates requires stickly limited heat input in
order not to affect the load bearing capacity by excessive softening [12].
The procedure of combination between base materials and filler metals take into consideration
to avoid risk customer of selection to a proper combination for base materials and filler metals;
i.e. may not meet the specified and required properties for the application and results often in
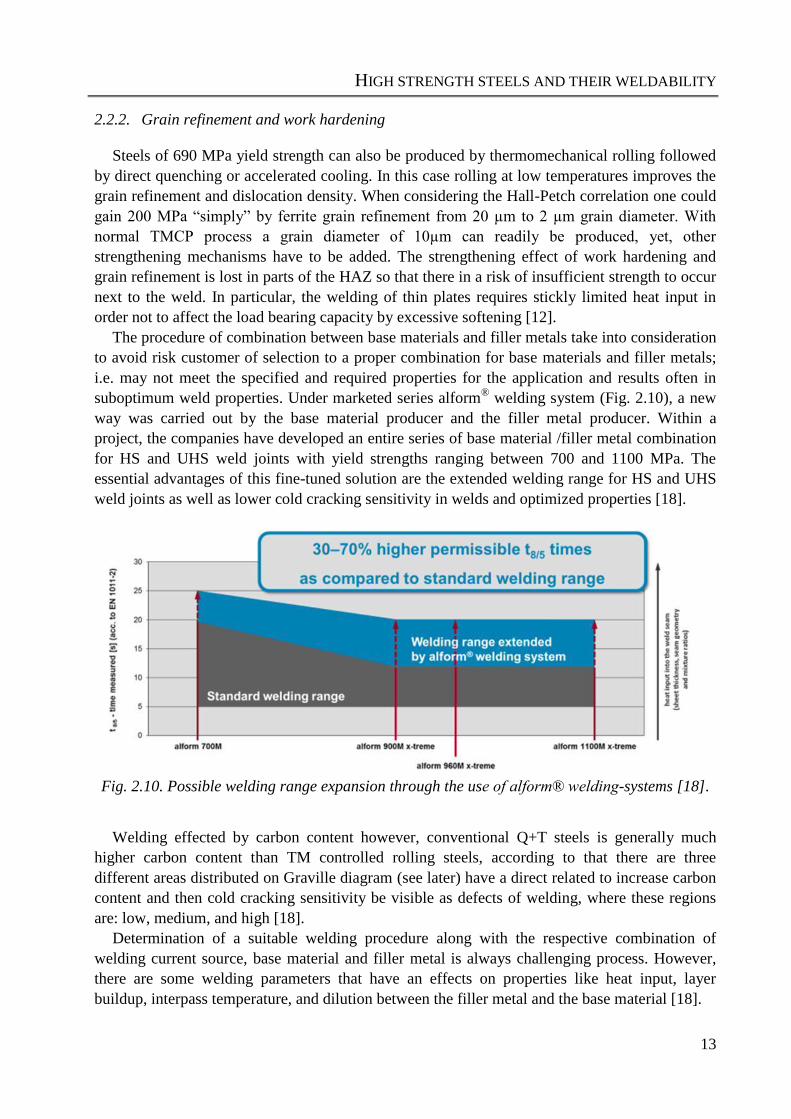
suboptimum weld properties. Under marketed series alform® welding system (Fig. 2.10), a new
way was carried out by the base material producer and the filler metal producer. Within a
project, the companies have developed an entire series of base material /filler metal combination
for HS and UHS weld joints with yield strengths ranging between 700 and 1100 MPa. The
essential advantages of this fine-tuned solution are the extended welding range for HS and UHS
weld joints as well as lower cold cracking sensitivity in welds and optimized properties [18].
Fig. 2.10. Possible welding range expansion through the use of alform® welding-systems [18].
Welding effected by carbon content however, conventional Q+T steels is generally much
higher carbon content than TM controlled rolling steels, according to that there are three
different areas distributed on Graville diagram (see later) have a direct related to increase carbon
content and then cold cracking sensitivity be visible as defects of welding, where these regions
are: low, medium, and high [18].
Determination of a suitable welding procedure along with the respective combination of
welding current source, base material and filler metal is always challenging process. However,
there are some welding parameters that have an effects on properties like heat input, layer
buildup, interpass temperature, and dilution between the filler metal and the base material [18].
HIGH STRENGTH STEELS AND THEIR WELDABILITY
14
The extent of dilution depends heavily on the shape of the bead and buildup sequence of the
seam. These in turn are determined by the selected welding parameters. The investigations
revealed that an increase in the interpass temperature from 20°C to 100°C would lead to an
inadmissible prolongation of the t8/5 cooling time by 50% (from 20 seconds to 30 seconds). The
prescribed t8/5 cooling times can be regarded only as reference values for heat input and can be
achieved with a variety of different parameter combinations. In designing weld seams, the bead
shape and layer sequence must be taken into account along with the t8/5 cooling time because all
of these factors determine welding properties [18].
2.3. Application fields, requirements, loads and processing technologies
Welded parts have been used in the majority of engineering applications such as engineering
structures, power generation, offshore structures, and in vehicle industry (thick plates) and auto
industry (thin plates). Welded joints are very sensitive parts of the structures, because the welded
regions are in complex metallurgical and stress conditions. Steel producers currently provide a
diversified spectrum of high strength base materials and filler metals. Specific design solutions
and economic aspects of modern steel constructions can be found in the practice; extensive
reduction in weight and production costs can be achieved with increasing material strength. High
strength structural steels with nominal yield strengths from 690 MPa upwards are applied in
growing amount of applications [25][26]
During the welding process the joining parts are affected by heat and mechanical loads, which
cause inhomogeneous characteristics (microstructure, mechanical properties, and stress
distribution). These particularities appear in deflections (basically acceptable), or rather in
failures (basically unacceptable), and influence both the behaviour and the loadability of welded
joints [27][28][29]. Discontinuities in base materials and their welded joints have especially high
danger in case of cyclic loading conditions, which are typical for different structures and
structural elements (e.g. bridges, vehicles) [30].
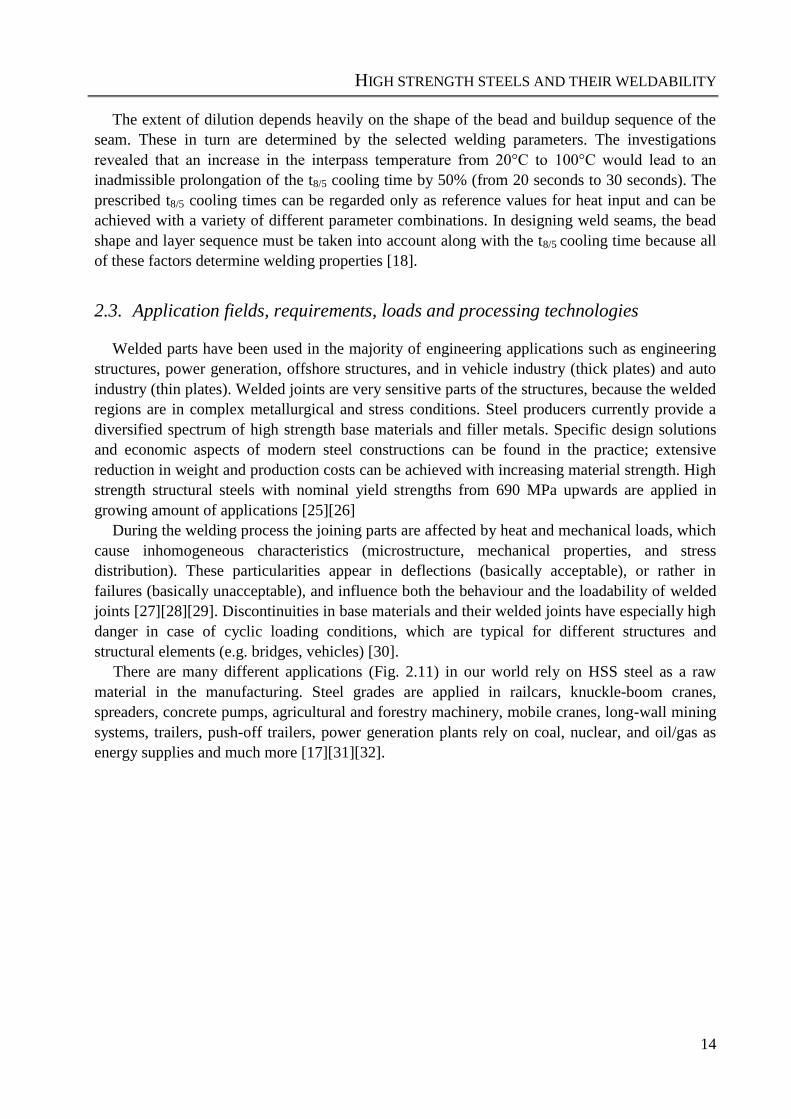
There are many different applications (Fig. 2.11) in our world rely on HSS steel as a raw
material in the manufacturing. Steel grades are applied in railcars, knuckle-boom cranes,
spreaders, concrete pumps, agricultural and forestry machinery, mobile cranes, long-wall mining
systems, trailers, push-off trailers, power generation plants rely on coal, nuclear, and oil/gas as
energy supplies and much more [17][31][32].
HIGH STRENGTH STEELS AND THEIR WELDABILITY
15
Fig. 2.11. Multi-grades steel applications [17].
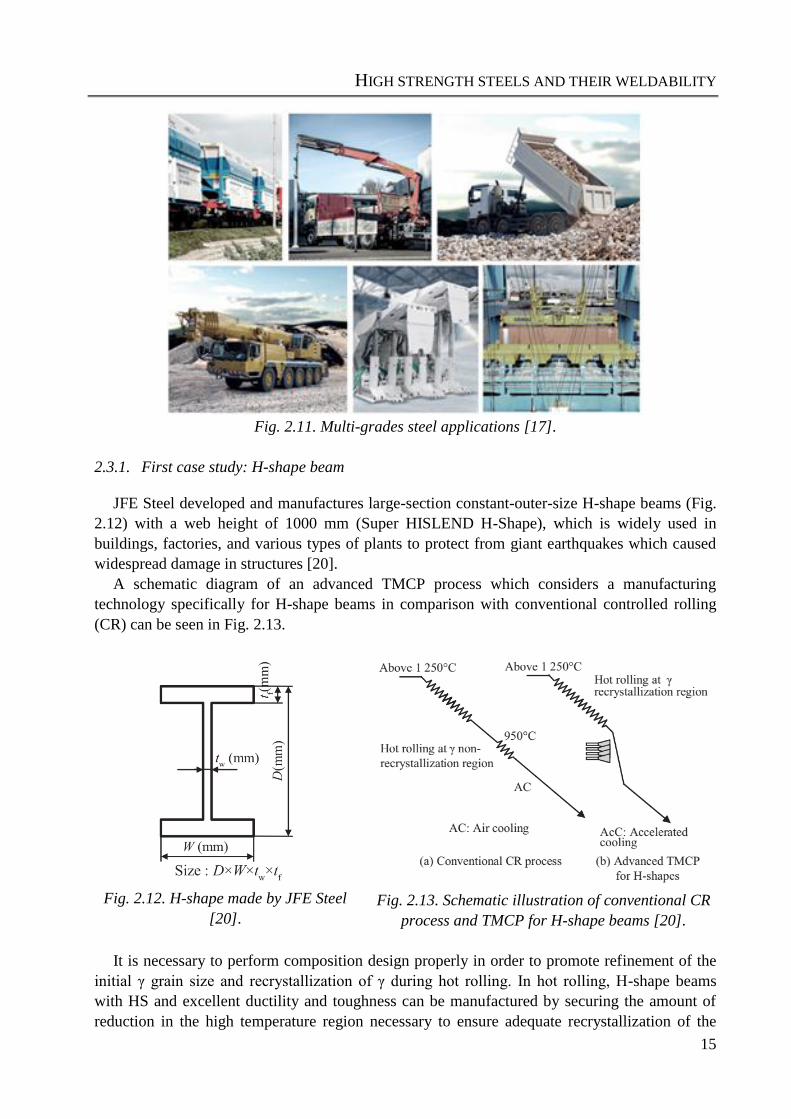
2.3.1. First case study: H-shape beam
JFE Steel developed and manufactures large-section constant-outer-size H-shape beams (Fig.
2.12) with a web height of 1000 mm (Super HISLEND H-Shape), which is widely used in
buildings, factories, and various types of plants to protect from giant earthquakes which caused
widespread damage in structures [20].
A schematic diagram of an advanced TMCP process which considers a manufacturing
technology specifically for H-shape beams in comparison with conventional controlled rolling
(CR) can be seen in Fig. 2.13.
Fig. 2.12. H-shape made by JFE Steel
[20].
Fig. 2.13. Schematic illustration of conventional CR
process and TMCP for H-shape beams [20].
It is necessary to perform composition design properly in order to promote refinement of the
initial γ grain size and recrystallization of γ during hot rolling. In hot rolling, H-shape beams
with HS and excellent ductility and toughness can be manufactured by securing the amount of
reduction in the high temperature region necessary to ensure adequate recrystallization of the
HIGH STRENGTH STEELS AND THEIR WELDABILITY
16
coarse initial γ grain size, followed by accelerated cooling. Although the strengths of the CR
steel and TMCP steel are on the same level, the TMCP steel possess superior toughness [20].
The conventional CR steel is a 0.15%C-1.45%Mn steel with microalloying of Nb and V. The
TMCP steel is a 0.13%C-1.55%Mn steel without addition of Nb and V microalloys. With the
TMCP steel, accelerated cooling by water cooling from the γ region was performed after hot
rolling. The CR steel has a ferrite + pearlite structure, whereas the TMCP steel has a fine bainite
structure [20].
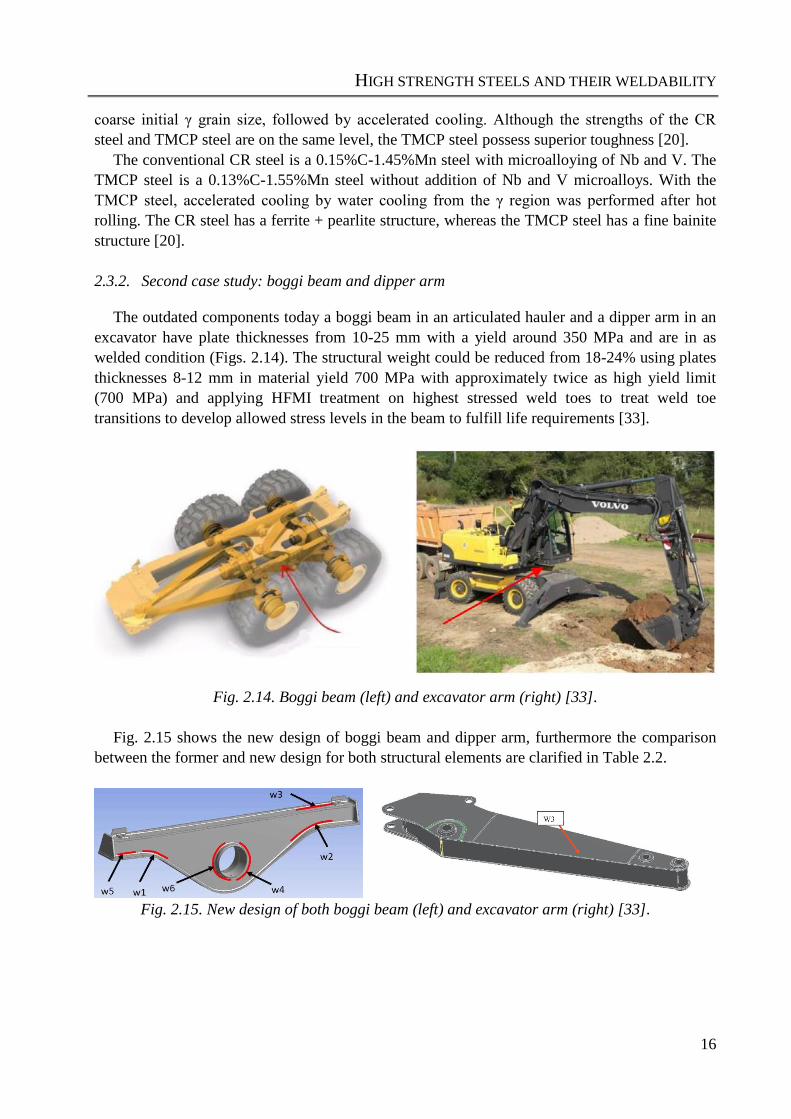
2.3.2. Second case study: boggi beam and dipper arm
The outdated components today a boggi beam in an articulated hauler and a dipper arm in an
excavator have plate thicknesses from 10-25 mm with a yield around 350 MPa and are in as
welded condition (Figs. 2.14). The structural weight could be reduced from 18-24% using plates
thicknesses 8-12 mm in material yield 700 MPa with approximately twice as high yield limit
(700 MPa) and applying HFMI treatment on highest stressed weld toes to treat weld toe
transitions to develop allowed stress levels in the beam to fulfill life requirements [33].
Fig. 2.14. Boggi beam (left) and excavator arm (right) [33].
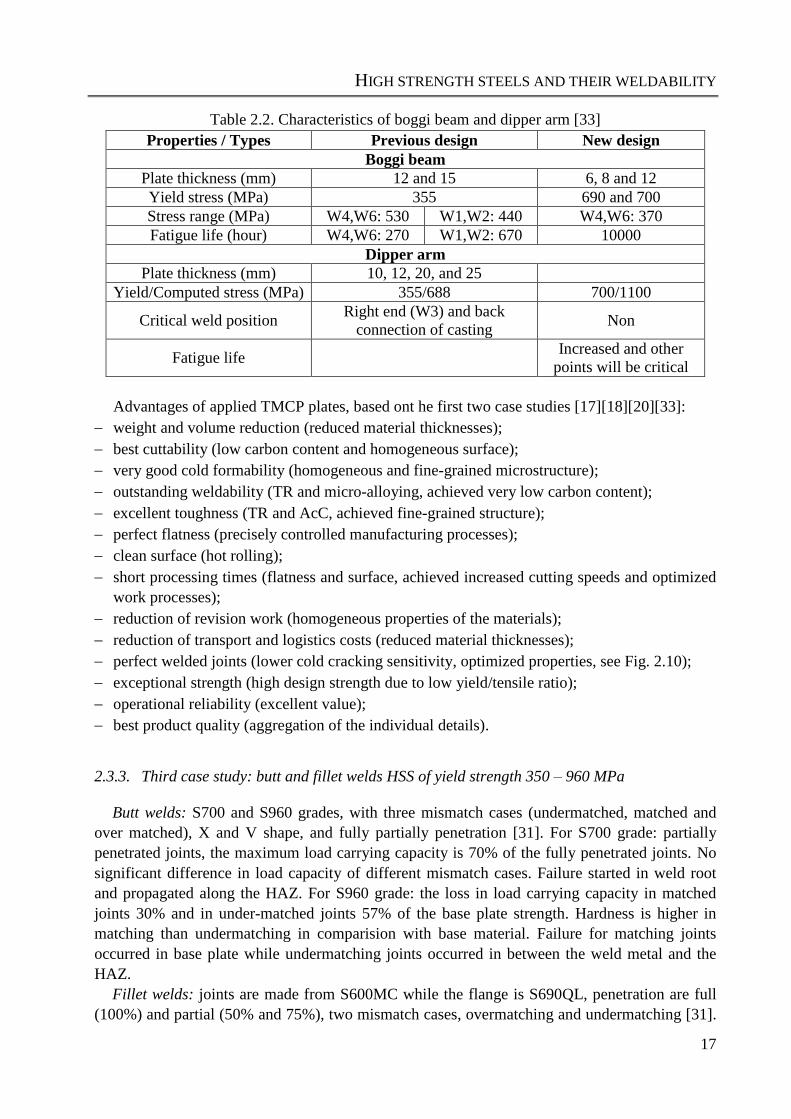
Fig. 2.15 shows the new design of boggi beam and dipper arm, furthermore the comparison
between the former and new design for both structural elements are clarified in Table 2.2.
Fig. 2.15. New design of both boggi beam (left) and excavator arm (right) [33].
HIGH STRENGTH STEELS AND THEIR WELDABILITY
17
Table 2.2. Characteristics of boggi beam and dipper arm [33]
Properties / Types Previous design New design
Boggi beam
Plate thickness (mm) 12 and 15 6, 8 and 12
Yield stress (MPa) 355 690 and 700
Stress range (MPa) W4,W6: 530 W1,W2: 440 W4,W6: 370
Fatigue life (hour) W4,W6: 270 W1,W2: 670 10000
Dipper arm
Plate thickness (mm) 10, 12, 20, and 25
Yield/Computed stress (MPa) 355/688 700/1100
Critical weld position Right end (W3) and back
connection of casting Non
Fatigue life Increased and other
points will be critical
Advantages of applied TMCP plates, based ont he first two case studies [17][18][20][33]:
weight and volume reduction (reduced material thicknesses);
best cuttability (low carbon content and homogeneous surface);
very good cold formability (homogeneous and fine-grained microstructure);
outstanding weldability (TR and micro-alloying, achieved very low carbon content);
excellent toughness (TR and AcC, achieved fine-grained structure);
perfect flatness (precisely controlled manufacturing processes);
clean surface (hot rolling);
short processing times (flatness and surface, achieved increased cutting speeds and optimized
work processes);
reduction of revision work (homogeneous properties of the materials);
reduction of transport and logistics costs (reduced material thicknesses);
perfect welded joints (lower cold cracking sensitivity, optimized properties, see Fig. 2.10);
exceptional strength (high design strength due to low yield/tensile ratio);
operational reliability (excellent value);
best product quality (aggregation of the individual details).
2.3.3. Third case study: butt and fillet welds HSS of yield strength 350 – 960 MPa
Butt welds: S700 and S960 grades, with three mismatch cases (undermatched, matched and
over matched), X and V shape, and fully partially penetration [31]. For S700 grade: partially
penetrated joints, the maximum load carrying capacity is 70% of the fully penetrated joints. No
significant difference in load capacity of different mismatch cases. Failure started in weld root
and propagated along the HAZ. For S960 grade: the loss in load carrying capacity in matched
joints 30% and in under-matched joints 57% of the base plate strength. Hardness is higher in
matching than undermatching in comparision with base material. Failure for matching joints
occurred in base plate while undermatching joints occurred in between the weld metal and the
HAZ.
Fillet welds: joints are made from S600MC while the flange is S690QL, penetration are full
(100%) and partial (50% and 75%), two mismatch cases, overmatching and undermatching [31].
HIGH STRENGTH STEELS AND THEIR WELDABILITY
18
In an overmatched case and (full penetration ratio) ultimate strength capacity is increased 16%
while in (partial penetration ratio) the capacity decrease by 20%. In an undermatched case when
increase penetration ratio (from 75% to 100%), the ultimate strength capacity of the joint
increased by 63% while decrerase penetration ratio (from 75% to 50%) decreased the ultimate
strength capacity by 28%. Failure for the full penetration welds occurred in the web plates of the
steel grade S600 MC while for the partial penetrated fillet welds failure occurred on the welds.
2.3.4. Fourth case study: welding of advanced alloyed
Different cases were studied to describe research needs and recent results in areas [32]:
Metal Arc Welding Under Oil (MAW-UO) of Steels for In-Situ Repairs: repairing flaws and
corrosion damage, for in situ internal repairs of in-service pipelines, tanks, and vessels;
Underwater Welding of Steels: used in operation and maintenance of offshore structures for
oil and gas exploration, production, processing, and transport;
Low Hydrogen Consumables for HS Steels: two concepts, duplex weld microstructural design
and hydrogen management strategies;
Computational Welding Consumable Design: HS pipelines need for welding consumables
with matching mechanical properties;
Consumables for Residual Stress Management and Improved Fatigue Strength: decreasing of
develop high tensile residual stresses and methods to develop compressive stresses;
Minimization of HAZ Degradation in Advanced High-Strength Steels: employing laser or
hybrid laser welding processes.
2.4. Weldability questions, mismatching, cracking phenomena
There are several possible ways to increase the strength of steels (e. g. grain size reduction;
formation of a complex phases, like DP, TP and TWIP; precipitation hardening of the maraging
steels (see Fig. 2.2)). In case of the examined heavy plate thickness range, the higher strength
can be effectively reached by grain refinement and the change of the second phase quality, size
and distribution [27][34][35]
Among the fine grained HS steels, the highest strength can be achieved by the quenched and
tempered (Q+T) group, where the minimal yield strength is 1300 MPa already reached
nowadays. Other type of fine grained HS steel is the thermomechanical (TM) group which is
already above 960 MPa level. Both type steels have a non-equilibrium microstructure that can be
irreversible changed due to the welding heat input [27][34][35]
During Q+T process (see subchapter 2.2.), after a hot rolling above A3 temperature, the slow
cooling rate is generated until the plate cools down to room temperature. Then, the hot rolled
plate is reheated above A3 temperature, and held there for a short period, while the micro-
structure in the whole cross section transforms to austenite. After that, a quenching process takes
place, when an extremely high cooling rate is applied, which can be achieved by water
quenching [111]. In order to realize the quenched condition in the whole cross section, alloying
components (Cr, Mo) are added to the steel, which moves the CCT curves to the right.
Microalloying elements (Ti, Nb, V) are also used in order to ensure and preserve the fine grain
microstructure. Then, in the tempering cycle (HTT: high temperature tempering) of the heat
HIGH STRENGTH STEELS AND THEIR WELDABILITY
19
treatment process, the plate is heated under A1 temperature, which is followed by a slow cooling
process.
Direct quenched high strength steels (see subchapter 2.2.), marked with QC by the producer,
have been recently developed by RUUKKI [112]. During the production process, an intensive
cooling is applied directly after the hot rolling, resulting in a quenched microstructure. This is the
first heating cycle, which is followed by a low temperature tempering (LTT), with a much lower
temperature than A1. Therefore, the microstructure of QC steels builds up from martensite and
bainite, and rarely contains precipitates. During their production the lower energy consumption
(two heat cycles instead of three, and LTT instead of HTT) and the reduced number and extent
of alloying elements have a cost-saving effect. Since the considerable part of the microstructure
is martensite, the part of HAZ, heated between 450 °C and A3, significantly loses its strength due
to the tempering of martensite. Therefore, the t8.5/5 cooling time should be maximized [112], and
it can only be extended if the design requirements allow undermatching [13][113][114].
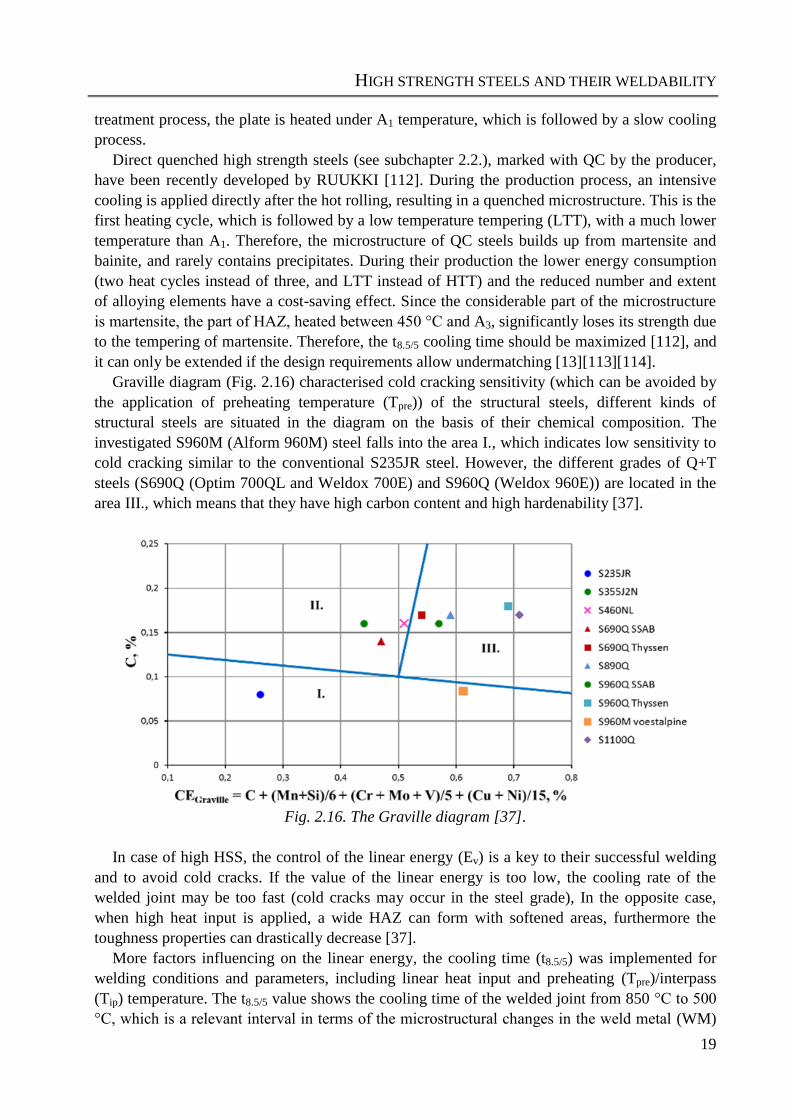
Graville diagram (Fig. 2.16) characterised cold cracking sensitivity (which can be avoided by
the application of preheating temperature (Tpre)) of the structural steels, different kinds of
structural steels are situated in the diagram on the basis of their chemical composition. The
investigated S960M (Alform 960M) steel falls into the area I., which indicates low sensitivity to
cold cracking similar to the conventional S235JR steel. However, the different grades of Q+T
steels (S690Q (Optim 700QL and Weldox 700E) and S960Q (Weldox 960E)) are located in the
area III., which means that they have high carbon content and high hardenability [37].
Fig. 2.16. The Graville diagram [37].
In case of high HSS, the control of the linear energy (Ev) is a key to their successful welding
and to avoid cold cracks. If the value of the linear energy is too low, the cooling rate of the
welded joint may be too fast (cold cracks may occur in the steel grade), In the opposite case,
when high heat input is applied, a wide HAZ can form with softened areas, furthermore the
toughness properties can drastically decrease [37].
More factors influencing on the linear energy, the cooling time (t8.5/5) was implemented for
welding conditions and parameters, including linear heat input and preheating (Tpre)/interpass
(Tip) temperature. The t8.5/5 value shows the cooling time of the welded joint from 850 °C to 500
°C, which is a relevant interval in terms of the microstructural changes in the weld metal (WM)
HIGH STRENGTH STEELS AND THEIR WELDABILITY
20
and the HAZ. Steel producers recommend t8.5/5 range for their products, very narrow interval in
HSSS; furthermore, a narrow welding lobe is recommended for welding of HSSS, too. Also, the
different types of filler metals, in mismatch cases influence these phenomena [37].
2.4.1. Solidification cracking (hot cracking)
Hot cracks are solidification cracks that occur in the fusion zone near the end of solidification.
Simplistically, they result from the inability of the semisolid material to accommodate the
thermal shrinkage strains associated with weld solidification and cooling. Cracks then form at
susceptible sites (susceptible sites are interfaces, such as solidification grain boundaries and
interdendritic regions that are at least partially wetted) to relieve the accumulating strain [37].
Solidification cracking requires both a sufficient amount of mechanical restraint (strain) and a
susceptible microstructure. Under conditions of rapid solidification and cooling, the rate of strain
accumulation is rapid, leading to an increased cracking susceptibility. Inherently, then, requisite
strains for solidification cracking are more likely to be experienced with welding processes that
promote rapid solidification and cooling [36].
Previous investigations show that Weldox 700E (S690QL) steel is not prone to hot cracking
[106].
2.4.2. Hydrogen-induced cracking (cold cracking)
Cold cracks are defects that form as the result of the contamination of the weld microstructure
by hydrogen. Whereas solidification cracking and HAZ cracking occur during or soon after the
actual welding process, hydrogen-induced cracking is usually a delayed phenomenon, occurring
possibly weeks or even months after the welding operation. The temperature at which these
defects tend to form ranges from -50 °C to 150 °C in steels. The fracture is either intergranular or
transgranular cleavage. As with other forms of cracking, hydrogen-induced cracking involves
both a requisite microstructure and a threshold level of stress. It also involves a critical level of
hydrogen, which is alloy and microstructure dependent. The primary source of hydrogen in weld
metal is disassociation of water vapor in the arc and absorption of gaseous or ionized hydrogen
into the liquid, and all organic compounds [37].
2.4.3. Lamellar tearing
It is cracking that occurs beneath welds and found in rolled steel plate weldments. The tearing
always lies within the base material, generally outside the HAZ and parallel to the weld fusion
boundary. Lamellar tearing occurs when three conditions are simultaneously present [37]: firstly,
strains caused by weld metal shrinkage in the joint and increased by residual stresses and
loading; secondly, the weld orientation is such that the stress acts through the joint across the
plate thickness (z direction); thirdly, the material has poor ductility in the z direction.
Butt joints rarely exhibit lamellar tearing, because weld shrinkage does not set up a tensile
stress in thickness direction of the plates. Arc welding processes with high heat input are less
likely to create lamellar tearing, because of the fewer number of applications of heat and the
lesser number of shrinkage cycles involved in making a weld [37].
HIGH STRENGTH STEELS AND THEIR WELDABILITY
21
2.4.4. Case studies of different mismatches investigated
First group of case studies: comparison of experimental works of nominally 700 MPa HSSS.
TM subgroup
J. Górka [38]: S700MC, Ry = 768 MPa, matching, butt joint, Metal Active Gas (MAG)
process – too much heat applied cause loss of the properties gained during TMCP.
S. Ravi [39]: HSLA-80, Ry = 700 MPa, undermatching and overmatching, butt joint, Shielded
Metal Arc Welding – the total fatigue life of the overmatched joints is greater than the
undermatched joints irrespective of post eeld heat treatment. The better fatigue performance
of overmatched joint is may be due to the following three reasons: superior mechanical
properties of the weld metal; ideal microstructure of the weld region; favorable residual stress
pattern in the weld metal region.
Q+T subgroup
A. J. R. Loureiro [40]: RQT 701 = S690QL, undermatching, butt joint, Submerged Arc
Welding (SAW) process – increase heat input coarsened microstructure and loss hardness,
strength and ductility of the weld.
M. Mirzaei et al. [41]: HSLA-100, t = 7 mm, ER100S-1 alloy welding wire, Pulsed Gas Metal
Arc Welded (P-GMAW) and Conventional Gas Metal Arc Welding (GMAW) – acicular
ferrite and lath martensite, small amounts of allotriomorphic and Widmanstatten ferrite; good
mechanical properties; decreasing impact energy by decreasing welding velocity and
increasing pulse frequency.
K. Devakumaran et al. [42]: HSLA steel of SAILMA 410HI / SA543, t = 25 mm, thoriated
tungsten electrode, Multi-Pass Conventional Metal Arc Welding Deposition and Pulsed Metal
Arc Welding Deposition – significant variation of weld metal chemistry when using narrow
groove GMA compared to conventional V-groove GMA; high rate of metal transfer in P-
GMAW enhances the dilution of weld deposit; minimizes the effect of dissolution by fusion
and solid state diffusion.
P. Collin [43]: S500QT (WELDOX 500) and S690QT (WELDOX 700), undermatching and
undermatching / overmatching, butt joint and fillet joint, Manual Metal Arc, Submerged Arc
and Flux Core Welding processes – achieved plastic deformation in the base material with
undermatched electrodes; no detrimental effects of the softened zone in the HAZ, the strength
of the welds is at the same level as the base material for S500; for S690 the strength is slightly
lower than that of the base material and with one exception it is higher the strength of the
filler metal; it seems reasonable to accept undermatched butt welds in situations there the
stress level is low or moderate.
E. Harati [44]: DOMEX 650, WELDOX 700, Ry = 650 and 700 MPa, metal cored wires, OK
Aristorod 89 high strength solid wire and OK Autrod 12.51 medium strength solid wire, butt
joint and fillet joint, GMAW – very good fatigue testing results for all combinations of low
transformation temperature consumables and HSS with varying strength levels.
Second group of case studies: comparison of experimental works of nominally 960 MPa
HSSS.
TM subgroup
M. Stoschka [45] and [46]: S960TM, thin walled structure, Ry = 960 MPa, G89 solid and
metal cored wire, Ry = 915 MPa, undermatching, fillet weld and butt weld, GMAW – highest
HIGH STRENGTH STEELS AND THEIR WELDABILITY
22
fatigue strength condition using a high-strength metal cored wire filler in combination with a
three-component mixed gas.
Q+T subgroup
W. Guo et al. [47]: S960, t = 8 mm, Union X96 (ER120S-G), matching, butt joint with a
parallel groove configuration, Narrow Gap Laser Welding (NGLW) and GMAW – the
strength of the ultra-NGLW specimens was comparable to base material, with all welded
specimens failed in the base material in the tensile tests.
W. Guo et al. [48]: S960, t = 8 mm, without fillar metal, matching, butt joint, laser welding
process – the tensile properties of laser welded joint matched base material, with failure
occurring in base material away of weld, impact toughness reduced compared by base
mataerial.
M. Gáspár and A. Balogh [13]: S960QL, t = 15 mm,: UNION X96, matching, single side butt
welds (V type prepared), GMAW process – generally, the upper limit of linear energy, which
gives acceptable mechanical properties, is 900-1000 J/mm. When larger linear energy is set,
the tensile strength and Charpy-V energy reduce under the required minimum values. By
increasing the strength of structural steels, the welding lobe becomes narrow.
TM and Q+T subgroup:
M. Gáspár and R. P. S. Sisodia [49]: S960QL and S960M, UNION X96, matching, single side
butt welds (V type prepared), GMAW process – on the basis of the simulation results S960M
can be welded without preheating, which has a positive effect on the production time and
energy saving. Regarding the Charpy V-notch impact tests the welding heat input
significantly affected the HAZ toughness in both steels, however the absorbed energy was
always higher in S960M compared to S960QL.
P. Collin [29]: S1100QL (WELDOX 1100) and S960QL (WELDOX 960), undermatching,
butt joint, Flux Cored Arc Welding (FCAW) – the weld width and volume has a strong
influence on the strength of the joint
E. Harati [44]: WELDOX 900 and XABO 890, Ry = 890-900 MPa, OK Tubrod 14.03, OK
Tubrod 15.30 metal cored wires, OK Aristorod 89 high strength solid wire and OK Autrod
12.51 medium strength solid wire, butt joint and fillet joint, GMAW process – very good
fatigue testing results for all combinations of low transformation temperature consumables
and HSS with varying strength levels.
2.5. Recommendations to the aims
Q+T and TM type base materials with different strength categories should be investigated;
the directions, in other words, the possible crack paths are important, longitudinal, transversal
and thickness directions should be investigated, if possible;
the welding characteristics have great influence on the joint quality, therefore the narrow
welding lobe should be applied which has industrial relevance;
mismatch phenomenon should be investigated and by reason of the different strength
categories beside matching conditions both undermatching and overmatching variants should
be accomplished, too.
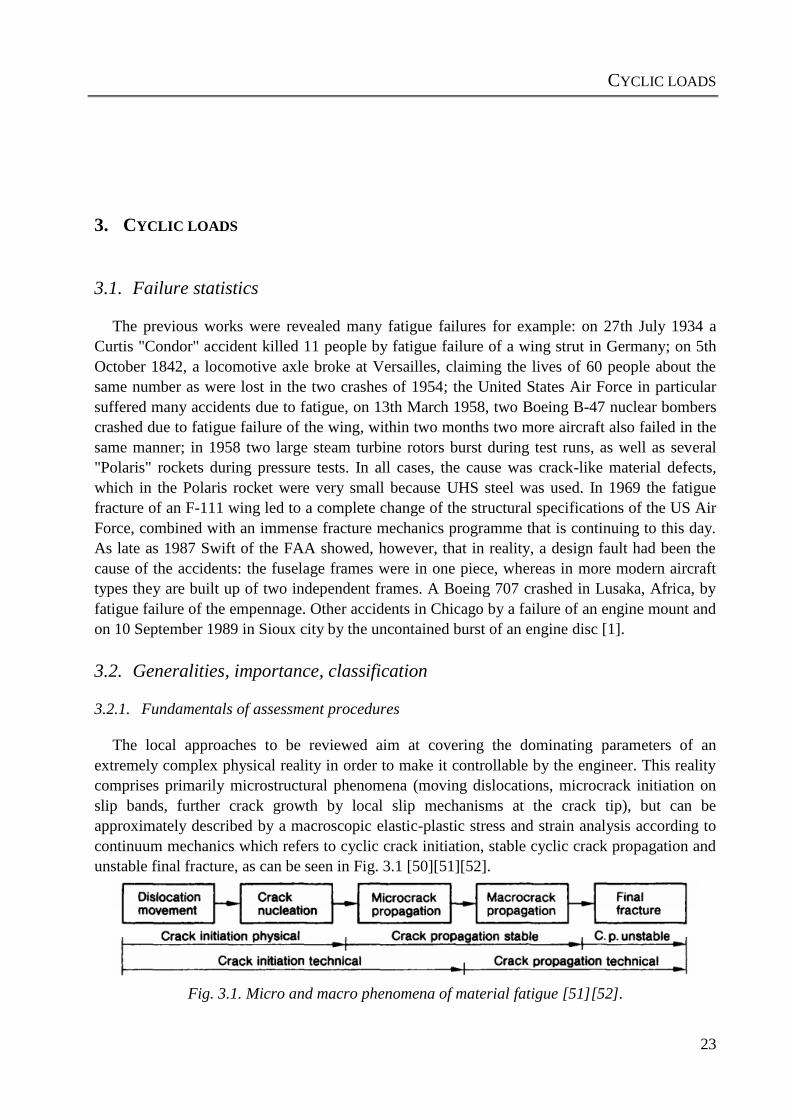
CYCLIC LOADS
23
3. CYCLIC LOADS
3.1. Failure statistics
The previous works were revealed many fatigue failures for example: on 27th July 1934 a
Curtis "Condor" accident killed 11 people by fatigue failure of a wing strut in Germany; on 5th
October 1842, a locomotive axle broke at Versailles, claiming the lives of 60 people about the
same number as were lost in the two crashes of 1954; the United States Air Force in particular
suffered many accidents due to fatigue, on 13th March 1958, two Boeing B-47 nuclear bombers
crashed due to fatigue failure of the wing, within two months two more aircraft also failed in the
same manner; in 1958 two large steam turbine rotors burst during test runs, as well as several
"Polaris" rockets during pressure tests. In all cases, the cause was crack-like material defects,
which in the Polaris rocket were very small because UHS steel was used. In 1969 the fatigue
fracture of an F-111 wing led to a complete change of the structural specifications of the US Air
Force, combined with an immense fracture mechanics programme that is continuing to this day.
As late as 1987 Swift of the FAA showed, however, that in reality, a design fault had been the
cause of the accidents: the fuselage frames were in one piece, whereas in more modern aircraft
types they are built up of two independent frames. A Boeing 707 crashed in Lusaka, Africa, by
fatigue failure of the empennage. Other accidents in Chicago by a failure of an engine mount and
on 10 September 1989 in Sioux city by the uncontained burst of an engine disc [1].
3.2. Generalities, importance, classification
3.2.1. Fundamentals of assessment procedures
The local approaches to be reviewed aim at covering the dominating parameters of an
extremely complex physical reality in order to make it controllable by the engineer. This reality
comprises primarily microstructural phenomena (moving dislocations, microcrack initiation on
slip bands, further crack growth by local slip mechanisms at the crack tip), but can be
approximately described by a macroscopic elastic-plastic stress and strain analysis according to
continuum mechanics which refers to cyclic crack initiation, stable cyclic crack propagation and
unstable final fracture, as can be seen in Fig. 3.1 [50][51][52].
Fig. 3.1. Micro and macro phenomena of material fatigue [51][52].
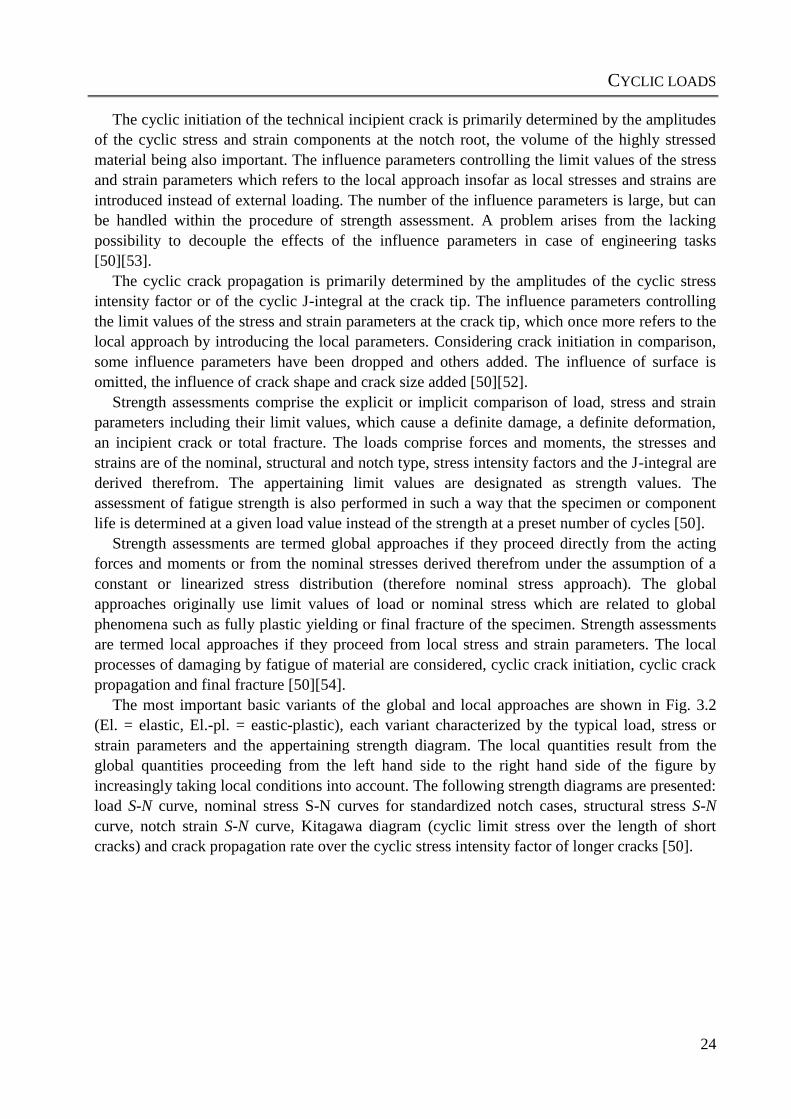
CYCLIC LOADS
24
The cyclic initiation of the technical incipient crack is primarily determined by the amplitudes
of the cyclic stress and strain components at the notch root, the volume of the highly stressed
material being also important. The influence parameters controlling the limit values of the stress
and strain parameters which refers to the local approach insofar as local stresses and strains are
introduced instead of external loading. The number of the influence parameters is large, but can
be handled within the procedure of strength assessment. A problem arises from the lacking
possibility to decouple the effects of the influence parameters in case of engineering tasks
[50][53].
The cyclic crack propagation is primarily determined by the amplitudes of the cyclic stress
intensity factor or of the cyclic J-integral at the crack tip. The influence parameters controlling
the limit values of the stress and strain parameters at the crack tip, which once more refers to the
local approach by introducing the local parameters. Considering crack initiation in comparison,
some influence parameters have been dropped and others added. The influence of surface is
omitted, the influence of crack shape and crack size added [50][52].
Strength assessments comprise the explicit or implicit comparison of load, stress and strain
parameters including their limit values, which cause a definite damage, a definite deformation,
an incipient crack or total fracture. The loads comprise forces and moments, the stresses and
strains are of the nominal, structural and notch type, stress intensity factors and the J-integral are
derived therefrom. The appertaining limit values are designated as strength values. The
assessment of fatigue strength is also performed in such a way that the specimen or component
life is determined at a given load value instead of the strength at a preset number of cycles [50].
Strength assessments are termed global approaches if they proceed directly from the acting
forces and moments or from the nominal stresses derived therefrom under the assumption of a
constant or linearized stress distribution (therefore nominal stress approach). The global
approaches originally use limit values of load or nominal stress which are related to global
phenomena such as fully plastic yielding or final fracture of the specimen. Strength assessments
are termed local approaches if they proceed from local stress and strain parameters. The local
processes of damaging by fatigue of material are considered, cyclic crack initiation, cyclic crack
propagation and final fracture [50][54].
The most important basic variants of the global and local approaches are shown in Fig. 3.2
(El. = elastic, El.-pl. = eastic-plastic), each variant characterized by the typical load, stress or
strain parameters and the appertaining strength diagram. The local quantities result from the
global quantities proceeding from the left hand side to the right hand side of the figure by
increasingly taking local conditions into account. The following strength diagrams are presented:
load S-N curve, nominal stress S-N curves for standardized notch cases, structural stress S-N
curve, notch strain S-N curve, Kitagawa diagram (cyclic limit stress over the length of short
cracks) and crack propagation rate over the cyclic stress intensity factor of longer cracks [50].
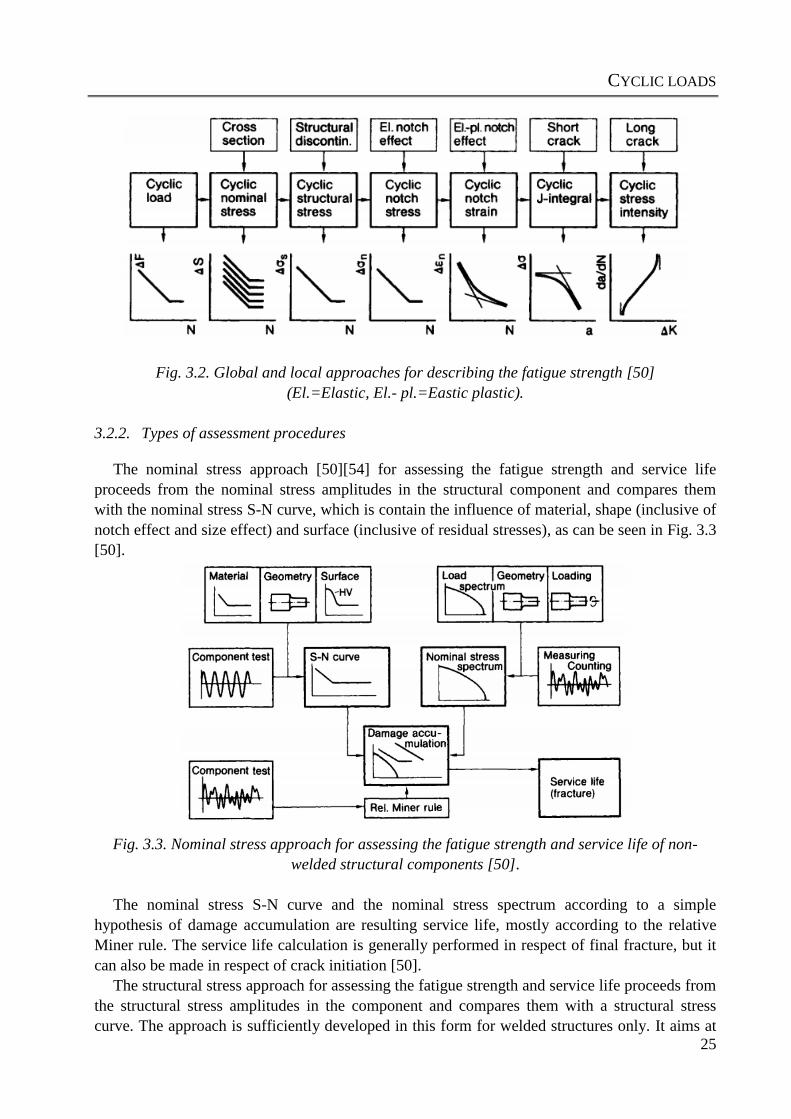
CYCLIC LOADS
25
Fig. 3.2. Global and local approaches for describing the fatigue strength [50]
(El.=Elastic, El.- pl.=Eastic plastic).
3.2.2. Types of assessment procedures
The nominal stress approach [50][54] for assessing the fatigue strength and service life
proceeds from the nominal stress amplitudes in the structural component and compares them
with the nominal stress S-N curve, which is contain the influence of material, shape (inclusive of
notch effect and size effect) and surface (inclusive of residual stresses), as can be seen in Fig. 3.3
[50].
Fig. 3.3. Nominal stress approach for assessing the fatigue strength and service life of non-
welded structural components [50].
The nominal stress S-N curve and the nominal stress spectrum according to a simple
hypothesis of damage accumulation are resulting service life, mostly according to the relative
Miner rule. The service life calculation is generally performed in respect of final fracture, but it
can also be made in respect of crack initiation [50].
The structural stress approach for assessing the fatigue strength and service life proceeds from
the structural stress amplitudes in the component and compares them with a structural stress
curve. The approach is sufficiently developed in this form for welded structures only. It aims at
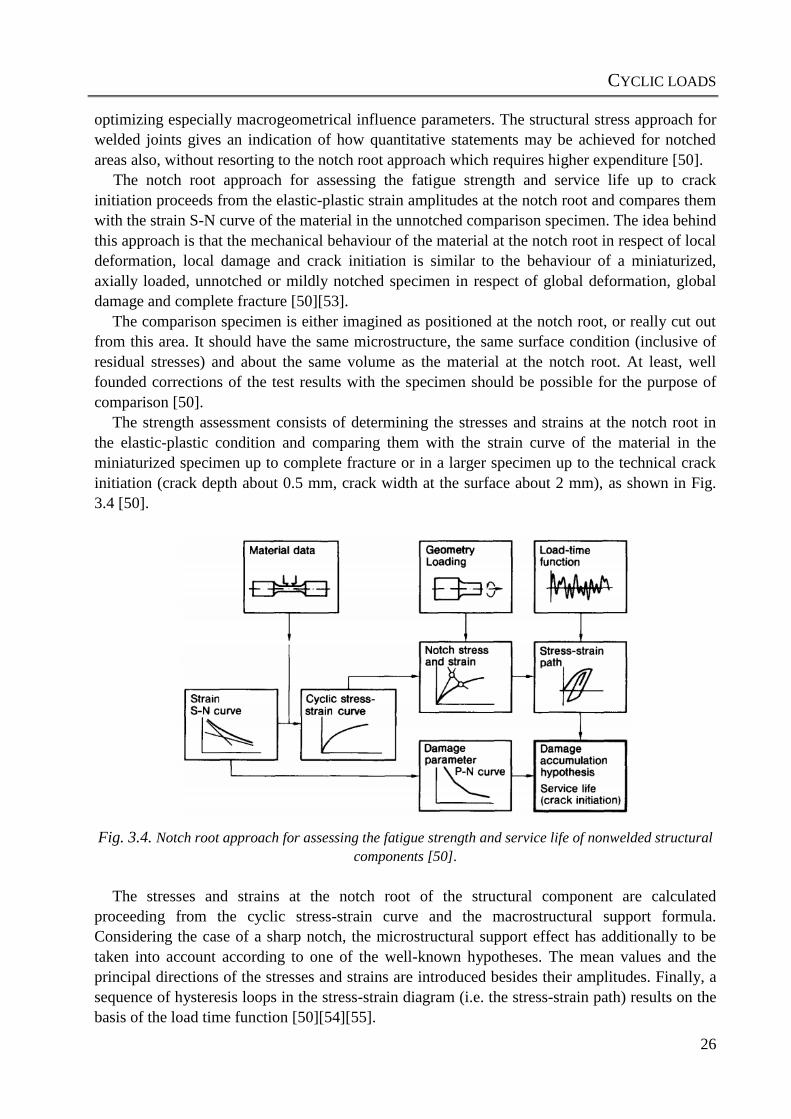
CYCLIC LOADS
26
optimizing especially macrogeometrical influence parameters. The structural stress approach for
welded joints gives an indication of how quantitative statements may be achieved for notched
areas also, without resorting to the notch root approach which requires higher expenditure [50].
The notch root approach for assessing the fatigue strength and service life up to crack
initiation proceeds from the elastic-plastic strain amplitudes at the notch root and compares them
with the strain S-N curve of the material in the unnotched comparison specimen. The idea behind
this approach is that the mechanical behaviour of the material at the notch root in respect of local
deformation, local damage and crack initiation is similar to the behaviour of a miniaturized,
axially loaded, unnotched or mildly notched specimen in respect of global deformation, global
damage and complete fracture [50][53].
The comparison specimen is either imagined as positioned at the notch root, or really cut out
from this area. It should have the same microstructure, the same surface condition (inclusive of
residual stresses) and about the same volume as the material at the notch root. At least, well
founded corrections of the test results with the specimen should be possible for the purpose of
comparison [50].
The strength assessment consists of determining the stresses and strains at the notch root in
the elastic-plastic condition and comparing them with the strain curve of the material in the
miniaturized specimen up to complete fracture or in a larger specimen up to the technical crack
initiation (crack depth about 0.5 mm, crack width at the surface about 2 mm), as shown in Fig.
3.4 [50].
Fig. 3.4. Notch root approach for assessing the fatigue strength and service life of nonwelded structural
components [50].
The stresses and strains at the notch root of the structural component are calculated
proceeding from the cyclic stress-strain curve and the macrostructural support formula.
Considering the case of a sharp notch, the microstructural support effect has additionally to be
taken into account according to one of the well-known hypotheses. The mean values and the
principal directions of the stresses and strains are introduced besides their amplitudes. Finally, a
sequence of hysteresis loops in the stress-strain diagram (i.e. the stress-strain path) results on the
basis of the load time function [50][54][55].
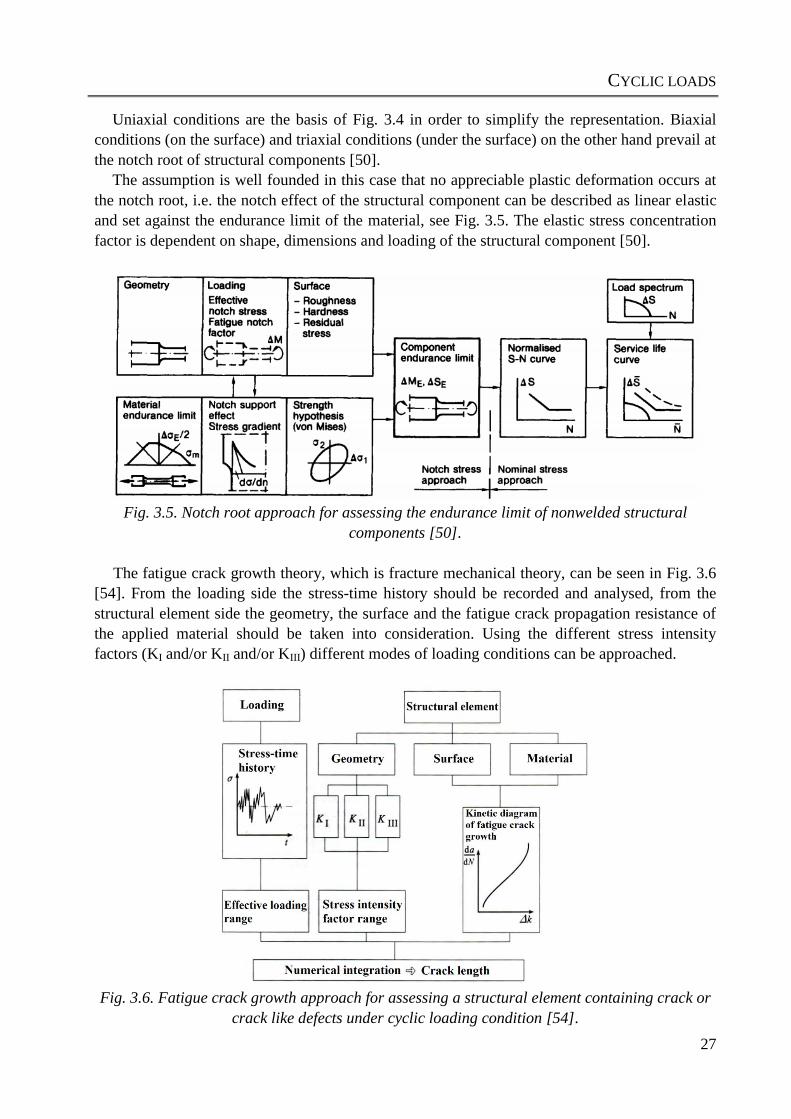
CYCLIC LOADS
27
Uniaxial conditions are the basis of Fig. 3.4 in order to simplify the representation. Biaxial
conditions (on the surface) and triaxial conditions (under the surface) on the other hand prevail at
the notch root of structural components [50].
The assumption is well founded in this case that no appreciable plastic deformation occurs at
the notch root, i.e. the notch effect of the structural component can be described as linear elastic
and set against the endurance limit of the material, see Fig. 3.5. The elastic stress concentration
factor is dependent on shape, dimensions and loading of the structural component [50].
Fig. 3.5. Notch root approach for assessing the endurance limit of nonwelded structural
components [50].
The fatigue crack growth theory, which is fracture mechanical theory, can be seen in Fig. 3.6
[54]. From the loading side the stress-time history should be recorded and analysed, from the
structural element side the geometry, the surface and the fatigue crack propagation resistance of
the applied material should be taken into consideration. Using the different stress intensity
factors (KI and/or KII and/or KIII) different modes of loading conditions can be approached.
Fig. 3.6. Fatigue crack growth approach for assessing a structural element containing crack or
crack like defects under cyclic loading condition [54].
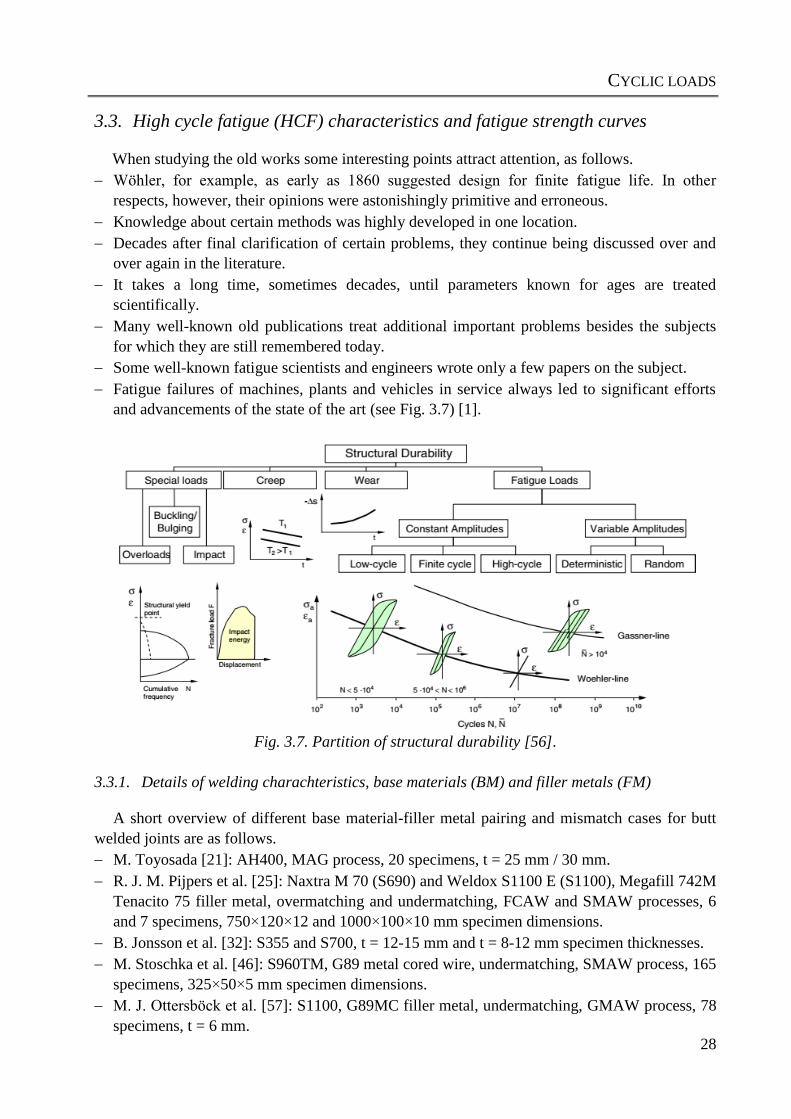
CYCLIC LOADS
28
3.3. High cycle fatigue (HCF) characteristics and fatigue strength curves
When studying the old works some interesting points attract attention, as follows.
Wöhler, for example, as early as 1860 suggested design for finite fatigue life. In other
respects, however, their opinions were astonishingly primitive and erroneous.
Knowledge about certain methods was highly developed in one location.
Decades after final clarification of certain problems, they continue being discussed over and
over again in the literature.
It takes a long time, sometimes decades, until parameters known for ages are treated
scientifically.
Many well-known old publications treat additional important problems besides the subjects
for which they are still remembered today.
Some well-known fatigue scientists and engineers wrote only a few papers on the subject.
Fatigue failures of machines, plants and vehicles in service always led to significant efforts
and advancements of the state of the art (see Fig. 3.7) [1].
Fig. 3.7. Partition of structural durability [56].
3.3.1. Details of welding charachteristics, base materials (BM) and filler metals (FM)
A short overview of different base material-filler metal pairing and mismatch cases for butt
welded joints are as follows.
M. Toyosada [21]: AH400, MAG process, 20 specimens, t = 25 mm / 30 mm.
R. J. M. Pijpers et al. [25]: Naxtra M 70 (S690) and Weldox S1100 E (S1100), Megafill 742M
Tenacito 75 filler metal, overmatching and undermatching, FCAW and SMAW processes, 6
and 7 specimens, 750×120×12 and 1000×100×10 mm specimen dimensions.
B. Jonsson et al. [32]: S355 and S700, t = 12-15 mm and t = 8-12 mm specimen thicknesses.
M. Stoschka et al. [46]: S960TM, G89 metal cored wire, undermatching, SMAW process, 165
specimens, 325×50×5 mm specimen dimensions.
M. J. Ottersböck et al. [57]: S1100, G89MC filler metal, undermatching, GMAW process, 78
specimens, t = 6 mm.
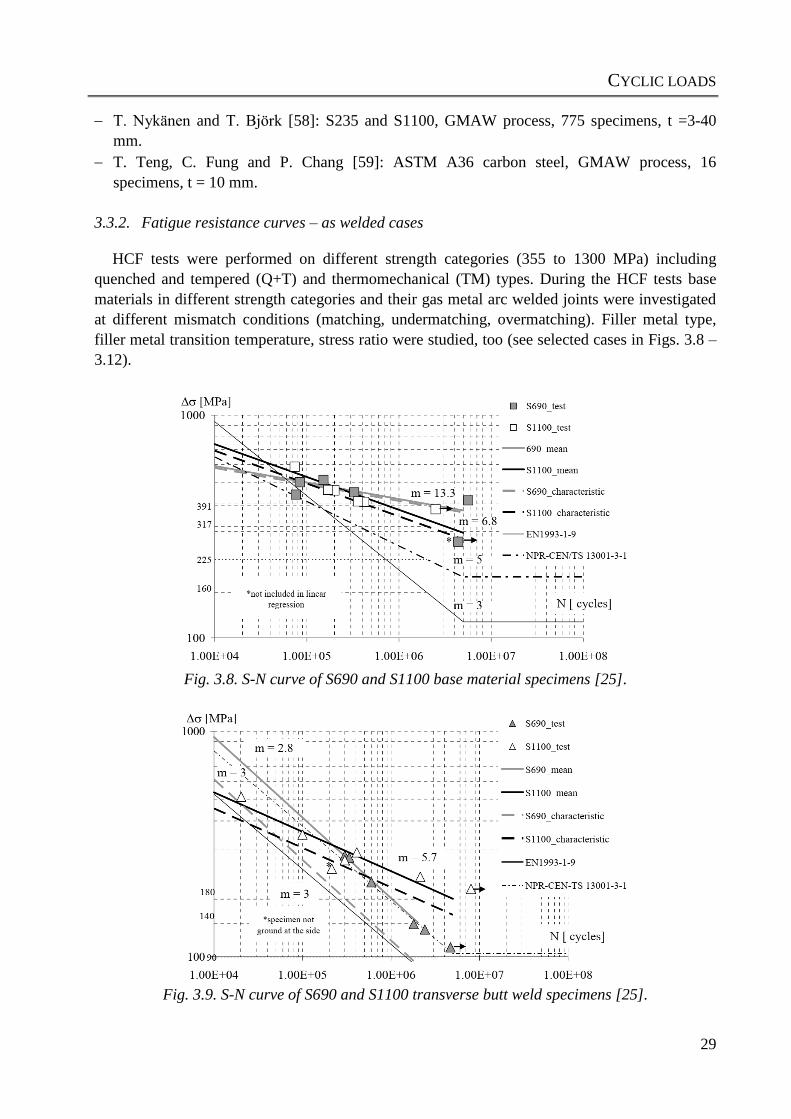
CYCLIC LOADS
29
T. Nykänen and T. Björk [58]: S235 and S1100, GMAW process, 775 specimens, t =3-40
mm.
T. Teng, C. Fung and P. Chang [59]: ASTM A36 carbon steel, GMAW process, 16
specimens, t = 10 mm.
3.3.2. Fatigue resistance curves – as welded cases
HCF tests were performed on different strength categories (355 to 1300 MPa) including
quenched and tempered (Q+T) and thermomechanical (TM) types. During the HCF tests base
materials in different strength categories and their gas metal arc welded joints were investigated
at different mismatch conditions (matching, undermatching, overmatching). Filler metal type,
filler metal transition temperature, stress ratio were studied, too (see selected cases in Figs. 3.8 –
3.12).
Fig. 3.8. S-N curve of S690 and S1100 base material specimens [25].
Fig. 3.9. S-N curve of S690 and S1100 transverse butt weld specimens [25].
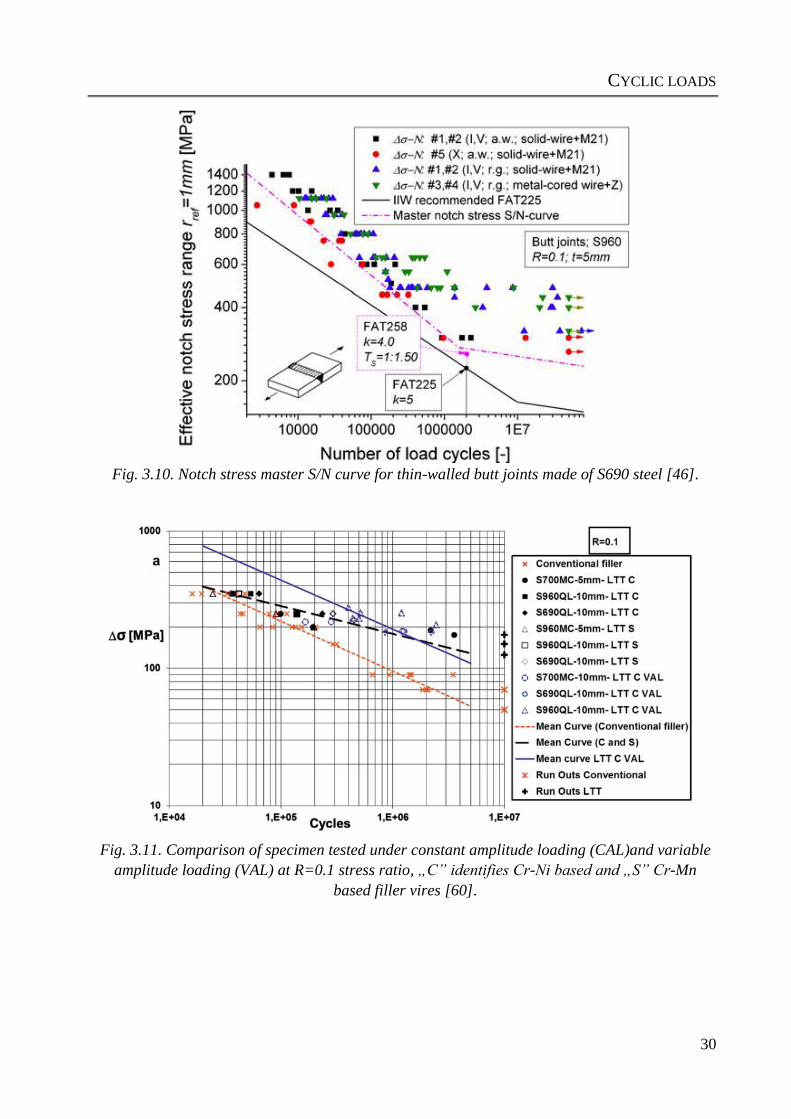
CYCLIC LOADS
30
Fig. 3.10. Notch stress master S/N curve for thin-walled butt joints made of S690 steel [46].
Fig. 3.11. Comparison of specimen tested under constant amplitude loading (CAL)and variable
amplitude loading (VAL) at R=0.1 stress ratio, „C” identifies Cr-Ni based and „S” Cr-Mn
based filler vires [60].
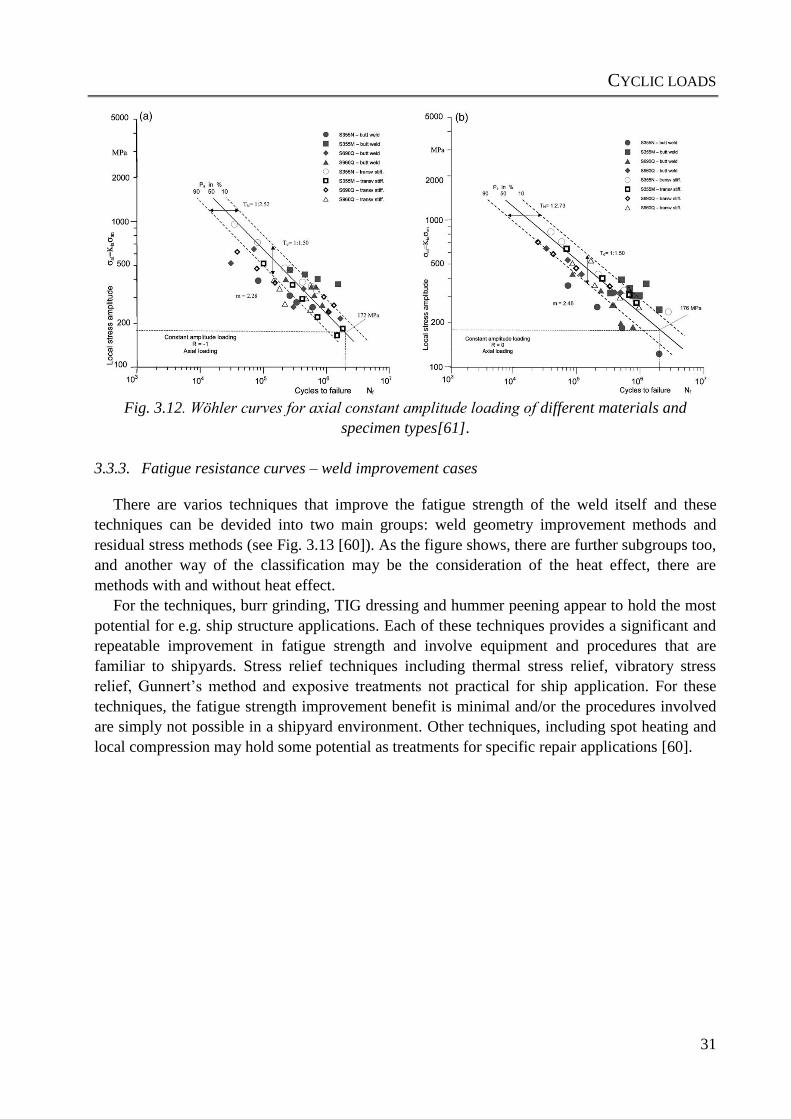
CYCLIC LOADS
31
Fig. 3.12. Wöhler curves for axial constant amplitude loading of different materials and
specimen types[61].
3.3.3. Fatigue resistance curves – weld improvement cases
There are varios techniques that improve the fatigue strength of the weld itself and these
techniques can be devided into two main groups: weld geometry improvement methods and
residual stress methods (see Fig. 3.13 [60]). As the figure shows, there are further subgroups too,
and another way of the classification may be the consideration of the heat effect, there are
methods with and without heat effect.
For the techniques, burr grinding, TIG dressing and hummer peening appear to hold the most
potential for e.g. ship structure applications. Each of these techniques provides a significant and
repeatable improvement in fatigue strength and involve equipment and procedures that are
familiar to shipyards. Stress relief techniques including thermal stress relief, vibratory stress
relief, Gunnert’s method and exposive treatments not practical for ship application. For these
techniques, the fatigue strength improvement benefit is minimal and/or the procedures involved
are simply not possible in a shipyard environment. Other techniques, including spot heating and
local compression may hold some potential as treatments for specific repair applications [60].
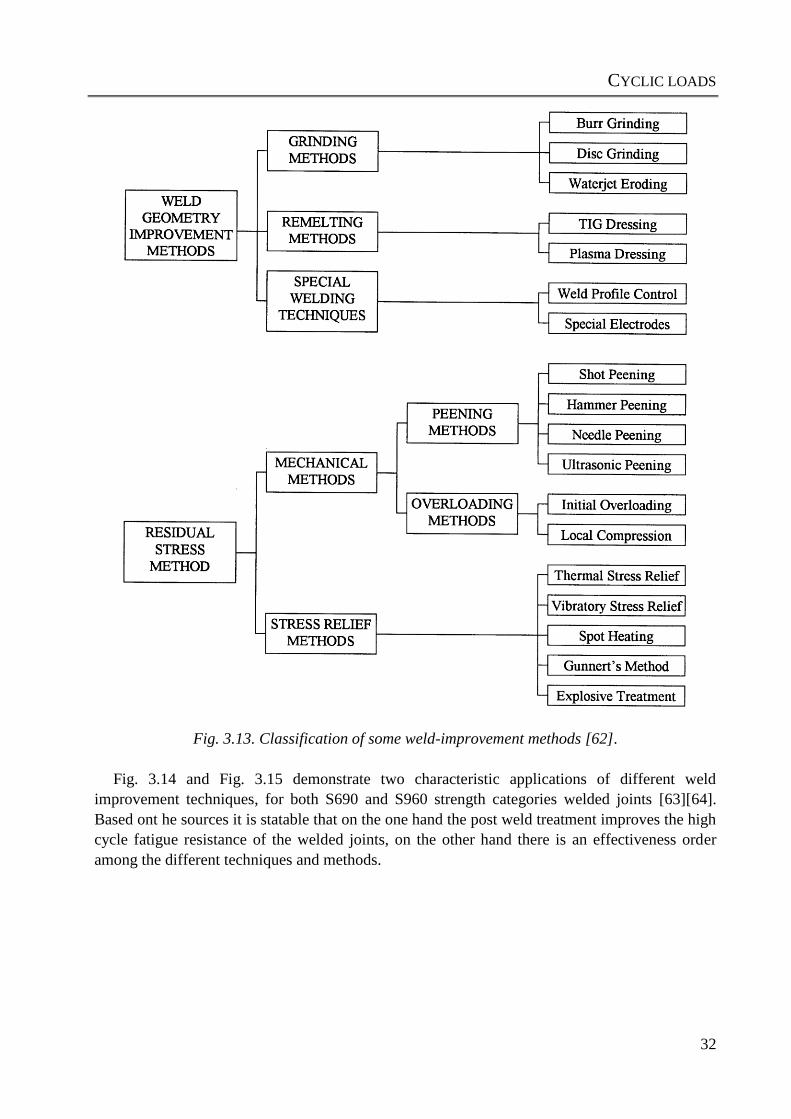
CYCLIC LOADS
32
Fig. 3.13. Classification of some weld-improvement methods [62].
Fig. 3.14 and Fig. 3.15 demonstrate two characteristic applications of different weld
improvement techniques, for both S690 and S960 strength categories welded joints [63][64].
Based ont he sources it is statable that on the one hand the post weld treatment improves the high
cycle fatigue resistance of the welded joints, on the other hand there is an effectiveness order
among the different techniques and methods.
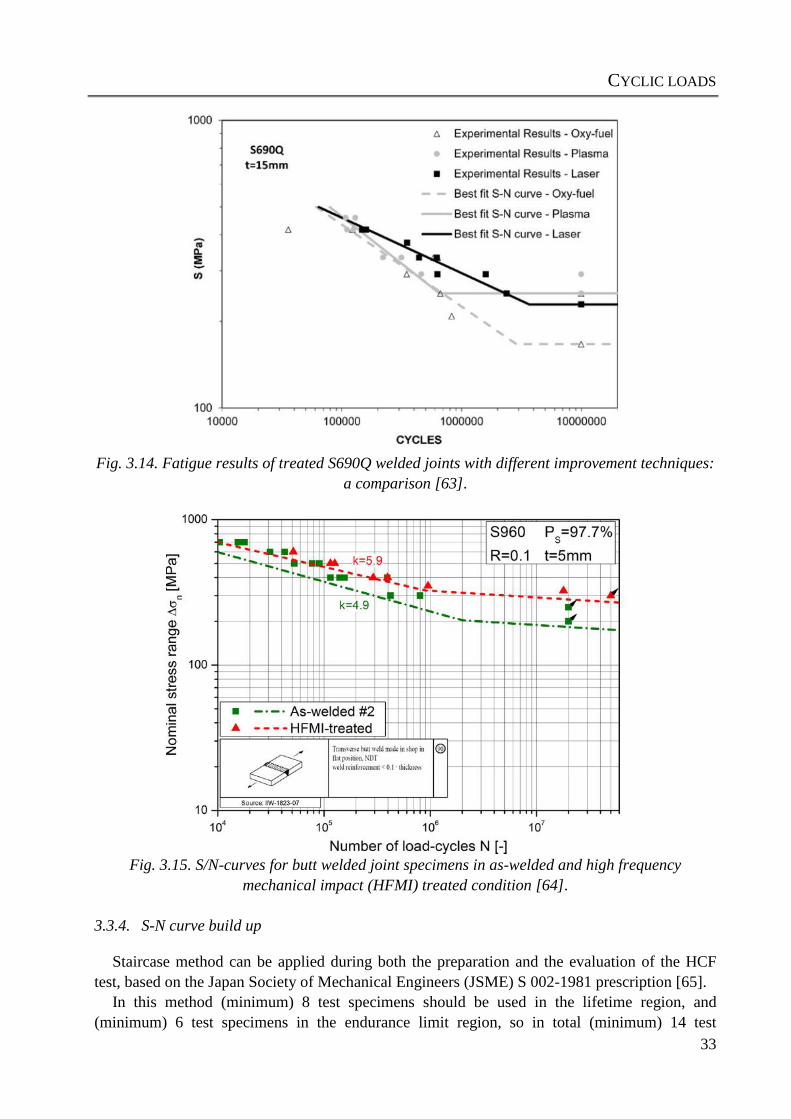
CYCLIC LOADS
33
Fig. 3.14. Fatigue results of treated S690Q welded joints with different improvement techniques:
a comparison [63].
Fig. 3.15. S/N-curves for butt welded joint specimens in as-welded and high frequency
mechanical impact (HFMI) treated condition [64].
3.3.4. S-N curve build up
Staircase method can be applied during both the preparation and the evaluation of the HCF
test, based on the Japan Society of Mechanical Engineers (JSME) S 002-1981 prescription [65].
In this method (minimum) 8 test specimens should be used in the lifetime region, and
(minimum) 6 test specimens in the endurance limit region, so in total (minimum) 14 test
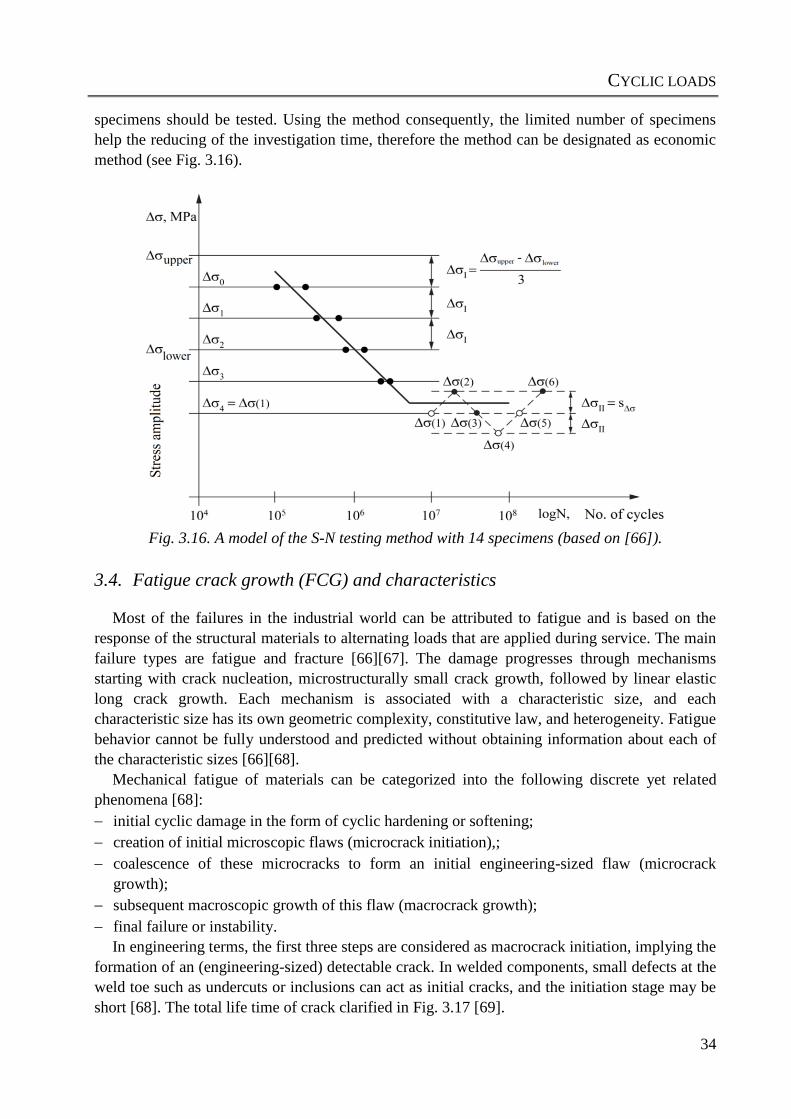
CYCLIC LOADS
34
specimens should be tested. Using the method consequently, the limited number of specimens
help the reducing of the investigation time, therefore the method can be designated as economic
method (see Fig. 3.16).
Fig. 3.16. A model of the S-N testing method with 14 specimens (based on [66]).
3.4. Fatigue crack growth (FCG) and characteristics
Most of the failures in the industrial world can be attributed to fatigue and is based on the
response of the structural materials to alternating loads that are applied during service. The main
failure types are fatigue and fracture [66][67]. The damage progresses through mechanisms
starting with crack nucleation, microstructurally small crack growth, followed by linear elastic
long crack growth. Each mechanism is associated with a characteristic size, and each
characteristic size has its own geometric complexity, constitutive law, and heterogeneity. Fatigue
behavior cannot be fully understood and predicted without obtaining information about each of
the characteristic sizes [66][68].
Mechanical fatigue of materials can be categorized into the following discrete yet related
phenomena [68]:
initial cyclic damage in the form of cyclic hardening or softening;
creation of initial microscopic flaws (microcrack initiation),;
coalescence of these microcracks to form an initial engineering-sized flaw (microcrack
growth);
subsequent macroscopic growth of this flaw (macrocrack growth);
final failure or instability.
In engineering terms, the first three steps are considered as macrocrack initiation, implying the
formation of an (engineering-sized) detectable crack. In welded components, small defects at the
weld toe such as undercuts or inclusions can act as initial cracks, and the initiation stage may be
short [68]. The total life time of crack clarified in Fig. 3.17 [69].
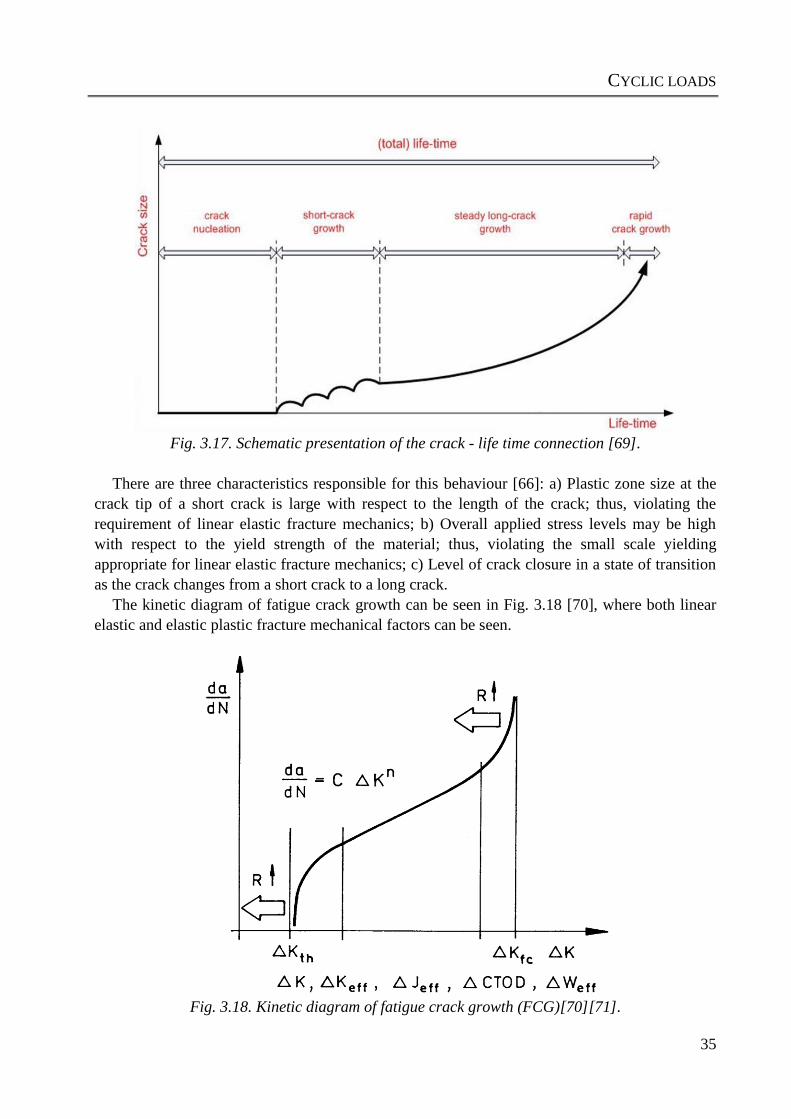
CYCLIC LOADS
35
Fig. 3.17. Schematic presentation of the crack - life time connection [69].
There are three characteristics responsible for this behaviour [66]: a) Plastic zone size at the
crack tip of a short crack is large with respect to the length of the crack; thus, violating the
requirement of linear elastic fracture mechanics; b) Overall applied stress levels may be high
with respect to the yield strength of the material; thus, violating the small scale yielding
appropriate for linear elastic fracture mechanics; c) Level of crack closure in a state of transition
as the crack changes from a short crack to a long crack.
The kinetic diagram of fatigue crack growth can be seen in Fig. 3.18 [70], where both linear
elastic and elastic plastic fracture mechanical factors can be seen.
Fig. 3.18. Kinetic diagram of fatigue crack growth (FCG)[70][71].
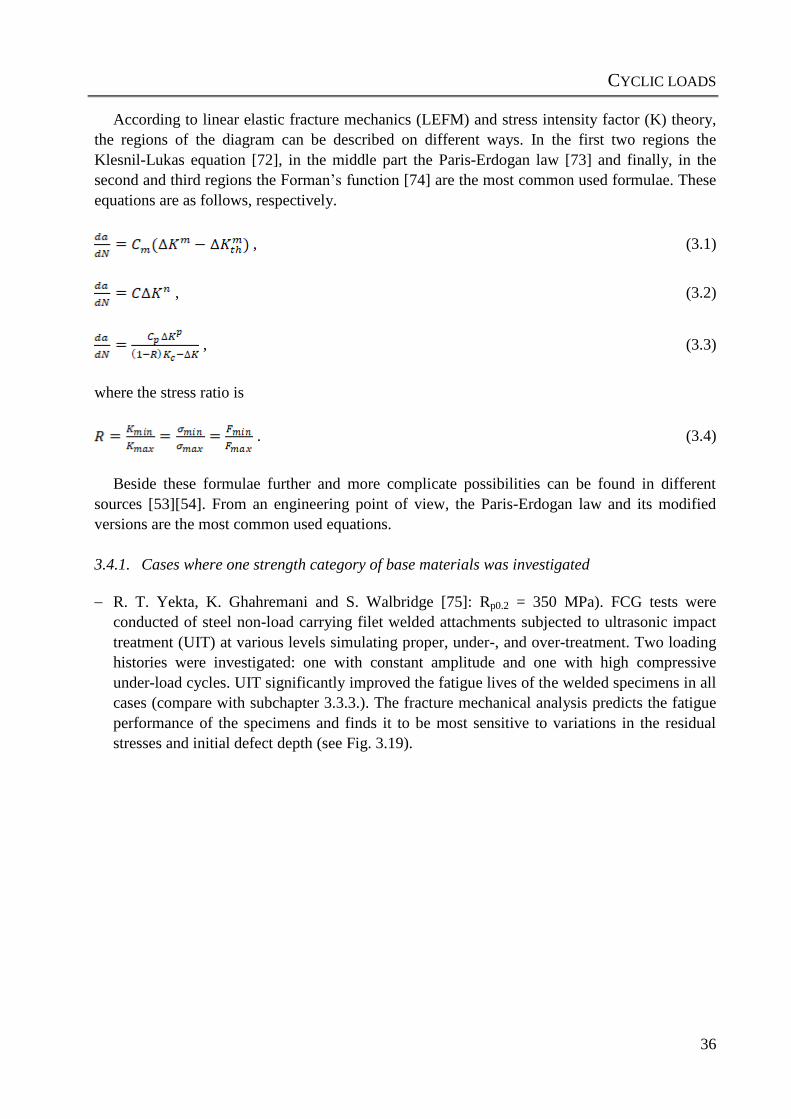
CYCLIC LOADS
36
According to linear elastic fracture mechanics (LEFM) and stress intensity factor (K) theory,
the regions of the diagram can be described on different ways. In the first two regions the
Klesnil-Lukas equation [72], in the middle part the Paris-Erdogan law [73] and finally, in the
second and third regions the Forman’s function [74] are the most common used formulae. These
equations are as follows, respectively.
, (3.1)
, (3.2)
, (3.3)
where the stress ratio is
. (3.4)
Beside these formulae further and more complicate possibilities can be found in different
sources [53][54]. From an engineering point of view, the Paris-Erdogan law and its modified
versions are the most common used equations.
3.4.1. Cases where one strength category of base materials was investigated
R. T. Yekta, K. Ghahremani and S. Walbridge [75]: Rp0.2 = 350 MPa). FCG tests were
conducted of steel non-load carrying filet welded attachments subjected to ultrasonic impact
treatment (UIT) at various levels simulating proper, under-, and over-treatment. Two loading
histories were investigated: one with constant amplitude and one with high compressive
under-load cycles. UIT significantly improved the fatigue lives of the welded specimens in all
cases (compare with subchapter 3.3.3.). The fracture mechanical analysis predicts the fatigue
performance of the specimens and finds it to be most sensitive to variations in the residual
stresses and initial defect depth (see Fig. 3.19).
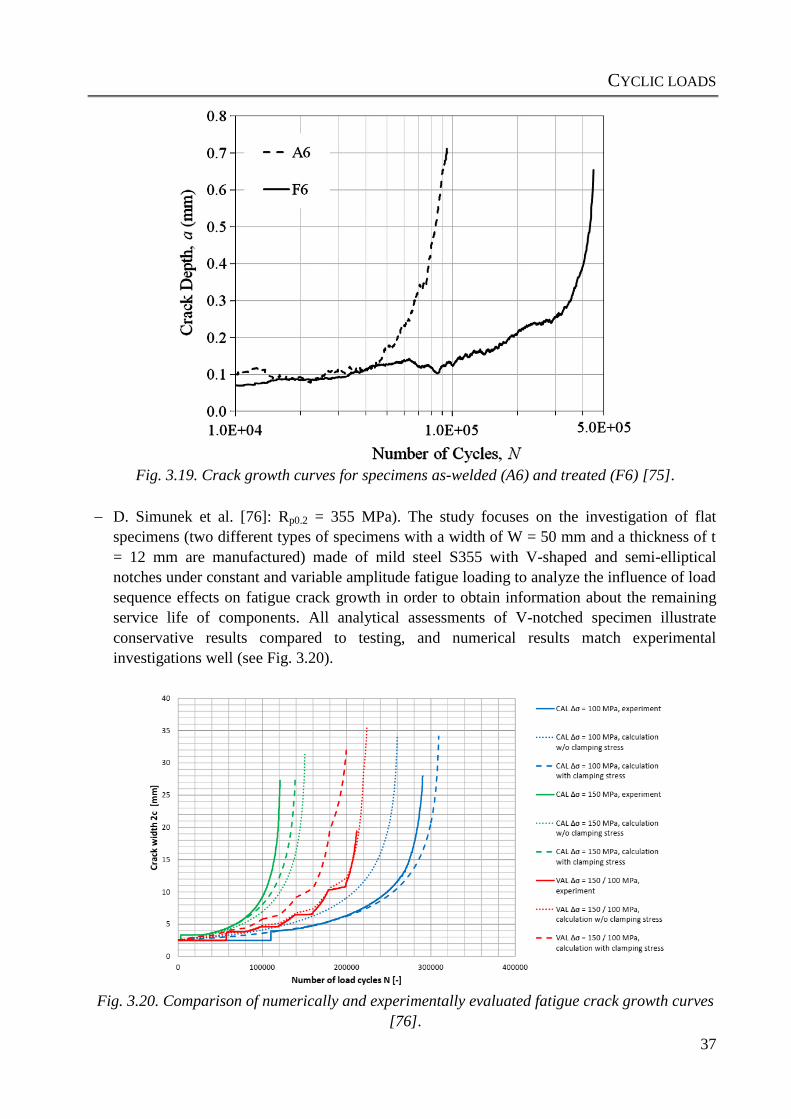
CYCLIC LOADS
37
Fig. 3.19. Crack growth curves for specimens as-welded (A6) and treated (F6) [75].
D. Simunek et al. [76]: Rp0.2 = 355 MPa). The study focuses on the investigation of flat
specimens (two different types of specimens with a width of W = 50 mm and a thickness of t
= 12 mm are manufactured) made of mild steel S355 with V-shaped and semi-elliptical
notches under constant and variable amplitude fatigue loading to analyze the influence of load
sequence effects on fatigue crack growth in order to obtain information about the remaining
service life of components. All analytical assessments of V-notched specimen illustrate
conservative results compared to testing, and numerical results match experimental
investigations well (see Fig. 3.20).
Fig. 3.20. Comparison of numerically and experimentally evaluated fatigue crack growth curves
[76].
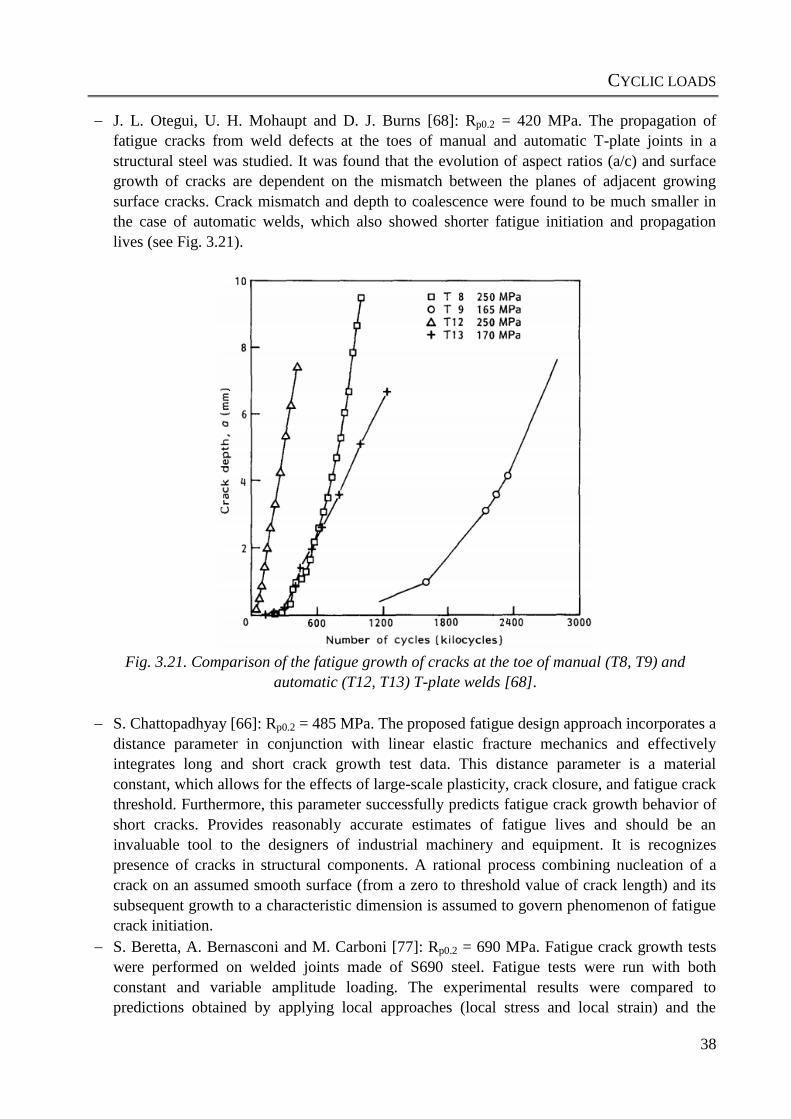
CYCLIC LOADS
38
J. L. Otegui, U. H. Mohaupt and D. J. Burns [68]: Rp0.2 = 420 MPa. The propagation of
fatigue cracks from weld defects at the toes of manual and automatic T-plate joints in a
structural steel was studied. It was found that the evolution of aspect ratios (a/c) and surface
growth of cracks are dependent on the mismatch between the planes of adjacent growing
surface cracks. Crack mismatch and depth to coalescence were found to be much smaller in
the case of automatic welds, which also showed shorter fatigue initiation and propagation
lives (see Fig. 3.21).
Fig. 3.21. Comparison of the fatigue growth of cracks at the toe of manual (T8, T9) and
automatic (T12, T13) T-plate welds [68].
S. Chattopadhyay [66]: Rp0.2 = 485 MPa. The proposed fatigue design approach incorporates a
distance parameter in conjunction with linear elastic fracture mechanics and effectively
integrates long and short crack growth test data. This distance parameter is a material
constant, which allows for the effects of large-scale plasticity, crack closure, and fatigue crack
threshold. Furthermore, this parameter successfully predicts fatigue crack growth behavior of
short cracks. Provides reasonably accurate estimates of fatigue lives and should be an
invaluable tool to the designers of industrial machinery and equipment. It is recognizes
presence of cracks in structural components. A rational process combining nucleation of a
crack on an assumed smooth surface (from a zero to threshold value of crack length) and its
subsequent growth to a characteristic dimension is assumed to govern phenomenon of fatigue
crack initiation.
S. Beretta, A. Bernasconi and M. Carboni [77]: Rp0.2 = 690 MPa. Fatigue crack growth tests
were performed on welded joints made of S690 steel. Fatigue tests were run with both
constant and variable amplitude loading. The experimental results were compared to
predictions obtained by applying local approaches (local stress and local strain) and the
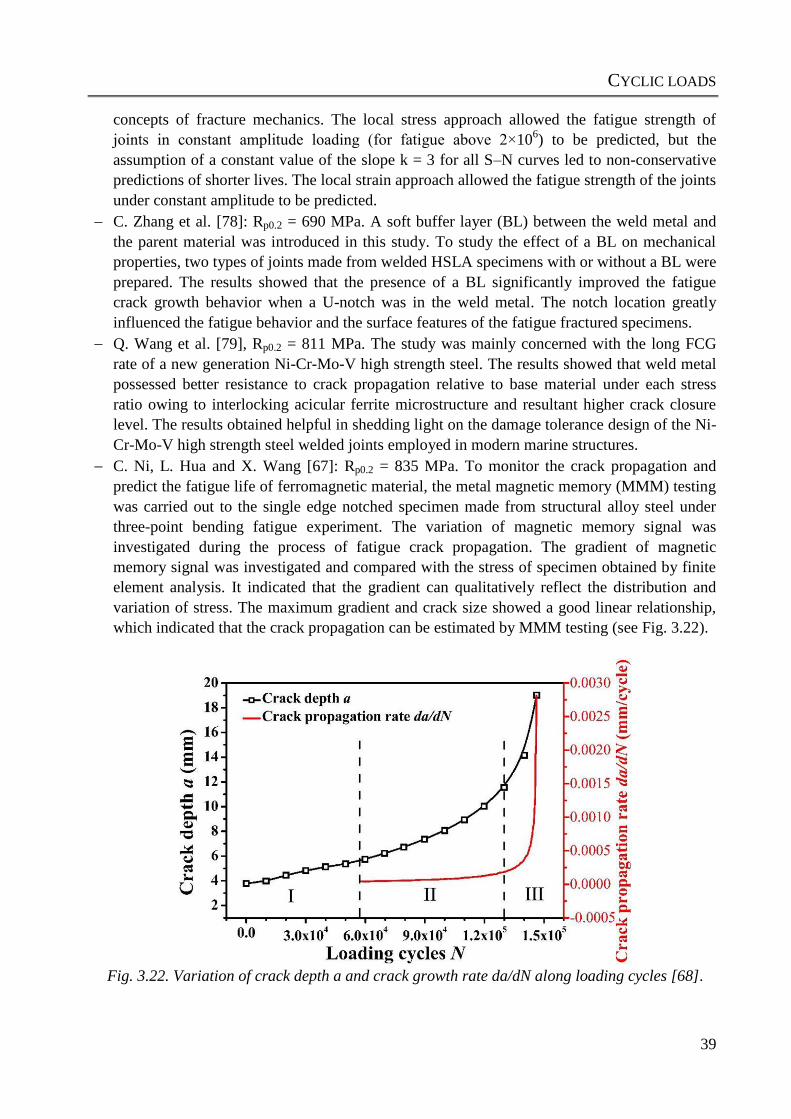
CYCLIC LOADS
39
concepts of fracture mechanics. The local stress approach allowed the fatigue strength of
joints in constant amplitude loading (for fatigue above 2×10⁶) to be predicted, but the
assumption of a constant value of the slope k = 3 for all S–N curves led to non-conservative
predictions of shorter lives. The local strain approach allowed the fatigue strength of the joints
under constant amplitude to be predicted.
C. Zhang et al. [78]: Rp0.2 = 690 MPa. A soft buffer layer (BL) between the weld metal and
the parent material was introduced in this study. To study the effect of a BL on mechanical
properties, two types of joints made from welded HSLA specimens with or without a BL were
prepared. The results showed that the presence of a BL significantly improved the fatigue
crack growth behavior when a U-notch was in the weld metal. The notch location greatly
influenced the fatigue behavior and the surface features of the fatigue fractured specimens.
Q. Wang et al. [79], Rp0.2 = 811 MPa. The study was mainly concerned with the long FCG
rate of a new generation Ni-Cr-Mo-V high strength steel. The results showed that weld metal
possessed better resistance to crack propagation relative to base material under each stress
ratio owing to interlocking acicular ferrite microstructure and resultant higher crack closure
level. The results obtained helpful in shedding light on the damage tolerance design of the Ni-
Cr-Mo-V high strength steel welded joints employed in modern marine structures.
C. Ni, L. Hua and X. Wang [67]: Rp0.2 = 835 MPa. To monitor the crack propagation and
predict the fatigue life of ferromagnetic material, the metal magnetic memory (MMM) testing
was carried out to the single edge notched specimen made from structural alloy steel under
three-point bending fatigue experiment. The variation of magnetic memory signal was
investigated during the process of fatigue crack propagation. The gradient of magnetic
memory signal was investigated and compared with the stress of specimen obtained by finite
element analysis. It indicated that the gradient can qualitatively reflect the distribution and
variation of stress. The maximum gradient and crack size showed a good linear relationship,
which indicated that the crack propagation can be estimated by MMM testing (see Fig. 3.22).
Fig. 3.22. Variation of crack depth a and crack growth rate da/dN along loading cycles [68].
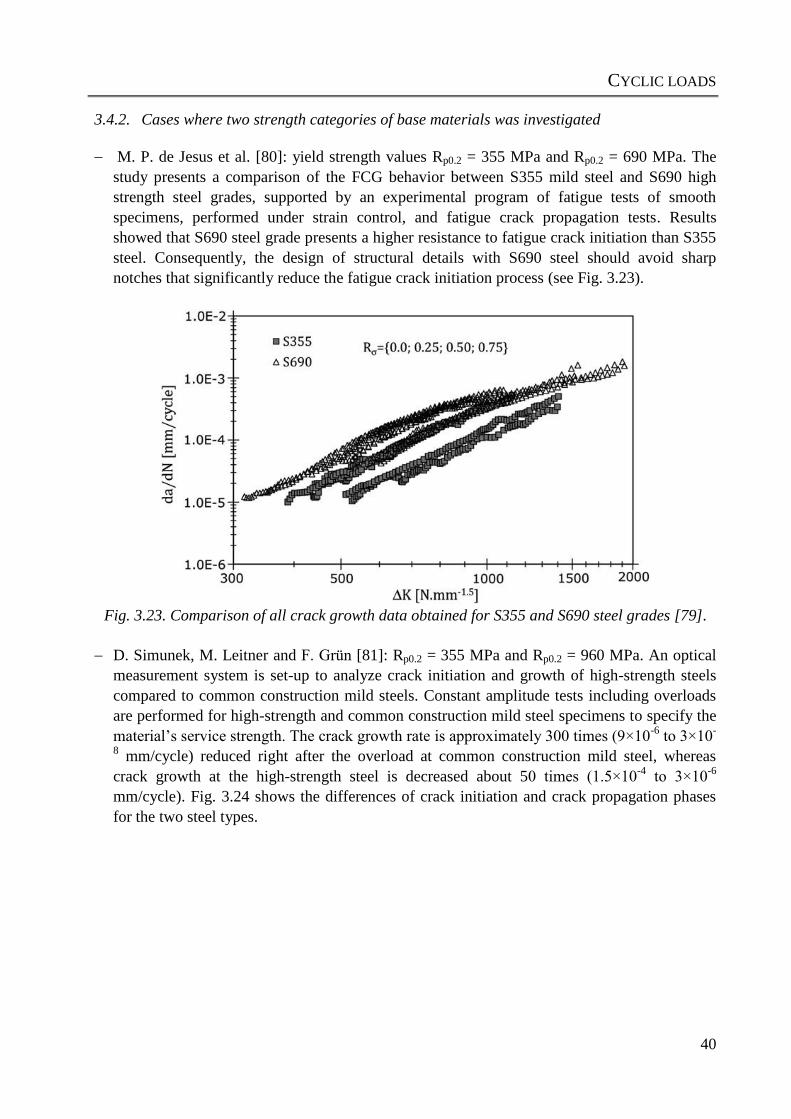
CYCLIC LOADS
40
3.4.2. Cases where two strength categories of base materials was investigated
M. P. de Jesus et al. [80]: yield strength values Rp0.2 = 355 MPa and Rp0.2 = 690 MPa. The
study presents a comparison of the FCG behavior between S355 mild steel and S690 high
strength steel grades, supported by an experimental program of fatigue tests of smooth
specimens, performed under strain control, and fatigue crack propagation tests. Results
showed that S690 steel grade presents a higher resistance to fatigue crack initiation than S355
steel. Consequently, the design of structural details with S690 steel should avoid sharp
notches that significantly reduce the fatigue crack initiation process (see Fig. 3.23).
Fig. 3.23. Comparison of all crack growth data obtained for S355 and S690 steel grades [79].
D. Simunek, M. Leitner and F. Grün [81]: Rp0.2 = 355 MPa and Rp0.2 = 960 MPa. An optical
measurement system is set-up to analyze crack initiation and growth of high-strength steels
compared to common construction mild steels. Constant amplitude tests including overloads
are performed for high-strength and common construction mild steel specimens to specify the
material’s service strength. The crack growth rate is approximately 300 times (9×10-6
to 3×10-
8 mm/cycle) reduced right after the overload at common construction mild steel, whereas
crack growth at the high-strength steel is decreased about 50 times (1.5×10-4
to 3×10⁻⁶
mm/cycle). Fig. 3.24 shows the differences of crack initiation and crack propagation phases
for the two steel types.
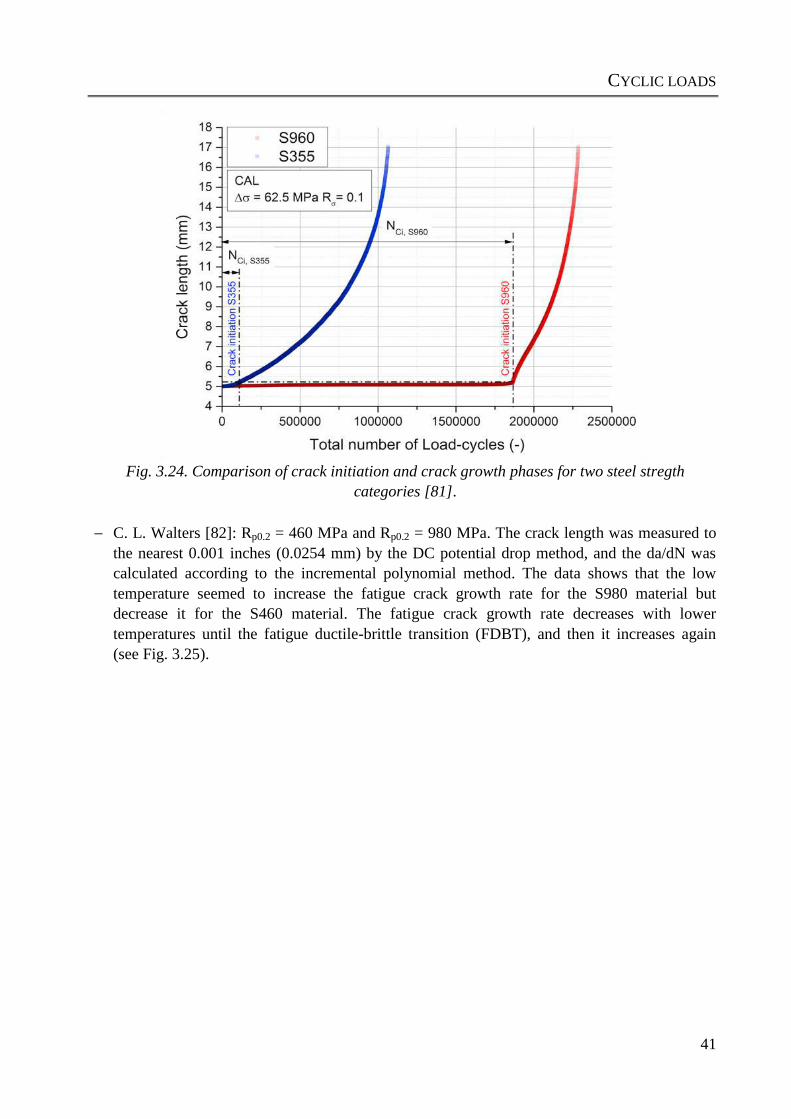
CYCLIC LOADS
41
Fig. 3.24. Comparison of crack initiation and crack growth phases for two steel stregth
categories [81].
C. L. Walters [82]: Rp0.2 = 460 MPa and Rp0.2 = 980 MPa. The crack length was measured to
the nearest 0.001 inches (0.0254 mm) by the DC potential drop method, and the da/dN was
calculated according to the incremental polynomial method. The data shows that the low
temperature seemed to increase the fatigue crack growth rate for the S980 material but
decrease it for the S460 material. The fatigue crack growth rate decreases with lower
temperatures until the fatigue ductile-brittle transition (FDBT), and then it increases again
(see Fig. 3.25).
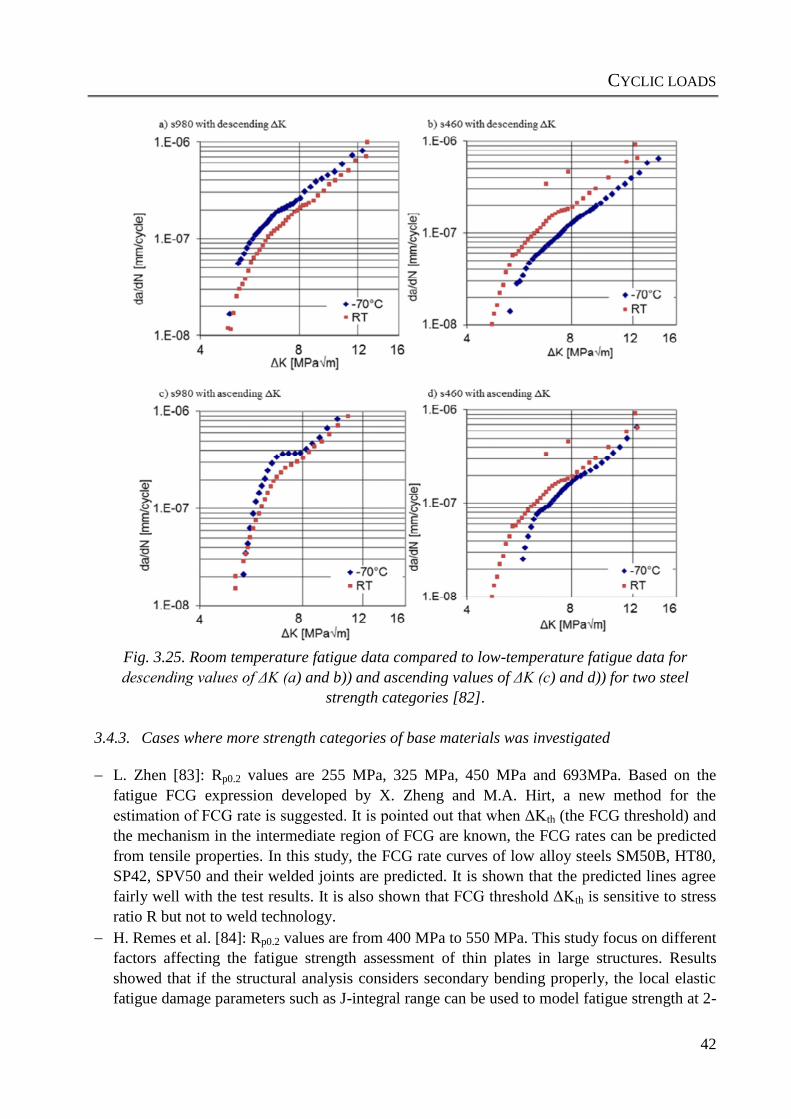
CYCLIC LOADS
42
Fig. 3.25. Room temperature fatigue data compared to low-temperature fatigue data for
descending values of ΔK (a) and b)) and ascending values of ΔK (c) and d)) for two steel
strength categories [82].
3.4.3. Cases where more strength categories of base materials was investigated
L. Zhen [83]: Rp0.2 values are 255 MPa, 325 MPa, 450 MPa and 693MPa. Based on the
fatigue FCG expression developed by X. Zheng and M.A. Hirt, a new method for the
estimation of FCG rate is suggested. It is pointed out that when ΔKth (the FCG threshold) and
the mechanism in the intermediate region of FCG are known, the FCG rates can be predicted
from tensile properties. In this study, the FCG rate curves of low alloy steels SM50B, HT80,
SP42, SPV50 and their welded joints are predicted. It is shown that the predicted lines agree
fairly well with the test results. It is also shown that FCG threshold ΔKth is sensitive to stress
ratio R but not to weld technology.
H. Remes et al. [84]: Rp0.2 values are from 400 MPa to 550 MPa. This study focus on different
factors affecting the fatigue strength assessment of thin plates in large structures. Results
showed that if the structural analysis considers secondary bending properly, the local elastic
fatigue damage parameters such as J-integral range can be used to model fatigue strength at 2-
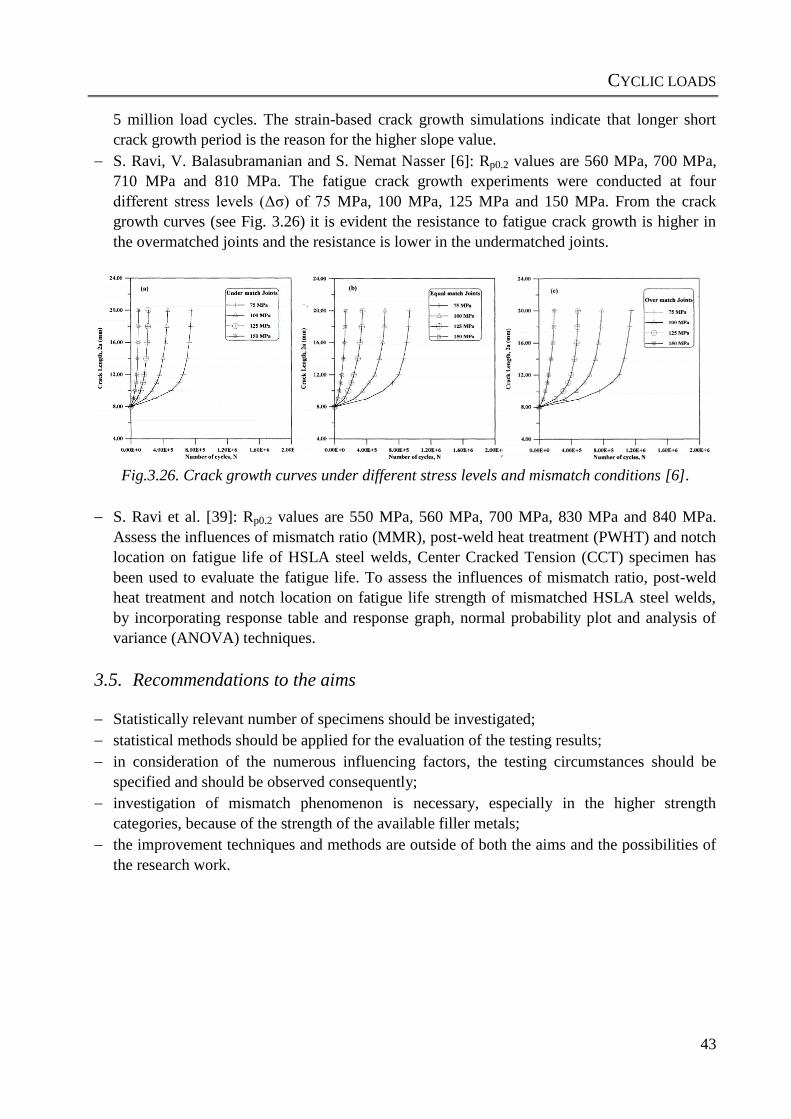
CYCLIC LOADS
43
5 million load cycles. The strain-based crack growth simulations indicate that longer short
crack growth period is the reason for the higher slope value.
S. Ravi, V. Balasubramanian and S. Nemat Nasser [6]: Rp0.2 values are 560 MPa, 700 MPa,
710 MPa and 810 MPa. The fatigue crack growth experiments were conducted at four
different stress levels (Δσ) of 75 MPa, 100 MPa, 125 MPa and 150 MPa. From the crack
growth curves (see Fig. 3.26) it is evident the resistance to fatigue crack growth is higher in
the overmatched joints and the resistance is lower in the undermatched joints.
Fig.3.26. Crack growth curves under different stress levels and mismatch conditions [6].
S. Ravi et al. [39]: Rp0.2 values are 550 MPa, 560 MPa, 700 MPa, 830 MPa and 840 MPa.
Assess the influences of mismatch ratio (MMR), post-weld heat treatment (PWHT) and notch
location on fatigue life of HSLA steel welds, Center Cracked Tension (CCT) specimen has
been used to evaluate the fatigue life. To assess the influences of mismatch ratio, post-weld
heat treatment and notch location on fatigue life strength of mismatched HSLA steel welds,
by incorporating response table and response graph, normal probability plot and analysis of
variance (ANOVA) techniques.
3.5. Recommendations to the aims
Statistically relevant number of specimens should be investigated;
statistical methods should be applied for the evaluation of the testing results;
in consideration of the numerous influencing factors, the testing circumstances should be
specified and should be observed consequently;
investigation of mismatch phenomenon is necessary, especially in the higher strength
categories, because of the strength of the available filler metals;
the improvement techniques and methods are outside of both the aims and the possibilities of
the research work.
SUMMARY, SPECIFIC AIMS OF THE RESEARCH WORK
44
4. SUMMARY, SPECIFIC AIMS OF THE RESEARCH WORK
Because the research work is a significant continuation of previous researches, therefore
builds upon their experience [11] and uses their measurement results [9][10]. It means that the
previous results provide good and reliable basis for the comparison of the research results.
The specific aims of the research work are as follows.
Carrying out high cycle fatigue investigations on differently mismatched butt welded joints
with different crack paths made by different strength categories of high strength steels.
Studying the influence of welding heat input on high cycle fatigue resistance of the
thermomechanically rolled high strength steel type.
Development a generally usable method for determination of fatigue strength curves, and
determination of the curves for all investigated cases.
Carrying out fatigue crack growth investigations on differently mismatched welded joints
with different notch locations made by different strength categories of high strength steels.
Studying the influence of welding heat input influence on fatigue crack growth resistance of
the thermomechanically rolled high strength steel type.
Analysing the usability of previously developed method for the determination of fatigue crack
propagation design or limit curves for high strength steels and their welded joints, furthermore
determination of the curves for all investigated cases.
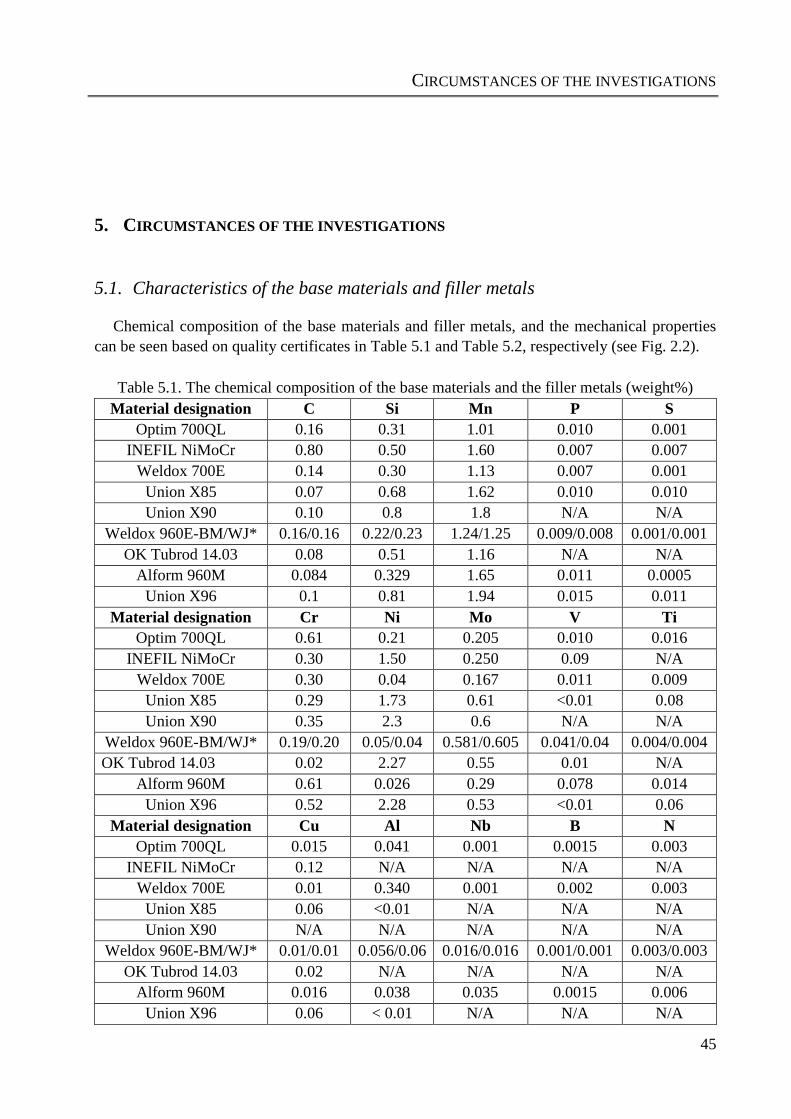
CIRCUMSTANCES OF THE INVESTIGATIONS
45
5. CIRCUMSTANCES OF THE INVESTIGATIONS
5.1. Characteristics of the base materials and filler metals
Chemical composition of the base materials and filler metals, and the mechanical properties
can be seen based on quality certificates in Table 5.1 and Table 5.2, respectively (see Fig. 2.2).
Table 5.1. The chemical composition of the base materials and the filler metals (weight%)
Material designation C Si Mn P S
Optim 700QL 0.16 0.31 1.01 0.010 0.001
INEFIL NiMoCr
0.80 0.50 1.60 0.007 0.007
Weldox 700E 0.14 0.30 1.13 0.007 0.001
Union X85 0.07 0.68 1.62 0.010 0.010
Union X90 0.10 0.8 1.8 N/A N/A
Weldox 960E-BM/WJ* 0.16/0.16 0.22/0.23 1.24/1.25 0.009/0.008 0.001/0.001
OK Tubrod 14.03
0.08 0.51 1.16 N/A N/A
Alform 960M 0.084 0.329 1.65 0.011 0.0005
Union X96 0.1 0.81 1.94 0.015 0.011
Material designation Cr Ni Mo V Ti
Optim 700QL 0.61 0.21 0.205 0.010 0.016
INEFIL NiMoCr
0.30 1.50 0.250 0.09 N/A
Weldox 700E 0.30 0.04 0.167 0.011 0.009
Union X85 0.29 1.73 0.61 <0.01 0.08
Union X90 0.35 2.3 0.6 N/A N/A
Weldox 960E-BM/WJ* 0.19/0.20 0.05/0.04 0.581/0.605 0.041/0.04 0.004/0.004
OK Tubrod 14.03
0.02 2.27 0.55 0.01 N/A
Alform 960M 0.61 0.026 0.29 0.078 0.014
Union X96 0.52 2.28 0.53 <0.01 0.06
Material designation Cu Al Nb B N
Optim 700QL 0.015 0.041 0.001 0.0015 0.003
INEFIL NiMoCr 0.12 N/A N/A N/A N/A
Weldox 700E 0.01 0.340 0.001 0.002 0.003
Union X85 0.06 <0.01 N/A N/A N/A
Union X90 N/A N/A N/A N/A N/A
Weldox 960E-BM/WJ* 0.01/0.01 0.056/0.06 0.016/0.016 0.001/0.001 0.003/0.003
OK Tubrod 14.03
0.02 N/A N/A N/A N/A
Alform 960M 0.016 0.038 0.035 0.0015 0.006
Union X96 0.06 < 0.01 N/A N/A N/A
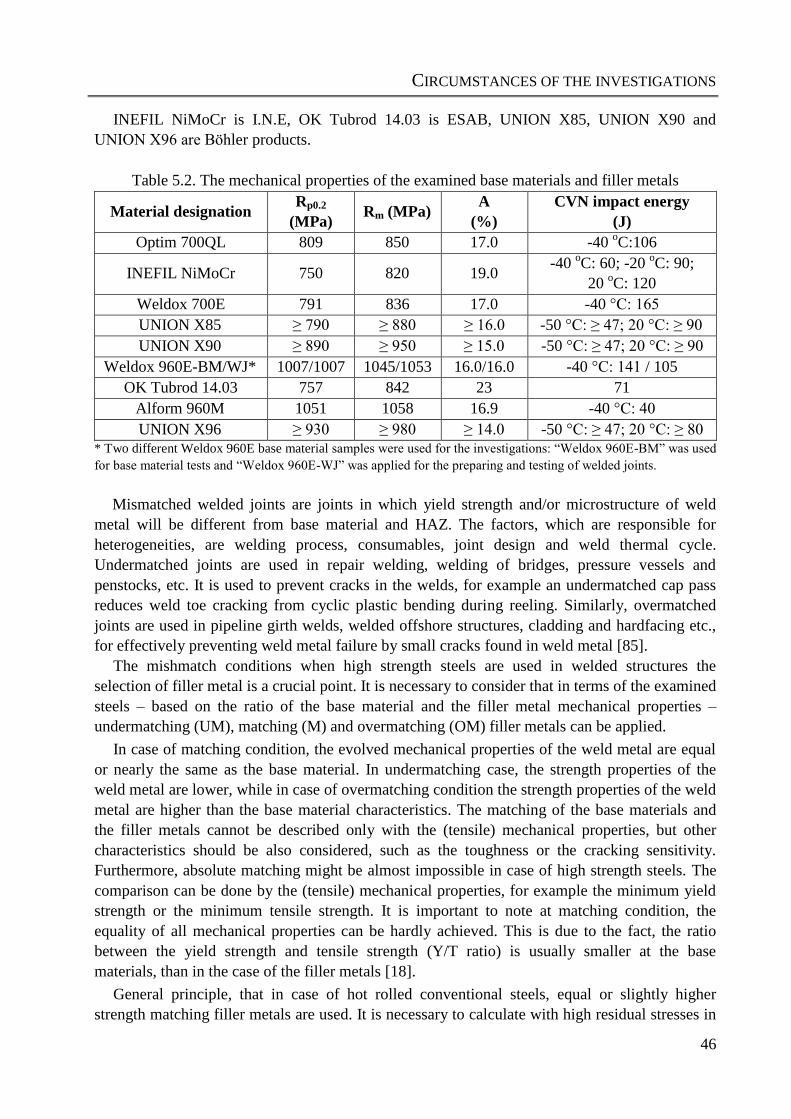
CIRCUMSTANCES OF THE INVESTIGATIONS
46
INEFIL NiMoCr is I.N.E, OK Tubrod 14.03 is ESAB, UNION X85, UNION X90 and
UNION X96 are Böhler products.
Table 5.2. The mechanical properties of the examined base materials and filler metals
Material designation Rp0.2
(MPa) Rm (MPa)
A
(%)
CVN impact energy
(J)
Optim 700QL 809 850 17.0 -40 oC:106
INEFIL NiMoCr 750 820 19.0 -40
oC: 60; -20
oC: 90;
20 oC: 120
Weldox 700E 791 836 17.0 -40 °C: 165
UNION X85 ≥ 790 ≥ 880 ≥ 16.0 -50 °C: ≥ 47; 20 °C: ≥ 90
UNION X90 ≥ 890 ≥ 950 ≥ 15.0 -50 °C: ≥ 47; 20 °C: ≥ 90
Weldox 960E-BM/WJ* 1007/1007 1045/1053 16.0/16.0 -40 °C: 141 / 105
OK Tubrod 14.03
757 842 23 71
Alform 960M 1051 1058 16.9 -40 °C: 40
UNION X96 ≥ 930 ≥ 980 ≥ 14.0 -50 °C: ≥ 47; 20 °C: ≥ 80
* Two different Weldox 960E base material samples were used for the investigations: “Weldox 960E-BM” was used
for base material tests and “Weldox 960E-WJ” was applied for the preparing and testing of welded joints.
Mismatched welded joints are joints in which yield strength and/or microstructure of weld
metal will be different from base material and HAZ. The factors, which are responsible for
heterogeneities, are welding process, consumables, joint design and weld thermal cycle.
Undermatched joints are used in repair welding, welding of bridges, pressure vessels and
penstocks, etc. It is used to prevent cracks in the welds, for example an undermatched cap pass
reduces weld toe cracking from cyclic plastic bending during reeling. Similarly, overmatched
joints are used in pipeline girth welds, welded offshore structures, cladding and hardfacing etc.,
for effectively preventing weld metal failure by small cracks found in weld metal [85].
The mishmatch conditions when high strength steels are used in welded structures the
selection of filler metal is a crucial point. It is necessary to consider that in terms of the examined
steels – based on the ratio of the base material and the filler metal mechanical properties –
undermatching (UM), matching (M) and overmatching (OM) filler metals can be applied.
In case of matching condition, the evolved mechanical properties of the weld metal are equal
or nearly the same as the base material. In undermatching case, the strength properties of the
weld metal are lower, while in case of overmatching condition the strength properties of the weld
metal are higher than the base material characteristics. The matching of the base materials and
the filler metals cannot be described only with the (tensile) mechanical properties, but other
characteristics should be also considered, such as the toughness or the cracking sensitivity.
Furthermore, absolute matching might be almost impossible in case of high strength steels. The
comparison can be done by the (tensile) mechanical properties, for example the minimum yield
strength or the minimum tensile strength. It is important to note at matching condition, the
equality of all mechanical properties can be hardly achieved. This is due to the fact, the ratio
between the yield strength and tensile strength (Y/T ratio) is usually smaller at the base
materials, than in the case of the filler metals [18].
General principle, that in case of hot rolled conventional steels, equal or slightly higher
strength matching filler metals are used. It is necessary to calculate with high residual stresses in
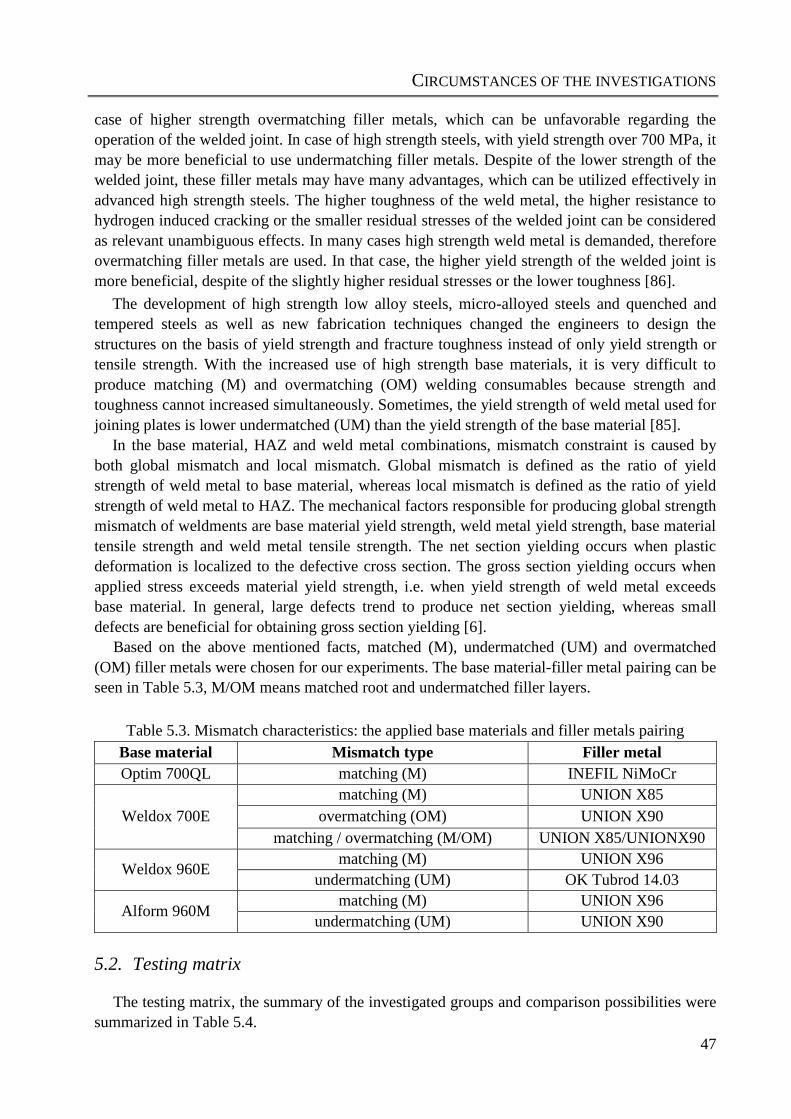
CIRCUMSTANCES OF THE INVESTIGATIONS
47
case of higher strength overmatching filler metals, which can be unfavorable regarding the
operation of the welded joint. In case of high strength steels, with yield strength over 700 MPa, it
may be more beneficial to use undermatching filler metals. Despite of the lower strength of the
welded joint, these filler metals may have many advantages, which can be utilized effectively in
advanced high strength steels. The higher toughness of the weld metal, the higher resistance to
hydrogen induced cracking or the smaller residual stresses of the welded joint can be considered
as relevant unambiguous effects. In many cases high strength weld metal is demanded, therefore
overmatching filler metals are used. In that case, the higher yield strength of the welded joint is
more beneficial, despite of the slightly higher residual stresses or the lower toughness [86].
The development of high strength low alloy steels, micro-alloyed steels and quenched and
tempered steels as well as new fabrication techniques changed the engineers to design the
structures on the basis of yield strength and fracture toughness instead of only yield strength or
tensile strength. With the increased use of high strength base materials, it is very difficult to
produce matching (M) and overmatching (OM) welding consumables because strength and
toughness cannot increased simultaneously. Sometimes, the yield strength of weld metal used for
joining plates is lower undermatched (UM) than the yield strength of the base material [85].
In the base material, HAZ and weld metal combinations, mismatch constraint is caused by
both global mismatch and local mismatch. Global mismatch is defined as the ratio of yield
strength of weld metal to base material, whereas local mismatch is defined as the ratio of yield
strength of weld metal to HAZ. The mechanical factors responsible for producing global strength
mismatch of weldments are base material yield strength, weld metal yield strength, base material
tensile strength and weld metal tensile strength. The net section yielding occurs when plastic
deformation is localized to the defective cross section. The gross section yielding occurs when
applied stress exceeds material yield strength, i.e. when yield strength of weld metal exceeds
base material. In general, large defects trend to produce net section yielding, whereas small
defects are beneficial for obtaining gross section yielding [6].
Based on the above mentioned facts, matched (M), undermatched (UM) and overmatched
(OM) filler metals were chosen for our experiments. The base material-filler metal pairing can be
seen in Table 5.3, M/OM means matched root and undermatched filler layers.
Table 5.3. Mismatch characteristics: the applied base materials and filler metals pairing
Base material Mismatch type Filler metal
Optim 700QL matching (M) INEFIL NiMoCr
Weldox 700E
matching (M) UNION X85
overmatching (OM) UNION X90
matching / overmatching (M/OM) UNION X85/UNIONX90
Weldox 960E matching (M) UNION X96
undermatching (UM) OK Tubrod 14.03
Alform 960M matching (M) UNION X96
undermatching (UM) UNION X90
5.2. Testing matrix
The testing matrix, the summary of the investigated groups and comparison possibilities were
summarized in Table 5.4.
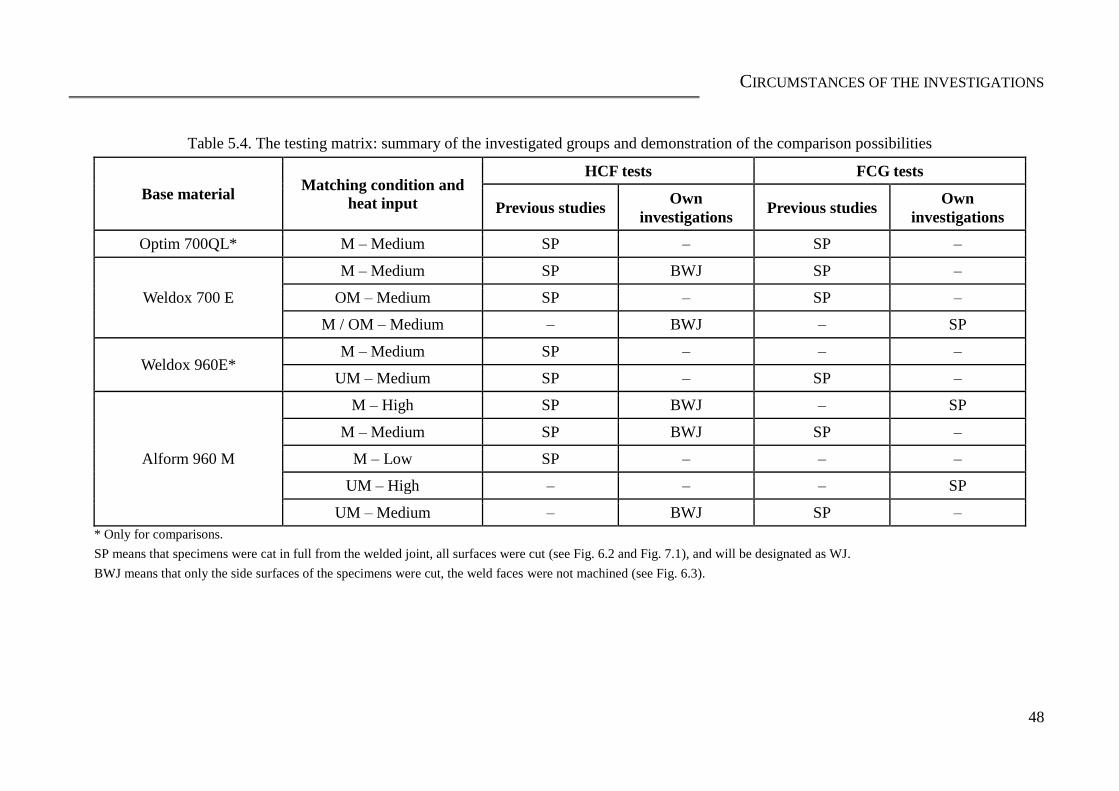
CIRCUMSTANCES OF THE INVESTIGATIONS
48
Table 5.4. The testing matrix: summary of the investigated groups and demonstration of the comparison possibilities
Base material Matching condition and
heat input
HCF tests FCG tests
Previous studies Own
investigations Previous studies
Own
investigations
Optim 700QL* M – Medium SP – SP –
Weldox 700 E
M – Medium SP BWJ SP –
OM – Medium SP – SP –
M / OM – Medium – BWJ – SP
Weldox 960E* M – Medium SP – – –
UM – Medium SP – SP –
Alform 960 M
M – High SP BWJ – SP
M – Medium SP BWJ SP –
M – Low SP – – –
UM – High – – – SP
UM – Medium – BWJ SP –
* Only for comparisons.
SP means that specimens were cat in full from the welded joint, all surfaces were cut (see Fig. 6.2 and Fig. 7.1), and will be designated as WJ.
BWJ means that only the side surfaces of the specimens were cut, the weld faces were not machined (see Fig. 6.3).
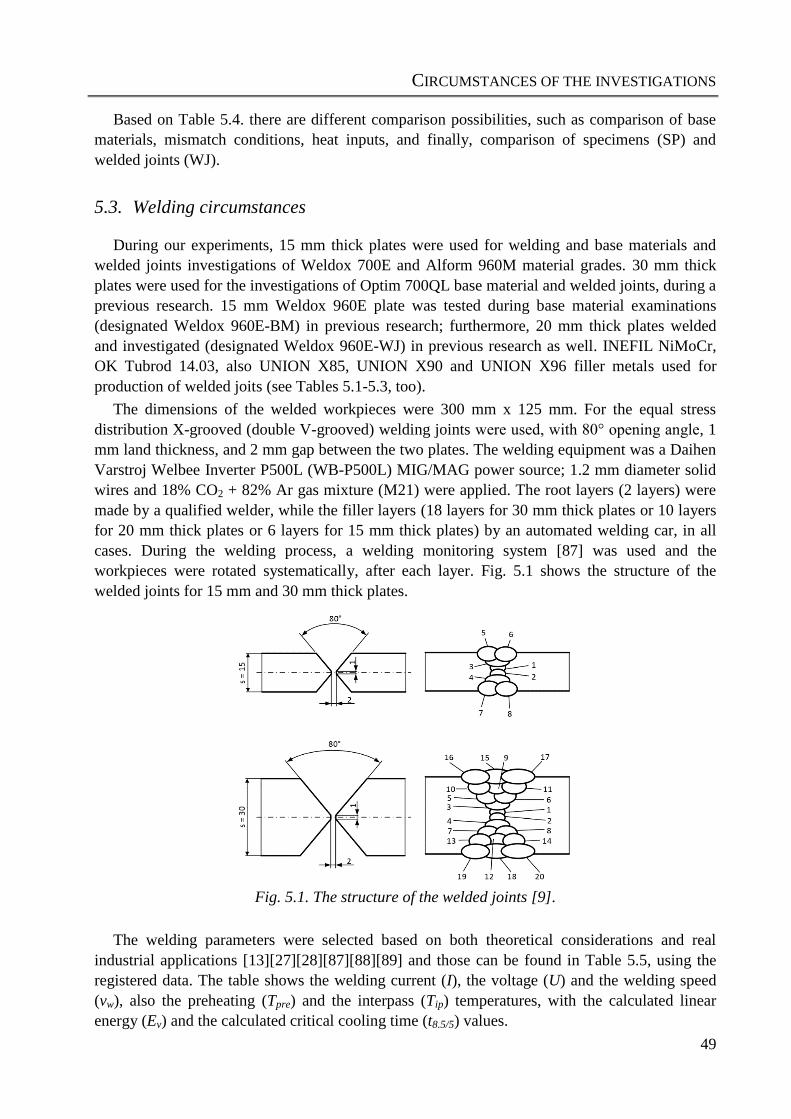
CIRCUMSTANCES OF THE INVESTIGATIONS
49
Based on Table 5.4. there are different comparison possibilities, such as comparison of base
materials, mismatch conditions, heat inputs, and finally, comparison of specimens (SP) and
welded joints (WJ).
5.3. Welding circumstances
During our experiments, 15 mm thick plates were used for welding and base materials and
welded joints investigations of Weldox 700E and Alform 960M material grades. 30 mm thick
plates were used for the investigations of Optim 700QL base material and welded joints, during a
previous research. 15 mm Weldox 960E plate was tested during base material examinations
(designated Weldox 960E-BM) in previous research; furthermore, 20 mm thick plates welded
and investigated (designated Weldox 960E-WJ) in previous research as well. INEFIL NiMoCr,
OK Tubrod 14.03, also UNION X85, UNION X90 and UNION X96 filler metals used for
production of welded joits (see Tables 5.1-5.3, too).
The dimensions of the welded workpieces were 300 mm x 125 mm. For the equal stress
distribution X-grooved (double V-grooved) welding joints were used, with 80° opening angle, 1
mm land thickness, and 2 mm gap between the two plates. The welding equipment was a Daihen
Varstroj Welbee Inverter P500L (WB-P500L) MIG/MAG power source; 1.2 mm diameter solid
wires and 18% CO2 + 82% Ar gas mixture (M21) were applied. The root layers (2 layers) were
made by a qualified welder, while the filler layers (18 layers for 30 mm thick plates or 10 layers
for 20 mm thick plates or 6 layers for 15 mm thick plates) by an automated welding car, in all
cases. During the welding process, a welding monitoring system [87] was used and the
workpieces were rotated systematically, after each layer. Fig. 5.1 shows the structure of the
welded joints for 15 mm and 30 mm thick plates.
Fig. 5.1. The structure of the welded joints [9].
The welding parameters were selected based on both theoretical considerations and real
industrial applications [13][27][28][87][88][89] and those can be found in Table 5.5, using the
registered data. The table shows the welding current (I), the voltage (U) and the welding speed
(vw), also the preheating (Tpre) and the interpass (Tip) temperatures, with the calculated linear
energy (Ev) and the calculated critical cooling time (t8.5/5) values.
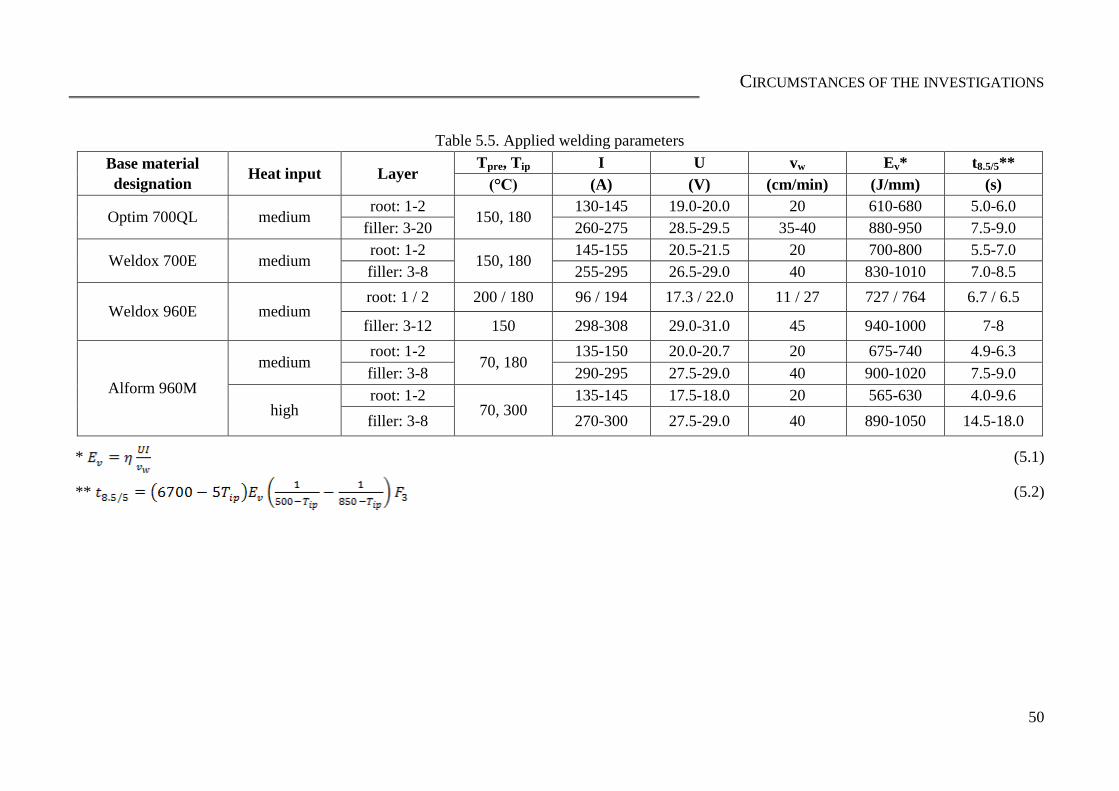
CIRCUMSTANCES OF THE INVESTIGATIONS
50
Table 5.5. Applied welding parameters
Base material
designation Heat input Layer
Tpre, Tip I U vw Ev* t8.5/5**
(°C) (A) (V) (cm/min) (J/mm) (s)
Optim 700QL medium root: 1-2
150, 180 130-145 19.0-20.0 20 610-680 5.0-6.0
filler: 3-20 260-275 28.5-29.5 35-40 880-950 7.5-9.0
Weldox 700E medium root: 1-2
150, 180 145-155 20.5-21.5 20 700-800 5.5-7.0
filler: 3-8 255-295 26.5-29.0 40 830-1010 7.0-8.5
Weldox 960E medium root: 1 / 2 200 / 180 96 / 194 17.3 / 22.0 11 / 27 727 / 764 6.7 / 6.5
filler: 3-12 150 298-308 29.0-31.0 45 940-1000 7-8
Alform 960M
medium root: 1-2
70, 180 135-150 20.0-20.7 20 675-740 4.9-6.3
filler: 3-8 290-295 27.5-29.0 40 900-1020 7.5-9.0
high root: 1-2
70, 300 135-145 17.5-18.0 20 565-630 4.0-9.6
filler: 3-8 270-300 27.5-29.0 40 890-1050 14.5-18.0
* (5.1)
** (5.2)
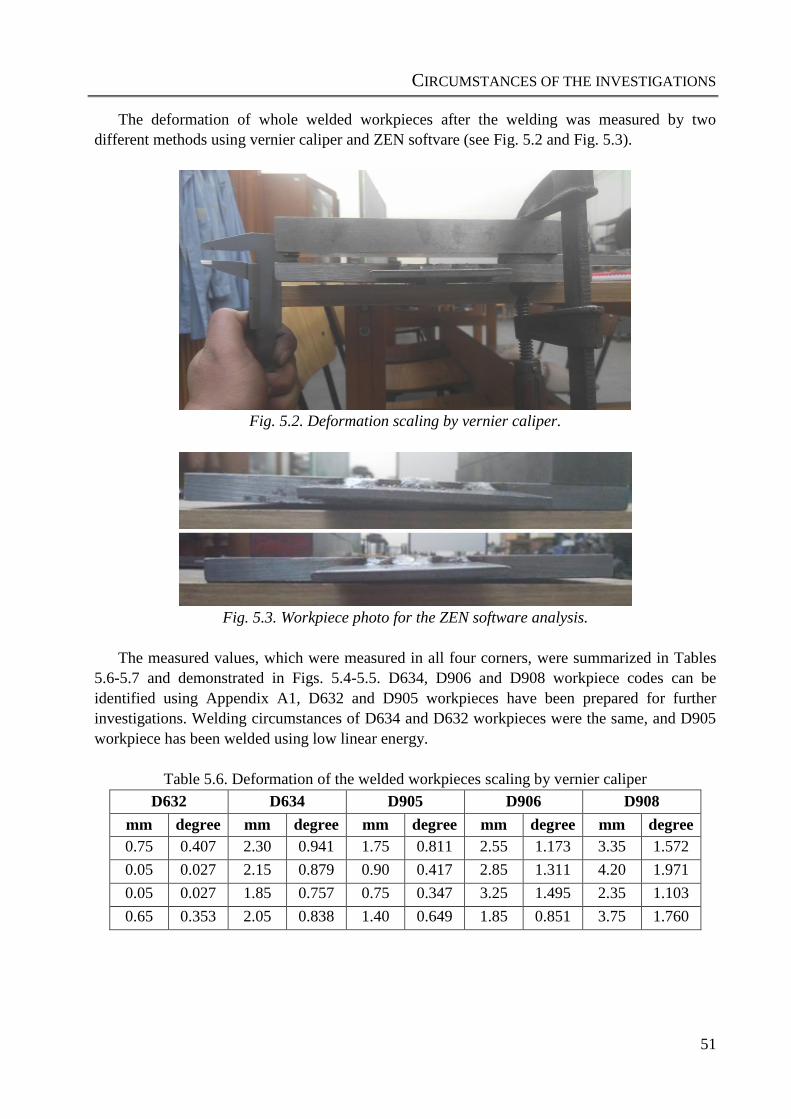
CIRCUMSTANCES OF THE INVESTIGATIONS
51
The deformation of whole welded workpieces after the welding was measured by two
different methods using vernier caliper and ZEN softvare (see Fig. 5.2 and Fig. 5.3).
Fig. 5.2. Deformation scaling by vernier caliper.
Fig. 5.3. Workpiece photo for the ZEN software analysis.
The measured values, which were measured in all four corners, were summarized in Tables
5.6-5.7 and demonstrated in Figs. 5.4-5.5. D634, D906 and D908 workpiece codes can be
identified using Appendix A1, D632 and D905 workpieces have been prepared for further
investigations. Welding circumstances of D634 and D632 workpieces were the same, and D905
workpiece has been welded using low linear energy.
Table 5.6. Deformation of the welded workpieces scaling by vernier caliper
D632 D634 D905 D906 D908
mm degree mm degree mm degree mm degree mm degree
0.75 0.407 2.30 0.941 1.75 0.811 2.55 1.173 3.35 1.572
0.05 0.027 2.15 0.879 0.90 0.417 2.85 1.311 4.20 1.971
0.05 0.027 1.85 0.757 0.75 0.347 3.25 1.495 2.35 1.103
0.65 0.353 2.05 0.838 1.40 0.649 1.85 0.851 3.75 1.760
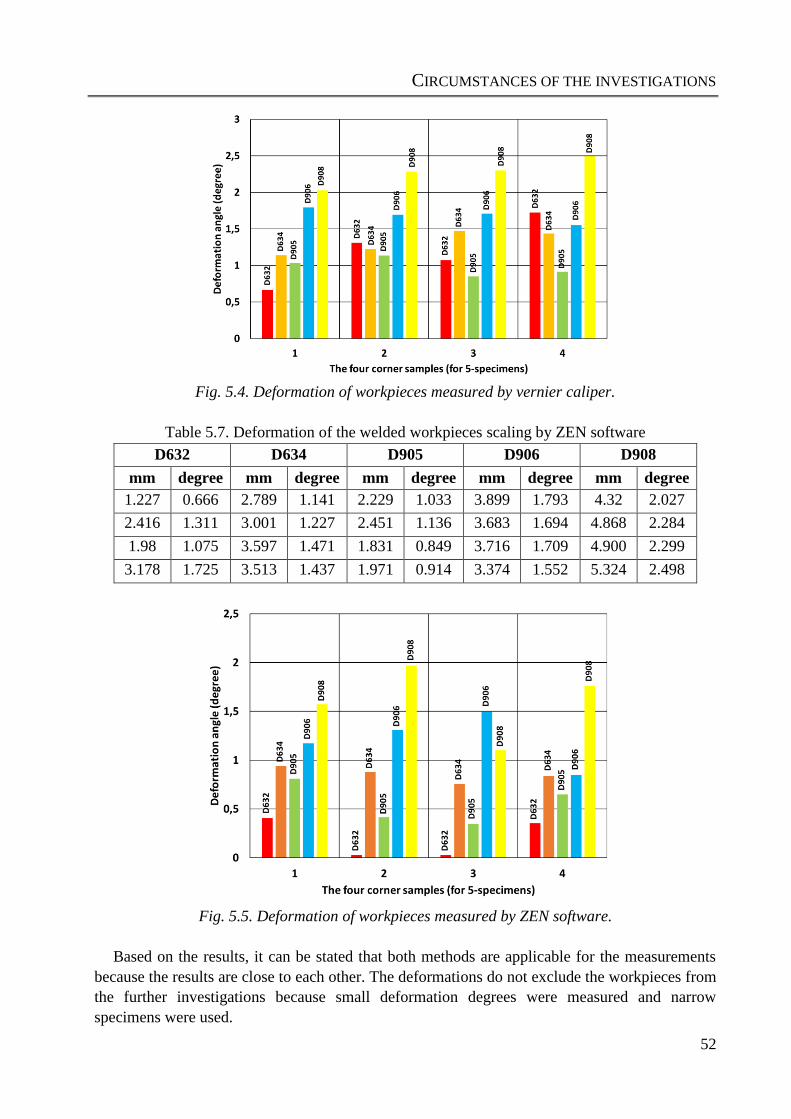
CIRCUMSTANCES OF THE INVESTIGATIONS
52
Fig. 5.4. Deformation of workpieces measured by vernier caliper.
Table 5.7. Deformation of the welded workpieces scaling by ZEN software
D632 D634 D905 D906 D908
mm degree mm degree mm degree mm degree mm degree
1.227 0.666 2.789 1.141 2.229 1.033 3.899 1.793 4.32 2.027
2.416 1.311 3.001 1.227 2.451 1.136 3.683 1.694 4.868 2.284
1.98 1.075 3.597 1.471 1.831 0.849 3.716 1.709 4.900 2.299
3.178 1.725 3.513 1.437 1.971 0.914 3.374 1.552 5.324 2.498
Fig. 5.5. Deformation of workpieces measured by ZEN software.
Based on the results, it can be stated that both methods are applicable for the measurements
because the results are close to each other. The deformations do not exclude the workpieces from
the further investigations because small deformation degrees were measured and narrow
specimens were used.
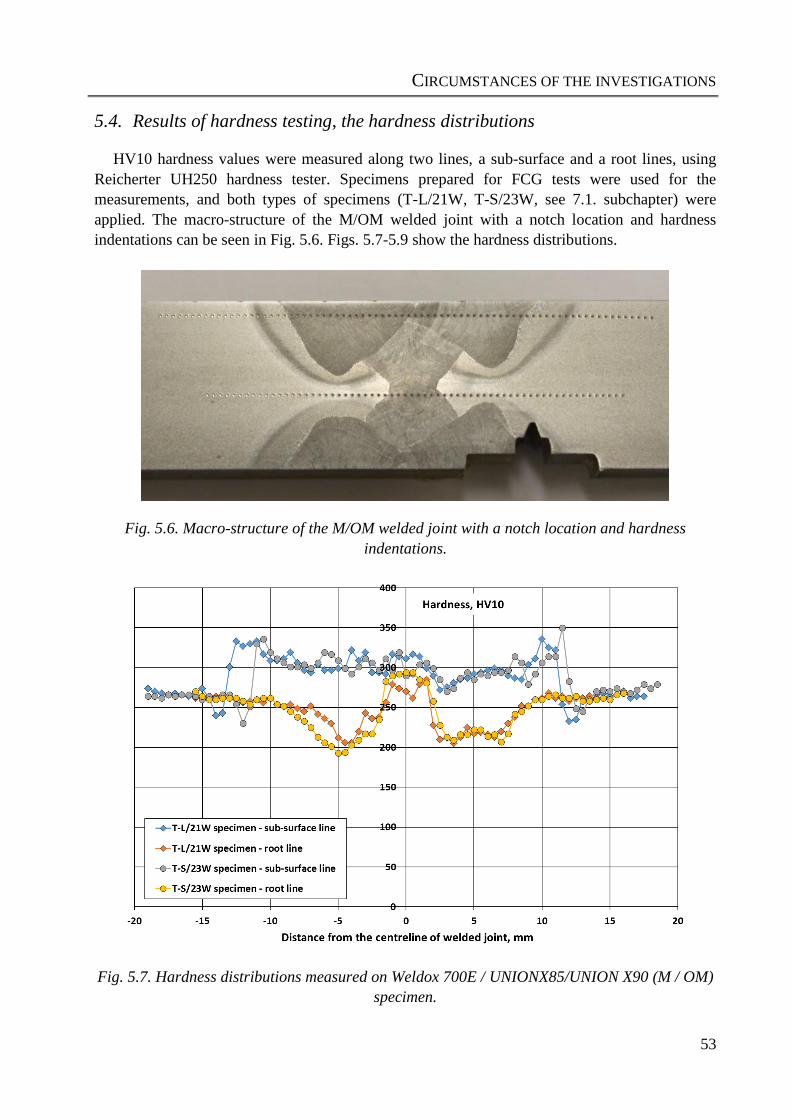
CIRCUMSTANCES OF THE INVESTIGATIONS
53
5.4. Results of hardness testing, the hardness distributions
HV10 hardness values were measured along two lines, a sub-surface and a root lines, using
Reicherter UH250 hardness tester. Specimens prepared for FCG tests were used for the
measurements, and both types of specimens (T-L/21W, T-S/23W, see 7.1. subchapter) were
applied. The macro-structure of the M/OM welded joint with a notch location and hardness
indentations can be seen in Fig. 5.6. Figs. 5.7-5.9 show the hardness distributions.
Fig. 5.6. Macro-structure of the M/OM welded joint with a notch location and hardness
indentations.
Fig. 5.7. Hardness distributions measured on Weldox 700E / UNIONX85/UNION X90 (M / OM)
specimen.
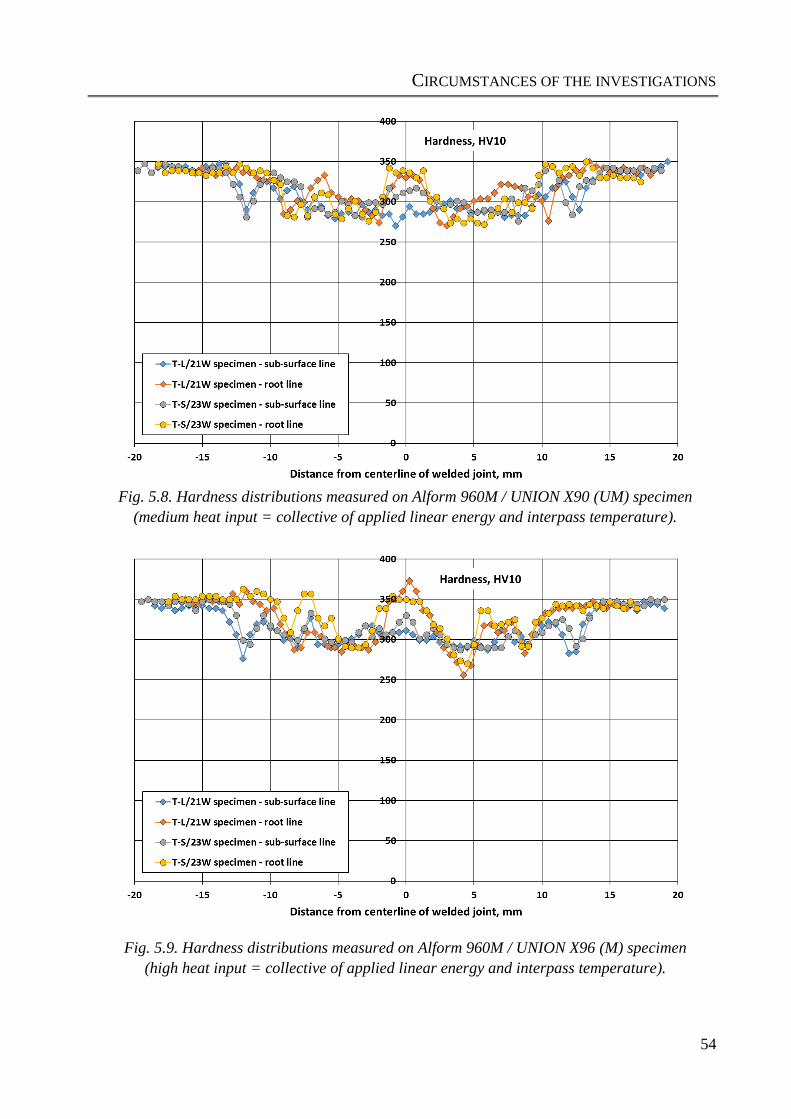
CIRCUMSTANCES OF THE INVESTIGATIONS
54
Fig. 5.8. Hardness distributions measured on Alform 960M / UNION X90 (UM) specimen
(medium heat input = collective of applied linear energy and interpass temperature).
Fig. 5.9. Hardness distributions measured on Alform 960M / UNION X96 (M) specimen
(high heat input = collective of applied linear energy and interpass temperature).
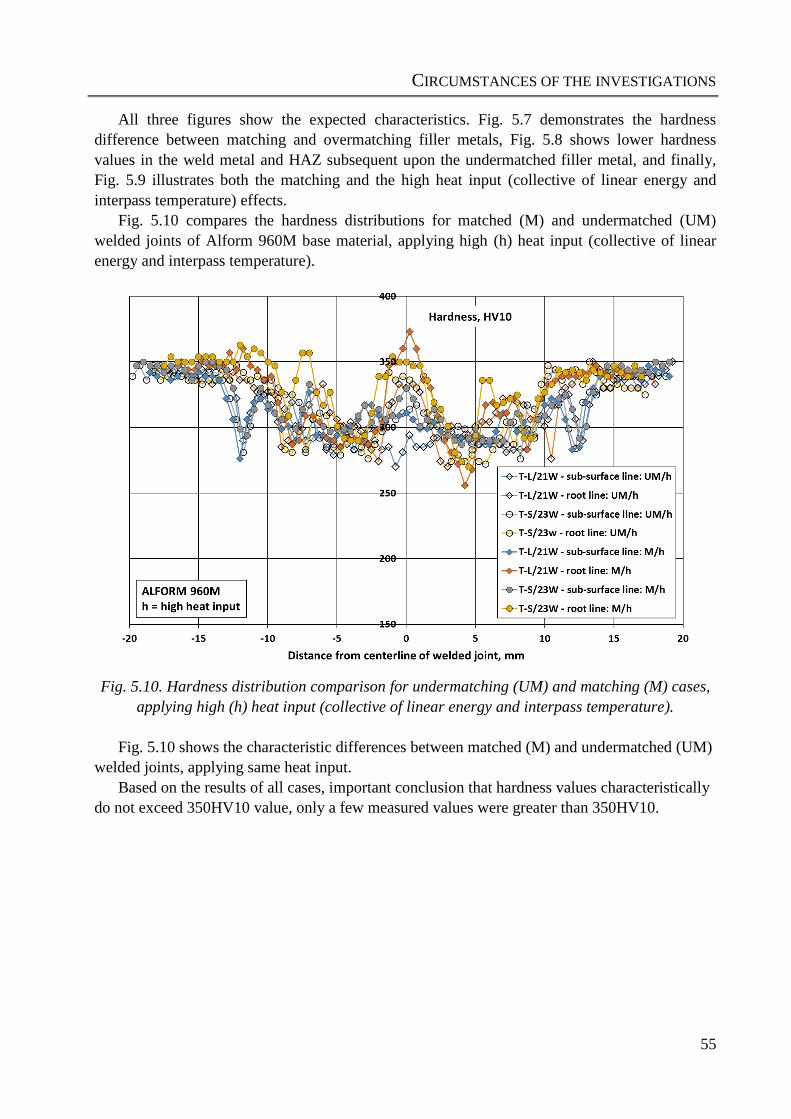
CIRCUMSTANCES OF THE INVESTIGATIONS
55
All three figures show the expected characteristics. Fig. 5.7 demonstrates the hardness
difference between matching and overmatching filler metals, Fig. 5.8 shows lower hardness
values in the weld metal and HAZ subsequent upon the undermatched filler metal, and finally,
Fig. 5.9 illustrates both the matching and the high heat input (collective of linear energy and
interpass temperature) effects.
Fig. 5.10 compares the hardness distributions for matched (M) and undermatched (UM)
welded joints of Alform 960M base material, applying high (h) heat input (collective of linear
energy and interpass temperature).
Fig. 5.10. Hardness distribution comparison for undermatching (UM) and matching (M) cases,
applying high (h) heat input (collective of linear energy and interpass temperature).
Fig. 5.10 shows the characteristic differences between matched (M) and undermatched (UM)
welded joints, applying same heat input.
Based on the results of all cases, important conclusion that hardness values characteristically
do not exceed 350HV10 value, only a few measured values were greater than 350HV10.
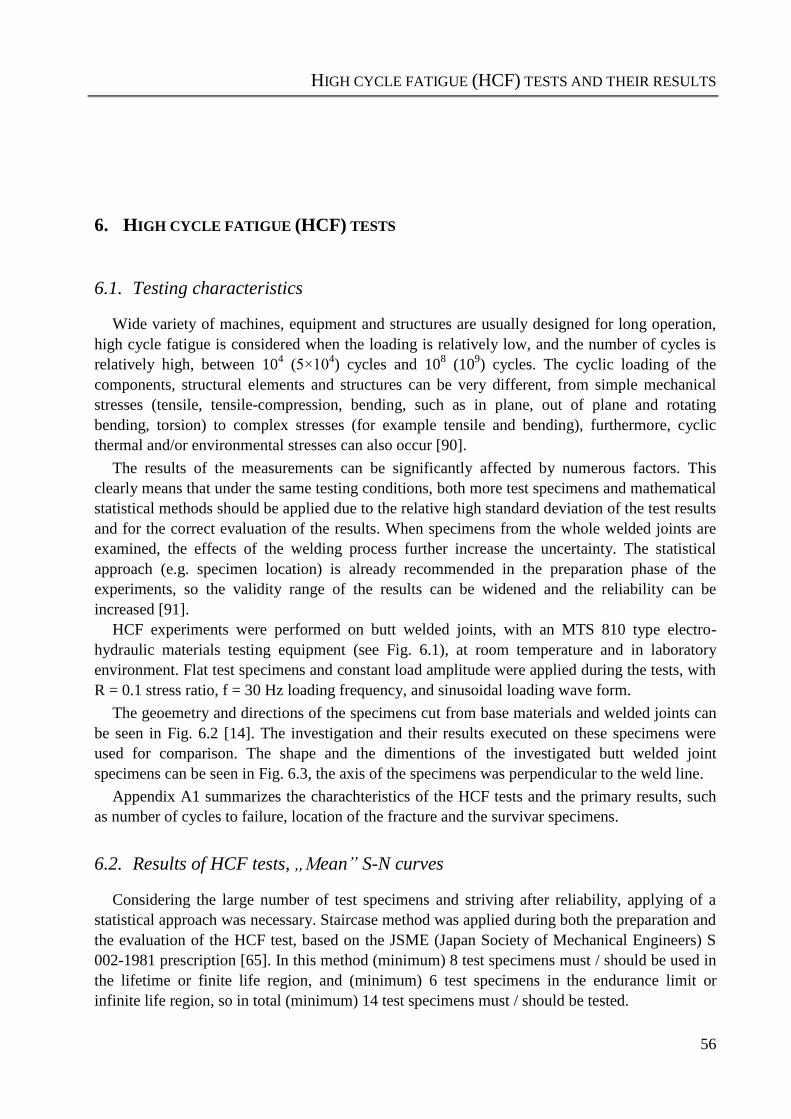
HIGH CYCLE FATIGUE (HCF) TESTS AND THEIR RESULTS
56
6. HIGH CYCLE FATIGUE (HCF) TESTS
6.1. Testing characteristics
Wide variety of machines, equipment and structures are usually designed for long operation,
high cycle fatigue is considered when the loading is relatively low, and the number of cycles is
relatively high, between 104 (5×10
4) cycles and 10
8 (10
9) cycles. The cyclic loading of the
components, structural elements and structures can be very different, from simple mechanical
stresses (tensile, tensile-compression, bending, such as in plane, out of plane and rotating
bending, torsion) to complex stresses (for example tensile and bending), furthermore, cyclic
thermal and/or environmental stresses can also occur [90].
The results of the measurements can be significantly affected by numerous factors. This
clearly means that under the same testing conditions, both more test specimens and mathematical
statistical methods should be applied due to the relative high standard deviation of the test results
and for the correct evaluation of the results. When specimens from the whole welded joints are
examined, the effects of the welding process further increase the uncertainty. The statistical
approach (e.g. specimen location) is already recommended in the preparation phase of the
experiments, so the validity range of the results can be widened and the reliability can be
increased [91].
HCF experiments were performed on butt welded joints, with an MTS 810 type electro-
hydraulic materials testing equipment (see Fig. 6.1), at room temperature and in laboratory
environment. Flat test specimens and constant load amplitude were applied during the tests, with
R = 0.1 stress ratio, f = 30 Hz loading frequency, and sinusoidal loading wave form.
The geoemetry and directions of the specimens cut from base materials and welded joints can
be seen in Fig. 6.2 [14]. The investigation and their results executed on these specimens were
used for comparison. The shape and the dimentions of the investigated butt welded joint
specimens can be seen in Fig. 6.3, the axis of the specimens was perpendicular to the weld line.
Appendix A1 summarizes the charachteristics of the HCF tests and the primary results, such
as number of cycles to failure, location of the fracture and the survivar specimens.
6.2. Results of HCF tests, „Mean” S-N curves
Considering the large number of test specimens and striving after reliability, applying of a
statistical approach was necessary. Staircase method was applied during both the preparation and
the evaluation of the HCF test, based on the JSME (Japan Society of Mechanical Engineers) S
002-1981 prescription [65]. In this method (minimum) 8 test specimens must / should be used in
the lifetime or finite life region, and (minimum) 6 test specimens in the endurance limit or
infinite life region, so in total (minimum) 14 test specimens must / should be tested.
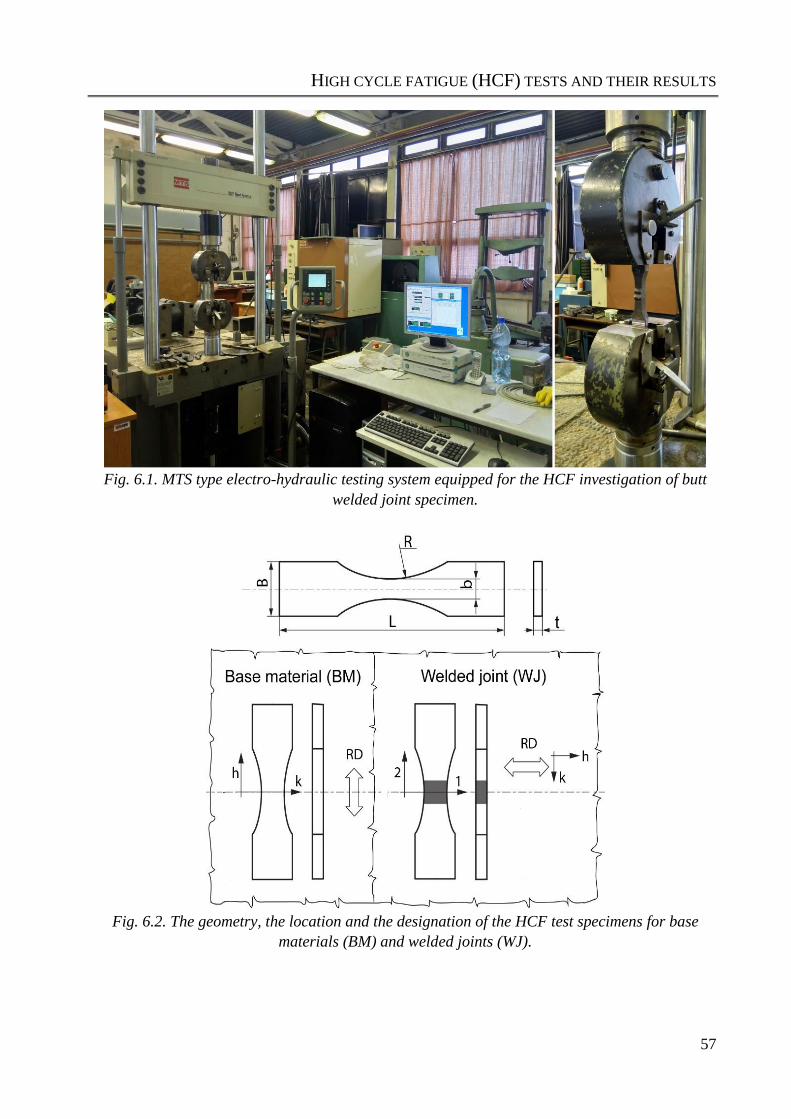
HIGH CYCLE FATIGUE (HCF) TESTS AND THEIR RESULTS
57
Fig. 6.1. MTS type electro-hydraulic testing system equipped for the HCF investigation of butt
welded joint specimen.
Fig. 6.2. The geometry, the location and the designation of the HCF test specimens for base
materials (BM) and welded joints (WJ).
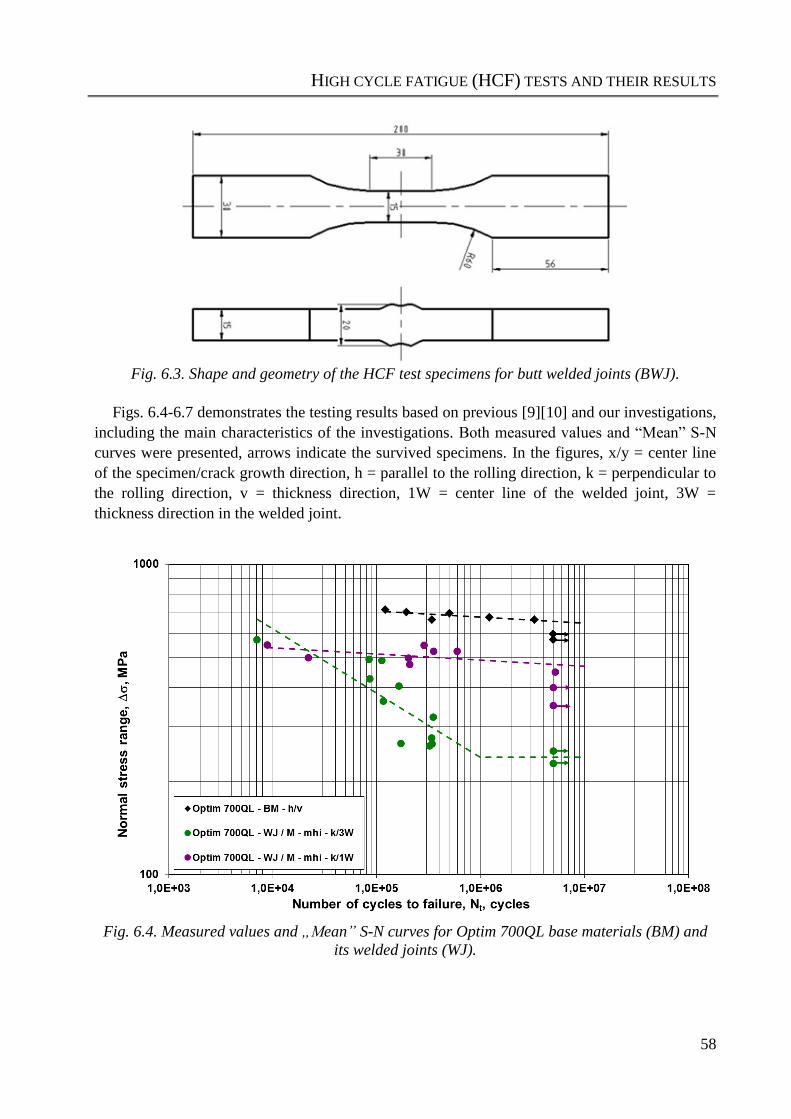
HIGH CYCLE FATIGUE (HCF) TESTS AND THEIR RESULTS
58
Fig. 6.3. Shape and geometry of the HCF test specimens for butt welded joints (BWJ).
Figs. 6.4-6.7 demonstrates the testing results based on previous [9][10] and our investigations,
including the main characteristics of the investigations. Both measured values and “Mean” S-N
curves were presented, arrows indicate the survived specimens. In the figures, x/y = center line
of the specimen/crack growth direction, h = parallel to the rolling direction, k = perpendicular to
the rolling direction, v = thickness direction, 1W = center line of the welded joint, 3W =
thickness direction in the welded joint.
Fig. 6.4. Measured values and „Mean” S-N curves for Optim 700QL base materials (BM) and
its welded joints (WJ).
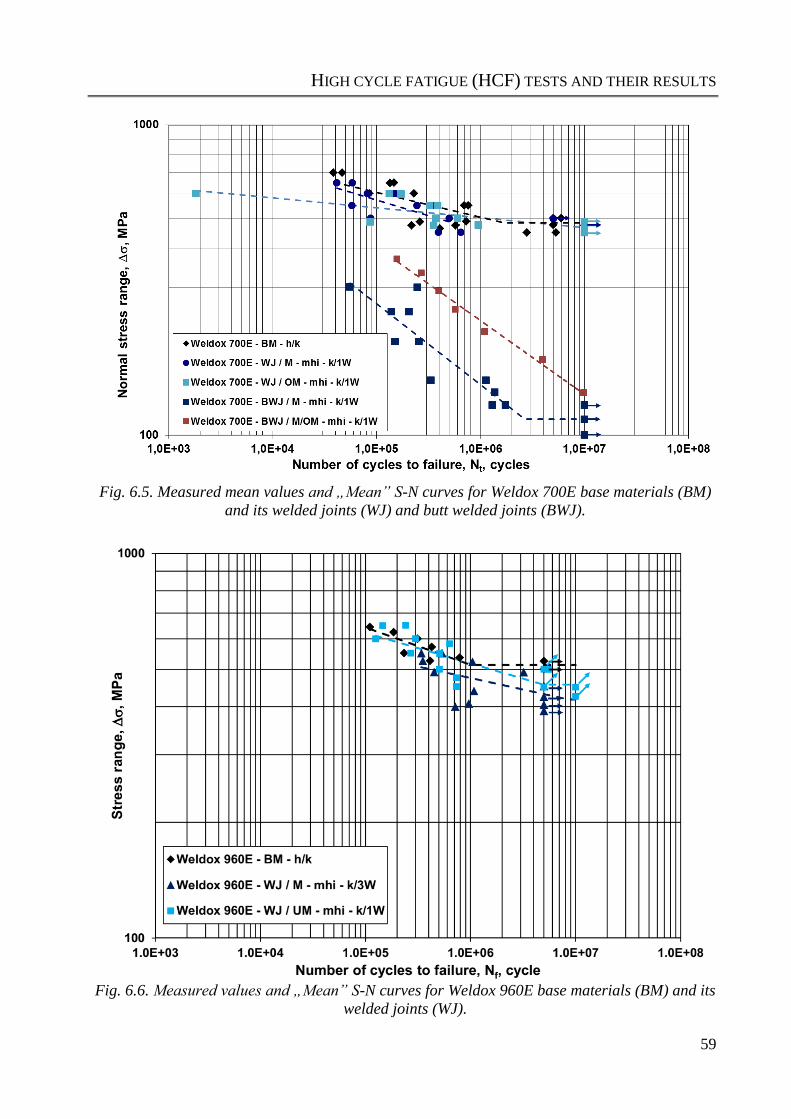
HIGH CYCLE FATIGUE (HCF) TESTS AND THEIR RESULTS
59
Fig. 6.5. Measured mean values and „Mean” S-N curves for Weldox 700E base materials (BM)
and its welded joints (WJ) and butt welded joints (BWJ).
Fig. 6.6. Measured values and „Mean” S-N curves for Weldox 960E base materials (BM) and its
welded joints (WJ).
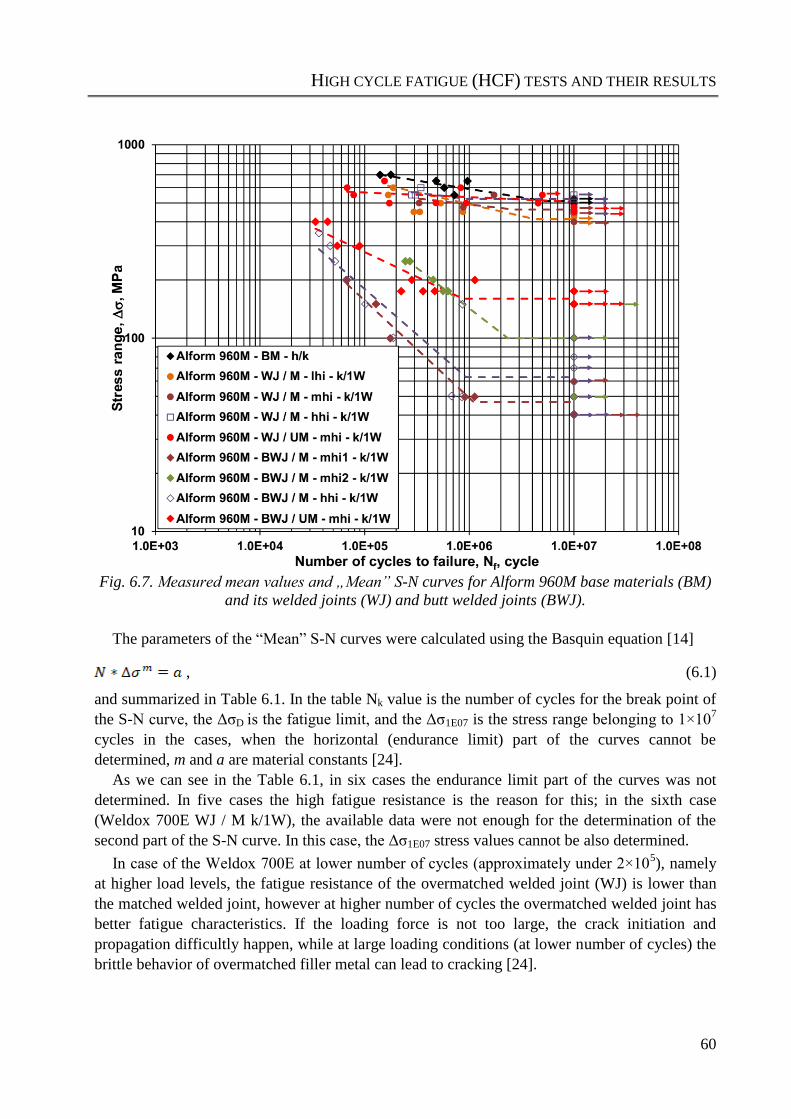
HIGH CYCLE FATIGUE (HCF) TESTS AND THEIR RESULTS
60
Fig. 6.7. Measured mean values and „Mean” S-N curves for Alform 960M base materials (BM)
and its welded joints (WJ) and butt welded joints (BWJ).
The parameters of the “Mean” S-N curves were calculated using the Basquin equation [14]
, (6.1)
and summarized in Table 6.1. In the table Nk value is the number of cycles for the break point of
the S-N curve, the ΔσD is the fatigue limit, and the Δσ1E07 is the stress range belonging to 1×10⁷
cycles in the cases, when the horizontal (endurance limit) part of the curves cannot be
determined, m and a are material constants [24].
As we can see in the Table 6.1, in six cases the endurance limit part of the curves was not
determined. In five cases the high fatigue resistance is the reason for this; in the sixth case
(Weldox 700E WJ / M k/1W), the available data were not enough for the determination of the
second part of the S-N curve. In this case, the Δσ1E07 stress values cannot be also determined.
In case of the Weldox 700E at lower number of cycles (approximately under 2×10⁵), namely
at higher load levels, the fatigue resistance of the overmatched welded joint (WJ) is lower than
the matched welded joint, however at higher number of cycles the overmatched welded joint has
better fatigue characteristics. If the loading force is not too large, the crack initiation and
propagation difficultly happen, while at large loading conditions (at lower number of cycles) the
brittle behavior of overmatched filler metal can lead to cracking [24].
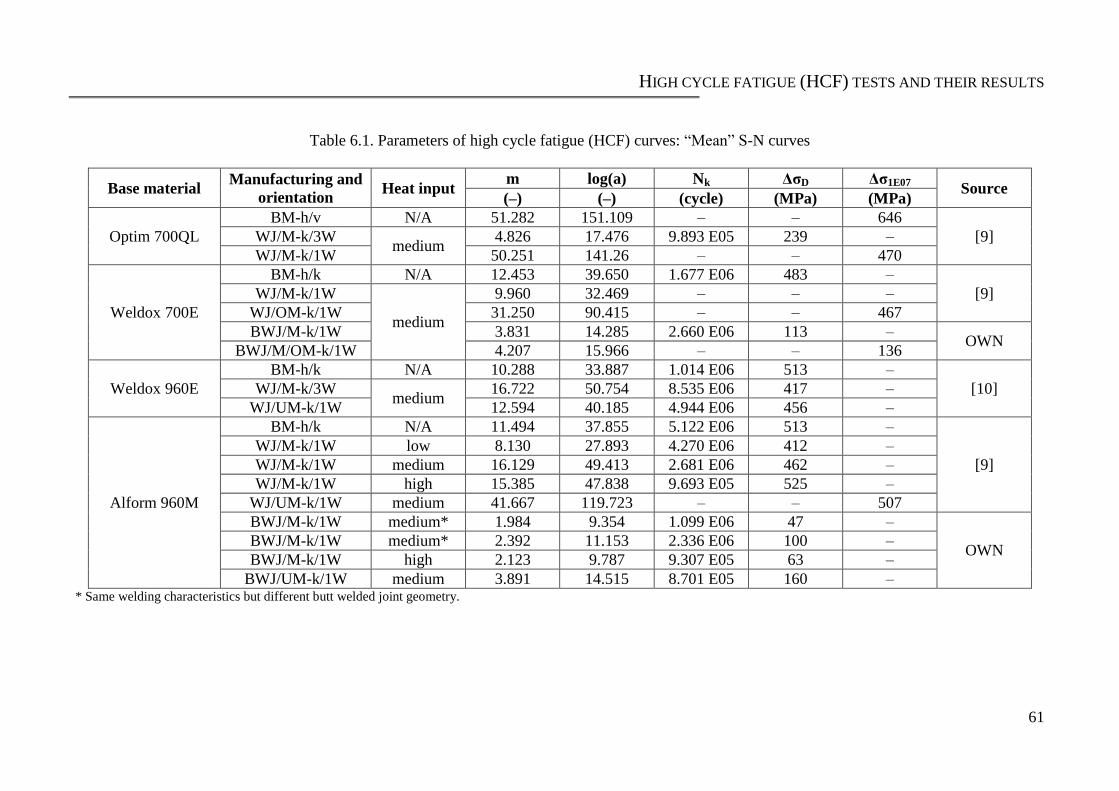
HIGH CYCLE FATIGUE (HCF) TESTS AND THEIR RESULTS
61
Table 6.1. Parameters of high cycle fatigue (HCF) curves: “Mean” S-N curves
Base material Manufacturing and
orientation Heat input
m log(a) Nk ΔσD Δσ1E07 Source
(–) (–) (cycle) (MPa) (MPa)
Optim 700QL
BM-h/v N/A 51.282 151.109 – – 646
[9] WJ/M-k/3W medium
4.826 17.476 9.893 E05 239 –
WJ/M-k/1W 50.251 141.26 – – 470
Weldox 700E
BM-h/k N/A 12.453 39.650 1.677 E06 483 –
[9] WJ/M-k/1W
medium
9.960 32.469 – – –
WJ/OM-k/1W 31.250 90.415 – – 467
BWJ/M-k/1W 3.831 14.285 2.660 E06 113 – OWN
BWJ/M/OM-k/1W 4.207 15.966 – – 136
Weldox 960E
BM-h/k N/A 10.288 33.887 1.014 E06 513 –
[10] WJ/M-k/3W medium
16.722 50.754 8.535 E06 417 –
WJ/UM-k/1W 12.594 40.185 4.944 E06 456 –
Alform 960M
BM-h/k N/A 11.494 37.855 5.122 E06 513 –
[9]
WJ/M-k/1W low 8.130 27.893 4.270 E06 412 –
WJ/M-k/1W medium 16.129 49.413 2.681 E06 462 –
WJ/M-k/1W high 15.385 47.838 9.693 E05 525 –
WJ/UM-k/1W medium 41.667 119.723 – – 507
BWJ/M-k/1W medium* 1.984 9.354 1.099 E06 47 –
OWN BWJ/M-k/1W medium* 2.392 11.153 2.336 E06 100 –
BWJ/M-k/1W high 2.123 9.787 9.307 E05 63 –
BWJ/UM-k/1W medium 3.891 14.515 8.701 E05 160 – * Same welding characteristics but different butt welded joint geometry.
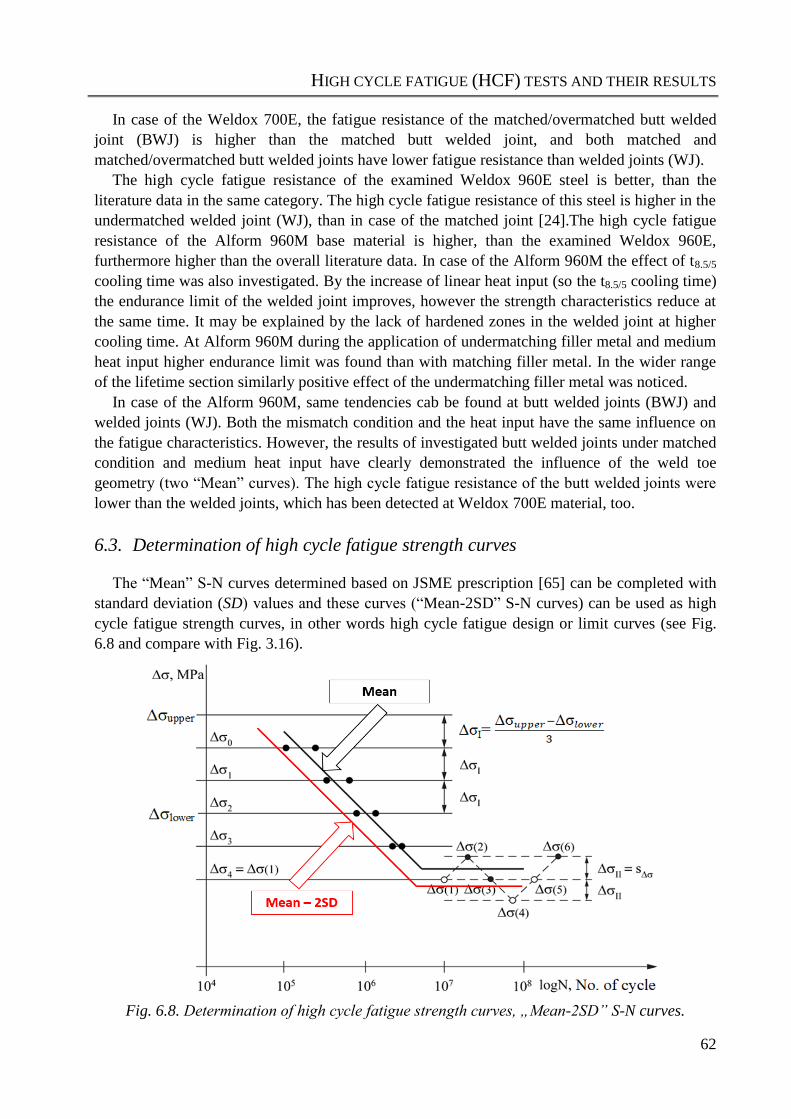
HIGH CYCLE FATIGUE (HCF) TESTS AND THEIR RESULTS
62
In case of the Weldox 700E, the fatigue resistance of the matched/overmatched butt welded
joint (BWJ) is higher than the matched butt welded joint, and both matched and
matched/overmatched butt welded joints have lower fatigue resistance than welded joints (WJ).
The high cycle fatigue resistance of the examined Weldox 960E steel is better, than the
literature data in the same category. The high cycle fatigue resistance of this steel is higher in the
undermatched welded joint (WJ), than in case of the matched joint [24].The high cycle fatigue
resistance of the Alform 960M base material is higher, than the examined Weldox 960E,
furthermore higher than the overall literature data. In case of the Alform 960M the effect of t8.5/5
cooling time was also investigated. By the increase of linear heat input (so the t8.5/5 cooling time)
the endurance limit of the welded joint improves, however the strength characteristics reduce at
the same time. It may be explained by the lack of hardened zones in the welded joint at higher
cooling time. At Alform 960M during the application of undermatching filler metal and medium
heat input higher endurance limit was found than with matching filler metal. In the wider range
of the lifetime section similarly positive effect of the undermatching filler metal was noticed.
In case of the Alform 960M, same tendencies cab be found at butt welded joints (BWJ) and
welded joints (WJ). Both the mismatch condition and the heat input have the same influence on
the fatigue characteristics. However, the results of investigated butt welded joints under matched
condition and medium heat input have clearly demonstrated the influence of the weld toe
geometry (two “Mean” curves). The high cycle fatigue resistance of the butt welded joints were
lower than the welded joints, which has been detected at Weldox 700E material, too.
6.3. Determination of high cycle fatigue strength curves
The “Mean” S-N curves determined based on JSME prescription [65] can be completed with
standard deviation (SD) values and these curves (“Mean-2SD” S-N curves) can be used as high
cycle fatigue strength curves, in other words high cycle fatigue design or limit curves (see Fig.
6.8 and compare with Fig. 3.16).
Fig. 6.8. Determination of high cycle fatigue strength curves, „Mean-2SD” S-N curves.
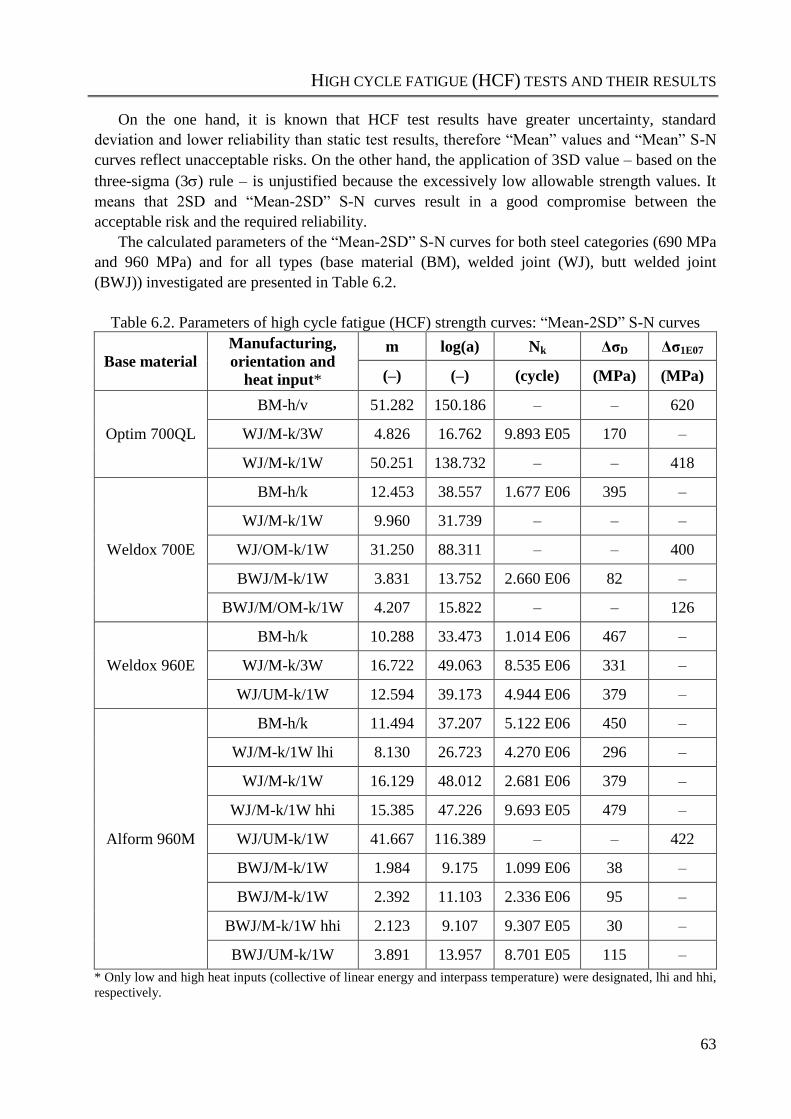
HIGH CYCLE FATIGUE (HCF) TESTS AND THEIR RESULTS
63
On the one hand, it is known that HCF test results have greater uncertainty, standard
deviation and lower reliability than static test results, therefore “Mean” values and “Mean” S-N
curves reflect unacceptable risks. On the other hand, the application of 3SD value – based on the
three-sigma (3) rule – is unjustified because the excessively low allowable strength values. It
means that 2SD and “Mean-2SD” S-N curves result in a good compromise between the
acceptable risk and the required reliability.
The calculated parameters of the “Mean-2SD” S-N curves for both steel categories (690 MPa
and 960 MPa) and for all types (base material (BM), welded joint (WJ), butt welded joint
(BWJ)) investigated are presented in Table 6.2.
Table 6.2. Parameters of high cycle fatigue (HCF) strength curves: “Mean-2SD” S-N curves
Base material
Manufacturing,
orientation and
heat input*
m log(a) Nk ΔσD Δσ1E07
(–) (–) (cycle) (MPa) (MPa)
Optim 700QL
BM-h/v 51.282 150.186 – – 620
WJ/M-k/3W 4.826 16.762 9.893 E05 170 –
WJ/M-k/1W 50.251 138.732 – – 418
Weldox 700E
BM-h/k 12.453 38.557 1.677 E06 395 –
WJ/M-k/1W 9.960 31.739 – – –
WJ/OM-k/1W 31.250 88.311 – – 400
BWJ/M-k/1W 3.831 13.752 2.660 E06 82 –
BWJ/M/OM-k/1W 4.207 15.822 – – 126
Weldox 960E
BM-h/k 10.288 33.473 1.014 E06 467 –
WJ/M-k/3W 16.722 49.063 8.535 E06 331 –
WJ/UM-k/1W 12.594 39.173 4.944 E06 379 –
Alform 960M
BM-h/k 11.494 37.207 5.122 E06 450 –
WJ/M-k/1W lhi 8.130 26.723 4.270 E06 296 –
WJ/M-k/1W 16.129 48.012 2.681 E06 379 –
WJ/M-k/1W hhi 15.385 47.226 9.693 E05 479 –
WJ/UM-k/1W 41.667 116.389 – – 422
BWJ/M-k/1W 1.984 9.175 1.099 E06 38 –
BWJ/M-k/1W 2.392 11.103 2.336 E06 95 –
BWJ/M-k/1W hhi 2.123 9.107 9.307 E05 30 –
BWJ/UM-k/1W 3.891 13.957 8.701 E05 115 –
* Only low and high heat inputs (collective of linear energy and interpass temperature) were designated, lhi and hhi,
respectively.
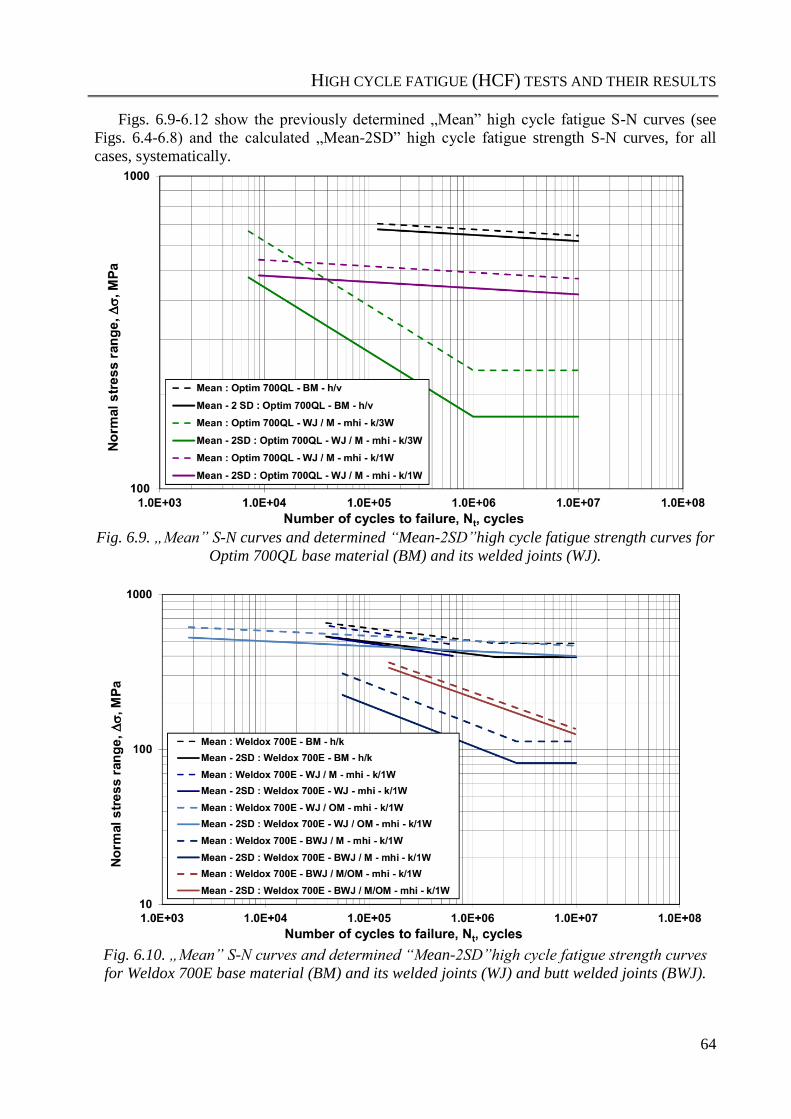
HIGH CYCLE FATIGUE (HCF) TESTS AND THEIR RESULTS
64
Figs. 6.9-6.12 show the previously determined „Mean” high cycle fatigue S-N curves (see
Figs. 6.4-6.8) and the calculated „Mean-2SD” high cycle fatigue strength S-N curves, for all
cases, systematically.
Fig. 6.9. „Mean” S-N curves and determined “Mean-2SD”high cycle fatigue strength curves for
Optim 700QL base material (BM) and its welded joints (WJ).
Fig. 6.10. „Mean” S-N curves and determined “Mean-2SD”high cycle fatigue strength curves
for Weldox 700E base material (BM) and its welded joints (WJ) and butt welded joints (BWJ).
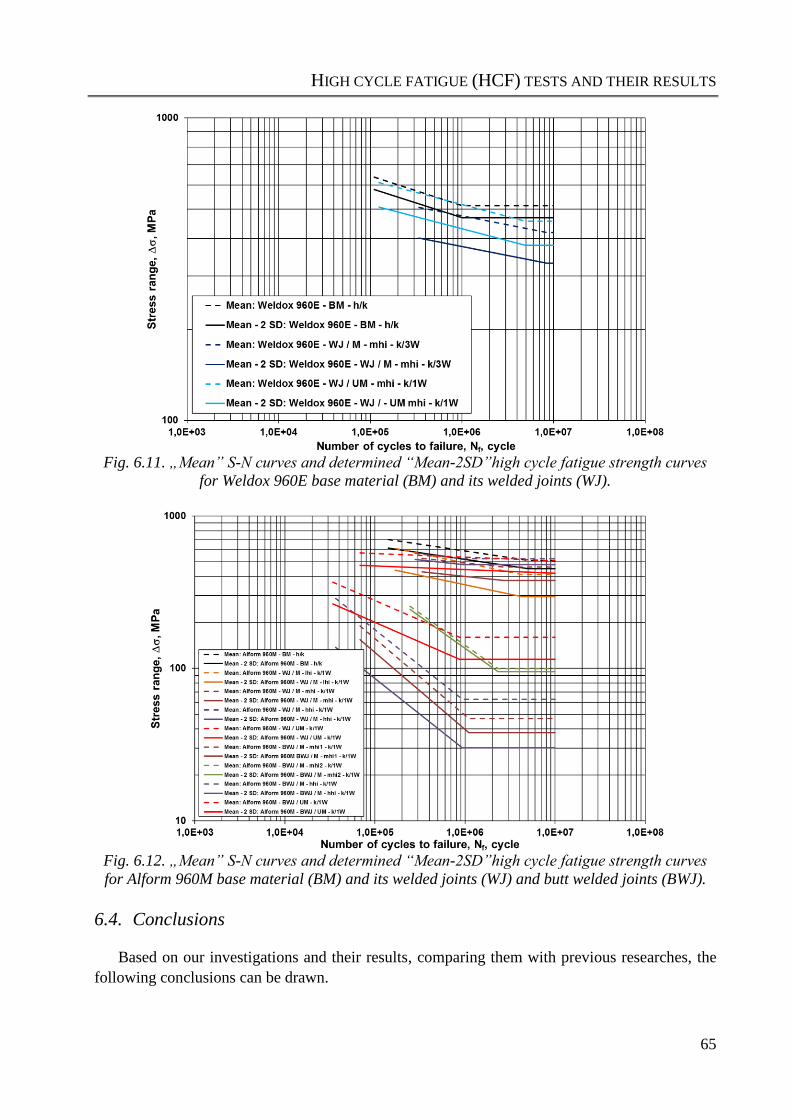
HIGH CYCLE FATIGUE (HCF) TESTS AND THEIR RESULTS
65
Fig. 6.11. „Mean” S-N curves and determined “Mean-2SD”high cycle fatigue strength curves
for Weldox 960E base material (BM) and its welded joints (WJ).
Fig. 6.12. „Mean” S-N curves and determined “Mean-2SD”high cycle fatigue strength curves
for Alform 960M base material (BM) and its welded joints (WJ) and butt welded joints (BWJ).
6.4. Conclusions
Based on our investigations and their results, comparing them with previous researches, the
following conclusions can be drawn.
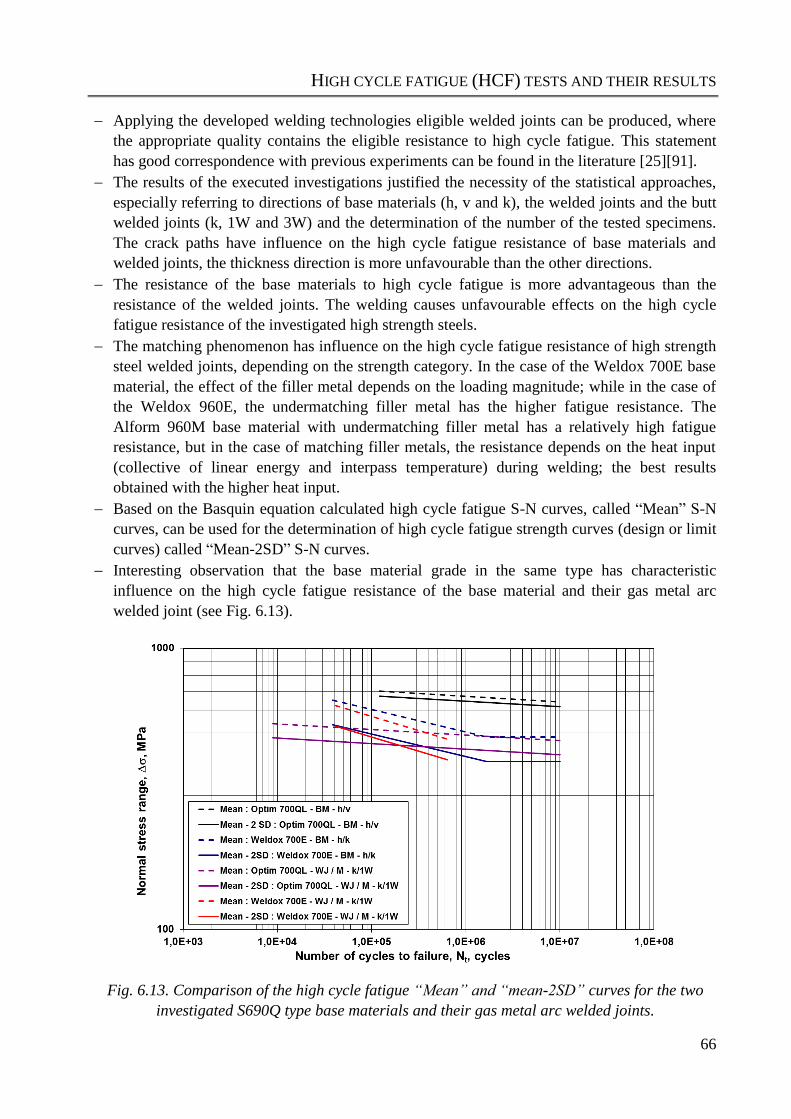
HIGH CYCLE FATIGUE (HCF) TESTS AND THEIR RESULTS
66
Applying the developed welding technologies eligible welded joints can be produced, where
the appropriate quality contains the eligible resistance to high cycle fatigue. This statement
has good correspondence with previous experiments can be found in the literature [25][91].
The results of the executed investigations justified the necessity of the statistical approaches,
especially referring to directions of base materials (h, v and k), the welded joints and the butt
welded joints (k, 1W and 3W) and the determination of the number of the tested specimens.
The crack paths have influence on the high cycle fatigue resistance of base materials and
welded joints, the thickness direction is more unfavourable than the other directions.
The resistance of the base materials to high cycle fatigue is more advantageous than the
resistance of the welded joints. The welding causes unfavourable effects on the high cycle
fatigue resistance of the investigated high strength steels.
The matching phenomenon has influence on the high cycle fatigue resistance of high strength
steel welded joints, depending on the strength category. In the case of the Weldox 700E base
material, the effect of the filler metal depends on the loading magnitude; while in the case of
the Weldox 960E, the undermatching filler metal has the higher fatigue resistance. The
Alform 960M base material with undermatching filler metal has a relatively high fatigue
resistance, but in the case of matching filler metals, the resistance depends on the heat input
(collective of linear energy and interpass temperature) during welding; the best results
obtained with the higher heat input.
Based on the Basquin equation calculated high cycle fatigue S-N curves, called “Mean” S-N
curves, can be used for the determination of high cycle fatigue strength curves (design or limit
curves) called “Mean-2SD” S-N curves.
Interesting observation that the base material grade in the same type has characteristic
influence on the high cycle fatigue resistance of the base material and their gas metal arc
welded joint (see Fig. 6.13).
Fig. 6.13. Comparison of the high cycle fatigue “Mean” and “mean-2SD” curves for the two
investigated S690Q type base materials and their gas metal arc welded joints.
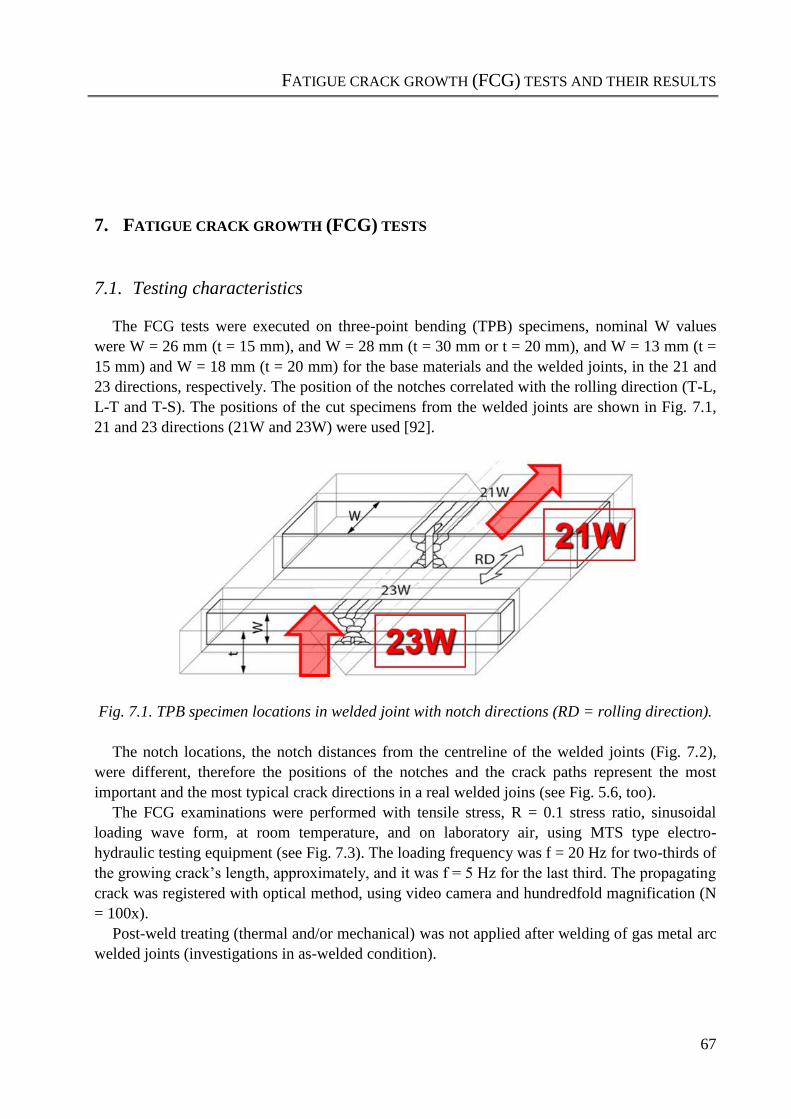
FATIGUE CRACK GROWTH (FCG) TESTS AND THEIR RESULTS
67
7. FATIGUE CRACK GROWTH (FCG) TESTS
7.1. Testing characteristics
The FCG tests were executed on three-point bending (TPB) specimens, nominal W values
were W = 26 mm (t = 15 mm), and W = 28 mm (t = 30 mm or t = 20 mm), and W = 13 mm (t =
15 mm) and W = 18 mm (t = 20 mm) for the base materials and the welded joints, in the 21 and
23 directions, respectively. The position of the notches correlated with the rolling direction (T-L,
L-T and T-S). The positions of the cut specimens from the welded joints are shown in Fig. 7.1,
21 and 23 directions (21W and 23W) were used [92].
Fig. 7.1. TPB specimen locations in welded joint with notch directions (RD = rolling direction).
The notch locations, the notch distances from the centreline of the welded joints (Fig. 7.2),
were different, therefore the positions of the notches and the crack paths represent the most
important and the most typical crack directions in a real welded joins (see Fig. 5.6, too).
The FCG examinations were performed with tensile stress, R = 0.1 stress ratio, sinusoidal
loading wave form, at room temperature, and on laboratory air, using MTS type electro-
hydraulic testing equipment (see Fig. 7.3). The loading frequency was f = 20 Hz for two-thirds of
the growing crack’s length, approximately, and it was f = 5 Hz for the last third. The propagating
crack was registered with optical method, using video camera and hundredfold magnification (N
= 100x).
Post-weld treating (thermal and/or mechanical) was not applied after welding of gas metal arc
welded joints (investigations in as-welded condition).
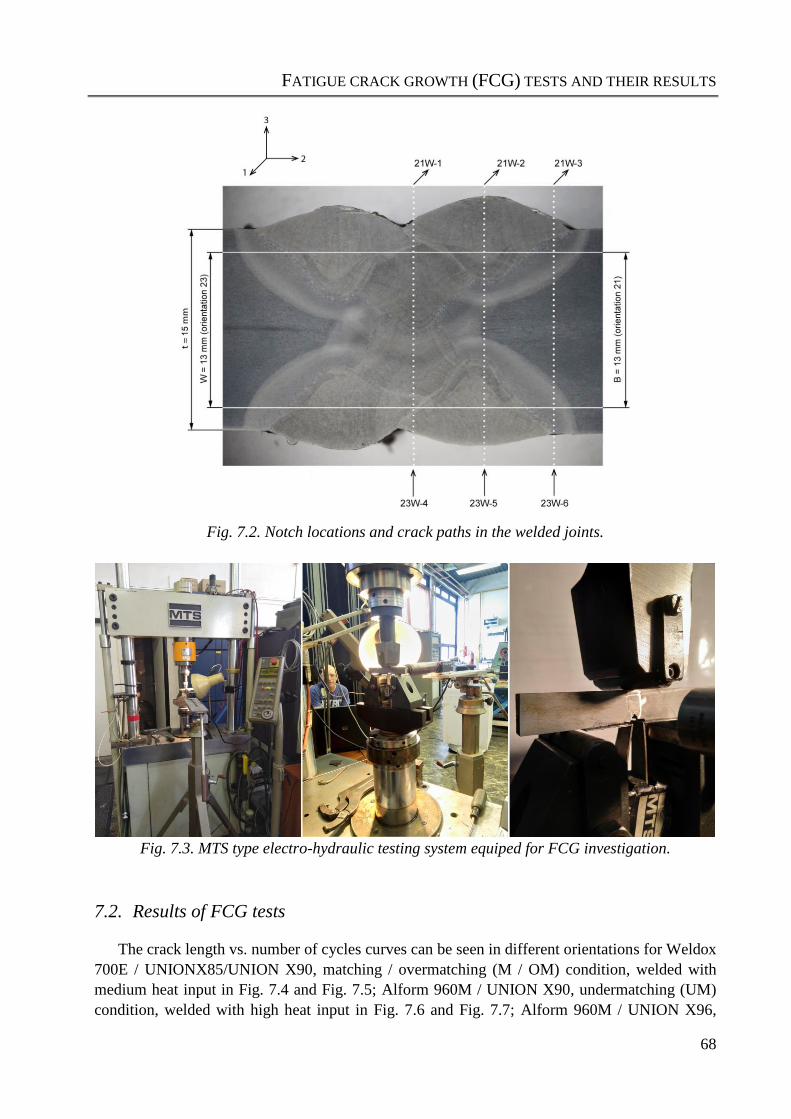
FATIGUE CRACK GROWTH (FCG) TESTS AND THEIR RESULTS
68
Fig. 7.2. Notch locations and crack paths in the welded joints.
Fig. 7.3. MTS type electro-hydraulic testing system equiped for FCG investigation.
7.2. Results of FCG tests
The crack length vs. number of cycles curves can be seen in different orientations for Weldox
700E / UNIONX85/UNION X90, matching / overmatching (M / OM) condition, welded with
medium heat input in Fig. 7.4 and Fig. 7.5; Alform 960M / UNION X90, undermatching (UM)
condition, welded with high heat input in Fig. 7.6 and Fig. 7.7; Alform 960M / UNION X96,
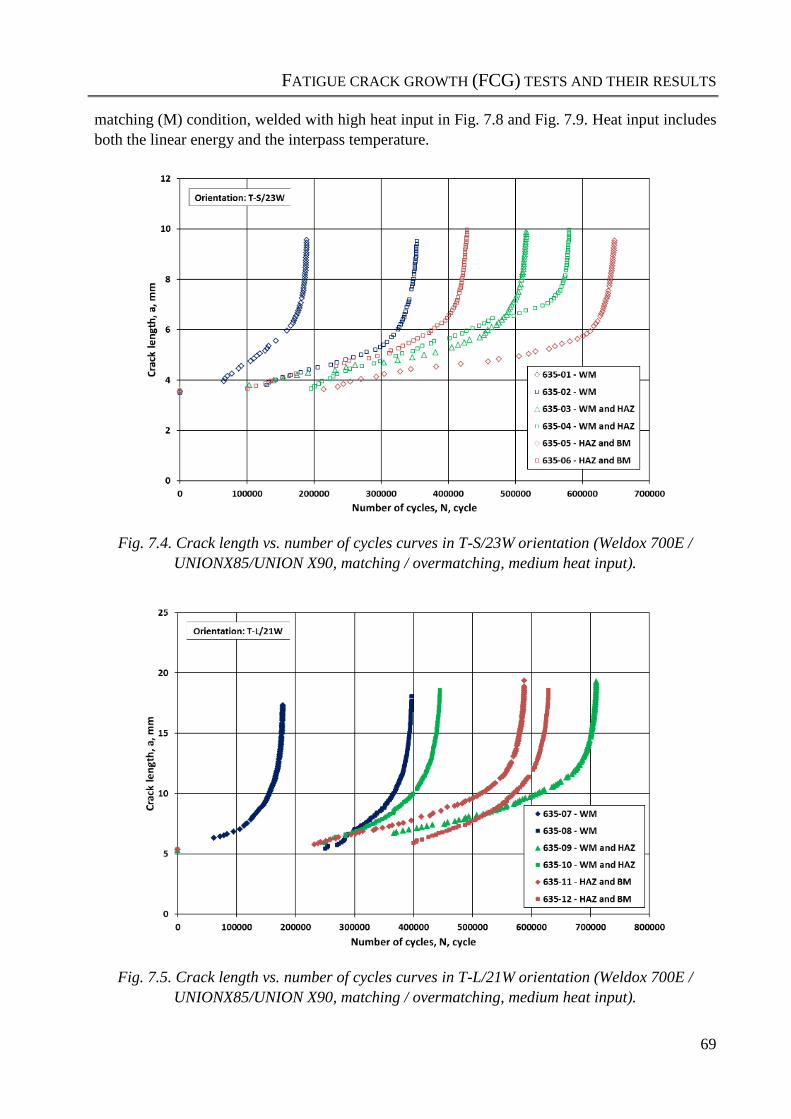
FATIGUE CRACK GROWTH (FCG) TESTS AND THEIR RESULTS
69
matching (M) condition, welded with high heat input in Fig. 7.8 and Fig. 7.9. Heat input includes
both the linear energy and the interpass temperature.
Fig. 7.4. Crack length vs. number of cycles curves in T-S/23W orientation (Weldox 700E /
UNIONX85/UNION X90, matching / overmatching, medium heat input).
Fig. 7.5. Crack length vs. number of cycles curves in T-L/21W orientation (Weldox 700E /
UNIONX85/UNION X90, matching / overmatching, medium heat input).
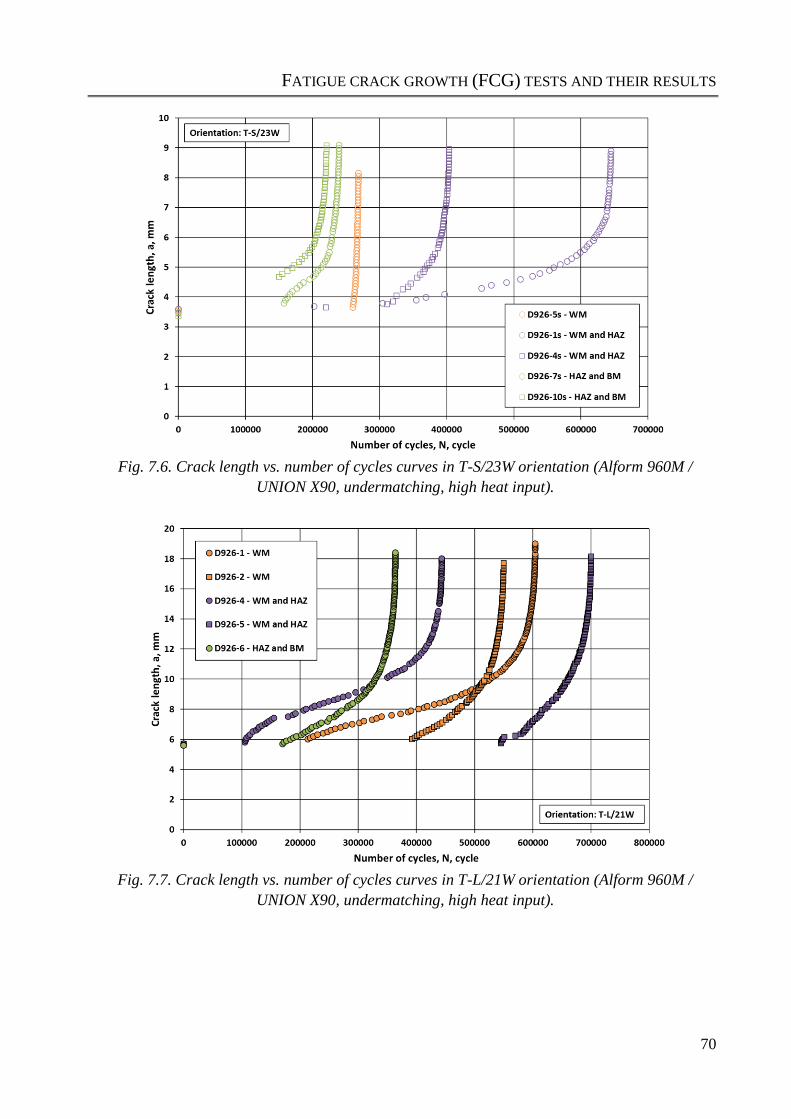
FATIGUE CRACK GROWTH (FCG) TESTS AND THEIR RESULTS
70
Fig. 7.6. Crack length vs. number of cycles curves in T-S/23W orientation (Alform 960M /
UNION X90, undermatching, high heat input).
Fig. 7.7. Crack length vs. number of cycles curves in T-L/21W orientation (Alform 960M /
UNION X90, undermatching, high heat input).
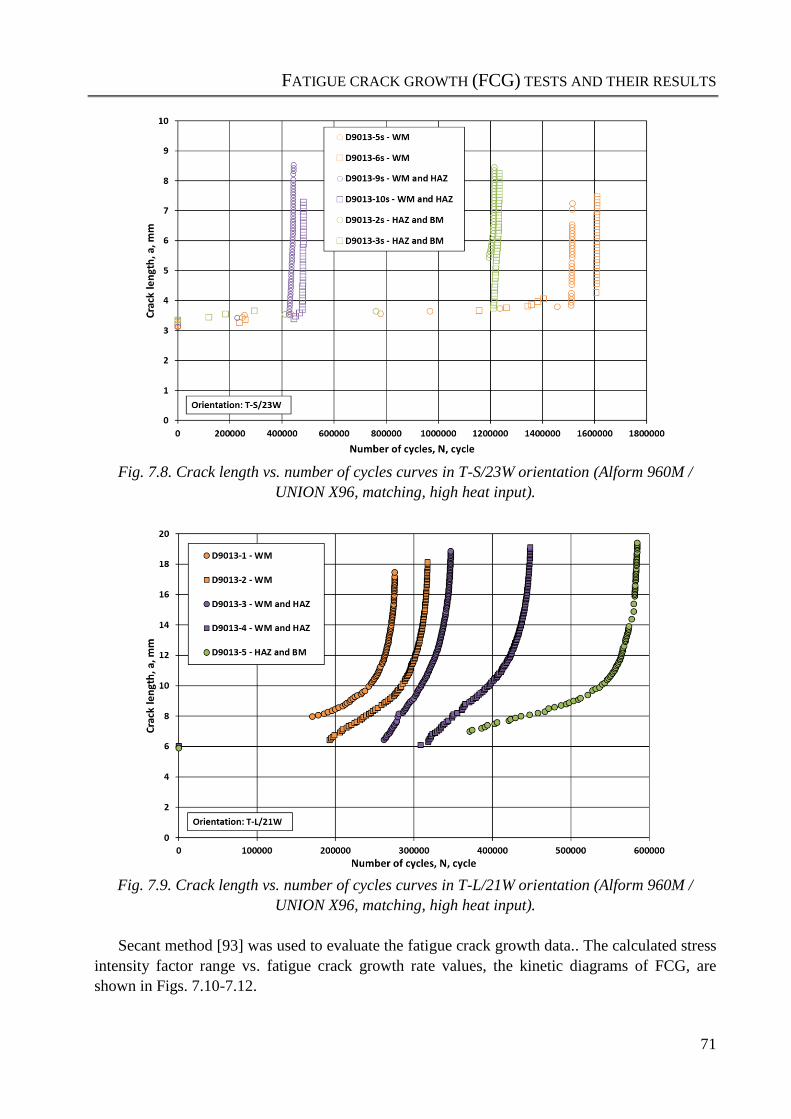
FATIGUE CRACK GROWTH (FCG) TESTS AND THEIR RESULTS
71
Fig. 7.8. Crack length vs. number of cycles curves in T-S/23W orientation (Alform 960M /
UNION X96, matching, high heat input).
Fig. 7.9. Crack length vs. number of cycles curves in T-L/21W orientation (Alform 960M /
UNION X96, matching, high heat input).
Secant method [93] was used to evaluate the fatigue crack growth data.. The calculated stress
intensity factor range vs. fatigue crack growth rate values, the kinetic diagrams of FCG, are
shown in Figs. 7.10-7.12.
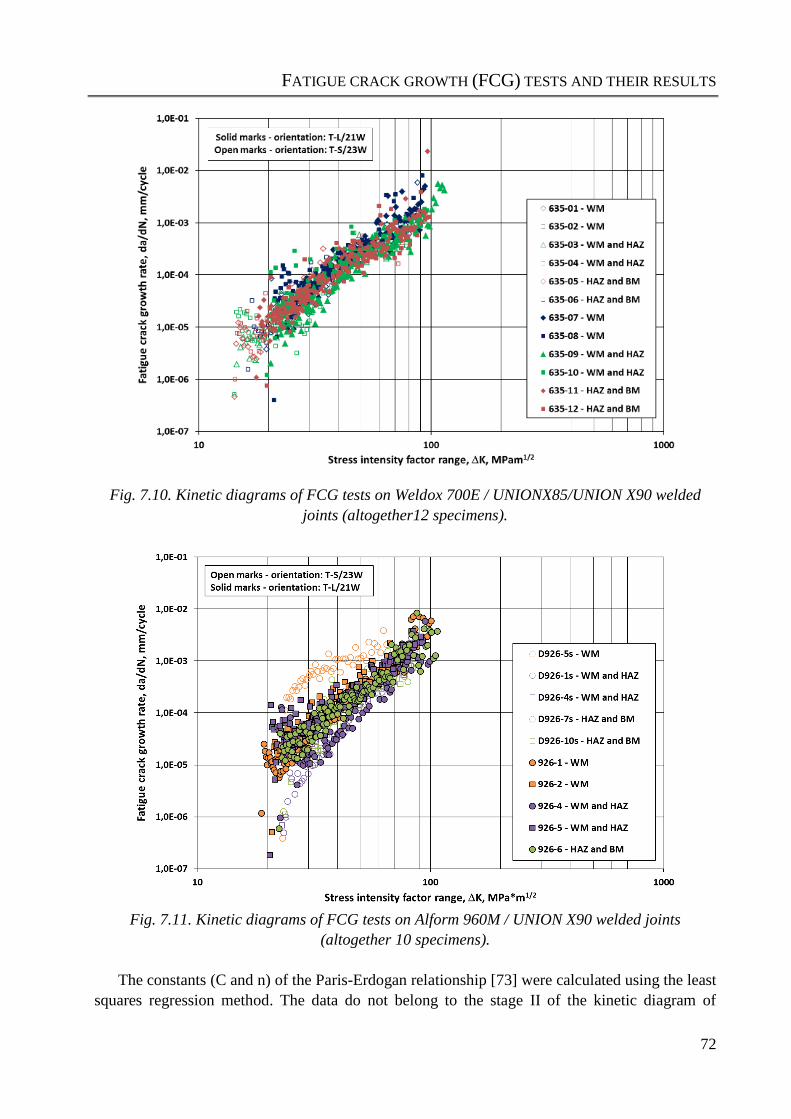
FATIGUE CRACK GROWTH (FCG) TESTS AND THEIR RESULTS
72
Fig. 7.10. Kinetic diagrams of FCG tests on Weldox 700E / UNIONX85/UNION X90 welded
joints (altogether12 specimens).
Fig. 7.11. Kinetic diagrams of FCG tests on Alform 960M / UNION X90 welded joints
(altogether 10 specimens).
The constants (C and n) of the Paris-Erdogan relationship [73] were calculated using the least
squares regression method. The data do not belong to the stage II of the kinetic diagram of
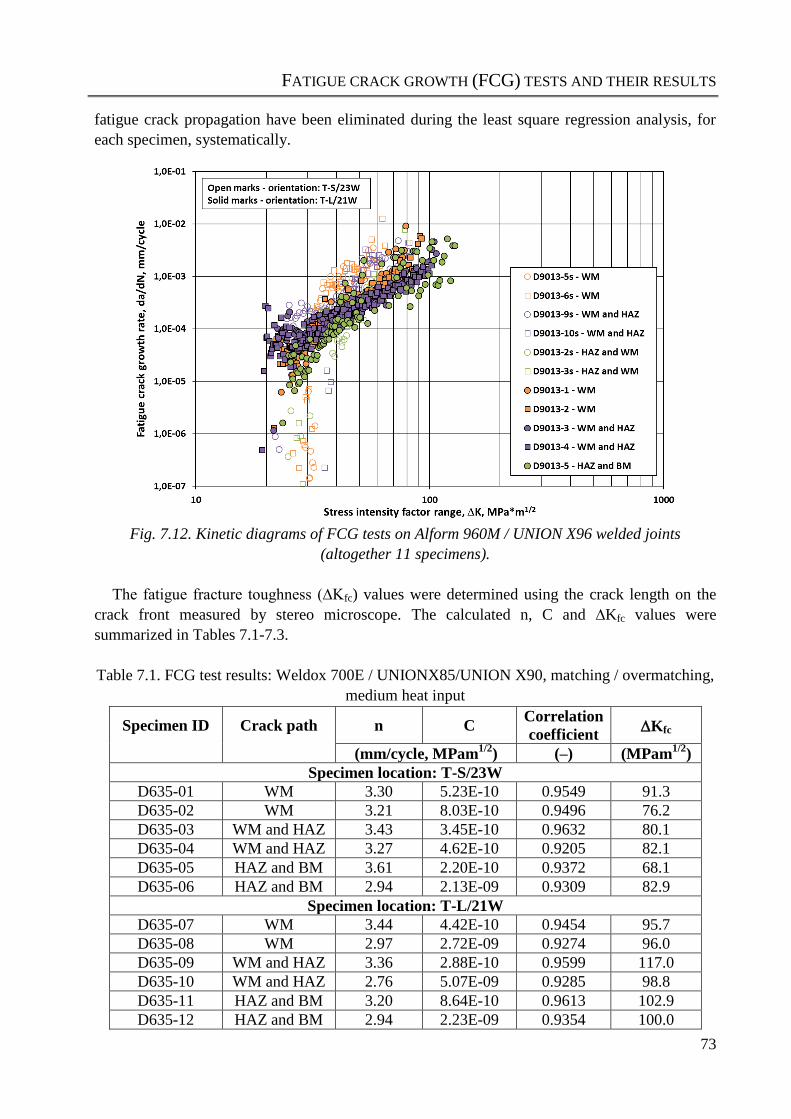
FATIGUE CRACK GROWTH (FCG) TESTS AND THEIR RESULTS
73
fatigue crack propagation have been eliminated during the least square regression analysis, for
each specimen, systematically.
Fig. 7.12. Kinetic diagrams of FCG tests on Alform 960M / UNION X96 welded joints
(altogether 11 specimens).
The fatigue fracture toughness (∆Kfc) values were determined using the crack length on the
crack front measured by stereo microscope. The calculated n, C and ∆Kfc values were
summarized in Tables 7.1-7.3.
Table 7.1. FCG test results: Weldox 700E / UNIONX85/UNION X90, matching / overmatching,
medium heat input
Specimen ID Crack path n C Correlation
coefficient Kfc
(mm/cycle, MPam1/2
) (–) (MPam1/2
)
Specimen location: T-S/23W
D635-01 WM 3.30 5.23E-10 0.9549 91.3
D635-02 WM 3.21 8.03E-10 0.9496 76.2
D635-03 WM and HAZ 3.43 3.45E-10 0.9632 80.1
D635-04 WM and HAZ 3.27 4.62E-10 0.9205 82.1
D635-05 HAZ and BM 3.61 2.20E-10 0.9372 68.1
D635-06 HAZ and BM 2.94 2.13E-09 0.9309 82.9
Specimen location: T-L/21W
D635-07 WM 3.44 4.42E-10 0.9454 95.7
D635-08 WM 2.97 2.72E-09 0.9274 96.0
D635-09 WM and HAZ 3.36 2.88E-10 0.9599 117.0
D635-10 WM and HAZ 2.76 5.07E-09 0.9285 98.8
D635-11 HAZ and BM 3.20 8.64E-10 0.9613 102.9
D635-12 HAZ and BM 2.94 2.23E-09 0.9354 100.0
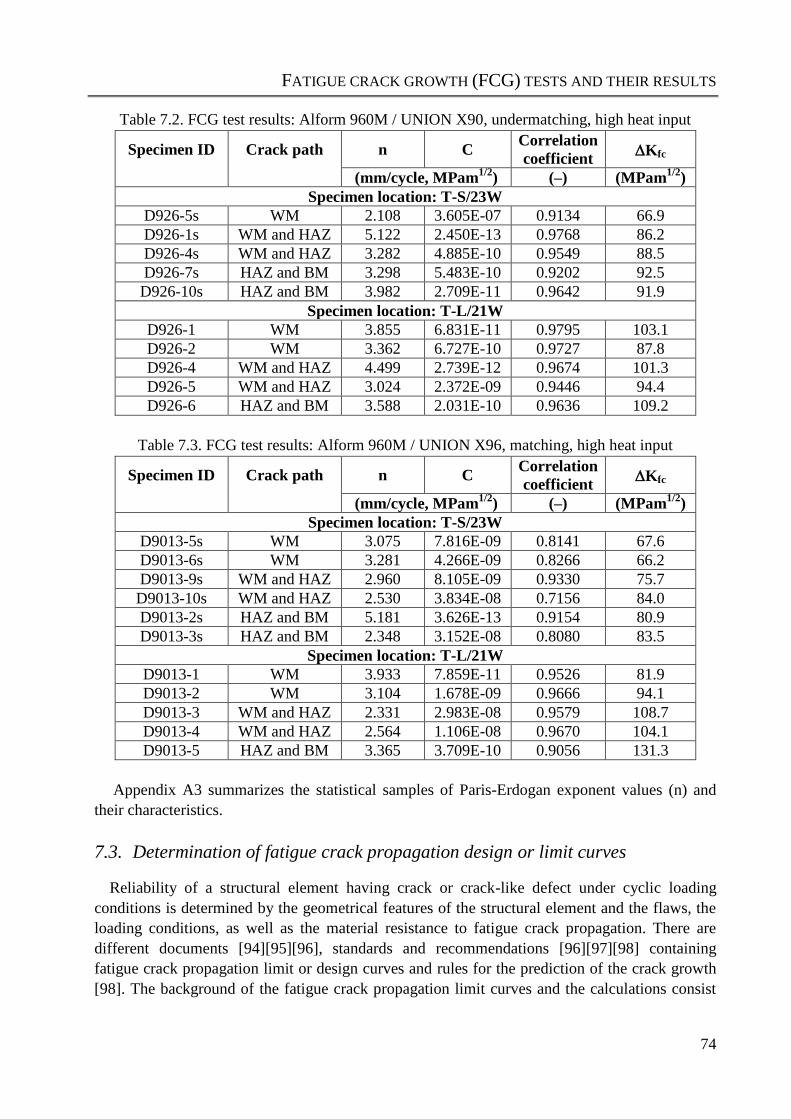
FATIGUE CRACK GROWTH (FCG) TESTS AND THEIR RESULTS
74
Table 7.2. FCG test results: Alform 960M / UNION X90, undermatching, high heat input
Specimen ID Crack path n C Correlation
coefficient Kfc
(mm/cycle, MPam1/2
) (–) (MPam1/2
)
Specimen location: T-S/23W
D926-5s WM 2.108 3.605E-07 0.9134 66.9
D926-1s WM and HAZ 5.122 2.450E-13 0.9768 86.2
D926-4s WM and HAZ 3.282 4.885E-10 0.9549 88.5
D926-7s HAZ and BM 3.298 5.483E-10 0.9202 92.5
D926-10s HAZ and BM 3.982 2.709E-11 0.9642 91.9
Specimen location: T-L/21W
D926-1 WM 3.855 6.831E-11 0.9795 103.1
D926-2 WM 3.362 6.727E-10 0.9727 87.8
D926-4 WM and HAZ 4.499 2.739E-12 0.9674 101.3
D926-5 WM and HAZ 3.024 2.372E-09 0.9446 94.4
D926-6 HAZ and BM 3.588 2.031E-10 0.9636 109.2
Table 7.3. FCG test results: Alform 960M / UNION X96, matching, high heat input
Specimen ID Crack path n C Correlation
coefficient Kfc
(mm/cycle, MPam1/2
) (–) (MPam1/2
)
Specimen location: T-S/23W
D9013-5s WM 3.075 7.816E-09 0.8141 67.6
D9013-6s WM 3.281 4.266E-09 0.8266 66.2
D9013-9s WM and HAZ 2.960 8.105E-09 0.9330 75.7
D9013-10s WM and HAZ 2.530 3.834E-08 0.7156 84.0
D9013-2s HAZ and BM 5.181 3.626E-13 0.9154 80.9
D9013-3s HAZ and BM 2.348 3.152E-08 0.8080 83.5
Specimen location: T-L/21W
D9013-1 WM 3.933 7.859E-11 0.9526 81.9
D9013-2 WM 3.104 1.678E-09 0.9666 94.1
D9013-3 WM and HAZ 2.331 2.983E-08 0.9579 108.7
D9013-4 WM and HAZ 2.564 1.106E-08 0.9670 104.1
D9013-5 HAZ and BM 3.365 3.709E-10 0.9056 131.3
Appendix A3 summarizes the statistical samples of Paris-Erdogan exponent values (n) and
their characteristics.
7.3. Determination of fatigue crack propagation design or limit curves
Reliability of a structural element having crack or crack-like defect under cyclic loading
conditions is determined by the geometrical features of the structural element and the flaws, the
loading conditions, as well as the material resistance to fatigue crack propagation. There are
different documents [94][95][96], standards and recommendations [96][97][98] containing
fatigue crack propagation limit or design curves and rules for the prediction of the crack growth
[98]. The background of the fatigue crack propagation limit curves and the calculations consist
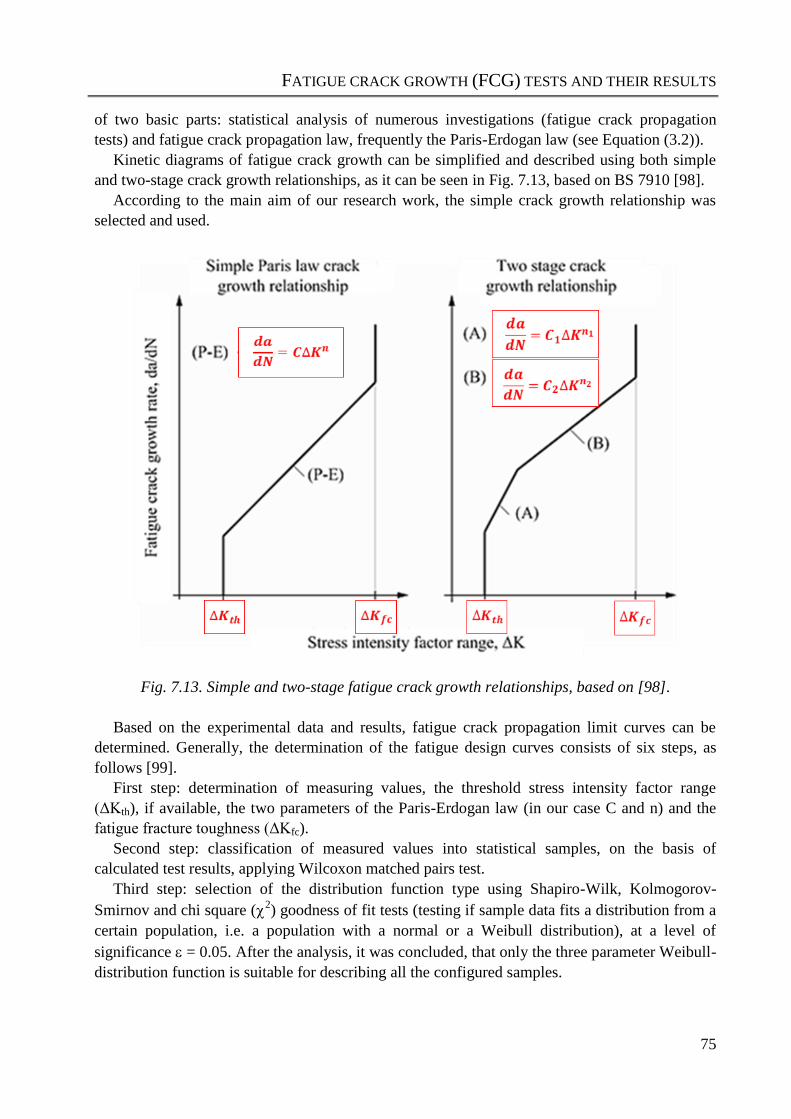
FATIGUE CRACK GROWTH (FCG) TESTS AND THEIR RESULTS
75
of two basic parts: statistical analysis of numerous investigations (fatigue crack propagation
tests) and fatigue crack propagation law, frequently the Paris-Erdogan law (see Equation (3.2)).
Kinetic diagrams of fatigue crack growth can be simplified and described using both simple
and two-stage crack growth relationships, as it can be seen in Fig. 7.13, based on BS 7910 [98].
According to the main aim of our research work, the simple crack growth relationship was
selected and used.
Fig. 7.13. Simple and two-stage fatigue crack growth relationships, based on [98].
Based on the experimental data and results, fatigue crack propagation limit curves can be
determined. Generally, the determination of the fatigue design curves consists of six steps, as
follows [99].
First step: determination of measuring values, the threshold stress intensity factor range
(ΔKth), if available, the two parameters of the Paris-Erdogan law (in our case C and n) and the
fatigue fracture toughness (ΔKfc).
Second step: classification of measured values into statistical samples, on the basis of
calculated test results, applying Wilcoxon matched pairs test.
Third step: selection of the distribution function type using Shapiro-Wilk, Kolmogorov-
Smirnov and chi square (2) goodness of fit tests (testing if sample data fits a distribution from a
certain population, i.e. a population with a normal or a Weibull distribution), at a level of
significance = 0.05. After the analysis, it was concluded, that only the three parameter Weibull-
distribution function is suitable for describing all the configured samples.
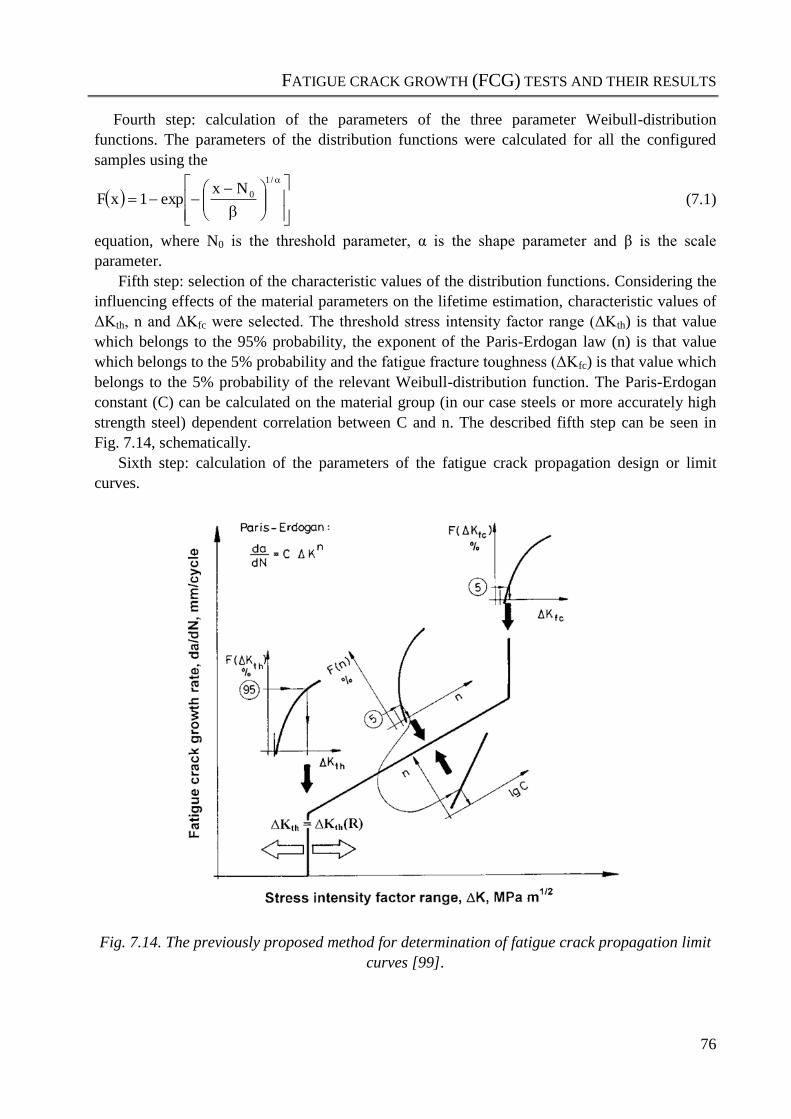
FATIGUE CRACK GROWTH (FCG) TESTS AND THEIR RESULTS
76
Fourth step: calculation of the parameters of the three parameter Weibull-distribution
functions. The parameters of the distribution functions were calculated for all the configured
samples using the
/1
0Nxexp1xF (7.1)
equation, where N0 is the threshold parameter, α is the shape parameter and β is the scale
parameter.
Fifth step: selection of the characteristic values of the distribution functions. Considering the
influencing effects of the material parameters on the lifetime estimation, characteristic values of
ΔKth, n and ΔKfc were selected. The threshold stress intensity factor range (ΔKth) is that value
which belongs to the 95% probability, the exponent of the Paris-Erdogan law (n) is that value
which belongs to the 5% probability and the fatigue fracture toughness (ΔKfc) is that value which
belongs to the 5% probability of the relevant Weibull-distribution function. The Paris-Erdogan
constant (C) can be calculated on the material group (in our case steels or more accurately high
strength steel) dependent correlation between C and n. The described fifth step can be seen in
Fig. 7.14, schematically.
Sixth step: calculation of the parameters of the fatigue crack propagation design or limit
curves.
Fig. 7.14. The previously proposed method for determination of fatigue crack propagation limit
curves [99].
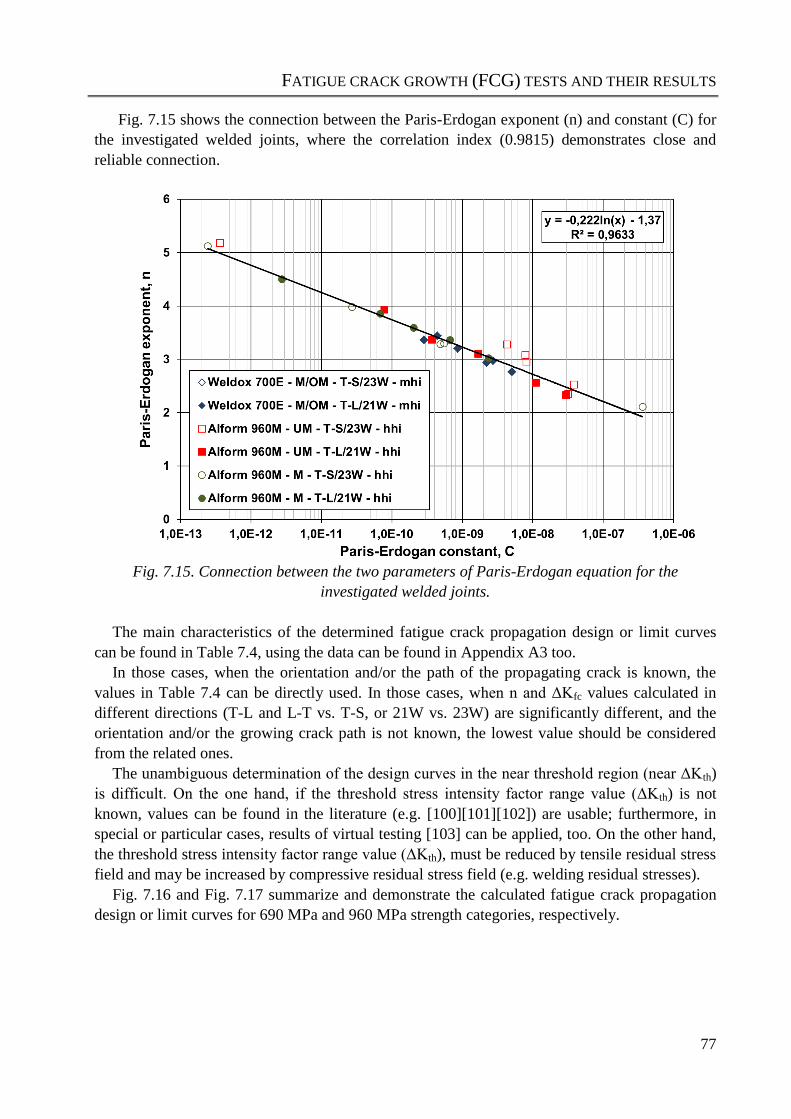
FATIGUE CRACK GROWTH (FCG) TESTS AND THEIR RESULTS
77
Fig. 7.15 shows the connection between the Paris-Erdogan exponent (n) and constant (C) for
the investigated welded joints, where the correlation index (0.9815) demonstrates close and
reliable connection.
Fig. 7.15. Connection between the two parameters of Paris-Erdogan equation for the
investigated welded joints.
The main characteristics of the determined fatigue crack propagation design or limit curves
can be found in Table 7.4, using the data can be found in Appendix A3 too.
In those cases, when the orientation and/or the path of the propagating crack is known, the
values in Table 7.4 can be directly used. In those cases, when n and ΔKfc values calculated in
different directions (T-L and L-T vs. T-S, or 21W vs. 23W) are significantly different, and the
orientation and/or the growing crack path is not known, the lowest value should be considered
from the related ones.
The unambiguous determination of the design curves in the near threshold region (near ΔKth)
is difficult. On the one hand, if the threshold stress intensity factor range value (ΔKth) is not
known, values can be found in the literature (e.g. [100][101][102]) are usable; furthermore, in
special or particular cases, results of virtual testing [103] can be applied, too. On the other hand,
the threshold stress intensity factor range value (ΔKth), must be reduced by tensile residual stress
field and may be increased by compressive residual stress field (e.g. welding residual stresses).
Fig. 7.16 and Fig. 7.17 summarize and demonstrate the calculated fatigue crack propagation
design or limit curves for 690 MPa and 960 MPa strength categories, respectively.
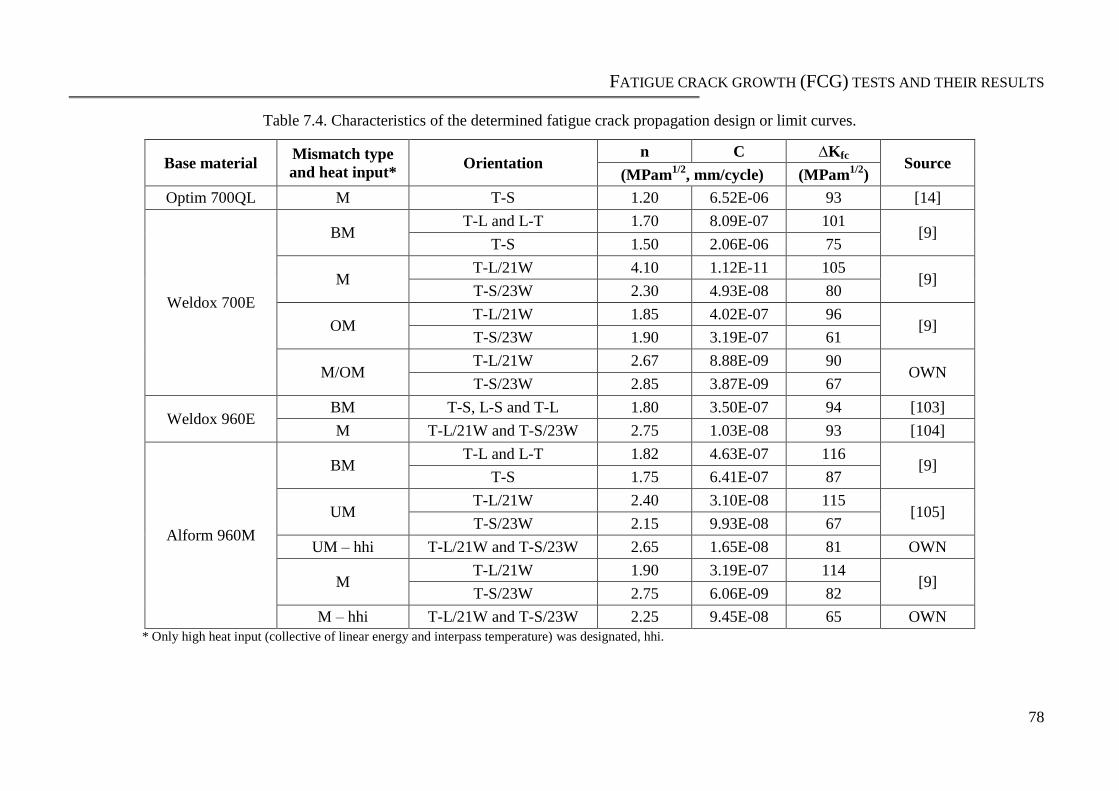
FATIGUE CRACK GROWTH (FCG) TESTS AND THEIR RESULTS
78
Table 7.4. Characteristics of the determined fatigue crack propagation design or limit curves.
Base material Mismatch type
and heat input* Orientation
n C ∆Kfc Source
(MPam1/2
, mm/cycle) (MPam1/2
)
Optim 700QL M T-S 1.20 6.52E-06 93 [14]
Weldox 700E
BM T-L and L-T 1.70 8.09E-07 101
[9] T-S 1.50 2.06E-06 75
M T-L/21W 4.10 1.12E-11 105
[9] T-S/23W 2.30 4.93E-08 80
OM T-L/21W 1.85 4.02E-07 96
[9] T-S/23W 1.90 3.19E-07 61
M/OM T-L/21W 2.67 8.88E-09 90
OWN T-S/23W 2.85 3.87E-09 67
Weldox 960E BM T-S, L-S and T-L 1.80 3.50E-07 94 [103]
M T-L/21W and T-S/23W 2.75 1.03E-08 93 [104]
Alform 960M
BM T-L and L-T 1.82 4.63E-07 116
[9] T-S 1.75 6.41E-07 87
UM T-L/21W 2.40 3.10E-08 115
[105] T-S/23W 2.15 9.93E-08 67
UM – hhi T-L/21W and T-S/23W 2.65 1.65E-08 81 OWN
M T-L/21W 1.90 3.19E-07 114
[9] T-S/23W 2.75 6.06E-09 82
M – hhi T-L/21W and T-S/23W 2.25 9.45E-08 65 OWN
* Only high heat input (collective of linear energy and interpass temperature) was designated, hhi.
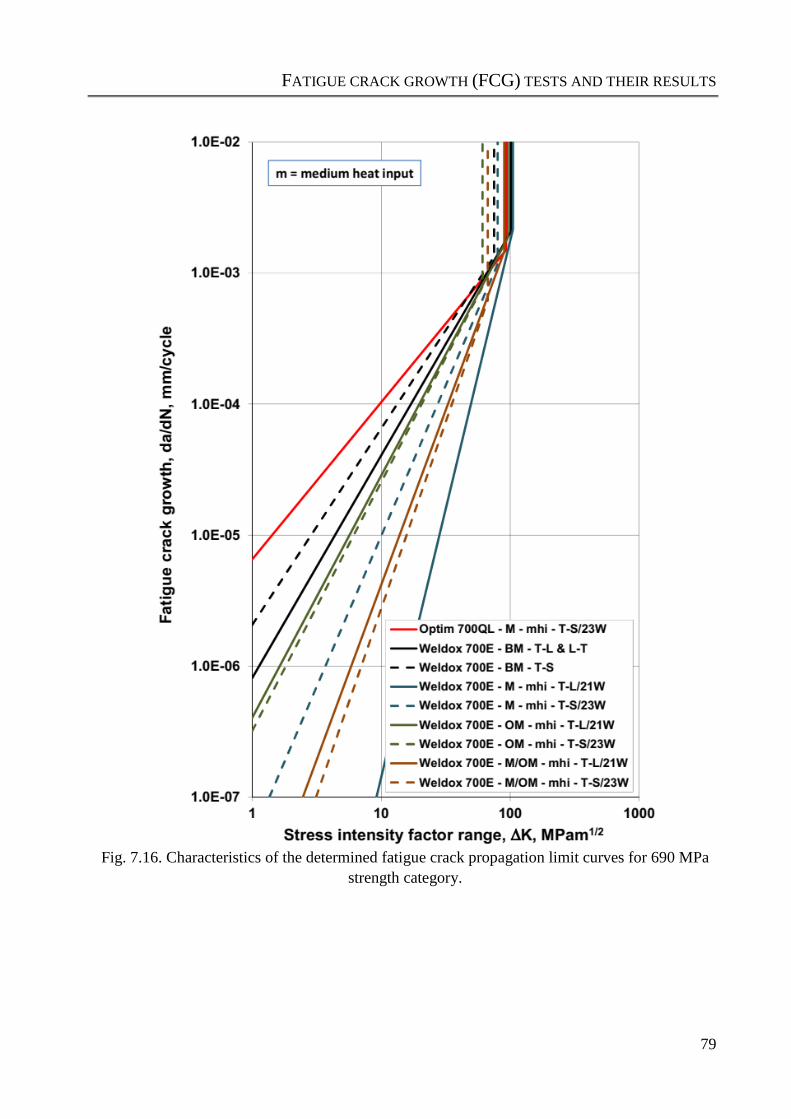
FATIGUE CRACK GROWTH (FCG) TESTS AND THEIR RESULTS
79
Fig. 7.16. Characteristics of the determined fatigue crack propagation limit curves for 690 MPa
strength category.
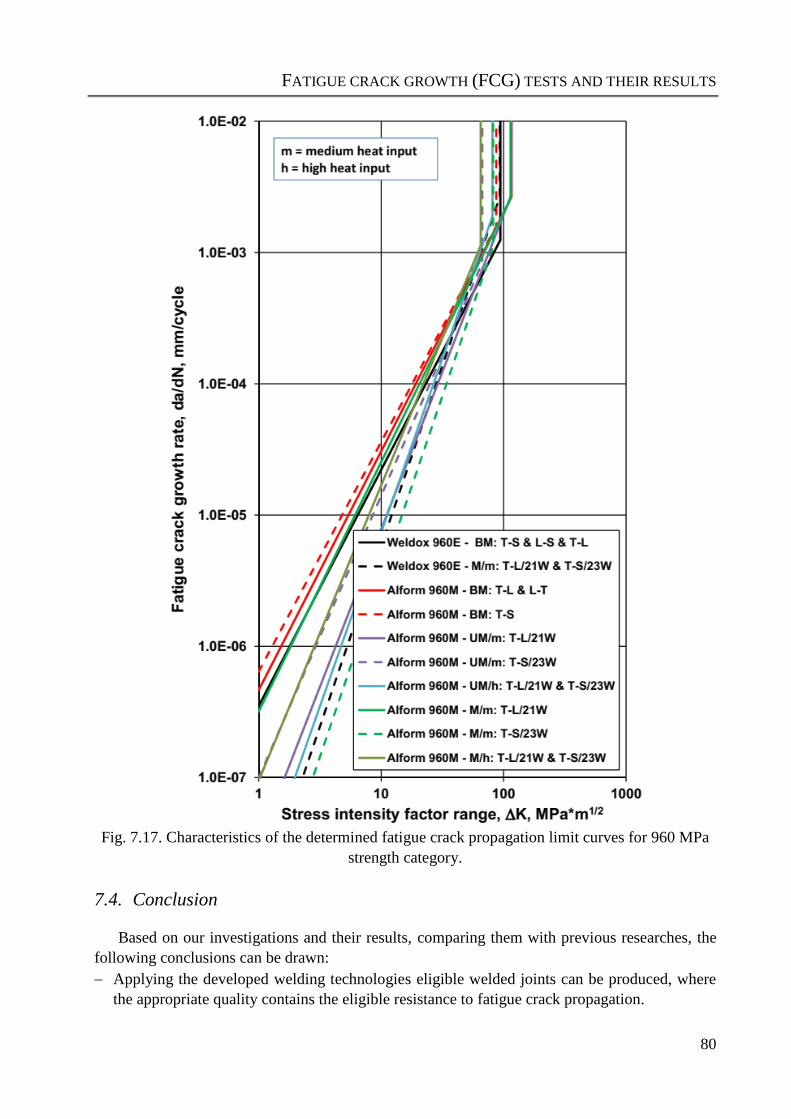
FATIGUE CRACK GROWTH (FCG) TESTS AND THEIR RESULTS
80
Fig. 7.17. Characteristics of the determined fatigue crack propagation limit curves for 960 MPa
strength category.
7.4. Conclusion
Based on our investigations and their results, comparing them with previous researches, the
following conclusions can be drawn:
Applying the developed welding technologies eligible welded joints can be produced, where
the appropriate quality contains the eligible resistance to fatigue crack propagation.
FATIGUE CRACK GROWTH (FCG) TESTS AND THEIR RESULTS
81
The results of the executed investigations justified the necessity of statistical approaches,
especially referring to the directions of the base materials (T-L, L-T, T-S and L-S) and the
welded joints (21W and 23W), and the determination of the number of the tested specimens.
The determined results fundamentally refer to reliable and reproducible examinations.
Unfortunately, the standard deviation coefficients are in some cases too high (Paris-Erdogan
exponent (n), T-S, 21W and 23W orientations).
The mismatch phenomenon (matching (M), undermatching (UM) and matching/overmatching
(M/OM)) has characteristic influence on the FCG resistance. The mismatch phenomenon has
different influence on various crack paths or crack propagation directions. The reliability of
the test results is different in case of different matching conditions.
The average values of the Paris-Erdogan exponents (n) of Weldox 700E and Alform 960M
base materials in the T-L and L-T directions and of the Weldox 960Q base material in the T-S
and L-S directions are significantly not different, which means equal fatigue crack growth
resistance in these orientations. The average values of the Paris-Erdogan exponent (n) of
Weldox 700E and Alform 960M base materials in T-S orientation and of Weldox 960Q base
material in the T-L orientation are significantly different. The fatigue crack growth resistance
of the Weldox 700E material is more unfavourable in T-S direction. The material strength
category (in our case 690 MPa or 960 MPa) and the production condition (in our case Q+T or
TM) cause significant effect on the fatigue crack growth resistance, too.
The average values of Paris-Erdogan exponents (n) of matching (M), overmatching (OM),
matching / overmatching (M/OM) and undermatching (UM) conditions of the investigated
welded joints were statistically higher than the exponents of the concerning base materials.
The average value of the Paris-Erdogan exponent (n) of the overmatching (OM) welded joint
of the Weldox 700E is lower than the exponent of both the matching (M) and the
matching/overmatching (M/OM) conditions. It means that the matching/overmatching
(M/OM) mismatch type is more beneficial than the overmatching (OM) type.
The average value of the Paris-Erdogan exponent (n) of the matching (M) welded joint of
Alform 960M is lower than exponent of the undermatching (UM) condition. The fatigue crack
growth resistance under matching (M) condition is lower than undermatching (UM)
condition.
The heat input (collective of linear energy and interpass temperature) has characteristic
influence on fatigue crack propagation resistance and the differences depend on the mismatch
condition, which can be seen for Alform 960M welded joints in Fig. 7.18.
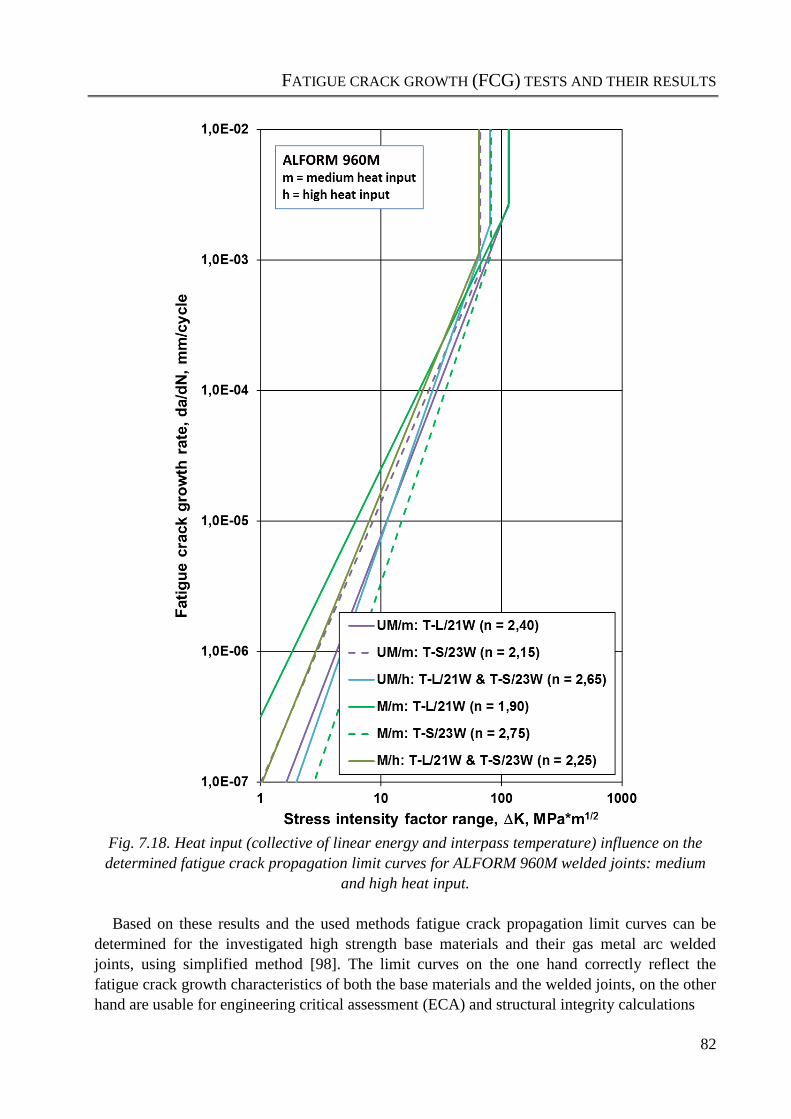
FATIGUE CRACK GROWTH (FCG) TESTS AND THEIR RESULTS
82
Fig. 7.18. Heat input (collective of linear energy and interpass temperature) influence on the
determined fatigue crack propagation limit curves for ALFORM 960M welded joints: medium
and high heat input.
Based on these results and the used methods fatigue crack propagation limit curves can be
determined for the investigated high strength base materials and their gas metal arc welded
joints, using simplified method [98]. The limit curves on the one hand correctly reflect the
fatigue crack growth characteristics of both the base materials and the welded joints, on the other
hand are usable for engineering critical assessment (ECA) and structural integrity calculations
THESES – NEW SCIENTIFIC RESULTS
83
8. THESES – NEW SCIENTIFIC RESULTS
T1. For reliable assessment of high cycle fatigue and fatigue crack growth resistance of high
strength steels and their welded joints statistical approaches must be used. On the one hand,
different crack paths and notch locations must be applied; on the other hand, sufficient
number of specimens must be tested in order the correct applications of evaluation methods.
I have proved this statement with executed and/or analysed high cycle fatigue and fatigue
crack growth tests. (2) (3) (7) (10) (11) and (9)
T2. Both the high cycle fatigue and the fatigue crack growth resistance of the investigated high
strength steels and their welded joints characteristically depend on the crack growth
directions; the thickness direction is more unfavourable than the other directions. I have
proved this statement with executed and/or analysed high cycle fatigue and fatigue crack
growth tests. (4) (6) (10) (12) and (9)
T3. The linear energy and the interpass temperature during the welding of the
thermomechanically rolled Alform 960M steel have collectively characteristic influence on
the high cycle fatigue resistance of butt welded joints and the fatigue crack growth
resistance of welded joints, which have to take into consideration during the specification of
welding technology. I have proved this statement with executed and/or analysed high cycle
fatigue and fatigue crack growth tests. (8) (10)
T4. With common application of the JSME investigation method resulting “Mean” S-N curves
and “-2SD” philosophy, “Mean-2SD” S-N curves can be calculated, which can be used as
high cycle fatigue strength curves. I have proved this statement with executed and/or
analysed high cycle fatigue tests and with calculated “Mean” and “Mean-2SD” S-N curves.
(7)
T5. The matching phenomenon has characteristic influence on the high cycle fatigue resistance
of both Weldox 700E and Alform 960M high strength steel butt welded joints, depending on
the strength category. In case of Weldox 700E the matching/overmatching (M/OM)
condition is better than matching (M), while in the case of the Alform 960M the
undermatching (UM) is better than matching (M). The statement justifies the specific role of
the 690 MPa strength category in the mismatch phenomenon. I have proved this statement
with executed and analysed high cycle fatigue tests. (2) (3) (4) (11)
T6. The mismatch phenomenon (matching (M), undermatching (UM), matching/overmatching
(M/OM) and overmatching (OM)) has characteristic influence on the fatigue crack growth
resistance of investigated high strength steel welded joints. The average values of Paris-
THESES – NEW SCIENTIFIC RESULTS
84
Erdogan exponents (n) of mismatch conditions of the investigated welded joints were
statistically higher (Weldox 700E, Alform 960M thickness direction) or lower (Alform
960M longitudinal and transversal direction) than the exponents of the concerning base
materials. I have proved this statement with executed and analysed fatigue crack growth
tests. (6) (7) (8) (10) (12) and (9)
T7. The average value of the Paris-Erdogan exponent (n) of the matching/overmatching (M/OM)
welded joint of Weldox 700E is lower than the exponent of both the overmatching (OM) and
the matching (M) conditions; the matching (M) mismatch type is more efficient than both
the overmatching (OM) and the matching/overmatching (M/OM) types. The average value
of Paris-Erdogan exponent (n) of the matching (M) welded joint of Alform 960M is lower
than the exponent of the undermatching (UM) condition and independent of the collective of
linear energy and interpass temperature; the undermatching (UM) mismatch type is more
efficient than the matching (M) type, independently of the collective of linear energy and
interpass temperature. The statement justifies the specific role of the 690 MPa strength
category in the mismatch phenomenon, too. I have proved this statement with executed
and/or analysed fatigue crack growth tests. (5) (6) (10)
SUMMARY
85
9. SUMMARY
The significant of the research work and the obtained results of the dissertation clarify that if
we go back to the previous century then we can recognize and realize huge problems of
applications and failures of the others and the most important is the big size of death of humans
because of these problems and failures. There are many examples of accidents was occurred
during the earlier period in many applications and in several countries (see section 3.1), but here
I would like to mention one of the famous of these is “Aloha Airlines Flight 243 - Aircraft
Accident” where the fatigue is 55% from total failure frequency of aircraft components. Due to
of these accidents many humans losing life and also injure other many of them, as well as losing
money from safety companies and manufacturing companies for these applications as well.
One of the important aims of this dissertation is how to develop a structure against fatigue
problem. In an accurate sentence, we realized that the significant role of structural steel in
manufacturing field and also during the previous study and literature survey we found limited
knowledge and results about the new version of high strength structural steel experiments.
The processes of joining technology are one of the important methods applied in structural
steel during their production and right now have many types. Since our work related with high
strength structural steel which is used now in many applications (see section 2.3) and as it was
mentioned earlier due to the knowledge limited and the necessity for new results of new types of
structural steels due to appear new higher strength categories of structural steels. There is still a
limited experiment in this field, and due to the required demand for new results of these new
versions of structural steel categories as well as manufacturing of these types of steels is costly
and the fatigue and then failure (God forbid!) is too complicated and tough because of the higher
production cost, thus one of our research work to covered and supplied new information and
results to support both of scientific research area and production field as well.
The two different categories of structural steels (690 MPa and 960 MPa) have different
characteristics (see Figs. 2.1 and 2.2), where the weldability and the behaviour under cyclic
loading conditions of quenched and tempered (Q+T) and thermomechanically rolled (TM) high
strength steels, applied in medium plate thickness, are different.
One issue are weldability questions, so it can be stated, that these steels required a complex
welding technology. The TM steels have favourable mechanical and toughness properties,
furthermore, the weldability is much easier than the Q+T steels, because of the microstructure
and the applied alloying elements (see Figs. 2.10 and 2.16). The other issue is a mismatching
condition, so we used different cases (overmatching / matching / undermatching / merge of both
matching/overmatching) because there are different characteristics of the investigated base
materials and their welded joints due to different strength categories of both base materials with
different mechanical properties of the filler materials that are available and approximately same
(or harmony) with base materials specification which was used to prepare welded joints samples.
Also, there are different heat input values, which were applied during welding aspect.
SUMMARY
86
According to this variety in characteristics of base materials strength categories, filler metals
properties and then different mismatching case of the welded joints as well as different heat input
applied during welding aspect, then obviously many different results obtained during many
investigations. Since the base materials and then welded joints what was cut by water jet from
whole samples were investigated to evaluate and assess the result of the investigations.
The statistical data of fracture damages of engineering structures is noteworthy: 59% during
high cycle fatigue (HCF) and fatigue crack growth (FCG) from all other types of failure in the
structures. Thus the importance of the investigation and evaluation is to describe, predicate and
recognise the results for the whole welded structure by investigating small specimens (before
applying in real structure i.e. mobile crane, shovel, excavators, ship, offshore and so on) to avoid
consuming time and reduce raw materials consumption and then cost reduction. Also, the
handling with specimens is easier than the whole structure in the fact not just because of the
small size of specimen just but also it easier to dominate on surrounding condition of the
experimental field for these specimens.
It was shown, that the HCF properties of the examined base materials are always succeeded in
the welded joints properties. In the case of lower cyclic numbers (under 2×10⁵ cycles) with
higher loading condition, the overmatching welded joints have worse fatigue properties than the
matching joints; while in case of higher cyclic numbers, the overmatching joints had the better
properties. So when the loading of the welding joint is not so high, the fatigue crack initiation
and propagation is more difficult, while in case of higher loading, the more brittle behaviour of
the overmatching filler metal is the determinant. In the case of Alform 960M base material, with
the increases of the heat input, the HCF limit is increased as well, while the mechanical
properties practically remained the same. One possible explanation for this is the grain size
changes; with the high heat input caused coarse grain microstructure the cracks can be
propagated with large difficulties, so the fatigue limit can be increased.
The FCG experiments show, that in the case of Weldox 700E and Alform 960M base
materials, the crack growth is significantly same in the L-T and T-L directions, but significantly
different in the T-S direction. In the case of the welded joints, the crack growths are significantly
different from the base materials, in both directions and all of the matching circumstances. The
FCG resistance of the welded joints is the same the examined 21W and 23W orientations, in
three cases, but the Alform 960M matching welded joint has different properties. The fatigue
fracture toughness value is smaller in the 23W direction, in all of the welded joints. The fatigue
fracture toughness value of the Weldox 700E welded joints is higher than the same of the base
material, while the Alform 960M welded joints value is lower than the base material. Overall, it
can be summarised, that the Weldox 700E matching welded joint has better FCG properties than
the overmatching joint, and the Alform 960M undermatching welded joints have better
properties than the matching joints, independently of the orientations.
Based on the measured, calculated and analysed results, both high cycle fatigue strength and
fatigue crack propagation design curves were developed for the investigated high strength steels
and their GMAW joints. The curves can be applied during the whole lifetime of cyclic loaded
structural elements and structures.
Finally, our obtained results were compared with other previous results and we have published
and it demonstrates more reliable, acceptable and satisfying and there are seven new scientific
results (see section 8) in this field, so these are justified the importance of many experiments
during the research to reach the higher quality results.
APPLICATION POSSIBILITIES OF THE RESULTS
87
10. APPLICATION POSSIBILITIES OF THE RESULTS
Nowadays, the reliability of a structural element or a structure is one of the most important, if
not the most important feature of the structural element or the structure itself. This is a
requirement on the one hand; on the other hand, this is a task for the structural and technological
designers, manufacturers, operators and maintainers of the structure. The regrettable accidents
always draw attention to this fact, and summary studies about these form global messages from
which all stakeholders can learn.
At the same time, the behaviour of HSSS differs fundamentally from that of conventional
steels, both as a result of manufacturing technologies and in static and dynamic stresses. As a
result, it is not possible to make general recommendations for all high strength steels. Therefore,
one of the basic aims of this dissertation is to summarize knowledge that provides useful
information to industry professionals by experimenting multi (mismatching and heat input) with
different characteristics of BM and FM. The data and case studies presented in the sections on
the determination of welding working ranges can provide useful insights for engineers
manufacturing welded structures.
There are different characteristics of HSSS friend of the environment and then achieve
sustainable development, as follows. Economy: by increasing the strength of steel, then the
structural section can be reduced by 20 to 30%. Architecture: by reducing the size of structural
elements with higher-performing steel products, strong, thin and lightweight. Environment
(resources): by construction with less steel, reduced consumption of our world’s scarce
resources. Safety: by ensured high safety of the structures both in the fabrication and application.
Significant reduction of the structure’s dead weight, material and labour consumption are the
main advantages of using these steels. They influence economic and operational efficiency by
reducing the costs of production, operating and maintenance. Further development of the
innovative HSSS, determination of their performance and improvement joining technology are
associated with the necessity to perform further studies.
Survive of structures against different hard weather conditions without or less repairing
process it's also achieved by obtained results which will also help for conservative raw materials
in nature and decrease production cost.
High performance is obtained of these new generations of high strength steel categories of
welded joints in many application fields than these previous applications of lower steel
categories. Also continuous and survival HSSS applications for the long term than the previous
other applications. Thus the results increased performance of applications i.e. ships, offshore,
heavy vehicle equipment and machinery now are better than old applications.
In predominantly cases, service loads have variable characteristics. For this reason, it is
necessary to perform numerous investigations of the HSSS welded joints determining their
mechanical properties, especially fatigue characteristics and behaviour. During the research,
despite a large number of experiments and specimens, it was not possible to fully investigate the
APPLICATION POSSIBILITIES OF THE RESULTS
88
steels. Fatigue strength and limit curves were determined for the conditions of HCF and FCG, for
both investigated base materials and welded joints, and for each mismatch. Fatigue strength
curves were calculated for comparative materials, too. These boundary curves, in their specific
or generic form, can be used to evaluate the integrity of welded structures, estimate lifetime
and/or residual lifetime, and perform comparative calculations. These curves carry important
data and information for the interested researchers, manufacturing companies and so on.
The materials from the grade of HSSS are increasingly used in welded structures e.g.
telescopic jibs and chassis of mobile cranes, gantries frames, pressure vessels, offshore platforms
or bridge structures including the military mobile bridges. For example, in the vehicle industry,
one of the fundamental trends in the environmental load reduction through weight reduction, this
can be achieved by the application of high strength materials.
The publishing results via articles of researchers, dissertations of both masters and PhD
students as well as different of other studies have a contributing role to start a new generation of
manufacturing with new joining welding technology applied on higher steel categories these
make our life more pleasant and easier.
The importance of investigation and then the results obtaining for welded joints specimens
what was studied in two different categories and comparison with previous investigated work is
necessary during mismatch phenomenon of welded joints which characteristic influence both on
the HCF and on the FCG resistance. Thus in case of different matching conditions, the reliability
of the test results will be different, and this justifies the necessity of applying many experimental
investigation works to collect more reliable results which will serve the people who are
interested with this science area, and finally developing of application field and enhance the
products.
Welding technology is improved by supporting these results which applied for joining HSSS
in different types of applications and by developing the characteristics of welding aspect and
testing methodology so the results of researchers or manufacturing products will be in higher
level in the near future. Applying the developed welding technologies adequate with HSSS base
materials produced, appropriate quality contains the eligible resistance to HCF and FCG.
The results of researcher help reduce the number of pieces of equipment working in the
projects like the increase in the capacity of the loader, shovel and cranes using higher steel
categories with developed welding process help decreasing the number of them in the working
land.
Increasing productivity of buildings and towers by the increasing number of floors and length
of towers using the new results of welded of high strength steel categories in construction of
these buildings and towers and then increases green land and supporting sustainable
development issue.
Miskolc, 12th June 2020
Haidar Faisal Helal Mobark
Agriculture and Machinery Equipments Engineering Techniques (BSc)
Machine Design (MSc)
ACKNOWLEDGEMENTS
89
ACKNOWLEDGEMENTS
First of all, I am thankful to Allah, for everything He gave me, for everything He did not give
me, for everything He protected me from that which I know and that which I am not even aware
of, thanks for blessings that I did not even realize were blessings much more than I deserve, and
thanks for everything else because no matter how many things I try to list, I cannot even come
close to thanking Him enough. The one who is most deserving of thanks and praise from people
is Allah, may He be glorified and exalted, because of the great favours and blessings that He has
bestowed upon His slaves in both spiritual and worldly terms. Allah has commanded us to give
thanks to Him for those blessings, and not to deny them. ”my success is only by blessings of
Allah”.
I would like to say a big thank you for all Ahl al-Bayt, the “People of the House”, or the
family of Messenger Muhammad and they are successors of Messenger Muhammad. I requested
them many times to solve different of my problems and the solutions occur by their good and
blessings of them from Allah.
I would like to thank my supervisor, Dr. János Lukács, professor for his help in the
dissertation's professional content, his continuous guidance, his constructive critical comments,
and his many years of active joint publishing. In particular, I would like to emphasize your help
in the areas of high-cycle fatigue tests and fatigue crack testing, where he assisted in the
evaluation of the results with his extensive professional consultation.
I am grateful to Dr. Ádám Dobosy, a distinguished university teacher for his help in carrying
out welding processing of high strength steel. I would like to emphasize his tireless work with
which he regularly helped me in mechanical properties tests and welding aspects.
I would like to express my gratitude to my all respected teachers who they thought me
different subjects during 2nd and 3rd semesters, they are Dr. András Balogh (Welding process
and welding technology), Dr. Mihály Komócsin (Welding Theory) and Dr. Marcell Gáspár
(Weldability), for whom I owe my commitment to teach me welding processing and they
develop my knowledge in welding of steel.
I would like to thank Prof. Dr. Miklós Tisza, who, as head of the institutional department and
previous head of the István Sályi Doctoral School of Mechanical Sciences, he is my teacher
during the 1st semester taught me (Fundamentals of Materials Science). And also I do not forget
my thank you to the current head of the István Sályi Doctoral School of Mechanical Sciences
Prof. Dr. Gabriella Vadaszne Bognar.
I would like to express my gratitude to the workshop and laboratory staff at the Institute of
Materials Science and Technology. I would like to highlight András Petrovics a welder without
whom the welding experiments would not have been possible. I would like to thank the
workshop manager Sándor Kecskés-Kristóf for his precise work, who provided tremendous help
in the production of specimens. Thanks are due to László Szentpéteri and Géza Csukás for their
ACKNOWLEDGEMENTS
90
assistance in carrying out long and laborious measurements, and for Ágnes Csurilláné Balogh for
her contribution in the preparation of abrasives and shooting digital photos.
I would also like to thank the colleagues of my agriculture college, Dr. Ali Fadhel Merjan, Dr.
Ehab Kareem Al-hilly, Mr. Kazem Mahdi Al-saffar, who contributed guarantee command of a
financial affair to issue of my scholarship.
And last but not least, I would like to thank my parents, my sisters and brother, special thanks
to my wife and kids too for their patience and resistant because they have missed me a lot, also
my wife family, all of my uncles, aunts and cousins, relatives and friends for their versatile
support during my studies and preparation of my PhD dissertation.
I would like to thank Stipendium Hungaricum Scholarship for this chance by covered the
academic courses fee and the living costs and for their cooperation to receive admission at the
University of Miskolc to complete my PhD study in Hungary.
Some publications were carried out as part of the EFOP-3.6.1-16-2016-00011 “Younger and
Renewing University – Innovative Knowledge City – institutional development of the University
of Miskolc aiming at intelligent specialization” project implemented in the framework of the
Széchenyi 2020 program. The realization of this project is supported by the European Union, co-
financed by the European Social Fund.
DEDICATION
91
DEDICATION
“To All of My Dears and Lovers”
“Rasul Allah Muhammad Ibn Abdullah Ibn Abd Al-Muttalib Khatam Al-Anbia”
“Umm Abiha Al-Zahra Fatimah Bint Muhammad Sayyidat Al-Nisa”
“Imam Ali Ibn Abi Talib Amir al-Mu'minin”
“Imam Al-Hasan Ibn Ali Al-Mujtaba”
“Imam Al-Husayn Ibn Ali Sayyid Ash-Shuhada”
“Imam Ali Ibn Husayn Al-Sajjad”
“Imam Muhammad Ibn Ali Baqir Al-Ulum”
“Imam Ja'far Ibn Muhammad As-Sadiq”
“Imam Musa Ibn Ja'far Al-Kazim”
“Imam Ali Ibn Musa Ar-Rida”
“Imam Muhammad Ibn Ali Al-Jawad”
“Imam Ali Ibn Muhammad Al-Hadi”
“Imam Hasan Ibn Ali Al-Askari”
“Imam Al-Zaman Hujjat Allah Ibn Al-Hasan Muhammad Al-Mahdi Baqiyyat Allah and His
Mother Madam Narjis”
“Qamar Bani Hashim Al-Abbas Ibn Ali and His Mother Madam Umm Ul-Banin”
“Grand Ayatollah Al-Sayyid Ali Al-Husseini Al-Sistani”
REFERENCES
92
REFERENCES
[1] W. Schütz: A history of fatigue, Journal of Engineering Fracture Mechanics, Vol. 54, No.
2, pp. 263-300, 1996.
[2] P. C. Paris, M. P. Gomez, W. E. Anderson: A rational analytic theory of fatigue, The
Trend in Engineering 13, pp. 9-14, 1961.
[3] D. Schroepfer, T. Kannengiesser: Stress build-up in HSLA steel welds due to material
behavior, Journal of Materials Processing Technology, Vol. 227, pp. 49-58, 2016.
[4] T. Lausch, T. Kannengiesser, M. Schmitz-Niederau: Multi-axial load analysis of thick-
walled component welds made of 13CrMoV9-10, Journal of Materials Processing
Technology, Vol. 213, pp. 1234-1240, 2013.
[5] D. Schroepfer, A. Kromm, T. Kannengiesser: Improving welding stresses by filler metal
and heat control selection in component-related butt joints of high-strength steel,
Welding in the World, Vol. 59, No. 3, pp. 455-464, 2015.
[6] S. Ravi, V. Balasubramanian, S. Nemat Nasser: Effect of mis-match ratio (MMR) on
fatigue crack growth behaviour of HSLA steel welds, Engineering Failure Analysis, Vol.
11, No. 3, pp. 413-428, June 2004.
[7] H. F. H. Mobark, J. Lukács: Mismatch effect influence on the high cycle fatigue
resistance of S690QL type high strength steels, 2nd International Conference on
Structural Integrity and Durability, Dubrovnik, Croatia, October 2-5, 2018.
[8] J. Kömi: Hot-rolled ultra-high-strength steels of Ruukki trainers’ training, Raahe,
Finland, June 14, 2011.
[9] Á. Dobosy: Design limit curves for cyclic loaded structural elements made of high
strength steels, PhD Thesis, István Sályi Doctoral School of Mechanical Engineering
Sciences, University of Miskolc, Miskolc, 2017 (In Hungarian).
[10] M. Gáspár.: Welding technology development of Q+T high strength steels based on
physical simulation, PhD Thesis, István Sályi Doctoral School of Mechanical
Engineering Sciences, University of Miskolc, Miskolc, 2016 (In Hungarian).
[11] St. Weglowski, M.: Modern toughened steels – their properties and advantages, Biuletyn
Instytutu Spawalnictwa, No. 2, pp. 25-36, 2012.
[12] K. Richter, F. Hanus, P. Wolf: Structural steels of 690 MPa yield strengths – A state of
art, High Strength Steel for Hydropower Plants Conference, Graz, 2005.
[13] M. Gáspár, A. Balogh: GMAW Experiments for advanced (Q+T) high strength steels,
Production Processes and Systems, Vol. 6, No. 1, pp. 9-24, 2013.
[14] A. Balogh, J. Lukács, I. Török (Eds.): Weldability and the properties of welded joints,
University of Miskolc, Miskolc, 324 p, 2015 (In Hungarian).
[15] J. Kerns: Advances in metals pave way to lighter vehicles, Machine Design, Vol. 87, pp.
36-43, (2015).
[16] https://www.machinedesign.com/metals/advances-metals-pave-way-lighter-vehicles
REFERENCES
93
[17] http://www.sagesteelltd.com/dl/Alform/Alform%202016.pdf
[18] M. Fiedler et al.: The Alfrom welding system. The world first system for high-strength
welded structures, Proceedings of IIW International Conference, Paper IIW 2015 1504,
pp. 1-5, 2015.
[19] www.voestalpine.com/grobblech
[20] K. Tatsumi, Y. kouki, A. Hidemi: Development of high strength H-shapes with excellent
toughness manufactured by advanced Thermo-Mechanical Control Process (TMCP),
Originally Published in JFE Giho No. 16, pp. 30-35, 2011.
[21] M. Toyosada: Characteristics of TMCP steels and their welded joints used for hull
structures, Proceeding of The Twelfth International Offshore and Polar Engineering
Conference, Kitakyuyushu, Japan, 2002.
[22] S. Nobuo, M. Shinji, E. Shigeru: Recent development in microstructural control
technologies through the Thermo-Mechanical Control Process (TMCP) with JFE steel’s
high-performance plates, JFE Technical Report, No. 11, 2008.
[23] R. Laitinen: Welding of high and ultra high strength steels. trainers’ training, Raahe,
Finland, June 14, 2011.
[24] H. F. H. Mobark, Á. Dobosy, J. Lukács: Mismatch effect influence on the HCF resistance
of high strength steels and their GMA welded joints, Vehicle and Automotive
Engineering 2 (VAE 2), pp. 755-767, 2018.
[25] R. J. M. Pijpers, et al.: Fatigue experiments on very high strength steel base material and
transverse butt welds, Advanced Steel Construction Vol. 5, No. 1, pp. 14-32, 2009.
[26] N. Baluch, Z. M. Udin, C. S. Abdullah: Advanced high strength steel in auto industry, An
Overview Engineering Technology and Applied Science Research, Vol. 4, No. 4, pp.
686-689, 2014.
[27] E. Kalácska, et al.: MIG-welding of dissimilar advanced high strength steel sheets,
Materials Science Forum, Vol. 885, pp. 80-85, 2017.
[28] K. Májlinger, E. Kalácska, P. R. Spena: Gas metal arc welding of dissimilar AHSS
sheets, Materials and Design, Vol. 109, pp. 615-621, 2016.
[29] P. Collin, et al.: Undermatching butt welds in high strength steel, International
Association for Bridge and Structural Engineering, 2009.
[30] Z. Barsoum, M. Khurshid: Ultimate strength capacity of welded joints in high strength
steels, 2nd International Conference on Structural Integrity, 4-7 September 2017,
Funchal, Madeira, Portugal, Procedia Structural Integrity, Vol. 5, pp. 1401-1408, 2017.
[31] J. N. Dupont, S. Babu, S. Liu: Welding of materials for energy applications, The
Minerals, Metals and Materials Society and ASM International 2013, Metallurgical and
Materials Transactions A, Vol. 44a, pp. 3385-3410, 23 February, 2013.
[32] B. Jonsson, et al.: Implementing high frequency mechanical impact in industrial
components: A case study, 5th Fatigue Design Conference, Procedia Engineering Vol. 66,
pp. 202-215, 2013.
[33] Strategic Research Agenda: A vision for the future of the steel sector, 2nd ed. European
Steel Technology Platform (May 2013). https://www.estep.eu/assets/SRA-2013.pdf, last
accessed 2019/09/28.
[34] D. A. Porter: Weldable high-strength steels: challenges and engineering applications,
Portevin lecture, IIW 2015 International Conference on High Strength Steels –
REFERENCES
94
Challenges and Applications, Helsinki, Finland, 2-3. July 2015, Paper IIW 2015 0102
13p.
[35] Á. Dobosy, J. Lukács: The effect of the welding parameters on the properties of the
thermomechanically rolled high strength steels, The Publications of the MultiScience -
XXX. microCAD International Multidisciplinary Scientific Conference, University of
Miskolc, Paper D2_3. 8 p, 2016.
[36] AWS D1.1/D1.1M:2015: Structural Welding Code – Steel. 23rd Edition, American
Welding Society.
[37] Metals Handbook, Vol. 6: Welding, Brazing and Soldering. ASM International, USA
(1995).
[38] J. Górka: Effect of repair welding on the properties of welded joints of steel S700MC,
International Journal of Engineering Science and Innovative Technology (IJESIT), Vol.
2, No. 5, September 2013.
[39] S. Ravi, et al.: Assessment of some factors influencing the fatigue life of strength mis-
matched HSLA steel weldments, Materials and Design Vol. 25, No. 2, pp. 125-135, April
2004.
[40] A. J. R. Loureiro: Effect of heat input on plastic deformation of undermatched welds,
Journal of Materials Processing Technology, Vol. 128, No. 1-3, pp. 2490-2496, October
2002.
[41] M. Mirzaei, et al.: Study of welding velocity and pulse frequency on microstructure and
mechanical properties of pulsed gas metal arc welded high strength low alloy steel,
Materials and Design, Vol. 51, pp. 709-713, October 2013.
[42] K. Devakumaran, M.R. Ananthapadmanaban, P.K. Ghosh: Variation of chemical
composition of high strength low alloy steels with different groove sizes in multi-pass
conventional and pulsed current gas metal arc weld depositions, Defence Technology,
Vol. 11, No. 2, pp. 147-156, June 2015.
[43] P. Collin, B. Johansson: Design of welds in high strength steels, Proceedings of the 4th
European Conference on Steel and Composite Structures, Maastricht, Vol. C, pp.89-98,
2005.
[44] E. Harati, et al.: Applicability of low transformation temperature welding consumables to
increase fatigue strength of welded high strength steels, International Journal of Fatigue,
Vol. 97, pp. 39-47, April 2017.
[45] M. Stoschka, et al.: Effect of high-strength filler metals on fatigue, Welding in the World,
Vol. 56, No. 3-4, pp. 20-29, March 2012.
[46] M. Stoschka, et al.: Effect of high-strength filler metals on the fatigue behaviour of butt
joints, Welding in the World, Vol. 57, No. 1, pp. 85-96, February 2013.
[47] W. Guo, et al.: Comparison of microstructure and mechanical properties of ultra-narrow
gap laser and gas-metal-arc welded S960 high strength steel, Optics and Lasers in
Engineering, Vol. 91, pp. 1-15, April 2017.
[48] W. Guo, et al: Microstructure and mechanical properties of laser welded S960 high
strength steel, Materials and Design, Vol. 85, No. 15, pp. 534-548, November 2015.
[49] M. Gáspár, R. P. S. Sisodia: Weldability analysis of Q+T and TMCP high strength steels
by physical simulation, Proceedings of IIW International Conference, pp. B166-B170,
Shanghai, P.R. China, 29-30 June 2017.
REFERENCES
95
[50] D. Radaj: Review of fatigue strength assessment of nonwelded and welded structures
based on local parameters, International Journal of Fatigue Vol. 18, No. 3, pp. 153-170,
April 1996.
[51] J. Schijve: Predictions on fatigue life and crack growth as an engineering problem. A
state of the art survey, 6th International Fatigue Congress, Berlin, 6-10 May 1996. Eds.:
G. Lütjering, H. Nowack, Elsevier, 1996. Vol II, p. 1149-1164.
[52] J. C. Jr. NEWMAN: The merging of fatigue and fracture mechanics concepts: a
historical perspective. Fatigue and Fracture Mechanics, 28th Volume, ASTM STP 1321.
Eds.: J. H. Underwood, B. D. Macdonald, M.R. Mitchell, American Society for Testing
and Materials, 1997. p. 3-51.
[53] R. I. Stephens, et al.: Metal Fatigue in Engineering, John Wiley & Sons, Inc., 2001.
(ISBN 0-471-51059-9)
[54] H. Naubereit, J. Weihert: Einführung in die Ermüdungsfestigkei, Carl Hanser Verlag,
München - Wien, 1999. (ISBN 3-446-21028-8).
[55] Y. L. Lee, et al.: Fatigue testing and analysis (Theory and Practice.), Elsevier
Butterworth-Heinemann, 2005. (ISBN-10: 0-7506-7719-8)
[56] C. M. Sonsino: Effect of residual stresses on the fatigue behaviour of welded joints
depending on loading conditions and weld geometry; Part of special issue: Fatigue
assessment of welded connections, International Journal of Fatigue, Vol. 31, No. 1, pp.
88-100, January 2009.
[57] M. J. Ottersböck, et al.: Effect of weld defects on the fatigue strength of ultra high-
strength steels, Procedia Engineering, XVIII. International Colloquium on Mechanical
Fatigue of Metals, Gijón (Spain), Vol. 160, pp. 214-222, September 5-7, 2016.
[58] T. Nykänen, T. Björk: A new proposal for the assessment of fatigue strength of steel butt
welded joints improved by peening, IIW International Conference, High-Strength
Materials - Challenges and Applications, 2-3 July 2015, Helsinki, Finland, 2015.
[59] T. Teng, C. Fung, P. Chang: Effect of weld geometry and residual stresses on fatigue in
butt-welded joints, International Journal of Pressure Vessels and Piping, Vol. 79, No. 7,
pp. 467-482, July 2002.
[60] A. A. Bhatti, et al.: Fatigue strength improvement of welded structures using new low
transformation temperature filler materials, 5th Fatigue Design Conference, Fatigue
Design 2013, Procedia Engineering, Vol. 66, pp. 192-201, 2013.
[61] C. M. Sonsino, T. Łagoda, G. Demofonti: Damage accumulation under variable
amplitude loading of welded medium- and high-strength steels, International Journal of
Fatigue, Vol. 26, No. 5, pp. 487-495, May 2004.
[62] K. J. Kirkhope, et al.: Weld detail fatigue life improvement techniques. Part 1: review,
Marine Structures, Vol. 12, No. 6, pp. 447-474, July 1999.
[63] S. Cicero, et al.: Definition of BS7608 fatigue classes for structural steels with thermally
cut edges, Journal of Constructional Steel Research, Vol. 120, pp. 221-231, April 2016.
[64] M. Leitner: Influence of effective stress ratio on the fatigue strength of welded and
HFMI-treated high-strength steel joints, International Journal of Fatigue, Vol. 102, pp.
158-170, September 2017.
[65] H. Nakazawa, S. Kodama: Statistical S-N testing method with 14 specimens: JSME
standard method for determination of S-N curves. In: T. Tanaka, S. Nishijima, M.
Ichikawa, (Eds.) Statistical research on fatigue and fracture. Current Japanese materials
REFERENCES
96
research, Vol. 2, pp. 59-69, Elsevier Applied Science and The Society of Materials
Science, Japan, 1987.
[66] S. Chattopadhyay: Design fatigue curves based on small crack growth and crack closure,
Journal of Applied Science and Engineering Technology 2008, pp. 9-15, ISSN Print:
1939-8565.
[67] C. Ni, L. Hua, X. Wang: Crack propagation analysis and fatigue life prediction for
structural alloy steel based on metal magnetic memory testing, Journal of Magnetism and
Magnetic Materials, Vol. 462, pp. 144-152, September 2018.
[68] J. L. Otegui, U. H. Mohaupt, D. J. Burns: Effect of weld process on early growth of
fatigue cracks in steel T joints, International Journal of Fatigue, Vol. 13, No. 1, pp. 45-58,
January 1991.
[69] A. C. Pickard: Component lifing. Materials Science and Technology, Vol. 3, pp. 743-749,
September 1987.
[70] J. Lukács: Reliability of cyclic loaded welded joints having cracks, CSc dissertation,
Miskolc-Budapest, 1992.
[71] J. Lukács: Structural integrity, PhD lecture, 5th lecture, University of Miskolc, 2018.
[72] M. Klesnil, P. Lukas: Effect of stress cycle asymmetry on fatigue crack growth, Materials
Science and Engineering, No. 9, p. 231-240, (1972).
[73] P. Paris, F. Erdogan: A critical analysis of crack propagation laws, Journal of Basic
Engineering, Transactions of the ASME, pp. 528-534, December 1963.
[74] R. G. Forman, V. E. Kearney, R. M. Engle: Numerical analysis of crack propagation in
cyclic-loaded structures, Journal of Basic Engineering, Transactions of the ASME, pp.
459-464, September 1967.
[75] R. T. Yekta, K. Ghahremani, S. Walbridge: Effect of quality control parameter variations
on the fatigue performance of ultrasonic impact treated welds, International Journal of
Fatigue, Vol. 55, pp. 245-256, October 2013.
[76] D. Simunek, et al.: Fatigue crack growth under constant and variable amplitude loading
at semi-elliptical and V-notched steel specimens, 6th Fatigue Design conference,
Procedia Engineering, Vol. 133, pp. 348-361, 2015.
[77] S. Beretta, A. Bernasconi, M. Carboni: Fatigue assessment of root failures in HSLA steel
welded joints: A comparison among local approaches, International Journal of Fatigue,
Part of special issue: Fatigue Assessment of Welded Connections, Vol. 31, No. 1, pp.
102-110, January 2009.
[78] C. Zhang, et al: Effect of buffer layer and notch location on fatigue behavior in welded
high-strength low-alloy, Journal of Materials Processing Technology, Vol. 212, No. 10,
pp. 2091-2101, October 2012.
[79] Q. Wang, et al.: Understanding of fatigue crack growth behavior in welded joint of a new
generation Ni-Cr-Mo-V high strength steel, Engineering Fracture Mechanics, Vol. 194,
pp. 224-239, May 2018.
[80] A. M. P. de Jesus, et al: A comparison of the fatigue behavior between S355 and S690
steel grades, Journal of Constructional Steel Research, Vol. 79, pp. 140-150, December
2012.
[81] D. Simunek, M. Leitner, F. Grün: In-situ crack propagation measurement of high-
strength steels including overload effects, 7th International Conference on Fatigue Design
29-30 November 2017, Senlis, France, Procedia Engineering No. 213, pp. 335-345, 2018.
REFERENCES
97
[82] C. L. Walters: The effect of low temperatures on the fatigue of high-strength structural
grade steels, Part of special issue: 20th European Conference on Fracture, Procedia
Materials Science, Vol. 3, pp. 209-214, 2014.
[83] L. Zhen: Estimation of fatigue crack propagation rate in steel, Engineering Fracture
Mechanics, Vol. 48, No. 3, pp. 339-345, June 1994.
[84] H. Remes, et al.: Factors affecting the fatigue strength of thin-plates in large structures,
International Journal of Fatigue, Vol. 101, Part 2, pp. 397-407, August 2017.
[85] H. F. H. Mobark, J. Lukács: HCF design curves for high strength steel welded joints,
Design of Machines and Structures, Vol. 8, No. 2, pp. 39-51, 2018.
[86] Y. Wang: Optimizing weld integrity for high-strength steels, Advanced Welding and
Joining Technical Workshop, Boulder, Colorado USA (2009). https://primis.phmsa.
dot.gov/rd/mtgs/012506/35_KeynoteWang.pdf, last accessed 29/12/2017.
[87] https://hks-prozesstechnik.de/en/about-hks/
[88] M. Gáspár, A. Balogh, I. Sas: Physical simulation aided process optimisation aimed
sufficient HAZ toughness for quenched and tempered AHSS, In: Proceedings of IIW 2015
International Conference, Paper IIW 2015 1504, pp. 1-7, 2015.
[89] Á. Dobosy, M. Gáspár, P. Jámbor: Weldability of S960M thermo-mechanically treated
advanced high strength steel, In: Third Young Welding Professionals International
Conference, Halle (Saale), Pages 1-6, 2017.
[90] J. Lukács, et al.: Selected chapters from structural integrity of engineering structures, 1st
edn. Ed.: Lukács, J. University of Miskolc, Miskolc (2012), (In Hungarian).
[91] I. Marines-García, D. Galván-Montiel, C. Bathias: Fatigue life assessment of high-
strength, low-alloy steel at high frequency. Arabian Journal for Science and Engineering
33 (1B), 237-247, 2008.
[92] J. Lukács, H. F. H. Mobark: Mismatch effect on fatigue crack propagation limit curves of
S690QL, S960QL and S960TM type base materials and their gas metal arc welded joints,
72nd IIW Annual Assembly and International Conference 7-12 July 2019 Conference
Proceedings, Bratislava Slovakia 2019.
[93] ASTM E647-11e1: Standard Test Method for Measurement of Fatigue Crack Growth
Rate, ASTM International 2011.
[94] R. J. Allen, G. S. Booth, T Jutla: A review of fatigue crack growth characterisation by
linear elastic fracture mechanics (LEFM). Part I – Principles and methods of data
generation, Fatigue and Fracture of Engineering Materials and Structures, Vol. 11, No. 1,
p. 45-69, 1988.
[95] R. J. Allen, G. S. Booth, T Jutla: A review of fatigue crack growth characterization by
linear elastic fracture mechanics (LEFM). Part II – Advisory documents and applications
within national standards, Fatigue and Fracture of Engineering Materials and Structures,
Vol. 11, No. 2, p. 71-108, 1988.
[96] A. Ohta, et al.: Fatigue Crack Propagation Curve for Design of Welded Structures,
Transactions of the Japan Welding Society, Vol. 20, No. 1, April 1989. p. 17-23.
[97] Det norske Veritas: Classification Notes, Note No. 30.2 Fatigue strength analysis for
mobile offshore units, August 1984.
[98] BS 7910: Guide on methods for assessing the acceptability of flaws in fusion welded
structures, 1999.
REFERENCES
98
[99] J. Lukács: Fatigue crack propagation limit curves for different metallic and nonmetallic
materials, Materials Science Forum (2003) Vol. 414-415, pp. 31-36.
[100] R. O. Ritchie: Near-Threshold Fatigue Crack Propagation in Steels, International Metals
Reviews, Vol. 20 (5/6), 1979, pp. 205-230.
[101] D. Taylor: Compendium of fatigue thresholds and crack growth rates, EMAS, Warley,
1985.
[102] D. Taylor, L. Jianchun (Eds.): Sourcebook on fatigue cack propagation: threshold and
crack closure, EMAS, Warley, 1993.
[103] B. Farahmand: Multiscale Fatigue Crack Initiation and Propagation of Engineering
Materials, Structural Integrity and Microstructural Worthiness, Solid Mechanics and its
Applications 152 Springer, Dordrecht 1, 2008.
[104] J. Lukács, Á. Dobosy: Matching effect on fatigue crack growth behaviour of high
strength steels GMA welded joints, 1-19. IIW-DOC XIII-2692-17
[105] J. Lukács: Determination of fatigue crack propagation limit curves and one possibility of
their application, In: K. Jármai, J. Farkas (Eds.) Metal structures: design, fabrication,
economy, Proceedings of the International Conference on Metal Structures, Millpress
Science Publishers, Rotterdam, pp. 33-38, 2003.
[106] J. Lukács, L. Kuzsella, Zs. Koncsik, M. Gáspár, Á. Meilinger: Role of the Physical
Simulation for the Estimation of the Weldability of High Strength Steels and Aluminum
Alloys, Materials Science Forum, Vol. 812 pp. 149-154 (2015).
[107] https://www.ssab.com/products/brands/strenx/products/strenx-1300
[108] https://www.dillinger.de/d/en/products/heavyplate/highstrength-finegrained/index.shtml
[109] https://www.voestalpine.com/alform/en/Products/x-treme
[110] O. Lagerqvist, et al.: Efficient lifting equipment with extra highstrength steel, Contract No
7210-PR/379. Final report, European Commission Technical Steel Research, 2007.
[111] Szunyogh, L. (Ed. in chief): Welding and related technologies. Gépipari Tudományos
Egyesület, Budapest, 2007 (In Hungarian).
[112] http://www.ruukki.com/optimqc
[113] P. Collin, M. Möller, M. Nilsson, S. Törnblom: Undermatching butt welds in high
strength steels, 2009. https://www.researchgate.net/publication/233646066_Under
matching_Butt_Welds_in_High_Strength_Steel
[114] R. Wilms: High strength steels for steel construction, Nordic Steel Conference
publication, pp. 597-604, 2009.
LIST OF PUBLICATIONS RELATED TO THE TOPIC OF THE RESEARCH FIELD
99
LIST OF PUPLICATIONS RELATED TO THE TOPIC OF THE RESEARCH FIELD
IN ENGLISH
(1) H. F. H. Mobark, Á. Dobosy, J. Lukács: Mismatch effect influence on the HCF resistance
of high strength steels and their GMA welded joints, Vehicle and Automotive Engineering
2 (VAE 2), pp. 755-767, 2018.
(2) H. F. H. Mobark, J. Lukács: Mismatch effect influence on the high cycle fatigue resistance
of S690QL type high strength steels, 2nd International Conference on Structural Integrity
and Durability, Dubrovnik, Croatia, October 2-5, pp. 1-4, 2018.
(3) H. F. H. Mobark, J. Lukács: HCF design curves for high strength steel welded joints,
Design of Machines and Structures, Vol. 8, No. 2, pp. 39-51, 2018.
(4) H. F. H Mobark, J. Lukács: HCF resistance characteristics of S690QL type high strength
steels and their welded joints, PhD Doctoral Forum, Faculty of Mechanical Engineering
and Informatics, István Sályi Doctoral School, University of Miskolc, November 2018.
(5) H. F. H. Mobark, J. Lukács: Connection among the parameters of the Manson-Coffin, the
Basquin and the Paris-Erdogan equations, MultiScience - XXXIII. microCAD
International Multidisciplinary Scientific Conference, University of Miskolc, 23-24 May
2019, ISBN 978-963-358-177-3.
(6) J. Lukács, H. F. H. Mobark: Mismatch effect on fatigue crack propagation limit curves of
S690QL, S960QL and S960TM type base materials and their gas metal arc welded joints,
72nd IIW Annual Assembly and International Conference 7-12 July 2019 Conference
Proceedings, Bratislava Slovakia 2019.
(7) H. F. H. Mobark, J. Lukács: Efficient application of S690QL type high strength steel for
cyclic loaded welded structures, Solutions for Sustainable Development, Proceedings of
the 1st International Conference on Engineering Solutions for Sustainable Development
(ICESSD 2019), October 3-4, 2019, Klára Szita Tóthné, Károly Jármay, Katalin Voith,
Miskolc, Hungary.
(8) H. F. H. Mobark, J. Lukács: Heat input influence on fatigue crack growth characteristics
of high strength steel GMAW joints, PhD Doctoral Forum, Faculty of Mechanical
Engineering and Informatics, István Sályi Doctoral School, University of Miskolc,
November 2019.
(9) J Lukács, H. F. H. Mobark: The influence of the base material - filler metal pairing on the
fatigue crack propagation of 700 MPa strength category welded joints, XII. National
Conference on Materials Science OATK 2019. Under publication: IOP Conference Series:
Materials Science and Engineering.
LIST OF PUBLICATIONS RELATED TO THE TOPIC OF THE RESEARCH FIELD
100
(10) H. F. H. Mobark, J. Lukács: Mismatch effect on fatigue crack propagation limit curves of
GMAW joints made of S960QL and S960TM type base materials, Design of Machines and
Structures, Vol. 10, No. 1, pp. 28-38, 2020.
IN HUNGARIAN
(11) H. F. H. Mobark, J. Lukács: High cycle fatigue resistance characteristics of S690QL type
high strength steels and their welded joints, GépGyártás, Vol. LVIII, No. 1-2, pp. 71-75,
2019.
(12) H. F. H. Mobark, J. Lukács: Base material - filler metal pairing influence on fatigue crack
propagation resistance of high strength steels and their welded, GépGyártás, Vol. LVIII,
No. 1-2, pp. 76-80, 2019.
LIST OF APPENDICES
101
APPENDICES
A1 High cycle fatigue (HCF) tests characteristics and results
A2 Fatigue crack growth (FCG) tests characteristics
A3 Paris-Erdogan exponent samples and their characteristics
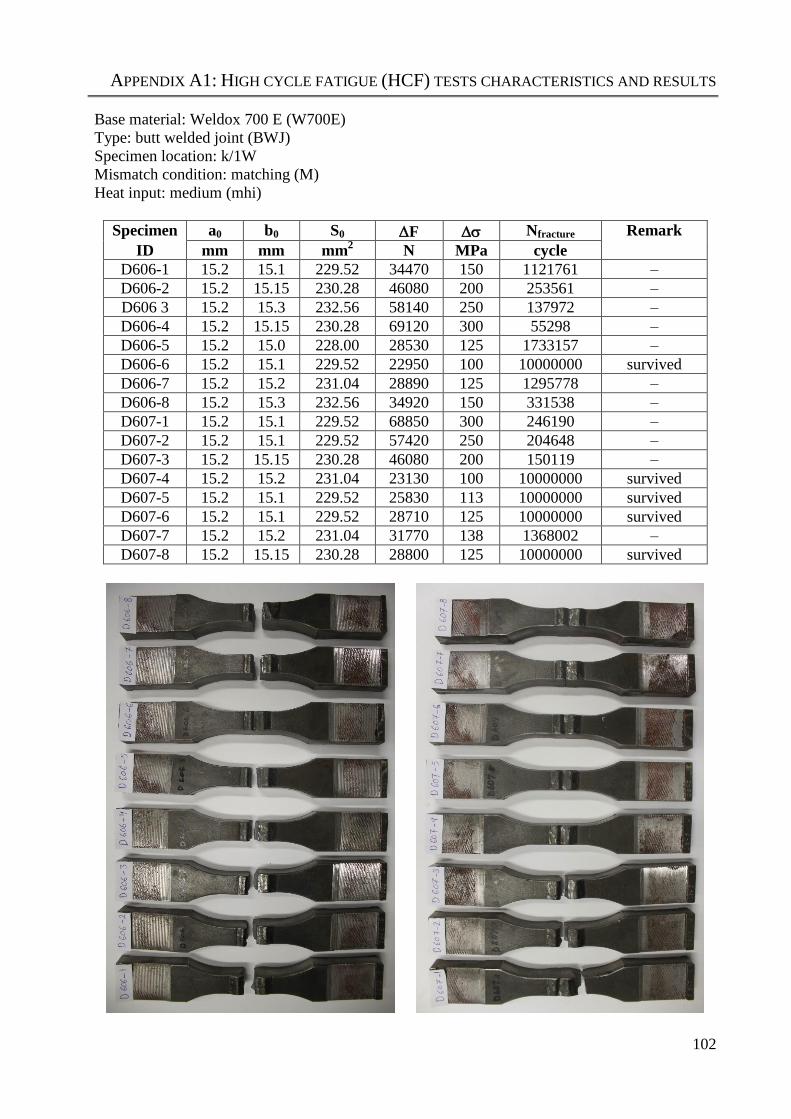
APPENDIX A1: HIGH CYCLE FATIGUE (HCF) TESTS CHARACTERISTICS AND RESULTS
102
Base material: Weldox 700 E (W700E)
Type: butt welded joint (BWJ)
Specimen location: k/1W
Mismatch condition: matching (M)
Heat input: medium (mhi)
Specimen a0 b0 S0 F Nfracture Remark
ID mm mm mm2 N MPa cycle
D606-1 15.2 15.1 229.52 34470 150 1121761 –
D606-2 15.2 15.15 230.28 46080 200 253561 –
D606 3 15.2 15.3 232.56 58140 250 137972 –
D606-4 15.2 15.15 230.28 69120 300 55298 –
D606-5 15.2 15.0 228.00 28530 125 1733157 –
D606-6 15.2 15.1 229.52 22950 100 10000000 survived
D606-7 15.2 15.2 231.04 28890 125 1295778 –
D606-8 15.2 15.3 232.56 34920 150 331538 –
D607-1 15.2 15.1 229.52 68850 300 246190 –
D607-2 15.2 15.1 229.52 57420 250 204648 –
D607-3 15.2 15.15 230.28 46080 200 150119 –
D607-4 15.2 15.2 231.04 23130 100 10000000 survived
D607-5 15.2 15.1 229.52 25830 113 10000000 survived
D607-6 15.2 15.1 229.52 28710 125 10000000 survived
D607-7 15.2 15.2 231.04 31770 138 1368002 –
D607-8 15.2 15.15 230.28 28800 125 10000000 survived
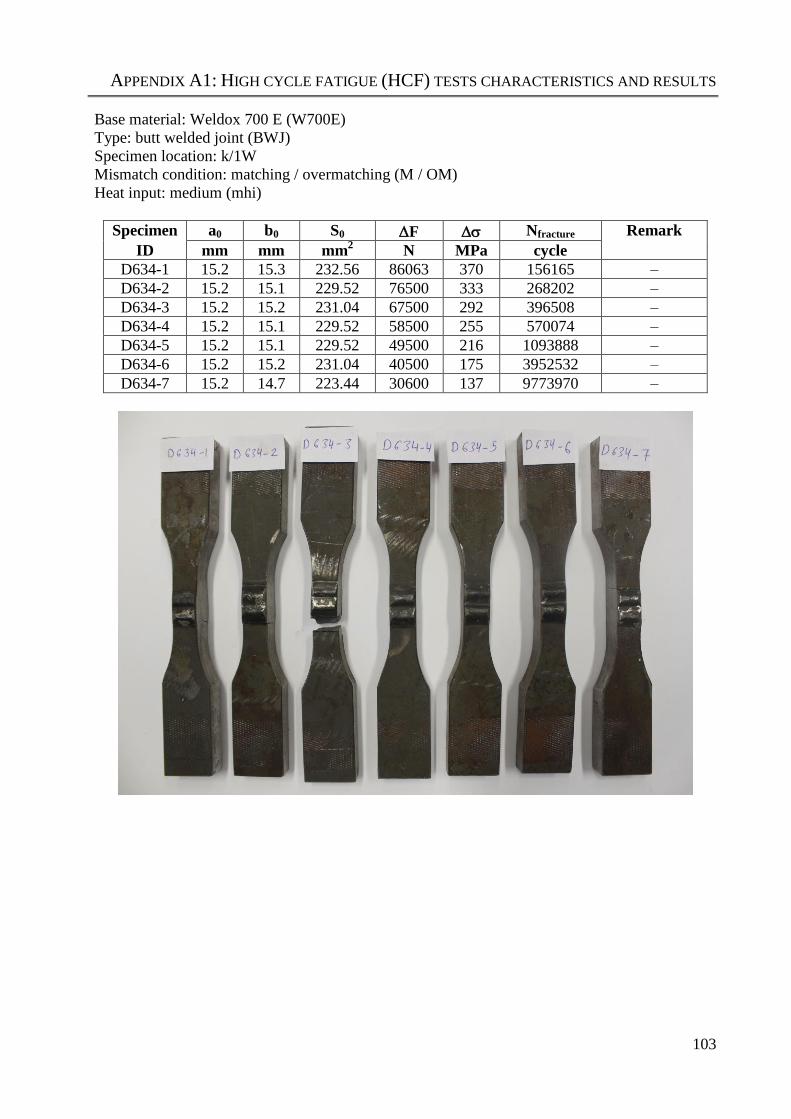
APPENDIX A1: HIGH CYCLE FATIGUE (HCF) TESTS CHARACTERISTICS AND RESULTS
103
Base material: Weldox 700 E (W700E)
Type: butt welded joint (BWJ)
Specimen location: k/1W
Mismatch condition: matching / overmatching (M / OM)
Heat input: medium (mhi)
Specimen a0 b0 S0 F Nfracture Remark
ID mm mm mm2 N MPa cycle
D634-1 15.2 15.3 232.56 86063 370 156165 –
D634-2 15.2 15.1 229.52 76500 333 268202 –
D634-3 15.2 15.2 231.04 67500 292 396508 –
D634-4 15.2 15.1 229.52 58500 255 570074 –
D634-5 15.2 15.1 229.52 49500 216 1093888 –
D634-6 15.2 15.2 231.04 40500 175 3952532 –
D634-7 15.2 14.7 223.44 30600 137 9773970 –
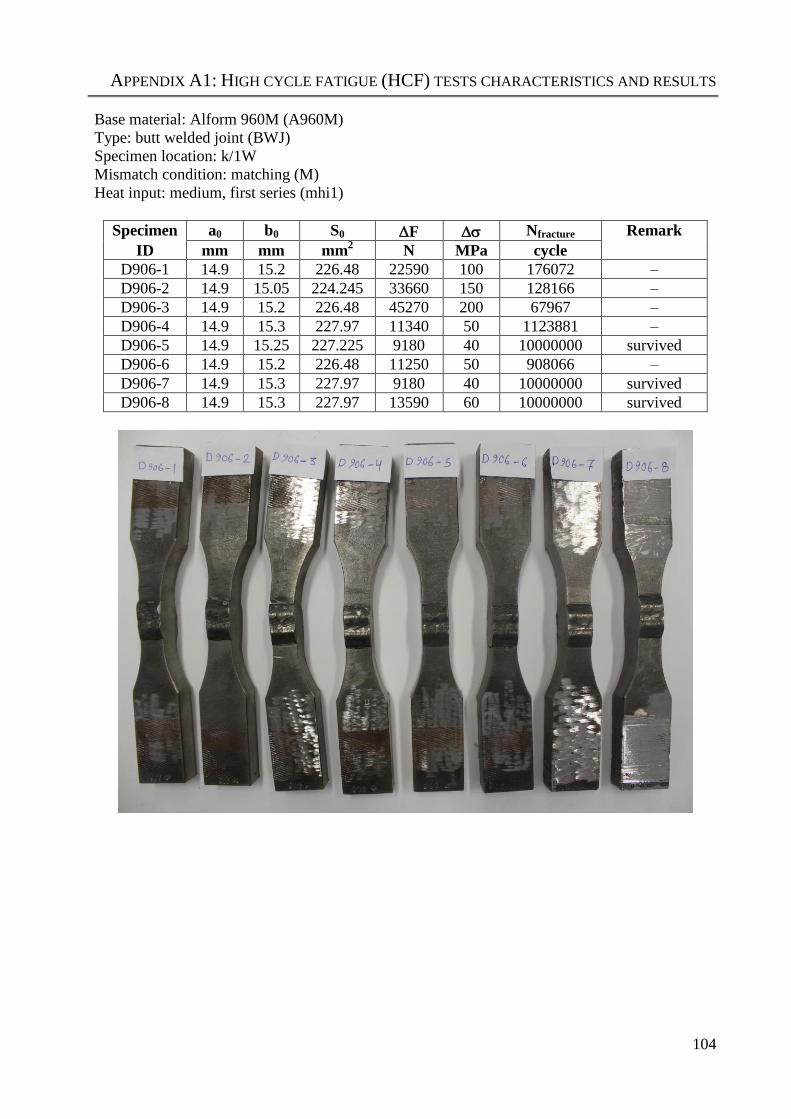
APPENDIX A1: HIGH CYCLE FATIGUE (HCF) TESTS CHARACTERISTICS AND RESULTS
104
Base material: Alform 960M (A960M)
Type: butt welded joint (BWJ)
Specimen location: k/1W
Mismatch condition: matching (M)
Heat input: medium, first series (mhi1)
Specimen a0 b0 S0 F Nfracture Remark
ID mm mm mm2 N MPa cycle
D906-1 14.9 15.2 226.48 22590 100 176072 –
D906-2 14.9 15.05 224.245 33660 150 128166 –
D906-3 14.9 15.2 226.48 45270 200 67967 –
D906-4 14.9 15.3 227.97 11340 50 1123881 –
D906-5 14.9 15.25 227.225 9180 40 10000000 survived
D906-6 14.9 15.2 226.48 11250 50 908066 –
D906-7 14.9 15.3 227.97 9180 40 10000000 survived
D906-8 14.9 15.3 227.97 13590 60 10000000 survived
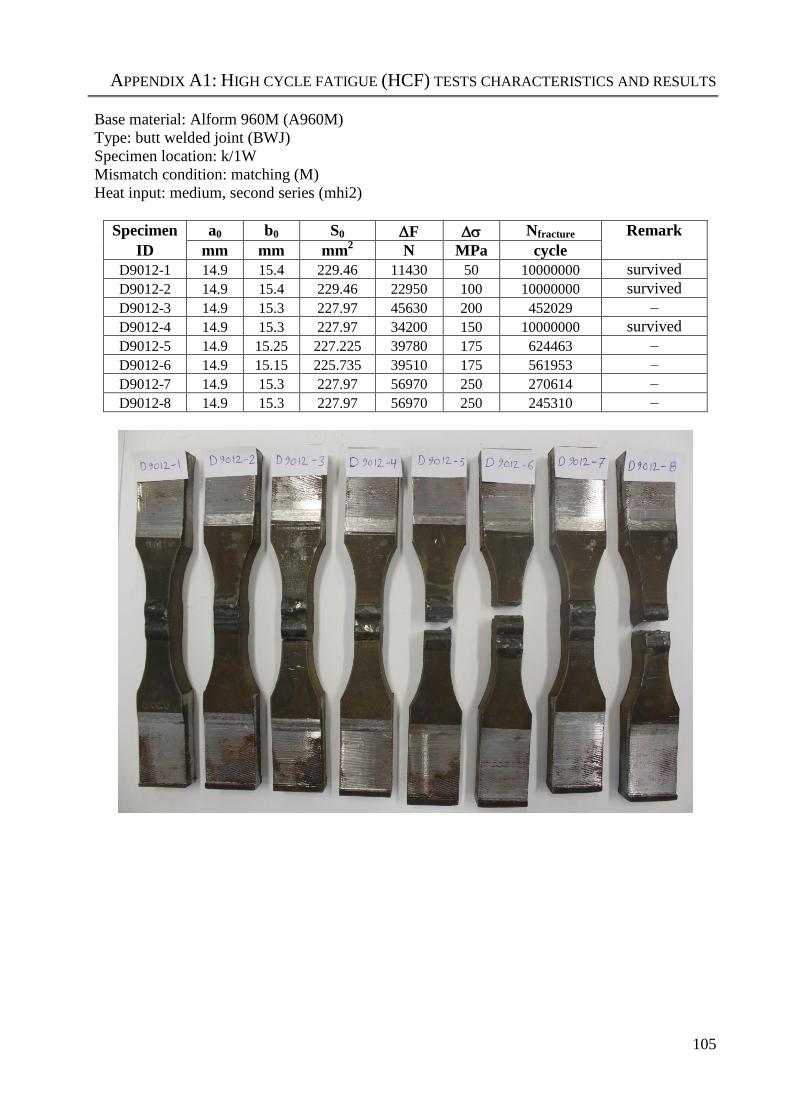
APPENDIX A1: HIGH CYCLE FATIGUE (HCF) TESTS CHARACTERISTICS AND RESULTS
105
Base material: Alform 960M (A960M)
Type: butt welded joint (BWJ)
Specimen location: k/1W
Mismatch condition: matching (M)
Heat input: medium, second series (mhi2)
Specimen a0 b0 S0 F Nfracture Remark
ID mm mm mm2 N MPa cycle
D9012-1 14.9 15.4 229.46 11430 50 10000000 survived
D9012-2 14.9 15.4 229.46 22950 100 10000000 survived
D9012-3 14.9 15.3 227.97 45630 200 452029 –
D9012-4 14.9 15.3 227.97 34200 150 10000000 survived
D9012-5 14.9 15.25 227.225 39780 175 624463 –
D9012-6 14.9 15.15 225.735 39510 175 561953 –
D9012-7 14.9 15.3 227.97 56970 250 270614 –
D9012-8 14.9 15.3 227.97 56970 250 245310 –
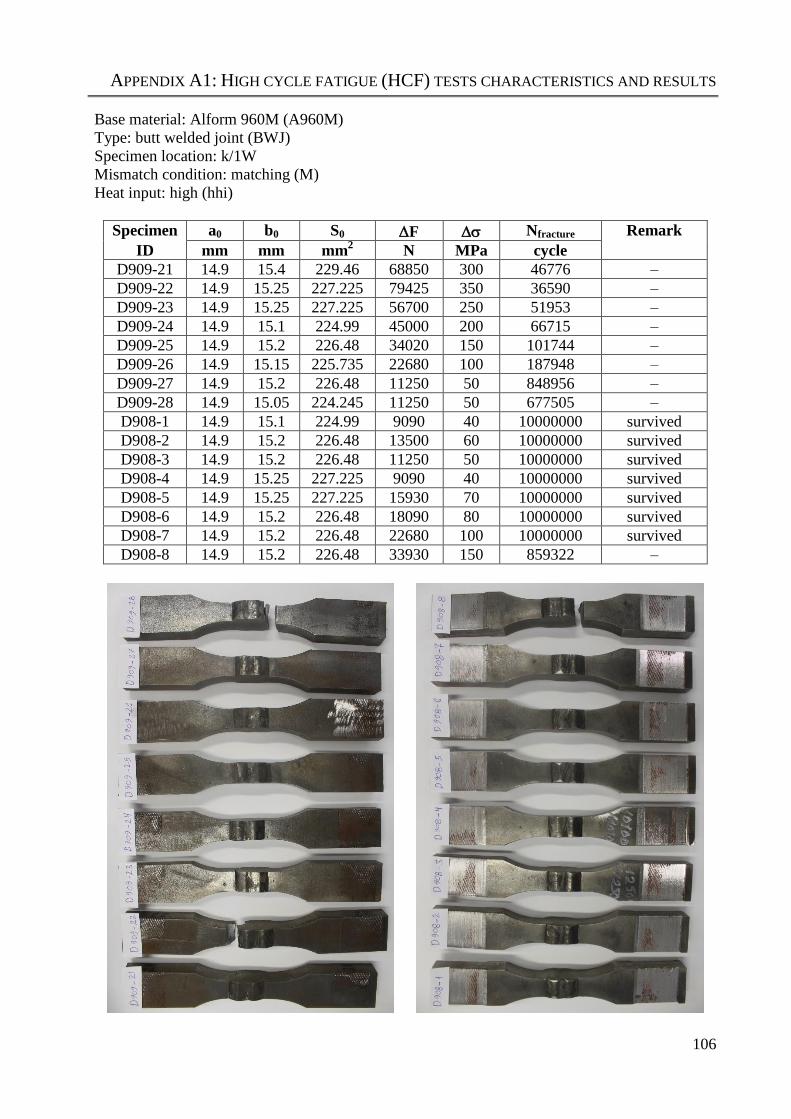
APPENDIX A1: HIGH CYCLE FATIGUE (HCF) TESTS CHARACTERISTICS AND RESULTS
106
Base material: Alform 960M (A960M)
Type: butt welded joint (BWJ)
Specimen location: k/1W
Mismatch condition: matching (M)
Heat input: high (hhi)
Specimen a0 b0 S0 F Nfracture Remark
ID mm mm mm2 N MPa cycle
D909-21 14.9 15.4 229.46 68850 300 46776 –
D909-22 14.9 15.25 227.225 79425 350 36590 –
D909-23 14.9 15.25 227.225 56700 250 51953 –
D909-24 14.9 15.1 224.99 45000 200 66715 –
D909-25 14.9 15.2 226.48 34020 150 101744 –
D909-26 14.9 15.15 225.735 22680 100 187948 –
D909-27 14.9 15.2 226.48 11250 50 848956 –
D909-28 14.9 15.05 224.245 11250 50 677505 –
D908-1 14.9 15.1 224.99 9090 40 10000000 survived
D908-2 14.9 15.2 226.48 13500 60 10000000 survived
D908-3 14.9 15.2 226.48 11250 50 10000000 survived
D908-4 14.9 15.25 227.225 9090 40 10000000 survived
D908-5 14.9 15.25 227.225 15930 70 10000000 survived
D908-6 14.9 15.2 226.48 18090 80 10000000 survived
D908-7 14.9 15.2 226.48 22680 100 10000000 survived
D908-8 14.9 15.2 226.48 33930 150 859322 –
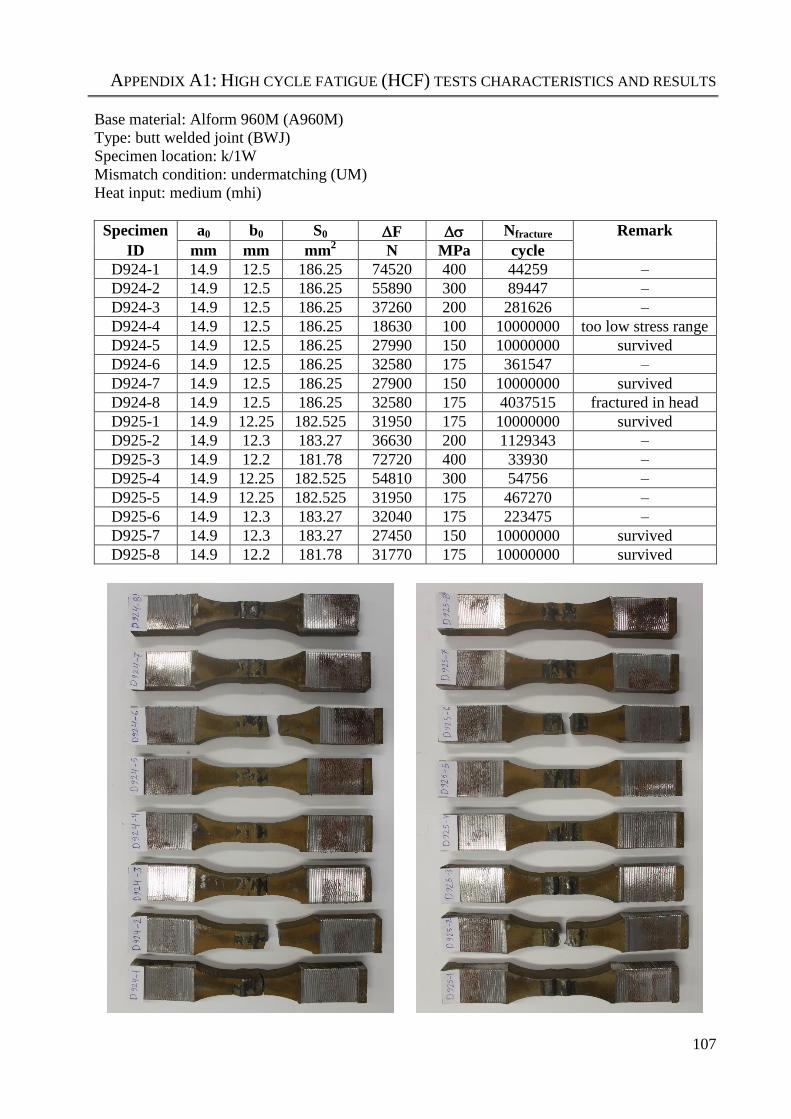
APPENDIX A1: HIGH CYCLE FATIGUE (HCF) TESTS CHARACTERISTICS AND RESULTS
107
Base material: Alform 960M (A960M)
Type: butt welded joint (BWJ)
Specimen location: k/1W
Mismatch condition: undermatching (UM)
Heat input: medium (mhi)
Specimen a0 b0 S0 F Nfracture Remark
ID mm mm mm2 N MPa cycle
D924-1 14.9 12.5 186.25 74520 400 44259 –
D924-2 14.9 12.5 186.25 55890 300 89447 –
D924-3 14.9 12.5 186.25 37260 200 281626 –
D924-4 14.9 12.5 186.25 18630 100 10000000 too low stress range
D924-5 14.9 12.5 186.25 27990 150 10000000 survived
D924-6 14.9 12.5 186.25 32580 175 361547 –
D924-7 14.9 12.5 186.25 27900 150 10000000 survived
D924-8 14.9 12.5 186.25 32580 175 4037515 fractured in head
D925-1 14.9 12.25 182.525 31950 175 10000000 survived
D925-2 14.9 12.3 183.27 36630 200 1129343 –
D925-3 14.9 12.2 181.78 72720 400 33930 –
D925-4 14.9 12.25 182.525 54810 300 54756 –
D925-5 14.9 12.25 182.525 31950 175 467270 –
D925-6 14.9 12.3 183.27 32040 175 223475 –
D925-7 14.9 12.3 183.27 27450 150 10000000 survived
D925-8 14.9 12.2 181.78 31770 175 10000000 survived
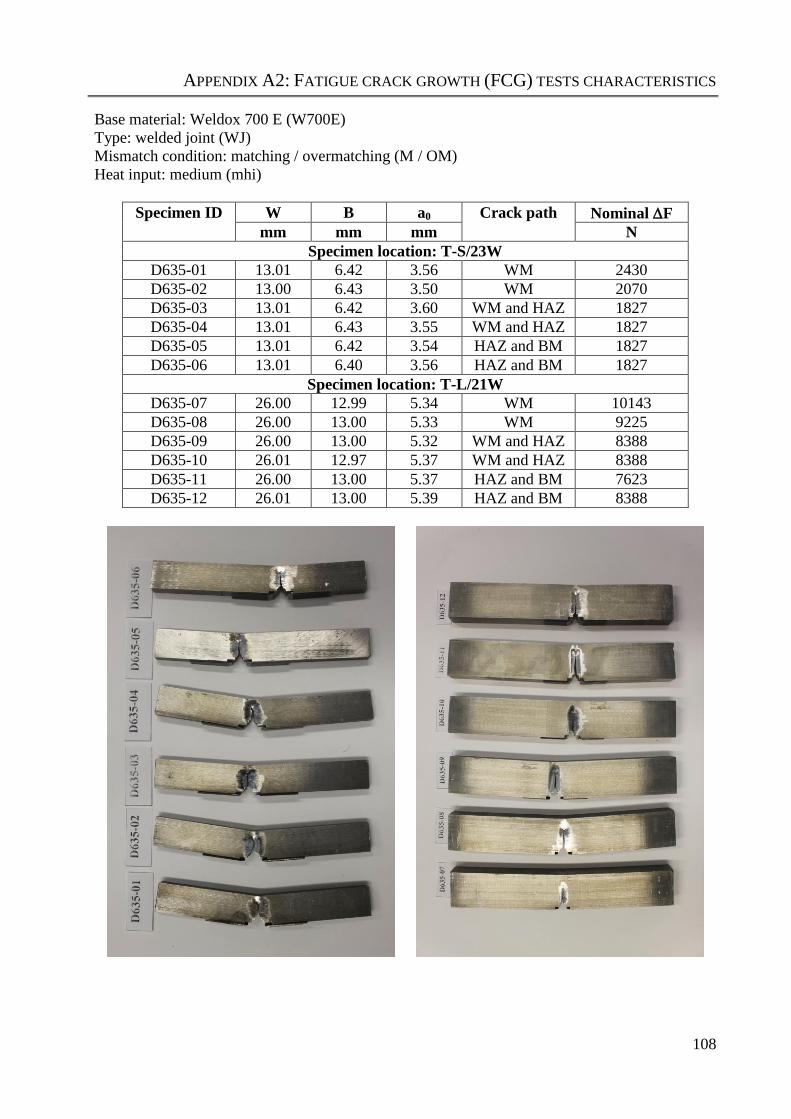
APPENDIX A2: FATIGUE CRACK GROWTH (FCG) TESTS CHARACTERISTICS
108
Base material: Weldox 700 E (W700E)
Type: welded joint (WJ)
Mismatch condition: matching / overmatching (M / OM)
Heat input: medium (mhi)
Specimen ID W B a0 Crack path Nominal F
mm mm mm N
Specimen location: T-S/23W
D635-01 13.01 6.42 3.56 WM 2430
D635-02 13.00 6.43 3.50 WM 2070
D635-03 13.01 6.42 3.60 WM and HAZ 1827
D635-04 13.01 6.43 3.55 WM and HAZ 1827
D635-05 13.01 6.42 3.54 HAZ and BM 1827
D635-06 13.01 6.40 3.56 HAZ and BM 1827
Specimen location: T-L/21W
D635-07 26.00 12.99 5.34 WM 10143
D635-08 26.00 13.00 5.33 WM 9225
D635-09 26.00 13.00 5.32 WM and HAZ 8388
D635-10 26.01 12.97 5.37 WM and HAZ 8388
D635-11 26.00 13.00 5.37 HAZ and BM 7623
D635-12 26.01 13.00 5.39 HAZ and BM 8388
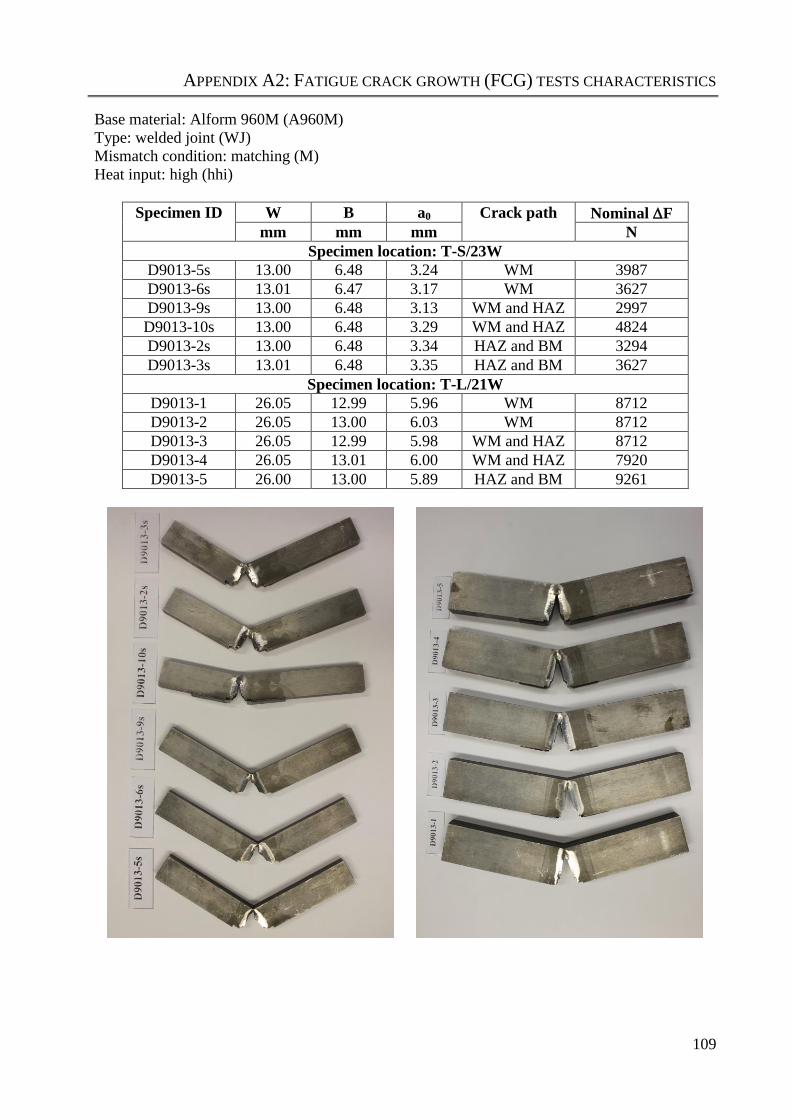
APPENDIX A2: FATIGUE CRACK GROWTH (FCG) TESTS CHARACTERISTICS
109
Base material: Alform 960M (A960M)
Type: welded joint (WJ)
Mismatch condition: matching (M)
Heat input: high (hhi)
Specimen ID W B a0 Crack path Nominal F
mm mm mm N
Specimen location: T-S/23W
D9013-5s 13.00 6.48 3.24 WM 3987
D9013-6s 13.01 6.47 3.17 WM 3627
D9013-9s 13.00 6.48 3.13 WM and HAZ 2997
D9013-10s 13.00 6.48 3.29 WM and HAZ 4824
D9013-2s 13.00 6.48 3.34 HAZ and BM 3294
D9013-3s 13.01 6.48 3.35 HAZ and BM 3627
Specimen location: T-L/21W
D9013-1 26.05 12.99 5.96 WM 8712
D9013-2 26.05 13.00 6.03 WM 8712
D9013-3 26.05 12.99 5.98 WM and HAZ 8712
D9013-4 26.05 13.01 6.00 WM and HAZ 7920
D9013-5 26.00 13.00 5.89 HAZ and BM 9261
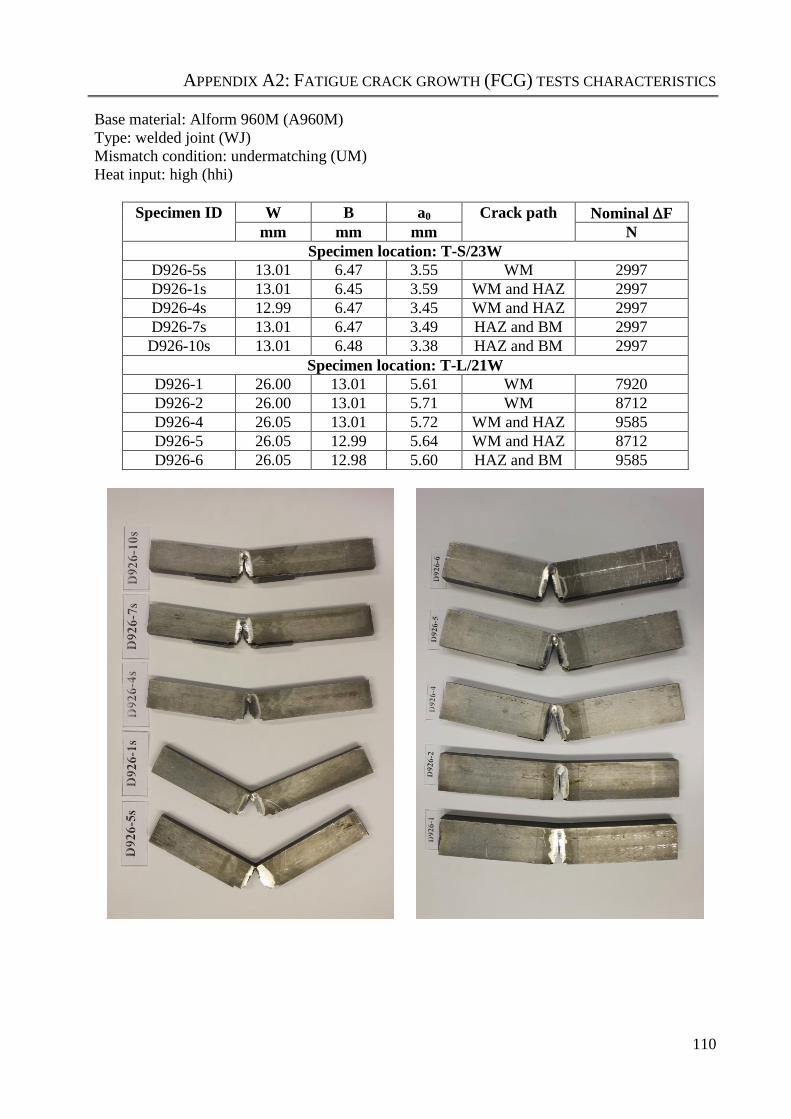
APPENDIX A2: FATIGUE CRACK GROWTH (FCG) TESTS CHARACTERISTICS
110
Base material: Alform 960M (A960M)
Type: welded joint (WJ)
Mismatch condition: undermatching (UM)
Heat input: high (hhi)
Specimen ID W B a0 Crack path Nominal F
mm mm mm N
Specimen location: T-S/23W
D926-5s 13.01 6.47 3.55 WM 2997
D926-1s 13.01 6.45 3.59 WM and HAZ 2997
D926-4s 12.99 6.47 3.45 WM and HAZ 2997
D926-7s 13.01 6.47 3.49 HAZ and BM 2997
D926-10s 13.01 6.48 3.38 HAZ and BM 2997
Specimen location: T-L/21W
D926-1 26.00 13.01 5.61 WM 7920
D926-2 26.00 13.01 5.71 WM 8712
D926-4 26.05 13.01 5.72 WM and HAZ 9585
D926-5 26.05 12.99 5.64 WM and HAZ 8712
D926-6 26.05 12.98 5.60 HAZ and BM 9585
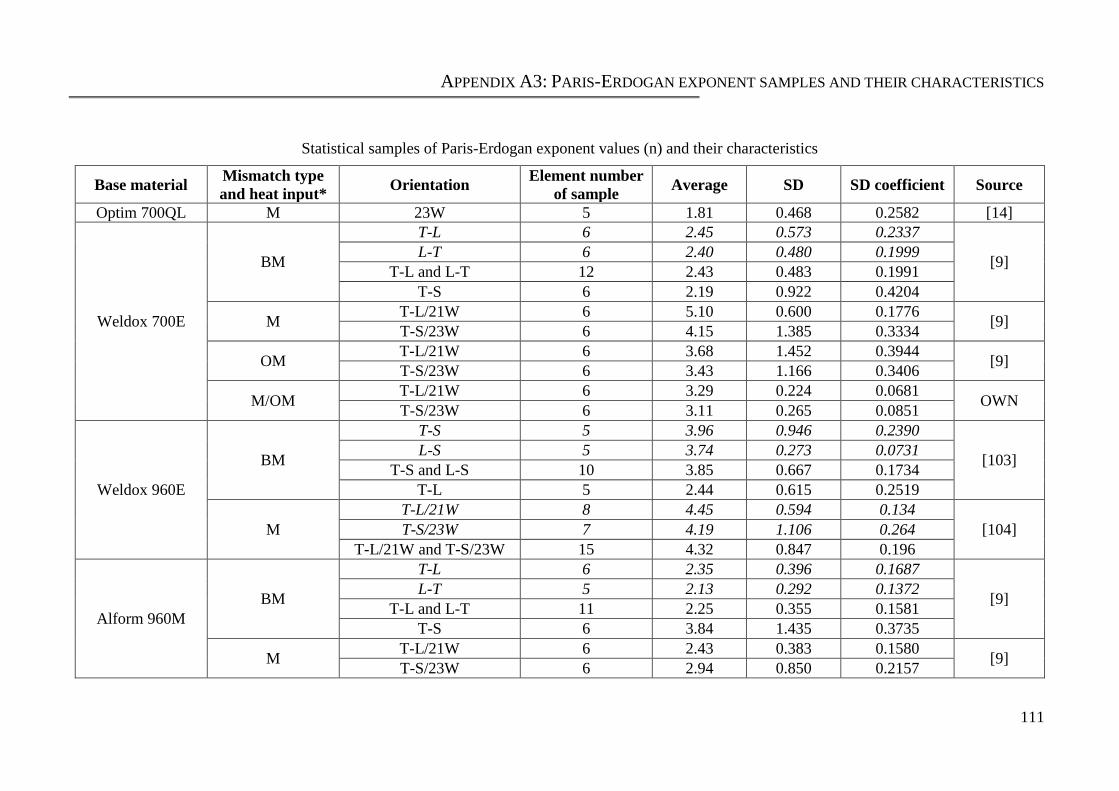
APPENDIX A3: PARIS-ERDOGAN EXPONENT SAMPLES AND THEIR CHARACTERISTICS
111
Statistical samples of Paris-Erdogan exponent values (n) and their characteristics
Base material Mismatch type
and heat input* Orientation
Element number
of sample Average SD SD coefficient Source
Optim 700QL M 23W 5 1.81 0.468 0.2582 [14]
Weldox 700E
BM
T-L 6 2.45 0.573 0.2337
[9] L-T 6 2.40 0.480 0.1999
T-L and L-T 12 2.43 0.483 0.1991
T-S 6 2.19 0.922 0.4204
M T-L/21W 6 5.10 0.600 0.1776
[9] T-S/23W 6 4.15 1.385 0.3334
OM T-L/21W 6 3.68 1.452 0.3944
[9] T-S/23W 6 3.43 1.166 0.3406
M/OM T-L/21W 6 3.29 0.224 0.0681
OWN T-S/23W 6 3.11 0.265 0.0851
Weldox 960E
BM
T-S 5 3.96 0.946 0.2390
[103] L-S 5 3.74 0.273 0.0731
T-S and L-S 10 3.85 0.667 0.1734
T-L 5 2.44 0.615 0.2519
M
T-L/21W 8 4.45 0.594 0.134
[104] T-S/23W 7 4.19 1.106 0.264
T-L/21W and T-S/23W 15 4.32 0.847 0.196
Alform 960M
BM
T-L 6 2.35 0.396 0.1687
[9] L-T 5 2.13 0.292 0.1372
T-L and L-T 11 2.25 0.355 0.1581
T-S 6 3.84 1.435 0.3735
M T-L/21W 6 2.43 0.383 0.1580
[9] T-S/23W 6 2.94 0.850 0.2157
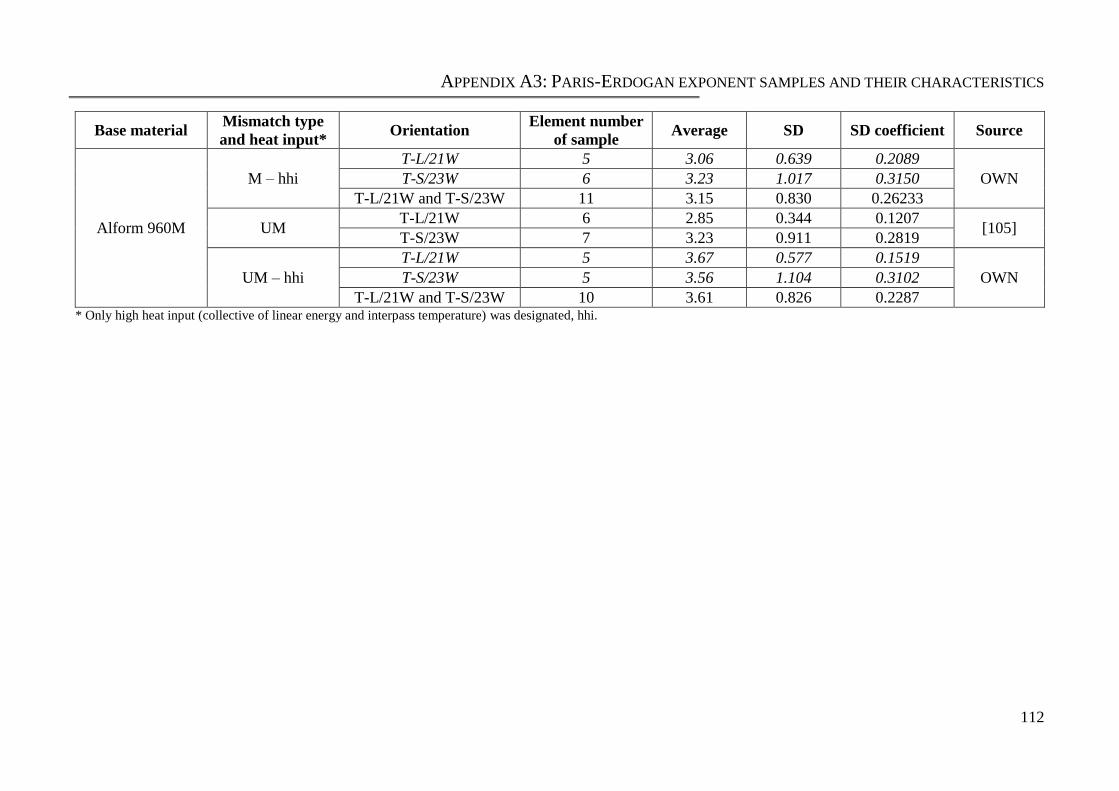
APPENDIX A3: PARIS-ERDOGAN EXPONENT SAMPLES AND THEIR CHARACTERISTICS
112
Base material Mismatch type
and heat input* Orientation
Element number
of sample Average SD SD coefficient Source
Alform 960M
M – hhi
T-L/21W 5 3.06 0.639 0.2089
OWN T-S/23W 6 3.23 1.017 0.3150
T-L/21W and T-S/23W 11 3.15 0.830 0.26233
UM T-L/21W 6 2.85 0.344 0.1207
[105] T-S/23W 7 3.23 0.911 0.2819
UM – hhi
T-L/21W 5 3.67 0.577 0.1519
OWN T-S/23W 5 3.56 1.104 0.3102
T-L/21W and T-S/23W 10 3.61 0.826 0.2287 * Only high heat input (collective of linear energy and interpass temperature) was designated, hhi.