STRIATIONS RESULTING FROM FATIGUE CRACK ......Using the incremental crack length measurements from...
10
STRIATIONS RESULTING FROM FATIGUE CRACK GROWTH IN DENTIN Devendra Bajaj 1 , Narayana Sundaram 1 , Dwayne Arola 1, 2 1 Department of Mechanical Engineering, University of Maryland, Baltimore County 1000 Hilltop Circle, Baltimore, MD, 21250 2 Department of Endodontics, Prosthodontics, and Operative Dentistry, Baltimore College of Dental Surgery, University of Maryland 666 West Baltimore Street, Baltimore, MD, 21201 ABSTRACT The primary objective of this study was to evaluate the striation spacing resulting from fatigue crack growth in dentin of human teeth. Compact tension (CT) specimens obtained from coronal dentin of patients of two age groups (young < 37 years and old > 50 years) were subjected to cyclic Mode I loads. Fracture surfaces of the CT specimens were examined using a scanning electron microscope (SEM) and contact profilometer. A power spectrum analysis of the surface profiles showed that the striation spacing ranged from 50 to 170 μm. In old dentin (125 ± 23 μm) the spacing was significantly larger than that in young dentin (93 ± 27 μm), suggesting that the mechanisms contributing to crack tip blunting were potentially suppressed by changes in structure of this tissue with age. Fatigue crack growth striations were also identified and examined on cracks that underwent extension in vivo. The striation spacing for in vivo cracks was within the range resulting from the in vitro evaluation. Results of this study suggest that fatigue crack growth contributes to restored tooth failures and the in vitro approach provides a viable model for evaluating the mechanics and mechanisms of cyclic crack extension in dentin. INTRODUCTION The human tooth is comprised of three distinct tissues, namely enamel, dentin and pulp. Dentin forms the bulk of the tooth by both weight and volume. While serving many functions, dentin provides an elastic foundation for the outermost brittle enamel. It also serves as a protective enclosure for the more sensitive pulp and as a conduit for transferring external stimuli to the nerves. Most importantly, dentin acts as an integral foundation for restorative materials which are placed to restore form and function to damaged or diseased tooth structure. Recent advances in restorative dentistry have led to improvements in the overall oral health of patients. New materials and methods have not only improved the aesthetics of restorations but also their performance. Despite these advances, the failure of restored teeth and tooth fracture is relatively common [1,2]. While it is plausible that fracture in the restored tooth results from a single catastrophic load, it is generally believed that such failures are the result of subcritical cracking induced by repetitive stresses, i.e., fatigue [3]. Damage induced by restorative processes can grow with time due to cyclic stresses resulting from mastication and can enable complete fracture of the tooth [4-7]. A number of in vitro studies on cyclic crack growth in bovine [8-10], elephant [11,12] and human dentin [13-15] have been conducted in the recent past. These studies have been successful in quantifying the fatigue properties of dentin. According to an evaluation of the mechanisms of fatigue crack growth in dentin, cyclic extension is comprised of crack-tip blunting and resharpening [12]. Fatigue failures in metals are often evaluated in terms of striations on the fractured surfaces. Yet, no study has identified fatigue striations resulting from cyclic crack extension in 1
Transcript of STRIATIONS RESULTING FROM FATIGUE CRACK ......Using the incremental crack length measurements from...
STRIATIONS RESULTING FROM FATIGUE CRACK GROWTH IN DENTIN Devendra Bajaj1, Narayana Sundaram1, Dwayne Arola1, 2
1Department of Mechanical Engineering, University of Maryland, Baltimore County 1000 Hilltop Circle, Baltimore, MD, 21250 2Department of Endodontics, Prosthodontics, and Operative Dentistry, Baltimore College of Dental Surgery, University of Maryland 666 West Baltimore Street, Baltimore, MD, 21201 ABSTRACT
The primary objective of this study was to evaluate the striation spacing resulting from fatigue crack growth in dentin of human teeth. Compact tension (CT) specimens obtained from coronal dentin of patients of two age groups (young < 37 years and old > 50 years) were subjected to cyclic Mode I loads. Fracture surfaces of the CT specimens were examined using a scanning electron microscope (SEM) and contact profilometer. A power spectrum analysis of the surface profiles showed that the striation spacing ranged from 50 to 170 μm. In old dentin (125 ± 23 μm) the spacing was significantly larger than that in young dentin (93 ± 27 μm), suggesting that the mechanisms contributing to crack tip blunting were potentially suppressed by changes in structure of this tissue with age. Fatigue crack growth striations were also identified and examined on cracks that underwent extension in vivo. The striation spacing for in vivo cracks was within the range resulting from the in vitro evaluation. Results of this study suggest that fatigue crack growth contributes to restored tooth failures and the in vitro approach provides a viable model for evaluating the mechanics and mechanisms of cyclic crack extension in dentin.
INTRODUCTION The human tooth is comprised of three distinct tissues, namely enamel, dentin and pulp. Dentin forms the bulk of the tooth by both weight and volume. While serving many functions, dentin provides an elastic foundation for the outermost brittle enamel. It also serves as a protective enclosure for the more sensitive pulp and as a conduit for transferring external stimuli to the nerves. Most importantly, dentin acts as an integral foundation for restorative materials which are placed to restore form and function to damaged or diseased tooth structure. Recent advances in restorative dentistry have led to improvements in the overall oral health of patients. New materials and methods have not only improved the aesthetics of restorations but also their performance. Despite these advances, the failure of restored teeth and tooth fracture is relatively common [1,2]. While it is plausible that fracture in the restored tooth results from a single catastrophic load, it is generally believed that such failures are the result of subcritical cracking induced by repetitive stresses, i.e., fatigue [3]. Damage induced by restorative processes can grow with time due to cyclic stresses resulting from mastication and can enable complete fracture of the tooth [4-7]. A number of in vitro studies on cyclic crack growth in bovine [8-10], elephant [11,12] and human dentin [13-15] have been conducted in the recent past. These studies have been successful in quantifying the fatigue properties of dentin. According to an evaluation of the mechanisms of fatigue crack growth in dentin, cyclic extension is comprised of crack-tip blunting and resharpening [12].
Fatigue failures in metals are often evaluated in terms of striations on the fractured surfaces. Yet, no study has identified fatigue striations resulting from cyclic crack extension in
1
hard tissues such as bones and dentin and enamel of the tooth. It has been suggested that striations are masked by the underlying structure of dentin [11]. The primary objective of this study was to show that cyclic crack growth in dentin results in fatigue striations and to use these features to further evaluate the mechanisms of crack extension. In addition, a correlation was drawn between the in vitro and in vivo tooth failures. MATERIALS AND METHODS Unrestored human molars were obtained from participating clinics within the state of Maryland and the whole body morgue of Stanford University. All methods of acquisition and storage were in compliance with an approved protocol issued by the Institutional Review Board (IRB) of the University of Maryland.
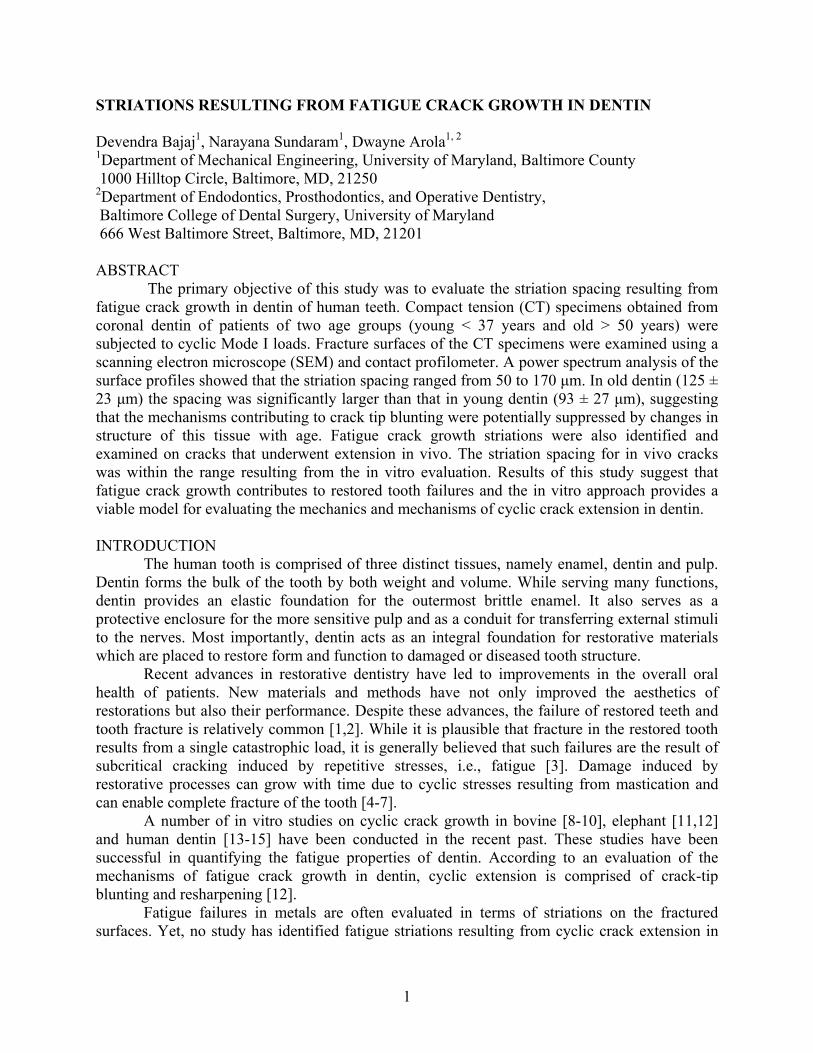
Immediately after extraction, and throughout all aspects of the study, the teeth were stored in Hank’s Balanced Salt Solution (HBSS) with record of age and gender of the patient. The extracted molars were molded in a polymer resin and sectioned using a computer controlled slicer/grinder with water based coolant. Diamond slicing wheels were used to obtain primary sections from the molars (Fig. 1(a)). Secondary sections were then introduced to obtain compact tension (CT) specimens (Fig. 1(b)) with overall geometry patterned after ASTM standard E647 [16] for fatigue crack growth (Fig 1(c)).
(a) ( )
(b)
θ = 0o
θ = 45o
θ = 90o
(c)
Fig. 1. A dentin CT specimen from a human third molar. (a) A primary section and possible specimen (b) complete dentin CT specimen (c) final geometry of the CT specimen and definition of tubule orientations.
A channel of 1 mm depth was introduced on the back of all the specimens to limit crack curving that occurs with some tubule orientations (Fig. 1(c)). Precision holes (0.7 mm and 1.0
2

mm diameter) were counterbored to the depth of channel to ensure application of opening mode (Mode I) loads. A sharp razor blade was used to insert a chevron notch in the specimen. Lastly, the front face of each specimen (without backchannel) was darkened using an indelible marker.
A universal testing system1 was used for fatigue testing of the prepared specimens. This machine has a resolution of ± 0.01 N and the maximum load capacity is 225 N. The specimen was mounted on a specially designed fixture and restrained using two stainless steel pins (Fig. 2(a)). Mode I cyclic loads were applied to the CT specimen within an HBSS hydration bath at room temperature (22oC). To initiate a crack from the notch, a sinusoidal load was applied under load control with peak loads between 8 N and 16 N. A loading frequency of 5 Hz was chosen to balance concerns associated with frequency of mastication and the duration of time required to complete the individual tests. A stress ratio (R) of 0.5 was used for crack initiation.
Crack length measurements were conducted visually using a back lighting technique in which the back surface (with channel) was illuminated with white light and inspection of the crack length occurred on the stained face. Due to the partially transparent nature of dentin, the transmitted light underwent diffraction on the crack face and resulted in illumination of the crack tip (Fig. 2(b)). Inspection of the crack length was conducted using an optical microscope (100X) with scaled reticule. Following the initiation process, cyclic loading was resumed using R=0.1 to propagate a crack in the dentin specimen. Measurements of the change in crack length (∆a) were made over specific intervals of fatigue loading until complete specimen fracture. The number of cycles between measurements (∆N) was chosen according to the observed crack growth rate and typically ranged between 10 and 25 kcycles.
250 µm (b)2.5 mm
250 µm
(a) Fig. 2. Experimental setup for fatigue testing of dentin specimen. (a) a CT specimen mounted on special grips of an EnduraTec ELF 3200 system, (b) back illumination of a crack (arrow indicated crack tip).
Using the incremental crack length measurements from fatigue testing, the fatigue crack growth rate (da/dN) for the steady state response was modeled using the Paris Law [17] according to
1 EnduraTEC ELF 3200, BOSE Cooperation, Eden Prairie, MN, USA.
3

(1)
m)K(CdNda
Δ= where ∆K is the stress intensity range, and da and dN represent the incremental crack extension (∆a) and number of cycles (∆N), respectively and the quantities C and m are the fatigue crack growth coefficient and exponent, respectively. The ∆K is determined from the difference in stress intensity at the minimum and maximum loads and can be estimated according to [15].
)211.0320.0131.0(1B1B
WBPK 2
*
*α+α+⎟
⎠⎞
⎜⎝⎛
++Δ=Δ
(2)
where B and B* are the specimen thickness and the ligament thickness, respectively and α = a/W as shown in Figure 1(c). After completion of the fatigue crack growth test, the fractured CT specimens were removed from the hydration bath and dehydrated in air for at least 72 hours. The fractured surface of the dehydrated dentin specimens were then coated with gold palladium using a cold sputter machine2. In order to identify striations on the fractured surface, micrographs were obtained using a scanning electron microscope3 (SEM) in the secondary electron imaging mode (SEI). A profilometer4 with 5 μm probe diameter was used to evaluate the surface topography of the fractured specimens. The typical traverse length of the probe ranged from 1 mm to 2 mm depending upon the length of steady state (Region II) crack growth. A cutoff length measuring one fifth of traverse length was used to obtain 8000 data points per profile. An analysis of the power spectrum density (PSD) of profiles was conducted to quantify the primary wavelength of the fatigue striations. RESULTS
The Paris Law parameters (C and m) were estimated from the fatigue crack growth response. Table 1 shows the parameters determined for young hydrated specimens with tubule orientation of 0o, 45o and 90o and for old hydrated specimens with tubule orientation of 90o. Note that the fatigue crack growth coefficient (C) and crack growth exponent (m) for old hydrated dentin was significantly different from that of young hydrated dentin. Details of the effect of aging on mechanical properties of dentin are described elsewhere [15,18]. Table 1. Paris Law parameters for the human dentin specimens.
Paris Law Parameters Age group Tubule
Orientation m C (mm/cycle).(MPa.m0.5)-m
0o 12.5 ± 1.8 1.57E-05 45o 11.1 ± 1.8 8.18E-05 Young 90o 13.3 ± 1.1 1.76E-05
Old 90o 21.2 ± 3.3 6.27E-03
2 Model LLC Desk II, Denton vacuum, Moorestown, NJ, USA. 3 Model JSM-5600, JEOL, Peabody, MA, USA. 4 Model LV-50E, Hommelwerke, Rochester Hills, MI, USA.
4

A total of 20 fractured CT specimens were examined in the SEM. Regardless of age, more than 60% of specimens with tubules orientation of 90o showed visible striations. In specimens with tubule orientation of 0o and 45o, striations were less visible and exhibited less definite pattern.
A fracture surface from a CT specimen (male 50 years age) is shown in Figure 3. The image shows two distinct regions of crack growth corresponding to fatigue and fracture. The three regions of cyclic extension are also highlighted. Fatigue striations resulting from cyclic crack growth are clearly visible in Region II. Note that the striation spacing is location dependent and increases with ∆K, particularly near the transition of Region II and Region III. Figure 4 (a) and (b) show SEM images of fracture surfaces from a young (male 17 years age) molar and old (male 50 years age) molar. Both images show evidence of striations resulting from cyclic crack extension.
Fig. 3. Fracture surface of a CT specimen (male 50 years age) with 90o tubule orientation. Striations are visible in the Region II of crack growth. The large arrow indicates the direction of crack growth.
Region III Region I Region II
200 μm
Fatigue Fracture
100 um(a)
(b) 100 um Fig. 4. Fracture surfaces of CT specimen with 90o tubule orientation. Fatigue striations visible on surface of dentin (a) male 17 years age (b) male 50 years age. The arrow indicates the direction of crack growth. Note the difference in average striation spacing between (a) and (b).
Surface profiles were obtained from 20 CT specimens using a contact profilometer. For
each specimen, two profiles of the fracture surface were obtained at different locations in
5

Region II. The average surface roughness (Ra) and ten point roughness (Rz) are listed in Table 2. Both the Ra and Rz increased from the 90o orientation, to 45o and then to the 0o orientation. For old dentin (θ=90o) the values of Ra and Rz were smaller than those for young dentin.
Table 2. A comparison of surface roughness in Region II fatigue crack growth in dentin.
Roughness (μm) Roughness (μm) Age group Tubule Orientation Ra Rz 0o 2.5 ± 0.5 12.2 ± 1.7 45o 2.1 ±1.0 10.6 ± 4.1 Young 90o 1.6 ±0.4 7.9 ± 2.1
Old 90o 1.5 ± 0.4 7.4 ± 2.2 The power spectrum density (PSD) was generated from the surface profiles using
commercial software5. Figure 5(a) shows the power spectrum for the fracture surface of a CT specimen from a young (male 17 years age) patient. Two peaks were obtained at 118 μm and 170 μm.
0
2000
4000
6000
8000
10000
0 0.005 0.01 0.015 0.02
Pow
er
Frequency (1/μm)
Wavelength = 155 μm
0
2000
4000
6000
8000
10000
0 0.005 0.01 0.015 0.02
Pow
er
Frequency (1/μm)
Wavelength = 118 μm
Fig. 5. Results from power spectrum analysis for young and old dentin. (a) Power vs Frequency for young (male 17 years age) dentin. A wavelength of 118 μm is visible and gives the largest inflection on the integral vs wavelength curve. (b) Power vs Frequency for old (male 50 years age) dentin. Wavelengths of 120 μm and 155 μm are visible with maximum inflection at 155 μm.
101
102
103
104
105
106
107
108
101 102 103
Inte
gral
Wavelength (μm)
101
102
103
104
105
106
107
108
101 102 103
Inte
gral
(a) Wavelength (μm)
(b)
65 Version 7.0.1, MATLAB, Natick, MA, USA.

Similarly, the power spectrum for a CT specimen from an old (male 50 years age) patient (Fig. 5(b)) exhibits two peaks at 120 μm and 155 μm. To obtain an accurate measure of the primary cyclic wavelength, an integral curve was generated for the power as a function of wavelength. The maximum change in slope (inflection) of this curve was identified and used in defining the dominant wavelength (i.e. striation spacing). The integral curve on Figure 5(a) shows a maximum change in slope at 118 μm and for Figure 5(b) gave a maximum change in slope at 155 μm. The results from the power spectrum analysis were then compared with the striation spacing on SEM images of dentin specimens (Fig. 4(a),(b)) to confirm the analysis.
The dominant wavelengths (mean ± S.D.) for young and old dentin specimens are listed in Table 3. The primary cyclic wavelength for young dentin with tubule orientations θ=0o and θ=45o was 81 ± 21 μm and 71 ± 17 μm, respectively. According to an ANOVA (4-independent samples) and Tukey’s HSD (Honestly Significant Difference) test, the primary cyclic wavelength for old (θ=90o) dentin was significantly different (125 ± 23 μm, p<0.05) when compared with young (θ=90o) dentin (93 ± 27 μm). However, there was no statistically significant difference in wavelength within the young age group. Table 3. Power spectrum analysis of the fatigue crack growth surfaces.
Tukey’s HSD test (p) Young Old Age Group Tubule
Orientation Number of
Specimens N Wavelength
(μm) 45o 90o 90o
0o 5 81 ± 21 n/s n/s p<0.01 45o 4 71 ± 17 - n/s p<0.01 Young 90o 5 93 ± 27 - - p<0.05
Old 90o 6 125 ± 23 - - - n/s - non significant
Fatigue striations were also identified and examined on cracks that underwent extension in vivo. Extracted restored molars were sectioned axially along the buccal-lingual plane using a slicer/grinder and the sections were then examined under a low magnification microscope (X10) for flaws and cracks. More than 50% of the teeth examined had cracks originating at the line angles along the prepared cavity. In general, they propagated outward into the dentin and perpendicular to the dentinal tubules. Examples are shown in Figure 6.
500 μm
500 μm
(a) Age = 70 years (b) Age = 32 years Fig. 6. Cracks in restored teeth originating from the line angle and extending in the coronal dentin.
7
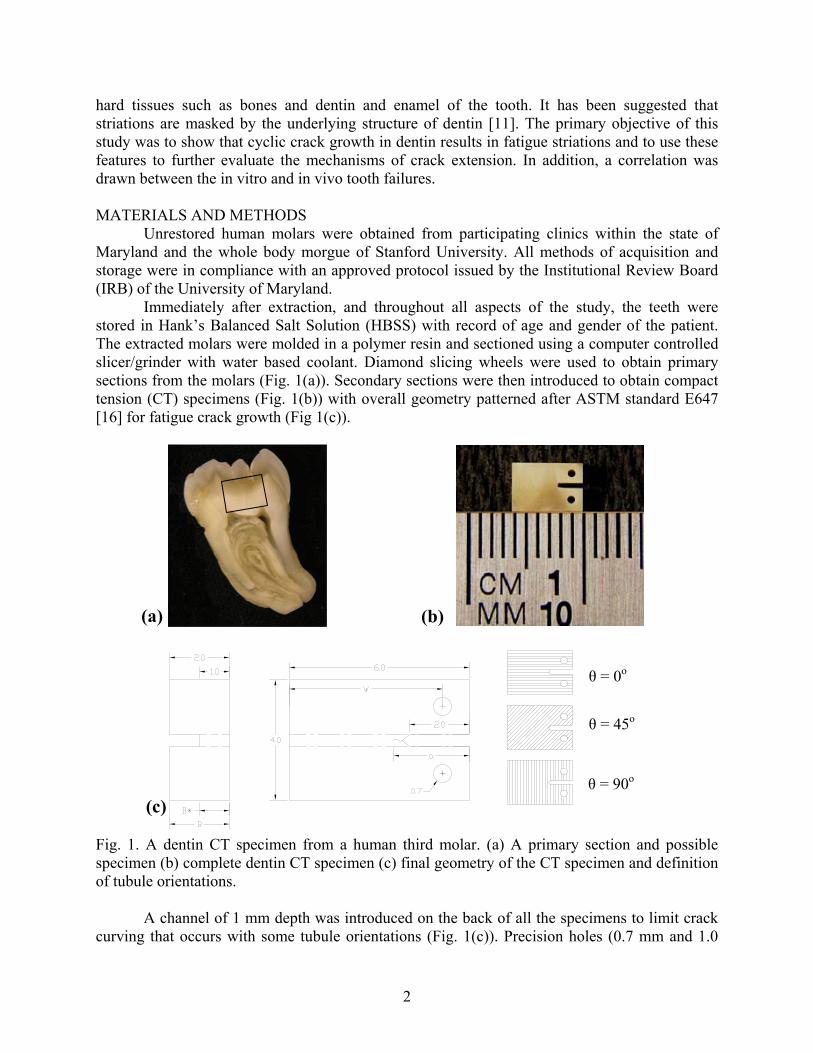
Similar cracks in the dentin of restored teeth were reported by Arola et al. [9]. The sectioned teeth were then broken along the crack and the fracture surface was examined using profilometry and power spectrum analysis. An SEM image of the fracture surface in dentin of a restored tooth obtained from a male 32 years age patient is shown in Figure 7(a). The power spectrum for this surface is shown in Figure 7 (b). Two peaks are visible at wavelengths of 85 μm and 113 μm.
0
1000
2000
3000
4000
5000
0 0.005 0.01 0.015 0.02
Pow
er
Frequency (1/μm)
Wavelength = 113 μm
Wavelength = 85 μm
(b)
(a) Fig. 7. Striations on fracture surface of restored tooth obtained from a male 32 year old patient. (a) SEM image of surface of restored tooth, (b) Power spectrum analysis of the surface in (a). Note that the wavelengths are within the range obtained from the in vitro analysis. DISCUSSION
An evaluation of fracture surfaces resulting from fatigue crack growth in extracted human teeth showed that striations are evident. A quantitative analysis of the fracture surface topography was performed to identify the primary cyclic wavelength. The wavelength for old dentin (125 ± 23 μm) was significantly higher (p<0.05) than that of young dentin, regardless of tubule orientation. If striations are formed by a cyclic process of extension and blunting, the results suggest that crack tip blunting is less active in old dentin. While striations formed by fatigue crack growth in metals are formed every cycle [19], the relatively low number of striations on the CT specimens indicates that this is not the case for dentin.
Recent evaluations by the authors have shown that the fatigue crack growth rate in old dentin is significantly faster (X100) than that in young dentin at the same level of driving force [15]. To further understand the changes in cyclic crack extension with aging, an estimate of the number of cycles between each striation was performed using previously reported results for average crack growth rates in dentin [15]. Figure 8 shows the average number of cycles required for striation spacing of 93 ± 27 μm for young and 125 ± 23 μm for old dentin to grow as a function of stress intensity range (∆K). For a ∆K of 0.83 MPa.m0.5 (typical of Region II growth), approximately 60,000 cycles are required to extend a crack 93 μm in young dentin. At the same ∆K, a striation length of 125 μm in old dentin required only 1000 cycles of crack extension.
8

Fig. 8. The number of cycles required for a crack to extend a length equivalent to the dominant striation spacing.
101
102
103
104
105
106
0.70 0.75 0.80 0.85 0.90 0.95 1.0
Young Old
Num
ber o
f Cyc
les
ΔK (MPa*m0.5)
An evaluation of cracks found in a restored tooth and grown in vivo was also conducted.
The results from this evaluation showed that the striation spacing found on the fracture surface of restored teeth was within the range found in the in vitro evaluation. Thus, through similarities in fracture surfaces, fatigue and fatigue crack growth is indeed a major contributor to fracture of restored teeth and the in vitro approach used to examine crack extension is a viable model to evaluate both the mechanics and mechanisms of cyclic crack extension in human teeth. CONCLUSIONS An experimental evaluation of the influence of tubule orientation and aging on fatigue striations in dentin was conducted. According to a comparison of fatigue striations resulting from in vitro experiments and in vivo extension, the following conclusions were drawn:
(1) Fatigue crack growth striations were identified on fracture surfaces of dentin specimens and restored teeth. The striations are believed to be a result of blunting and subsequent resharpening of the crack tip.
(2) In young hydrated dentin, the striation spacing ranged from 71 ± 17 µm for θ=45° to 93 ± 27 µm for θ=90o. The highest wavelength was found in old dentin (125 ± 23 µm) with θ=90o. The larger striation spacing on fracture surfaces of old dentin suggests that aging suppresses the mechanism of blunting of the crack tip.
(3) The primary wavelength of striations on the fracture surface of restored teeth was consistent with those resulting from in vitro experiments and suggests that tooth fracture is indeed a result of fatigue and fatigue crack growth.
REFERENCES 1C.E. Cameron, “The cracked tooth syndrome: Additional findings,” JADA., 93, 971-5
(1976).
9

2W. Geurtsen, R. Schwarze, H Gunay, “Diagnosis, therapy, and prevention of the cracked tooth syndrome,” Quintessence. Int., 34, 409-17 (2003).
3H.W.A. Wislott, J.I. Nicholls, C. Belser, “Stress fatigue: basic principles and prosthodontic implication’s,” Int. J. Prosthodont., 8, 105-16 (1995).
4M.E. Gher, R.M. Dunlap, M.H. Anderson, L.V. Kuhl, “Clinical survey of fractured teeth,” JADA, 114,174-7 (1987). 5H. Letzel, “Survival rates and reasons for failure of posterior composite restorations in multicentre clinical trial,” J. Dent., 17, S10-7 (1989). 6F.J. Burke. “Tooth fracture in vivo and in vitro.” J. Dent., 20, 131-9 (1992).
7D. Arola, M.P. Huang, M.B. Sultan. “The failure of amalgam dental restorations due to cyclic fatigue crack growth, ” J. Mater. Sci., 10, 319-27 (1999).
8K Tonami, H. Takahashi, “Effects of aging on tensile fatigue strength of bovine dentin,” Dent. Mater., 16, 156-86 (1997).
9D. Arola, J.A. Rouland, D. Zhang, “Fatigue and fracture of bovine dentin.” Exp. Mech., 42, 380-8 (2002).
10D. Arola, J.A. Rouland, “The effects of tubule orientation on fatigue crack growth in dentin,” J. Biomed. Mater. Res., 67, 78-86 (2003).
11J.J Kruzic, R.K. Nalla, J.H. Kinney, R.O. Ritchie, “Crack blunting, crack bridging and resistance-curve fracture mechanics in dentin: effect of hydration,” Biomaterials, 24, 5209-21 (2003).
12J.J. Kruzic, R.K. Nalla, J.H. Kinney, R.O. Ritchie, “Mechanistic aspects of in vitro fatigue-crack growth in dentin,” Biomaterials, 26, 1195-204 (2005). 13R.K. Nalla, V. Imbeni, J.H. Kinney, S.J. Marshall, R.O. Ritchie, “In vitro fatigue behavior of human dentin with implications for life prediction,” J. Biomed. Mater. Res., 66, 10-20 (2003). 14R.K. Nalla, J.H. Kinney, S.J. Marshall, R.O. Ritchie, “On the in vitro fatigue behavior of human dentin: effect of mean stress,” J. Dent. Res., 83, 211-5 (2004).
15D. Bajaj, N. Sundaram, A. Nazari, D. Arola, “Age, dehydration and fatigue crack growth in Dentin,” Biomaterials, 27, 2507-17 (2006).
16ASTM E647, Standard Test Method for Measurement of Fatigue Crack Growth Rates, In Annual Book of ASTM Standards, Philadelphia PA: American Society for Testing and Materials, (2000).
17P.C. Paris, F. Erdogan, “A Critical Analysis of Crack Propagation Laws,” J. Basic. Eng., 85, 528-32 (1963).
18D. Arola, R.K. Reprogel, “Effects of aging on the mechanical behavior of human dentin,” Biomaterials, 26, 4051-61 (2005). 19C.R. Brooks, A. Choudhury, Failure Analysis of Engineering Materials, McGraw-Hill (2002).
10