The Effect of Residual Stress and Crack Closure on Fatigue Crack
305
University of Wollongong Research Online University of Wollongong Thesis Collection University of Wollongong Thesis Collections 1999 The effect of residual stress and crack closure on fatigue crack growth Jonathan Richard Lloyd University of Wollongong Research Online is the open access institutional repository for the University of Wollongong. For further information contact Manager Repository Services: [email protected]. Recommended Citation Lloyd, Jonathan Richard, The effect of residual stress and crack closure on fatigue crack growth, Doctor of Philosophy thesis, Department of Materials Engineering, University of Wollongong, 1999. http://ro.uow.edu.au /theses/1525
-
Upload
tacito-picanco -
Category
Documents
-
view
234 -
download
0
Transcript of The Effect of Residual Stress and Crack Closure on Fatigue Crack

8/10/2019 The Effect of Residual Stress and Crack Closure on Fatigue Crack
http://slidepdf.com/reader/full/the-effect-of-residual-stress-and-crack-closure-on-fatigue-crack 1/304
University of Wollongong
Research Online
University of Wollongong Thesis Collection University of Wollongong Thesis Collections
1999
The effect of residual stress and crack closure onfatigue crack growth
Jonathan Richard LloydUniversity of Wollongong
Research Online is the open access institutional repository for the
University of Wollongong. For further information contact Manager
Repository Services: [email protected].
Recommended CitationLloyd, Jonathan Richard, The effect of residual stress and crack closure on fatigue crack growth, Doctor of Philosophy thesis,Department of Materials Engineering, University of Wollongong, 1999. http://ro.uow.edu.au/theses/1525

8/10/2019 The Effect of Residual Stress and Crack Closure on Fatigue Crack
http://slidepdf.com/reader/full/the-effect-of-residual-stress-and-crack-closure-on-fatigue-crack 2/304

8/10/2019 The Effect of Residual Stress and Crack Closure on Fatigue Crack
http://slidepdf.com/reader/full/the-effect-of-residual-stress-and-crack-closure-on-fatigue-crack 3/304
The Effect of
Residual Stress
and Crack
Closure on Fatigue Crack Growth
A thesis submitted in fulfilment of the requirements for the degree
Doctor
of
Philosophy
from
University of Wollongong
by
Jonathan
R.T.
Lloyd, B.Sc. (Hons.)
Department of Materials Engineering
1999

8/10/2019 The Effect of Residual Stress and Crack Closure on Fatigue Crack
http://slidepdf.com/reader/full/the-effect-of-residual-stress-and-crack-closure-on-fatigue-crack 4/304
1
TABLE OF C ONTENTS
Page#
STATEMENT OF ORIGINALITY viii
ACKNOWLEDGEMENTS ix
ABSTRACT x
SYMBOLS xii
1. INTRODUCTION 1.1
2. LITERATURE REVIEW: FATIGUE CRACK GROWTH 2.1
2.1 The three stages of fatigue crack growth 2.1
2.1.1 Initiation 2.1
2.1.2 Stage 1 and Stage 2 fatigue crack growth 2.2
2.1.3 Stage 3, Accelerated fatigue crack growth 2.2
2.2 Stage 2 Crack Propagation and Crack Growth Models (Laws) 2.2
2.2.1 Stage 2 fatigue crack growth models based on plastic deformation at the crack
2.2.2 Accumulated damage models 2.7
2.2.3 Energy approaches to stage 2 crack growth 2.8
2.2.4 The "Paris Equation" 2.9
2.3 Fatigue limits 2.10
2.3.1 Short cracks at the fatigue limit and the relationship with the "long crack th
2.3.2 K
c
ma
x as a method of determining AK,
h
2.11
2.3.3 Non-propagating cracks and notched fatigue limits 2.13
2.4 The influence of material properties and microstructure 2.15
2.4.1 The effect of non-metallic inclusions 2.16
2.4.2 The effect of grain size 2.16
2.5 Environmental effects 2.17
REFERENCES 2.21

8/10/2019 The Effect of Residual Stress and Crack Closure on Fatigue Crack
http://slidepdf.com/reader/full/the-effect-of-residual-stress-and-crack-closure-on-fatigue-crack 5/304
ii
3 LITERATURE REVIEW: RESIDUAL STRESSES 3 1
3.1 Scale of residual stresses 3.1
3.2 Origin of Residual Stresses 3.1
3.3 Deliberate generation of residual stresses to improve component performance 3.4
3.4 Precautions commonly employed against residual stress 3.4
3.4.1 Stress Relief by Heat Treatment 3.5
3.4.2 Mechanical Precautions Against Residual Stress 3.7
3.5 Residual Stress Measurement Techniques 3.8
3.5.1 Sectioning and cutting methods 3.8
3.5.2 The hole drilling method 3.9
3.5.3 Ultrasonic Residual Stress Measurement 3.10
3.5.4 Residual Stress Measurement by Diffraction 3.11
3.5.5 Eddy Current and Magneto-elastic Effect Based Methods 3.16
3.5.6 Residual Stress Analysis Using the Thermo-elastic Effect 3.16
REFERENCES 3.17
4 LITERATURE REVIEW: CRACK CLOSURE 4 1
4.1 Influence of mean load and load ratio (R) upon fatigue crack closure 4.2
4.2 Relative importance of closure at increasing AK 4.3
4.3 Mechanisms of crack closure 4.4
4.3.1 Plasticity induced closure 4.6
4.3.2 Oxide induced closure 4.8
4.3.3 Roughness induced crack closure 4.9
4.4 Effect of microstructure on crack closure 4.12
4.5 Measurement of Crack Closure 4.12
4.6 Crack closure mechanism maps 4.14
4.7 Modelling crack closure 4.15
REFERENCES 4.17

8/10/2019 The Effect of Residual Stress and Crack Closure on Fatigue Crack
http://slidepdf.com/reader/full/the-effect-of-residual-stress-and-crack-closure-on-fatigue-crack 6/304
Ill
5. LITERATURE REVIEW: RESIDUAL STRESS AND FATIGUE CRACK
GROWTH 5.1
5.1 Stress intensity factors for residual stress 5.1
5.1.1 Superposition as a means of determining stress intensity factors 5.2
5.1.2 Weight functions and Green's functions 5.5
5.2 Stress intensity factor approach to fatigue crack growth through residual stress fields.... 5.8
5.3 Residual stresses generated by a growing fatigue crack.
5 9
5.4 Redistribution of residual stresses during crack propagation.... 5.10
5.5 Fatigue crack growth through tensile residual stress fields 5.13
5.6 Fatigue crack growth in compressive residual stress fields 5.14
5.7 Welding and residual stress effects 5.16
5.7.1 Application of AK,.ff to fatigue cracks in welded joints 5.17
5.7.2 Distribution of residual stress associated with welded joints 5.18
5.8 Effect of overload cycles on crack propagation 5.18
5.9 Interaction between residual stresses generated by the crack tip plastic zone and macro-scale
residual stresses 5.19
REFERENCES 5.21
6. RESEARCH OBJECTIVES 6.1
6.1 Objectives 6.1
6.2 Background 6.2
6.3 Fatigue tests and outline of associated experimental program 6.3
6.3.1 Collection of "baseline" (control) data 6.3
6.3.2 Constant AKL fatigue testing of as received material 6.4
6.3.3 Constant AKL testing of overloaded specimens 6.4
6.3.4 Constant AKL testing of welded specimens 6.4
6.4 Experimental procedures 6.4
REFERENCES 6.7

8/10/2019 The Effect of Residual Stress and Crack Closure on Fatigue Crack
http://slidepdf.com/reader/full/the-effect-of-residual-stress-and-crack-closure-on-fatigue-crack 7/304
7. EXPERIMENTAL TECHNIQUES 7.1
7.1 Fatigue testing 7.1
7.1.1 Specimen geometry 7.1
7.1.2 Measurement of crack length using DC-PD 7.1
7.1.3 Test control and data acquisition 7.5
7.1.4 Calibration 7.7
7.1.5 Calculation of crack growth rate and presentation of results 7.11
7.1.6 Test conditions (temperature and humidity) 7.11
7.1.7 Constant load amplitude (AP) tests 7.12
7.1.8 Constant AK tests 7.13
7.2 Crack closure measurement 7.13
7.2.1 Closure measurement instrumentation 7.14
7.2.2 Analysis of crack opening/closing response 7.16
7.3 Residual stress measurement by X-ray diffraction 7.18
7.3.1 X-ray diffractometer for residual stress measurement 7.18
7.3.2 Specimen preparation 7.18
7.3.3 Diffraction measurement conditions 7.19
7.3.4 Unstressed lattice spacing (d
()
) for X-ray diffraction 7.20
7.4 Residual stress measurement by neutron diffraction 7.22
7.4.1 The high resolution powder diffractometer 7.22
7.4.2 Definition of volume sampled 7.22
7.4.3 Data collection and interpretation 7.24
7.4.4 Stress-strain relationships for isotropic materials 7.25
7.4.5 Unstressed lattice spacing (d
()
) for neutron diffraction 7.28
7.5 Measurement of residual stresses by the hole-drilling method 7.28
7.5.1 Calculation of the residual stress from relieved strains 7.29

8/10/2019 The Effect of Residual Stress and Crack Closure on Fatigue Crack
http://slidepdf.com/reader/full/the-effect-of-residual-stress-and-crack-closure-on-fatigue-crack 8/304
V
8. EXPERIMENTAL PROGRAM RESULTS 8.1
8.1 As received and stress-relieved materials 8.1
8.1.1 Residual stress state of as-received and stress relieved material 8.1
8.1.2 Constant load (AK increasing) fatigue crack growth experiments 8.14
8.1.3 Constant AK
L
fatigue crack growth and crack closure experiments 8.25
8.2 Effect of residual stresses introduced by deliberate overloading 8.33
8.2.1 Application of overloads 8.33
8.2.2 Residual stress measurement of overloaded specimens 8.35
8.2.3 Crack growth in specimens subject to tensile overload 8.41
8.2.4 Crack growth in specimens subject to compressive overload 8.44
8.3 Effect of residual stresses introduced by welding 8.48
8.3.1 Specimen configurations 8.48
8.3.2 Residual stress fields in the welded specimens 8.51
8.3.3 Fatigue crack growth and crack opening behaviour in welded specimens 8.53
8.3.4 Fracture surfaces of welded CT specimens and implications of crack growth rates and crack
opening response at constant AK
L
8.59
REFERENCES 8.66
9. DISCUSSION AND ANALYSIS 9.1
9.1 Experimental 9.1
9.1.1 Residual stress measurements 9.1
9.1.2 FCG experiments - load application and crack length measurement 9.2
9.1.3 Crack closure measurements 9.3
9.2 Crack growth in as-received material and stress relieved material 9.5
9.2.1 Effect of residual stress condition and specimen orientation (L-T vs. T-L) 9.5
9.2.2 The effect of load ratio (R) 9.6
9.2.3 Microstructural effects 9.7
9.2.4 Effect of the fracture surface fretting debris 9.8

8/10/2019 The Effect of Residual Stress and Crack Closure on Fatigue Crack
http://slidepdf.com/reader/full/the-effect-of-residual-stress-and-crack-closure-on-fatigue-crack 9/304
VI
9.2.5 Relaxation of
residual
stresses in wake of the fatigue crack 9.14
9.2.6 Crack closure during constant AK crack growth 9.18
9.2.7 Residual back face strains at zero load 9.20
9.3 Fatigue crack growth and fatigue crack closure in overloaded (pre-stressed) specimens 9.25
9.3.1 Residual stresses and fatigue crack growth in overloaded specimens 9.25
9.3.2 Crack opening response of overloaded specimens 9.26
9.3.3 Residual back face strains in overloaded specimens at zero load 9.28
9.4 Fatigue crack growth and closure in residual stress fields introduced by welding 9.31
9.4.1 Residual stresses and fatigue crack growth in the welded specimens 9.32
9.4.2 Crack opening response of welded specimens 9.33
9.4.3 Residual back face strains in welded specimens at zero load 9.35
9.5 Overview of all experimental findings 9.37
9.5.1 Residual stress measurements and FCG rates 9.37
9.5.2 Crack closure and back face strain measurements 9.37
9.5.3 Relationship between crack closure and residual stresses 9.39
REFERENCES 9.41
10. CONCLUDING REMARKS 10.1
10.1 Conclusions 10.1
10.2 Suggestions for further work 10.2
APPENDICES
A1 QuickBasic Programs for Control and Monitoring of Fatigue Tests
A2 Experimental Errors
A3 Electropolishing Conditions for Steel Plate
A4 Test Material
A5 Procedures for Stress Relieving Specimen Material
A6 Application of Overloads

8/10/2019 The Effect of Residual Stress and Crack Closure on Fatigue Crack
http://slidepdf.com/reader/full/the-effect-of-residual-stress-and-crack-closure-on-fatigue-crack 10/304
vii
A7 Weld Preparation
A8 Fracture Surface Roughness Measurements

8/10/2019 The Effect of Residual Stress and Crack Closure on Fatigue Crack
http://slidepdf.com/reader/full/the-effect-of-residual-stress-and-crack-closure-on-fatigue-crack 11/304
Vlll
Statement
of
riginality
To the best of my knowledge and belief, this thesis is original work. Other than where
appropriate reference is made within the text, it does not contain material written by
another person. This thesis does not contain any material or work that may have been
accepted by another university or institution for the award of any other degree or dip
Jonathan Richard Thomas Lloyd
1 December 1999.

8/10/2019 The Effect of Residual Stress and Crack Closure on Fatigue Crack
http://slidepdf.com/reader/full/the-effect-of-residual-stress-and-crack-closure-on-fatigue-crack 12/304
IX
Acknowledgments
I wish to thank my supervisors for the help they provided during my candidature, esp
Professor Druce Dunne for his help and encouragement.
I would also like to thank all of those who helped me during my experimental program
including the technical staff and fellow students within the Department of Materials
Engineering, and the staff at ANSTO and Monash University who helped with my neutron
and X-ray diffraction experiments respectively. I would like to especially thank Bob
Jong for his help in building the DC-PD system and his work in maintaining the Instr
1603 machine during my experimental program, and to my fellow student Paul Kelly
whose assistance in computer programming was invaluable. Lastly, I would like to
acknowledge the contribution of the late R. Lindsay Davis of ANSTO/AINSE for his
assistance
and
patience during
the
neutron diffraction experiments
at HJTAR.

8/10/2019 The Effect of Residual Stress and Crack Closure on Fatigue Crack
http://slidepdf.com/reader/full/the-effect-of-residual-stress-and-crack-closure-on-fatigue-crack 13/304
X
ABSTRACT
The effects of residual stress and fatigue crack closure have been investigated in an
offshore application structural steel. Residual stresses were generated by deliberate
overloading to generate localised plastic deformation and by welding.
The residual stresses in the specimens were measured by a variety of techniques, and
fatigue cracks grown under controlled tensile load cycles. During the crack growth
experiments, the fatigue loading was interrupted to perform fatigue crack closure
measurements. The overall concepts, and experimental techniques, used were well
established. However, the work represents a holistic and unique approach to correlate the
combined effect of residual stresses and crack closure upon fatigue crack growth.
The results indicated that pre-existing residual stresses were dissipated by the growing
fatigue cracks. When a crack initiated in a compressive residual stress field, it continue
grow in a stress field of the same sign. However, when a crack initiated in a tensile resi
stress field, the tensile residual stress was dissipated more rapidly and the compressive
residual stress and crack closure effects generated by the crack itself eventually dominat
The crack growth behaviour then tended toward that of a specimen relatively free of
residual stresses.
Residual stresses acting normal to the crack plane affected the fatigue crack growth rates
and the shape (or profile) of the fatigue crack tip. However, those residual stresses para
to the crack appeared to have little effect on crack growth rates or on the shape of the
fatigue crack. In assessing the remaining fatigue life of a cracked structure or component
may often be sufficient to consider only the residual stress acting normal to the crack pl
within the overall assessment.

8/10/2019 The Effect of Residual Stress and Crack Closure on Fatigue Crack
http://slidepdf.com/reader/full/the-effect-of-residual-stress-and-crack-closure-on-fatigue-crack 14/304
XI
Residual stresses affect the crack opening closing response on loading and unloading.
Compressive residual stresses lead to higher crack opening and closing stress intensities
(Ko
P
and Kd). The effect of residual stress, due to welding or local plastic deformation d
to overloading, are more influential on the fatigue crack closure effect (in the material
investigated) than contributions due to fracture surface roughness or plasticity. In the
absence of residual stresses, at near threshold crack growth rates roughness induced
fatigue-crack closure, due to the mismatch of mating fracture surfaces and random contact
of asperities, was found to be more important than plasticity induced crack-closure close
the crack tip.
The crack opening/closing stress intensity (Kop/Kd) provides the basis for reliable empir
estimates of the remaining high-cycle fatigue life of a specimen that was already cracked.
a suitable means can be found to measure the crack opening/closing load response (P
op
/Pci)
in situ is feasible, then this could be used in conjunction with application of suitable
fracture mechanics to assess the remaining life.

8/10/2019 The Effect of Residual Stress and Crack Closure on Fatigue Crack
http://slidepdf.com/reader/full/the-effect-of-residual-stress-and-crack-closure-on-fatigue-crack 15/304
xii
SYM OLS
a Effective crack length
B Specimen breadth or thickness
BFS Back face strain
COD Crack opening displacement
CTOD Crack tip opening displacements
CT Compact tension
d Lattice spacing
Do Unstressed lattice spacing
da Crack growth rate (change in crack length per load cycle)
d N
DC-PD Direct current potential drop
AK Stress intensity amplitude
AKeff Effective AK based upon crack closure measurements
AKL Stress intensity amplitude due to externally applied load
AK
t
h Fatigue crack growth threshold, the minimum AK at which crack growth
is detectable
ACT Stress amplitude
e Strain (dimensionless)
E Young's Modulus
FCG Fatigue crack growth

8/10/2019 The Effect of Residual Stress and Crack Closure on Fatigue Crack
http://slidepdf.com/reader/full/the-effect-of-residual-stress-and-crack-closure-on-fatigue-crack 16/304
xiii
FEM Finite element modelling
G Shear modulus
HAZ Heat affected zone
K Stress intensity
K
c
max
Loading condition where K
ma
x is kept constant but K
m
i
n
may be varied
K
L
Stress intensity due to externally applied load
KL,
m
ax Maximum K
L
KL, min Minimum K
L
K
m
ax Maximum stress intensity
Kmin Minimum stress intensity
Kop/Kd Crack opening/closing stress intensity
Kd
7 t
h Threshold for crack closure
K
res
Stress intensity due to residual stress
LEFM Linear elastic fracture mechanics
L-T Longitudinal-transverse
v Poisson's ratio
P Load
Pop/Pci Crack opening/closing load
Q Scattering vector in diffraction experiments
R Load ratio (minimum load : maximum load)

8/10/2019 The Effect of Residual Stress and Crack Closure on Fatigue Crack
http://slidepdf.com/reader/full/the-effect-of-residual-stress-and-crack-closure-on-fatigue-crack 17/304
XIV
r
p
M a x i m u m plastic zone size (uploading)
r
P
, reversed Reversed plastic zone size (unloading)
Applied stress
o
m
ax Maximum applied stress
cj^n Minimum applied stress
a^ Residual stress
a
u
Ultimate tensile stress
Yield stress
T-L Transverse-longitudinal
W Specimen width
Influence function (dependent on specimen geometry and strain gauge
position)

8/10/2019 The Effect of Residual Stress and Crack Closure on Fatigue Crack
http://slidepdf.com/reader/full/the-effect-of-residual-stress-and-crack-closure-on-fatigue-crack 18/304
Introduction 1 1
Introduction
The effects of residual stress and the crack closure effect are closely linked. Much of t
published work on the subject discusses crack closure effects and residual stress effects
fatigue crack growth separately, i.e. referring to one or the other. However, residual st
affect the crack opening response, and the crack closure effect can be measured in
specimens that are relatively free of residual stresses prior to the growth of a crack.
Modern design rules increasingly avoid the severe stress raisers that lead to premature
failure by fatigue. Also non-destructive examination and risk based inspection of large
capital equipment and structures have increasingly limited the frequency of catastrophic
failures. However, if a significant defect is found it is often inconvenient or difficult
repair or replace the affected component. In such a situation, a fracture mechanics
assessment is often used as the basis of a "fit for service" decision. Such an assessment
recommend:
• That the defect is benign, and the component is "fit for service".
• That the defect is significant, but that the component can remain in service for a limi
period, or at a reduced load or downgraded capacity, prior to a repair or replacement.
• That the defect represents an unacceptable threat to the system, and the component must
be repaired or replaced before return to service.
A defect tolerant approach to operation is often an economic necessity, but the fracture
mechanics used to perform the assessment often takes no account of the crack closure
effect, or of residual stresses. An improved understanding of the relationship between th
crack closure effect and residual stresses on fatigue crack growth is of great potential
to an improved defect tolerant approach to managing large assets, and to improving design

8/10/2019 The Effect of Residual Stress and Crack Closure on Fatigue Crack
http://slidepdf.com/reader/full/the-effect-of-residual-stress-and-crack-closure-on-fatigue-crack 19/304
ntrodu tion 1 2
rules.
The large amount of published work that has focused on residual stress and crack
closure indicates that this potential has been recognised by many researchers. However,
despite the widespread acceptance of the AKgff (effective stress intensity amplitude) as
more accurate means of modelling fatigue crack growth, fracture mechanics assessments
are more often performed using AK
L
(the stress intensity amplitude due to the external
loading).
The material selected for the experimental programme was a structural steel, designed for
use in the construction of large-scale offshore petroleum production platforms. Residual
stresses are an inevitable consequence of the construction methods. Full stress relief b
treatment is possible during fabrication of a new structure, but would be difficult or
impracticable for repair welds especially in the field. Such applications are subject to
severe fatigue loading due to wave action. Hence, any factors relating to its fatigue cra
growth behaviour are of interest.
This thesis has investigated the effect of a minimum stress relieving heat treatment,
overload cycles, and welding, upon the residual stresses in the structural steel specimen
material. The effect of the various residual stress fields upon the fatigue crack opening
response and crack growth rates has also been investigated. The experimental program
represented holistic approach to the related effects of residual stresses and fatigue cra
closure upon fatigue crack growth. This was accomplished using a unique combination of
residual stress measurements followed by fatigue crack growth experiments and crack
closure measurements.
The residual stresses present in the as-received plate and those due to a controlled tens
overload cycle were found to have a beneficial effect on the fatigue behaviour of the pla

8/10/2019 The Effect of Residual Stress and Crack Closure on Fatigue Crack
http://slidepdf.com/reader/full/the-effect-of-residual-stress-and-crack-closure-on-fatigue-crack 20/304
ntrodu tion 1 3
material. The effect of tensile residual stresses introduced by a compressive overload cycle
was found to be detrimental but more limited, and to significantly decline with increas
crack length.
In the case of relatively complex residual stresses introduced by welding it was found
those residual stresses normal to the crack plane had a significant effect upon the cra
opening and closing response. However, large residual stresses parallel to the crack pl
had little effect on the crack opening response or the crack growth rate.

8/10/2019 The Effect of Residual Stress and Crack Closure on Fatigue Crack
http://slidepdf.com/reader/full/the-effect-of-residual-stress-and-crack-closure-on-fatigue-crack 21/304
Literature Review: Fatigue Crack Growth 2.1
2 Fatigue Crack Growth
"Fatigue" is the term used to describe the failure of a component under a repeatedly
applied stress. T h e stress required to cause fatigue failure is m u c h less than that wh ic h
would be required in a single application. Fatigue is the single largest cause of
engineering
failures.
T h e initiation and gr ow th of fatigue cracks has bee n the subject of
a massive a m o u n t oi researcn over tue years since tiie p ii en omen on w a s tirst iC ritiiiQ
t yyr-.-. f •
-.
J-. —
f
Srif "v*/t\m -r I'tTff «X°» l
2 1 The three stages of fatigue crack growth
Fatigue is often considered as a three-stage process.
2.1.1 Initiation
Initiation results from the application of stress in excess of the local yield valu
material. This results in the generation of dislocations, the subsequent movement o
which forms slip bands/lines where these intersect the surface. Repeated stressing
material concentrates deformation into certain of these slip steps, which become
broader and deeper until a micro-crack is initiated. The irreversibility of the sli
mechanism accounts for this process. Thin folds of material known as extrusions are
pushed out of the surface. These are associated with small crevices of similar
dimensions -intrusions- penetrating along planes of maximum resolved shear stress.
This is regarded as the "classical" fatigue crack initiation process, although the
other common sites where cracks may initiate, including interfaces of all types and
grain boundaries - especially at high strain amplitudes and/or elevated temperatur
Where the specimen has a very severe stress concentration (or notch) the initiatio
may be effectively by-passed.
8/10/2019 The Effect of Residual Stress and Crack Closure on Fatigue Crack
http://slidepdf.com/reader/full/the-effect-of-residual-stress-and-crack-closure-on-fatigue-crack 22/304
Literature Review: Fatigue Crack Growth 2 2
2.1.2 Stage 1 and Stage 2 fatigue crack growth
Stage 1 cracks are simply enlarged intrusions and hence, demarcation between stage
and initiation is often thought "unrealistic" [2]. Stage 2 is where the crack achie
macroscopic proportions and becomes important to engineers (i.e. where the size of
crack becomes significant relative to the overall scale of a component). As stage 1
cracks extend along active slip planes into the specimen, shear growth naturally
becomes increasingly difficult due to the growing tensile stress component. This
constraint causes macroscopic rotation of the crack to a plane approximately normal
the direction of the applied stress [3].
The proportion of a component's fatigue life spent in stage 1 or stage 2 is depende
upon stress amplitude, Aa (=CT
max
-
Grain)-
For low values of Acr the greater proport
of fatigue life will be in the stage 1 (initiation and growth) regime, whereas high
stress amplitudes will tend to result in a larger proportion being in the stage 2
(propagation) area [2].
2.1.3 Stage 3, Accelerated fatigue crack growth
Stage 3 of the fatigue cracking process is rapidly accelerating crack growth per cy
As the maximum stress intensity per cycle, K^, approaches the fracture toughness of
the material K
IC
, the crack growth rate increases exponentially until failure of the
renmimng ligament occurs by plastic collapse.
2.2 Stage 2 Crack Propagation and Crack Growth Models Laws)
In many large structures the existence of initial flaws and stress concentrations i
accepted, consequently crack nucleation is considered inevitable. As a result crack
nucleation is of little interest. Of greater interest is the number of loading cycl
required for a crack to reach a size where it represents a serious threat to the in
the structure or component. The use of fracture mechanics in such situations has le

8/10/2019 The Effect of Residual Stress and Crack Closure on Fatigue Crack
http://slidepdf.com/reader/full/the-effect-of-residual-stress-and-crack-closure-on-fatigue-crack 23/304
Literature Review: Fatigue Crack Growth 2.3
the "damage tolerant" approach to the fatigue. Fracture mechanics uses measurement
of the rate of failure development, followed by mathematical integration to produc
projected lifetimes. This also provides a rational basis for applying data from l
specimens to larger (real) structures.
Stage 2 crack growth takes place on a plane oriented -90° to the stress axis. Crac
propagation occurs by mechanisms other than the primary slip systems, and a
dislocation cell structure (rather than a persistent slip band structure) is foun
crack tip.
The fracture surfaces typically display striations, the profile of which may vary
These striations have been related to individual cycles [5], but when compared to
measured rates of crack growth per cycle the striation spacings are often found t
large at low cyclic stress intensities AK*. This difference can be explained by
intermittent crack propagation. At medium AK values striation spacings correspond
closely with macroscopic growth rates, whereas at high AK values they appear too
small (explained by Ritchie and Knott [5] in terms of the contribution of addition
static fracture modes).
During stage 2, crack growth rates and crack lengths are usually such that continu
fracture mechanics may be applied. Crack growth "laws" provide a basis for the
prediction of crack growth rate from a combination of material properties (e.g. e
modulus and yield stress) and the stress intensity at the crack tip.
Laird [6] estimated that some 50 or more crack growth theories had been put forwar
which have been summarised in several review papers (e.g. Schive [7] and Stanzl [8
Stanzl divided these theories into three basic groups (see 2.3.1-2.3.3).
* Under elastic conditions the stress field around the tip of a sharp crack or defect can be described
terms
of a single
parameter
k n o w n
as the
stress intensity factor
"K**.
This should
not be
confused with
the
stress concentration factor "Kj", which describes
the
ratio be tw ee n actual
and
nominal stress
at a
discontinuity.
T h e
cyclic
stress
intensity
or "stress
intensity amplitude"
is
co m m on l y called
A K .

8/10/2019 The Effect of Residual Stress and Crack Closure on Fatigue Crack
http://slidepdf.com/reader/full/the-effect-of-residual-stress-and-crack-closure-on-fatigue-crack 24/304
Literature Review: Fatigue Crack Growth 2.4
2.2.1 Stage 2 fatigue crack growth models based on plastic deformation at th
crack tip
Stage 2 crack growth models are based upon plastic blunting of the crack t
or the coarse slip type of model, (Neumann [10] and Pelloux [11]). These mo
consider crack tip opening displacements (CTOD) by continuum mechanics and
dislocation reactions at the crack tip.
Laird's plastic blunting model [9] is based upon local slip and crack blun
tension followed by crack re-sharpening by compressive loads. Evidence of
of this model follows from the observation that each striation can be corr
individual stress cycle. Using continuum analysis, the results are of the
da 4a
2
— =
a a
Tf cT Tf-»
—* ' ~*-* u
Equation 2.1
(Where E is the Young's modulus, CT
U
is the ultimate tensile strength, CT t
stress, a the crack length, N the number of loading cycles, and a the fract
contributing to crack advance).
The breakdown of a 1:1 relationship between CTOD and da/dN has been explai
static fracture modes at high stress intensities [5] and crack closure eff
intensities [12]. Because analysis of crack growth by progressive deformat
difficult McClintock [12] derived a solution connecting CTOD for mode 1 an
plastic zone size r
p
,
rev
by analogy with anti-plane strain conditions:
^-«A(CTOD)
1
=4Ar
prev
^ = M
dN
h v
'™
E o
y
E
Equation 2.2
(cr
y
is the yield stress)

8/10/2019 The Effect of Residual Stress and Crack Closure on Fatigue Crack
http://slidepdf.com/reader/full/the-effect-of-residual-stress-and-crack-closure-on-fatigue-crack 25/304
Literature Review: Fatigue Crack Growth 2 5
This approach assumes that under reversal the stress range before yielding is 2CT
ignoring the Bauschinger effect (the difference in cr
y
between successive tension
compression cycles).
Schwalbe [13] assumed elastic-plastic behaviour, and crack growth based upon
characteristic plastic deformation near the crack tip equal to the incremental cr
growth per cycle, (calculating for anti-plane strain and taking into account stra
hardening and tiansforming the result to mode 1 crack opening). Comparison of
theoretical and measured values displayed good correlation especially at low crac
growth rates in low and medium strength materials. Higher rates at higher AK valu
were attributed to corrosive influences, incomplete understanding of the hardenin
component and lower localised strength values than in the bulk material.
Coarse crystallographic slip models consider stage 2 crack propagation in terms o
alternating crystallographic slip on 2 systems due to strengthening of the previo
activated slip system. Neumann [14] further avoided difficulties in the use of co
mechanics to model ductile crack propagation by defining changing crack tip geome
according to the coarseness of the slip. Slip on both sides of the crack is assum
occur in slip bands instead of along discrete slip planes. Material parameters Ci
characterise the mhomogeneity in both slip systems and the angle a between the sl
planes the average strains 81S2 on either side of the crack to give:
—-_ (CA-i)
2
•
2
C\C
2
(C,-lXC
2
-l)sm
2
a
Equation 23
and for the symmetrical case Ci=C2=C;
Jz
x
z
2
~
—
sin
a
Equation 2.4

8/10/2019 The Effect of Residual Stress and Crack Closure on Fatigue Crack
http://slidepdf.com/reader/full/the-effect-of-residual-stress-and-crack-closure-on-fatigue-crack 26/304
Literature
Review: Fatigue Crack Growth
2 6
W h e n such strains (~1) may be produced by the applied
stress,
ductile crack propagation
is possible. No decohesion process is required. This ductile fracture model relates th
problem of certain stress and plastic strain values leading to crack extension.
Donahue et al, [15] introduced the threshold stress intensity (Kth) below which a crac
does not grow. This principle means that the rate of crack growth is proportional to t
CTOD at a given stress intensity less the CTOD at K
t
h, CTOD
t
h, and results in the
equation:
da 4A
2
2
dN
=
^
K _K
th)
my
7CCT
y
E
Equation 2.5
This relationship was found to be valid for many materials, with the constant "A" bein
used for a curve fitting procedure.
Dislocation theories have been applied to plastic blunting/coarse slip models. Bilby a
Heald [16] represented plasticity by a single planar distribution of dislocations ahe
the crack tip, and derived a fourth power dependence of crack growth rate on AK for
low stress amplitudes:
da 5
d N 3
A K
4
G70-;
(Where is the y surface energy and G is the shear modulus)
Equation 2.6
This relationship is in accordance with earlier dislocation based theory and is consi
with experimental results of McClintock [12].
Yokobori [17] combined earlier kinetic work and presented a dislocation approach
involving dynamic emission of dislocations from the crack tip, accounting for material
constants and AK. Applying a model of interaction between crack tip and nearby slip
band, it was possible to derive stress intensities containing microscopic (e.g. slip

8/10/2019 The Effect of Residual Stress and Crack Closure on Fatigue Crack
http://slidepdf.com/reader/full/the-effect-of-residual-stress-and-crack-closure-on-fatigue-crack 27/304
Literature
Review: Fatigue Crack Growth
2 7
length = grain diameter) and macroscopic factors (i.e., crack/notch). Good correlation
has been found with experimental results of the grain size effect with low carbon stee
[18].
Weertman [19] considered an atomically sharp crack and "smeared out rather than
discrete dislocations". It was concluded that pairs of dislocations of opposite sign a
created when the ratio of tensile strength to shear strength is large enough. When thi
ratio is greater than 7 a crack blunts, before brittle propagation occurs. For b.c.c.
the ratio appears smaller (at least at lower temperatures). Weertman assumed
dislocations of one sign move away from the crack tip into the crystal, and those of t
opposite sign pile up against the crack, determining the energy required to create a n
surface at the crack tip. Impurities will tend to lower this surface energy and promot
brittle fracture, (i.e., the ratio of tensile strength to shear strength is lowered).
2.2.2 Accumulated damage models
McClintock [12] drew upon earlier work by Head [20] and others to produce a model
based upon accumulated damage in front of the crack. Repeated crack nucleation ahead
of the crack tip, overageing or strain softening leading to strain concentration, or
fracture as a result of sub-grain formation (i.e. dislocation substructure) ahead of t
crack may occur as a result of cyclic strain. Fracture is said to occur when the integ
P
(over N cycles) of a function of local plastic strain amplitude,
y
, and true plastic strain
for monotonic fracture, y , reaches unity:
IN
4
T
Equation 2.7
The best choice of m was found to be 2.

8/10/2019 The Effect of Residual Stress and Crack Closure on Fatigue Crack
http://slidepdf.com/reader/full/the-effect-of-residual-stress-and-crack-closure-on-fatigue-crack 28/304
Literature
Review:
Fatigue
Crack Growth
2 8
Applied over a specified minimum region the growth law
is
derived:
da
— = 7.5
d N
V
Y
p
Jo
r ^
Tp
)
Equation 2.8
Y
y
=yield strain, p=microstructural scale (e.g., inclusion spacing)
r
p
=plastic zone size.
2.2.3 Energy approaches to stage 2 crack growth
Growth laws have been derived form energy approaches other than plasticity or
dislocation (damage) considerations. Rice [21] assumed separation occurs when the
absorbed hysteresis energy reaches a critical value per increment of newly formed
fracture surface, resulting in a fourth power dependence on AK. Weertman [22] arri
at a similar result:
da _ (AK)
4
dN
" 8TC
2
GOJU
Equation 2.9
(where U = total hysteretic work per unit area crack surface)
Sih [23] introduced the concept of strain energy density Ae. However, this concept
does not seem directly applicable to physical mechanisms. The crack is assumed to
advance by Aa when a critical amount of strain energy has been accumulated within a
element following a finite number of cycles AN. This leads to a relationship of t
da
^ ~CAe, where C is an experimentally determined material constant. This approach is
able to account for mean stress effects and mixed mode conditions.

8/10/2019 The Effect of Residual Stress and Crack Closure on Fatigue Crack
http://slidepdf.com/reader/full/the-effect-of-residual-stress-and-crack-closure-on-fatigue-crack 29/304
Literature Review: Fatigue Crack Growth 2 9
2.2.4 The "Paris Equation"
Paris and Erdogan [24] applied fracture mechanics concepts to fatigue cracks. This mo
da
popular approach correlates crack-growth rate T j ^ and stress intensity amplitude (AK).
For a crack length 2a the generalised (Paris) equation may be written:
— = C(AK)
m
d N
Equation 2.10
Where m and C are material-specific constants. Typically m~3 for high strength ductil
materials (e.g. steels) and where brittle fracture modes are encountered m varies fro
to 10. Hahn et al [25] produced a compilation of m values for a range of materials.
Ritchie and Knott [5] concluded that the exponent m was dependent on fracture
toughness, i.e. lower fracture toughness (Kic) values give rise to higher m values.
The "Paris equation" is without doubt the most commonly used approach for the
presentation of crack growth data. This is because plotting a graph of log crack grow
da
rate ("Tj"T) against log stress intensity amplitude (AK) usually produces a sigmoidal type
response, with a near linear section (with a gradient m) over much of the AK range of
interest (see Figure 2.1), and because it is a simple equation.

8/10/2019 The Effect of Residual Stress and Crack Closure on Fatigue Crack
http://slidepdf.com/reader/full/the-effect-of-residual-stress-and-crack-closure-on-fatigue-crack 30/304
Literature
Review
Fatigue Crack Growth 2.10
z
^ J
•a /
y y^
?** y
y
I
*-
y
• y
• s
u /
A •
Stress intensity (log A K )
Figure 2.1, typical sigmoidal profile of crack growth data when crac
(da/dN) is plotted against stress intensity amplitude (AK) on a log:
basis
2.3 Fatigue limits
The most commonly used means of presenting fatigue data for material
curve, which comprises a plot of nominal stress amplitude ACT (no adj
concentration) versus the number of cycles to failure A^. The value
exponentially as ACT falls. Below a certain limiting stress the curve
and below this stress level the material should be able to endure an
cycles. This is the
so-called fatigue limit. (ACTO).
Many materials do not have a true fatigue limit, and instead are cha
fatigue strength at an arbitrary number of cycles, e.g. IO
6
or IO
8
.
2.3.1 Short cracks at the fatigue limit and the relationship with the "long crac
threshold"
Below a certain stress intensity range (AK
t
h), dependent on factors s
properties, mean stress, and environment, traditional linear elastic
(LEFM) indicates that no crack growth can occur. Growth rates below
spacing (=10-
10
m) per cycle have been observed, and can be explained
intermittent growth. The determination of AK
t
h can be time consuming.

8/10/2019 The Effect of Residual Stress and Crack Closure on Fatigue Crack
http://slidepdf.com/reader/full/the-effect-of-residual-stress-and-crack-closure-on-fatigue-crack 31/304
Literature Review: Fatigue Crack Growth
2 11
Stanzl [26] outlined
an
ultrasonic technique (cycling
the
specimen
at
~20kHz)
for
determination of AK
t
h- Crack growth rates as low as 4 x IO"
10
m/cycle were measured,
and evidence of intermittent growth presented, whereby cracks were arrested for some
IO
7
cycles. It was suggested that "even longer arrest periods may occur, which
eventually give way for further crack propagation". Actual propagation rates between
these arrests were equal to or greater than one lattice parameter per cycle (=10-
10
m/cycle), the limiting instantaneous growth rate. Models have emerged to explain so
called threshold behaviour.
The stress intensity amplitude for crack growth, AKth, is a better measure of fatigue
strength than the fatigue limit ACT<). Generally, one of several micro-cracks will rea
critical length ao at some stage, and this crack will predominate from thereon. This
critical limiting crack size ao is known as the
long crack threshold.
This can also be
regarded as the stage at which linear elastic fracture mechanics (LEFM) may be applied
to describe crack propagation. A general measure of this threshold is given:
Equation 2.11
The absolute value of ao is material dependent. Geometric factors determine the stress
intensity at any particular point, given by Kj, the stress concentration factor. The s
amplitude required
to
initiate
a
crack (ACTj)
is
given
by
AGQ/KJ
(since
the
stress
"notch root" is simply Kj times the normal stress).
2.3.2
K
c
max
as a method of determining AK
th
A method of determining AK
lh
that is gaining increased acceptance is the so-called K
l
max
method. This method, demonstrated by Hertzberg et al [27], involves growing a fatigue
3 0009 03250244 0

8/10/2019 The Effect of Residual Stress and Crack Closure on Fatigue Crack
http://slidepdf.com/reader/full/the-effect-of-residual-stress-and-crack-closure-on-fatigue-crack 32/304
Literature Review: Fatigue Crack Growth 2.12
crack in a specimen whilst maintaining a constant value of K
max
and gradually increasing
K
min
until the crack ceases to grow, (see Figure 2.2). When this K
c
max
fatigue crack
growth data from aluminium and steel were normalised with respect to their elastic
moduli (£) by Herman [28] excellent agreement was observed, despite the differences i
physical properties, see Figure 2.3. This has been interpreted as K
(
max
allowing, by th
virtual elimination of crack closure, the determination of the material's intrinsic f
resistance. Hertzberg [29] has observed that (AK
th
/£)
2
for various alloys corresponds
the Burgers vector for the respective materials.
a)
AKth-
b)
Cycles
Figure 2.2, T w o possible fatigue threshold test procedures, (a) constant R-ratio
method, R
, b)
constant
K
ma x
method,
K'
max
.
After Clark et al [30].

8/10/2019 The Effect of Residual Stress and Crack Closure on Fatigue Crack
http://slidepdf.com/reader/full/the-effect-of-residual-stress-and-crack-closure-on-fatigue-crack 33/304
Literature Review: Fatigue Crack Growth 2 13
1e-3
1e-8
"5
1e-4
y
>>
o
1e
5
-o 1e-6
,
•a
1e-7 -
oAstroloy
O6 00 5 Aluminium
°
1020
Steel
a
1e-5
U
(Vm)
1e-4
Figure 2.3, K
c
m lx
Fatigue crack growth data for 1020 steel, 6005 aluminium and
Astroloy as a function ofAKJE After He rma n
[28].
ACT
Kp
Figure 2.4, Relationship between plain stress and stress concentration factor -
"notched fatigue limit" (after
ref.
[31])
2.3.3 Non-propagating cracks and notched fatigue limits
AK increases with crack length (a) hence there is no stopping mechanism for an
crack. ACTp is the stress amplitude necessary for crack propagation, LEFM does n
explain the regime where this is greater than ACTJ (the initiation
stress),
see F
above. This type of effect is independent of KT, but is very dependent on size a
greater for physically smaller notches
(i.e.
ratio
ACTp: ACTJ is
larger for larger
specimens).

8/10/2019 The Effect of Residual Stress and Crack Closure on Fatigue Crack
http://slidepdf.com/reader/full/the-effect-of-residual-stress-and-crack-closure-on-fatigue-crack 34/304
Literature
Review: Fatigue Crack Growth 2 14
If initiation stress level is to be exceeded over a finite distance ahead of the not
greater than initiation stress must be applied at the surface. Since the elastic str
distribution decays ahead of the notch, in contrast to a plain specimen, i.e. un-not
specimen, where the stress level is assumed uniform throughout. This results in a zo
(dictated by notch geometry) to be yielded. Therefore initiation and early growth ar
considered to be controlled by notch generated plastic strains, (although such inela
strains may occur only on a metallurgical scale in very hard materials subjected to
stresses).
When a crack reaches the end of the notch plastic zone, it must have developed
sufficient plasticity at its own tip to carry it through the elastic stress field re
the notch. Thus at a critical value of applied stress, the crack initiates at the not
grows at a decreasing rate because of the falling notch strain field and stops at le
corresponding to the boundary of the notch plastic zone. An estimate of AK for such
crack, assuming an elliptical notch of depth D, Figure 2.5, is:
AK = 1.12AaV(TC(l + D))
Equation 2.12
Since 1 « D and AK is insensitive to 1 (and hence plastic zone size) the critical
condition for continued propagation is:
AK = 1.12Ao^(7iD) >AK
th
Equation 2.13
Ritchie [32] critically reviewed theory regarding "near threshold behaviour" in stee
and concluded that, at the time, there was "virtually no mechanistic basis for near
threshold behaviour, and a comparative lack of reliable engineering data".

8/10/2019 The Effect of Residual Stress and Crack Closure on Fatigue Crack
http://slidepdf.com/reader/full/the-effect-of-residual-stress-and-crack-closure-on-fatigue-crack 35/304
Literature Review: Fatigue Crack Growth 2 15
K/CT
Figure 2.5, Schematic representation of the stress field around a notch (after Frost
et al [31])
2.4 The influence of material properties and microstructure
The effect of material properties and microstructural characteristics upon fatigue c
propagation is itself a complex topic, which has been discussed by several reviewers
[e.g., 33, 34, 35, 36]. A comprehensive treatment of this subject area is beyond the
scope of this study.
Fatigue crack propagation is governed mainly by elastic modulus, with other factors
having (to a varying degree) a secondary role. Speidel [37] demonstrated that at
intermediate AK ranges, "TTT can be normalised for a range of materials with widely
differing moduli, by plotting against AK/E (where E is Young's Modulus). Some have
found increasing AK
t
h values with increasing CT
y
or CT
U
values [35]. However, most ste
display decreasing AK
t
h with increasing CT
U
values [32], the effect being greater at
mean stresses (R ratios). It is tentatively concluded [8] that, as long as the alloy
undergoes cyclic hardening or is cyclically stable, -JTT values fall with increasing
stress.

8/10/2019 The Effect of Residual Stress and Crack Closure on Fatigue Crack
http://slidepdf.com/reader/full/the-effect-of-residual-stress-and-crack-closure-on-fatigue-crack 36/304
Literature
Review: Fatigue Crack Growth
2.16
Unambiguous understanding of the influence of strength on AK
t
h has not yet been
achieved. A possible explanation is that "embrittlement associated with higher CT
U
val
may account for lower AK
t
h values for steels with higher CT
U
" [8].
2.4.1 The effect of non-metallic inclusions
There is conflicting evidence regarding the effect of non-metallic inclusions on fatig
crack growth rate. Inclusions have been found to have only a slight influence at lower
(near threshold) growth rates [37], and not to influence the AK
t
h of medium strength
pearlitic steels [38] within a given range. The explanation put forward for this effec
that the inclusion spacing is smaller than the plastic zone size [8]. Broek [38] state
at higher propagation rates these particles induced small amounts of ductile fracture
that "...in the absence of inclusions the true fatigue crack propagation rate would be
much lower...". Wilson [40] noted that the removal of MnS and AI2O3 inclusions from a
pressure-vessel steel reduced the fatigue crack propagation rate.
2.4.2 The effect of grain size
Several reviewers have commented upon the effect of grain size on fatigue crack
propagation [2, 8, 32]. General agreement exists that at intermediate crack growth rat
the effect is negligible, but at near threshold rates a coarser grain size has the eff
retarding crack growth. Yoder et al [41] have put forward a theory to explain the effe
of grain size on AK
t
h- This showed that the transition from a structure sensitive to a
structure insensitive growth range takes place when the plastic zone size approaches t
mean grain size, (see Figure 2.6). Ravichandran [42] reviewed the effects of various
microstructural factors on fatigue thresholds in pearlitic steels. The size of pearlit
colonies was shown to influence AKth, and Kci
;
th, (
me
threshold for crack closure),
through the deflection and retardation of cracks at the boundaries of pearlite colonie
theoretical model that illustrated these effects was presented.

8/10/2019 The Effect of Residual Stress and Crack Closure on Fatigue Crack
http://slidepdf.com/reader/full/the-effect-of-residual-stress-and-crack-closure-on-fatigue-crack 37/304
Literature Review: Fatigue Crack Growth 2 17
Cyclic plastic zone size - r
Mean grain size - /
•a
o
ca
y
o
O)
u
ca
CD
3
g>
y
CO
o
A K >
AK
T
r
c
> /: Structure insensitive crack g
I ~l Transition
A K < A K
n
r < /: Structure sensitive crack growth
Log stress-intensity range AK)
AK
T
Figure 2.6, Ref. [41]) Effect of reversed plastic zone size, relative to grain size,
upon development of
bi-linear
fatigue crack growth behaviour.
A Kj
marks the transition from structure-sensitive to structure-insensitive
fatigue crack growth where the cyclic plastic zone size exceeds the
mean grain size.
2.5 Environmental effects
Engineering components and structures are frequently exposed to environments more
aggressive than air, in addition to the stresses and strains that are considered in t
design. These may assist the initiation and propagation of cracks. Most practical int
is centred upon aqueous environments. Such environmentally assisted crack processes
in metallic materials are arbitrarily classified into corrosion fatigue and stress c

8/10/2019 The Effect of Residual Stress and Crack Closure on Fatigue Crack
http://slidepdf.com/reader/full/the-effect-of-residual-stress-and-crack-closure-on-fatigue-crack 38/304
Literature Review: Fatigue Crack Growth 2 18
cracking. In aqueous environments the process is dominated by crack tip dissolution
rates or hydrogen embrittlement of the metal lattice ahead of the advancing crack.
Crack growth laws do not include environmental effects. Consequently, the validity of
crack growth laws needs to be re-established in the case of specific environments [43]
Crack processes significantly influenced by corrosion are time dependent phenomena
governed by the rates of the relevant chemical reactions. This creates an intermediate
problem in the acquisition of materials data for the validation of structures with lon
design lives. For realistic measurement of the contribution of corrosion to fatigue, an
test must be carried out at the frequency anticipated in service, and not accelerated,
frequently permissible in relatively inert environments such as air [44]. The frequenc
and cyclic wave shape will also have a large effect, since these govern the period of
crack opening and exposure of the crack tip to the corrosive environment. The corrosio
influence on crack growth will obviously steadily decline as the crack growth rate
increases. This is basically due to the time dependence of the corrosion process, and
depending on whether the rate of penetration of the corrosive process is faster or slo
than the crack growth rate.
Figure 2.7 shows the influence of corrosion on crack propagation rate in seawater as
compared to laboratory air, and illustrates the effect of R ratio and of crack locatio
upon crack growth rates. At higher R ratios crack growth rates are generally higher at
comparable AK since the crack tip is exposed to the corrosive media for longer. It is
apparent that the crack growth rate at the sides of the specimen is higher than in the
owing to its greater exposure to the corrosive media.
As discussed earlier (2.3), the conventional S-N curve defines cycles to failure as a
function of stress amplitude. Corrosion effects may influence the whole failure curve
reducing the allowable cyclic stresses (Figure 2.4). Under adverse conditions the fati

8/10/2019 The Effect of Residual Stress and Crack Closure on Fatigue Crack
http://slidepdf.com/reader/full/the-effect-of-residual-stress-and-crack-closure-on-fatigue-crack 39/304
Literature Review: Fatigue Crack Growth
2 19
limit may disappear. Such corrosion fatigue S-N curves would also be expected to be
dependent upon the cyclic frequency.
Studies of environmental cracking in metallic materials using pre-cracked specimens
generally concentrate on determining the threshold for crack propagation and the
subsequent kinetics.
K\
(the LEFM parameter) is sufficient to characterise the crack t
stress fields; (here one is concerned with fracture phenomena below plastic collapse o
brittle fracture loads).
It is possible for corrosion to blunt the crack tip and thus influence the apparent gr
threshold. Mean tensile stresses or positive R ratios are important in the region of t
crack growth curve described by the Paris type relationship, compared to more inert
conditions (e.g. ambient air).

8/10/2019 The Effect of Residual Stress and Crack Closure on Fatigue Crack
http://slidepdf.com/reader/full/the-effect-of-residual-stress-and-crack-closure-on-fatigue-crack 40/304
Literature
Review:
Fatigue Crack Growth 2 20
3x10
10
-•
5
'tf
7
TJ
O
"5
5
Rote
of
crack growth
(depth)
do/dAf
(along
surface)
dc/d/V
o
a
Stress
ratio,
R
0.1
0.5
0.7
wszy
- Mean air data line
for
B S 4 3 6 0 : 50 D steel using
SEN
and C T
specimens in
air at room temperature
-IS/7S0.85
Mean
air
data line
X 6
I0
_
10
10
Cyclic
stress intensity factor,
LK (MPo/ffT)
100
Figure 2.7, (from ref. [45]) Cyclic propogation data for semi-elliptical cracks in
seawater under freely corroding conditions compared to mean air
F C G data, (all points sh own are for seawater, lines sh own least-
squares fit to F C G data from experiments in laboratory air and 6
times the laboratory air F C G rates respectively).

8/10/2019 The Effect of Residual Stress and Crack Closure on Fatigue Crack
http://slidepdf.com/reader/full/the-effect-of-residual-stress-and-crack-closure-on-fatigue-crack 41/304
Literature Review: Fatigue Crack Growth 2 21
REFERENCES
1. May M.J. & Honeycombe R.W.K., "The Effect of Temperature on the Fatigue
Behaviour of Magnesium and some Magnesium Alloys, J. Inst. Metals 92 (1963-
1964),
pp41-49.
2. Plumbridge W.J., "Fatigue-crack propagation in metallic and polymeric m
J Mat. Sci. 7
(1972),
pp939-962.
3. Klesnil M. & Lukas P., Fracture 1969 : Proc. 2nd Int. Conf. on Fractur
Brighton,
(1969),
pp725-730,
Chapman & Hall, London.
4. Laird, C, "Influence of Metallurgical Structure on the Mechanisms of Fa
Propagation," in Fatigue Crack Propagation, STP415, (1967), A S T M , ppl31-180.
5. Ritchie, R.O. and Knott, J.F., "Mechanisms of Fatigue Crack Growth in L
Steel,"
Acta
Met., 21, (1973),
pp639-648.
6. Laird, C, "Mechanisms and Theories of Fatigue," in Fatigue and Microstr
(1978),
A S M ,
pp
149-203.
7. Schive, J., "Four Lectures on Fatigue Crack Growth," Engineering Fractu
Mechanics, 11,
(1979),
pp
167-221.
8. Stanzl, S.E., "Fatigue Crack Growth (Physical Principles, Models and Ex
Results)," Res. Mechanica, 5, (1982), pp241-292.
9. Laird, C. and Smith, G.C., "Crack Propagation in High Stress Fatigue,"
7,
(1962),pp847-857.
10. Neumann, P., "Coarse Slip Model of Fatigue," Acta Metallurgica, 17, (1
ppl219-1925.
11. Pelloux, R.M.N., "Mechanisms of Formation of Ductile Striation," ASM T
62,
(1969),
pp281-285.
12. McClintock, F.A., "On the Plasticity of the Growth of Fatigue Cracks,"
of
Solids,
ed.s Drucker D.C. and
Gilman
J.J., (1963),
Interscience,
New-York, pp65-
102.
13. Schwalbe, K.H., "Approximate Calculation of Fatigue Crack Growth," I.J
(1973),
pp381-395.
14. Neumann, P., "New Experiments Concerning the Slip Process at Fatigue C
I
Acta
Met., 22, (1974),
ppl
155-1165.
15. Donahue, R.J. et al "Crack Opening Displacement and Rate of Fatigue Gr
Fract. Mech., 8,
(1972),
pp209-219.

8/10/2019 The Effect of Residual Stress and Crack Closure on Fatigue Crack
http://slidepdf.com/reader/full/the-effect-of-residual-stress-and-crack-closure-on-fatigue-crack 42/304
Literature Review: Fatigue Crack Growth 2 22
16. Bilby, B.A. and Heald, P.T., "Crack Growth in Notch Fatigue,"
Proc.
Roy. Soc.
(London),
A1482, (1968),
pp429-439.
17. Yokobori, T., "Non-linear Interaction Between Main Crack and Nearby Sli
Engineering Fracture Mechanics, 7,
(1975),
pp377-388.
18. Roven, HJ. Nes, E. "The Cyclic Stress-Strain Response of a Low Alloyed
Plateau in the C S S
Curve,"
Acta Metallurgica et Materiala, 21, 12,
(1987),
ppl727-
1732.
19. Weertman, J., "Crack Tip Blunting by Dislocation Pair Creation and Sepa
Phil. Mag.
A,
43,
(1981),
ppll03-1123.
20. Head, A.K., " The Growth of Fatigue Cracks," Phil. Mag., 44, (1953), pp92
21. Rice, J.R., "Mechanics of Crack Tip Deformation and Extension by Fatigu
Fatigue Crack Propagation, STP 415,
(1967),
A S T M , pp247-309.
22. Weertman, J., "Fatigue Crack Propagation Theories," in Fatigue and
Microstructure,
(1979),
A S M , pp279-306.
23. Sih, G.C., "Mixed Mode Fatigue Crack Growth Predictions," Engineering F
Mechanics, 14, (1980),
pp439-451.
24. Paris, P. and Erdogan, F., "A Critical Analysis of Crack Propagation Law
Eng. Trans ASME, 85,
(1963),
pp528-534.
25. Hahn, G.T., Sarrate, M., and Rosenfield, A.R., "Experiments on the natu
fatigue crack
plastic
zone," I.J. Fract. Mech., 1,
(1969),
pp425-499.
26. Stanzl, S.E. and Tschegg, E., "Fatigue Crack Growth Measured at Very Hi
Frequencies (20kHz)," Met. Sci., 14,
(1980),
pp
137-143.
27. Hertzberg, R.W., Herman, W.A., Clark, T.R., and Jacard, R., "Simulation
Crack and Other L o w Closure Loading Conditions Utilizing Constant K
raax
and AK -
Decreasing Fatigue Crack Growth Procedures," in Small Crack Methods (ed.
Larson, J.E. and Allison, J.E.), A S T M S TP 1149, American Society for Testing
Materials, Philadelphia,
(1992),
pp
197-220.
28. Herman, W.A., "A re-evaluation of fatigue threshold test procedures and
simulation and prediction of fatigue crack growth under conditions of low crack
closure" PhD Thesis, Lehigh
University, (1988).
29. Hertzberg, R.W., "A simple calculation of da/dN- AK data in the near th
regime and above," International Journal of Fracture, 64, R53-58,
(1993).
30. Clark, T.R., Influence of the K gradient and K
L
max
level on fatigue res
the K
c
max
threshold testing of Van 80 steel and Astroloy," International Journal of
Fatigue, 19, 2,
(1997),
pp
177-182.

8/10/2019 The Effect of Residual Stress and Crack Closure on Fatigue Crack
http://slidepdf.com/reader/full/the-effect-of-residual-stress-and-crack-closure-on-fatigue-crack 43/304
Literature
Review:
Fatigue Crack Growth 2 23
31.
Frost, N.E., Marsh, K.J. and Pook, L.P., Metal Fatigue, (1974), Clarendon Press,
Oxford.
32. Ritchie, R.O., "Near-threshold fatigue-crack propagation in steels," Intern
Metals Reviews, Review 245, 5 & 6, (1979), pp205-230.
33. Plumbridge, W.J. and Ryder, D.A., "The Metallography of Fatigue," Metallurgi
Review 136,(1969).
34. Knee, N., "The Effects of Microstructure on Fatigue Crack Growth," Ph.D. Th
University of
Bristol,
1984.
35. Suzuki, H. and McEvily, A.J., "Microstructural Effects on Fatigue Crack Gro
a L o w Carbon Steel," Met. Trans. A,
10A,
(1979), pp475-481.
36. Mughrabi, H., "Fatigue of Engineering Materials," in Materials Architecture
Proc. 10th Ris0 Int. Symposium on Metallurgy and Materials Science, (1989), Ris0
Roskilde.
37. Speidel, M.O., "The Resistance to Fatigue Crack Growth of the Platinum Metal
Platinum
Metals
Review,
1981, pp24-31.
38. Broek, D., "The Effect of Intermetallic Particles on Fatigue Crack Propagat
Alloys"
in Fracture 1969 : Proc. 2nd Int. Conf. on Fracture, Brighton, 1969,
pp754-764, Ch ap ma n & Hall, London.
39. Fowler, G.J., " The Influence of Non-metallic Inclusions on the Threshold
Behaviour in Fatigue" Mat. Sci. & Eng., 39, (1979), ppl21-126.
40. Wilson, A.D., "Fatigue Crack Propagation in A 533 B Steels " J. Press. Vesse
Tech., Trans. ASME,
99, (1977),
pp459-469.
41. Yoder, G.R. et al, "Observations on the Generality of the Grain size Effect
Fatigue Crack Growth..." in Titanium '80, ed.
Kimura H.
and
Izumi O., (1981),
T M S
AIME,pp
1865-1874.
42. Ravichandran, K.S., "A Rationalisation of Fatigue Thresholds in Pearlitic S
Using a Theoretical Model," Acta Metall.
Mater. 39,
ppl331-1341.
43. Wei, R.P., "Some Aspects of Environment-Enhanced Fatigue Crack Growth,"
Engineering Fracture
Mechanics,
1,
(1970), pp633-.
44. Scott, P.M., "Effects of Environment on Crack Propagation," in Developments
Fracture Mechanics - 1, ed.
Chell,
G.G., (1979), pp221-257, App. Sci .Pubs.,
London
45. Thorpe, T.W. et al, "Corrosion of BS4360:50D Structural Steel in Seawater
International Journal of Fatigue, 5, 3, (1983), ppl23-133.
8/10/2019 The Effect of Residual Stress and Crack Closure on Fatigue Crack
http://slidepdf.com/reader/full/the-effect-of-residual-stress-and-crack-closure-on-fatigue-crack 44/304
Literature Review: Residual Stresses
3 1
3 Residual Stresses
Residual stresses can be more precisely defined as those existing in a component in
absence of any external load. If a structural element is strained beyond its yield
residual strain will remain on removal of the load. Such an element will be incompat
with neighbouring elements and will deform elastically with its neighbours until
compatibility is attained. This requires that residual stresses are self-equilibrat
the forces and moments within a body balance such that their sum is zero.
3.1 Scale of residual stresses
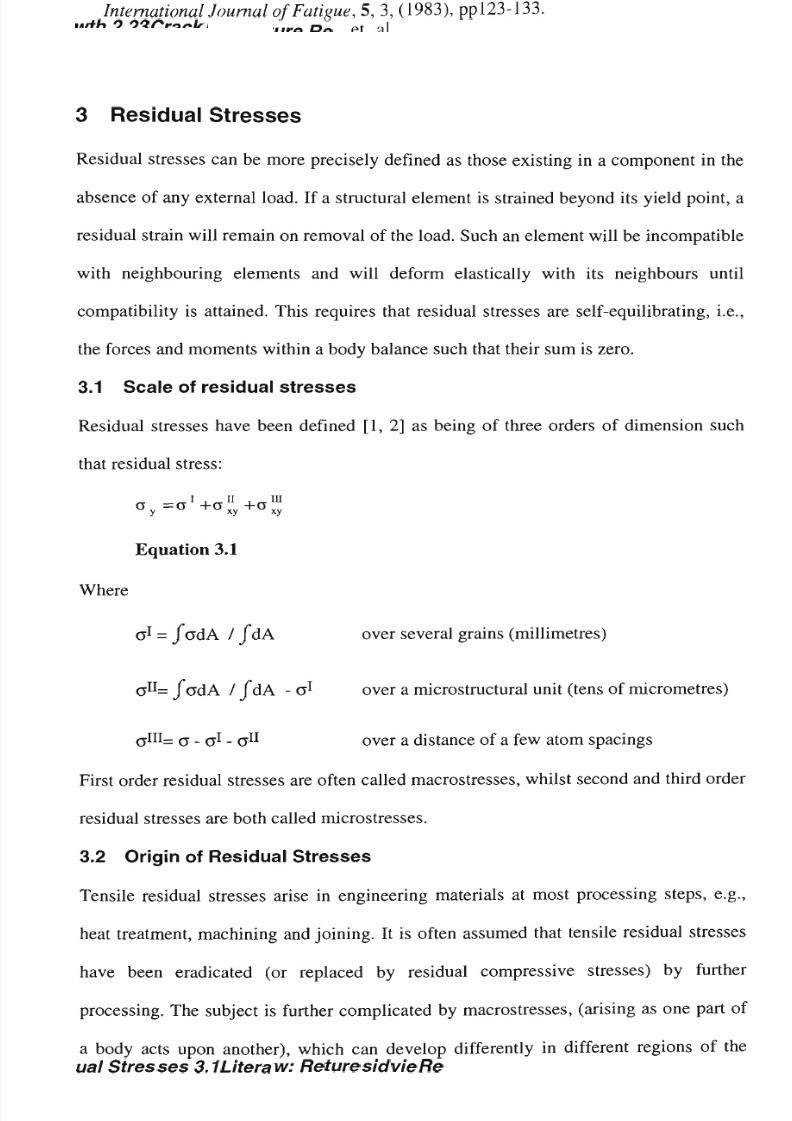
Residual stresses have been defined [1, 2] as being of three orders of dimension suc
that residual stress:
Equation 3.1
Where
CT
1
= J*CTdA / JdA over several grains (millimetres)
a
n
= J"(7dA / fdA - CT
1
over a microstructural unit (tens of micrometres)
a
m
= CT - CT
1
- CT
11
over a distance of a few atom spacings
First order residual stresses are often called macrostresses, whilst second and thi
residual stresses are both called microstresses.
3.2 Origin of Residual Stresses
Tensile residual stresses arise in engineering materials at most processing steps,
heat treatment, machining and joining. It is often assumed that tensile residual st
have been eradicated (or replaced by residual compressive stresses) by further
processing. The subject is further complicated by macrostresses, (arising as one pa
a body acts upon another), which can develop differently in different regions of the
8/10/2019 The Effect of Residual Stress and Crack Closure on Fatigue Crack
http://slidepdf.com/reader/full/the-effect-of-residual-stress-and-crack-closure-on-fatigue-crack 45/304
Literature
Review:
Residual Stresses 3 2
same component. Microstresses can develop on a microscopic (grain to grain) scale, for
example between carbide and ferrite phases in steels. The magnitude of these residu
stresses may be a significant fraction of the ultimate tensile strength of the mate
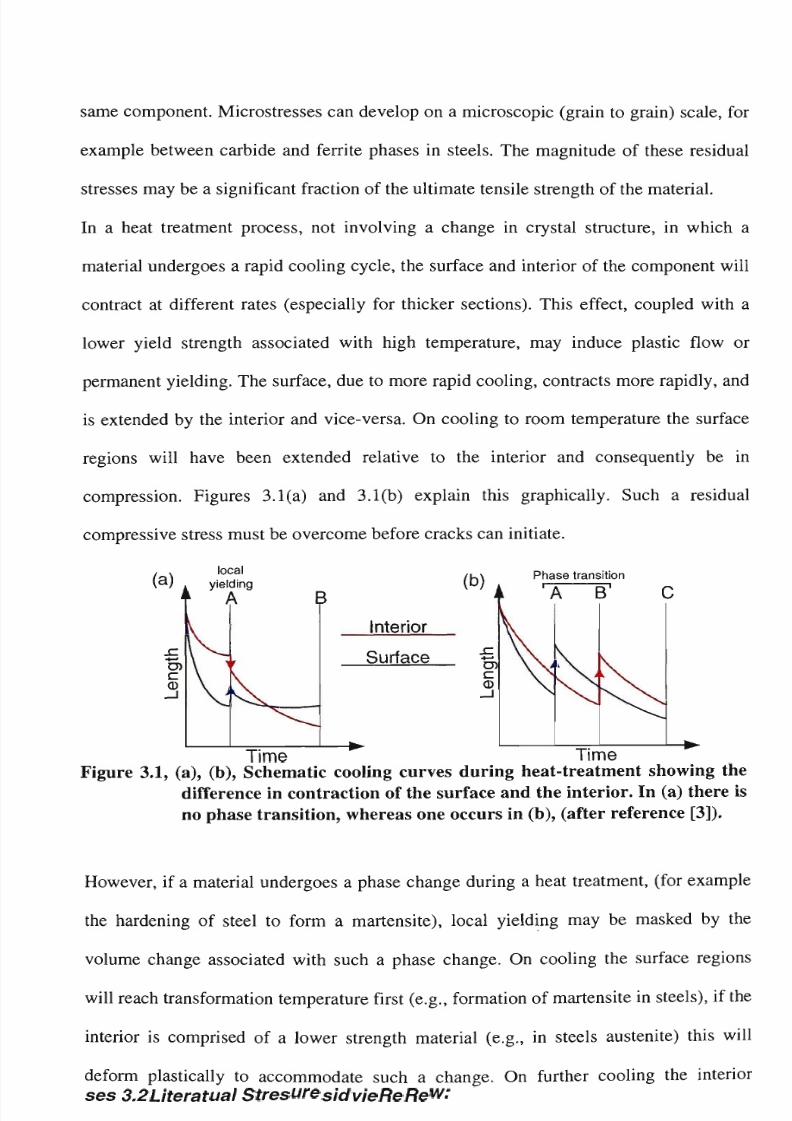
In a heat treatment process, not involving a change in crystal structure, in which
material undergoes a rapid cooling cycle, the surface and interior of the component
contract at different rates (especially for thicker sections). This effect, coupled
lower yield strength associated with high temperature, may induce plastic flow or
permanent yielding. The surface, due to more rapid cooling, contracts more rapidly,
is extended by the interior and vice-versa. On cooling to room temperature the surf
regions will have been extended relative to the interior and consequently be in
compression. Figures 3.1(a) and 3.1(b) explain this graphically. Such a residual
compressive stress must be overcome before cracks can initiate.
, . ,v,v,«. Phase transition
\
a
k
yielding
A B
Interior
Surface
Time
Time
Figure 3.1,
a), b),
Schematic cooling curves during heat-treatment showing the
difference in contraction of the surface and the interior. In (a) there is
no phase transition, whereas one occurs in
b),
(after reference [3]).
However, if a material undergoes a phase change during a heat treatment, (for examp
the hardening of steel to form a martensite), local yielding may be masked by the
volume change associated with such a phase change. On cooling the surface regions
will reach transformation temperature first (e.g., formation of martensite in steel
interior is comprised of a lower strength material (e.g., in steels austenite) thi
deform plastically to accommodate such a change. On further cooling the interior

8/10/2019 The Effect of Residual Stress and Crack Closure on Fatigue Crack
http://slidepdf.com/reader/full/the-effect-of-residual-stress-and-crack-closure-on-fatigue-crack 46/304
Literature Review: Residual Stresses 3 3
transforms, producing a similar expansion, it is resisted by the high strength surface
layer, which is put into tension, resulting in tensile residual surface stresses. The
contribute to crack initiation and propagation.
Another cause of residual tensile stresses at the surface of a material is defect pil
during plastic extension, (resulting in hardening of the surface relative to the unde
material). On release of the load, elastic recovery will attempt to leave the surface
shorter than the interior, again leading to a residual tensile stress in the surface
The converse occurs when the surface is softer than the interior. In rolling for exam
the surface will be deformed more than the interior, due to friction at the rolls, re
in compression at the surface. The magnitude of such a residual compressive stress is
function of the thickness of the piece, roll diameter, and degree of reduction.
The most significant cause of large residual stresses is welding. The cooler parent m
restrains contraction of the molten weld metal on cooling. This inevitably leads to l
residual stresses (see Figure 3.2). Combined with the lower fracture toughness often
associated with material in or adjacent to such areas (heat affected zone), and may le
to the initiation of catastrophic failures.
Longitudinal
shrinkage
-:
compressiv e
+:tensile
Weld metal
Lateral shrinkage
tresses
Figure
3.2,
Residual stresses associated with a weld metal deposit

8/10/2019 The Effect of Residual Stress and Crack Closure on Fatigue Crack
http://slidepdf.com/reader/full/the-effect-of-residual-stress-and-crack-closure-on-fatigue-crack 47/304
Literature Review:
Residual Stresses 3 4
3.3 Deliberate generation of residual stresses to improve component
performance
Residual stresses can be used to improve the fatigue performance of components and
structures. The deliberate generation of compressive (crack closing) residual stresses i
areas where fatigue cracks might initiate (such as notch roots, holes, highly stressed
surfaces), is a long recognised means of enhancing fatigue life. There is also the benef
of a local increase in hardness, which may account for a significant fatigue life
improvement. There are several ways in which these beneficial residual stresses can be
generated.
Surface treatments such as peening, ion-implantation, carburising and nitriding all resu
in the creation of compressive surface residual stresses. These have been shown to be
effective in delaying the initiation of fatigue cracks. Heat treatment can also be used
similar effect.
A more radical from of introducing residual stresses to improve fatigue performance is
deliberate overstressing and autofrettaging [4]. This is common practice in the
production, for example, of large pressure vessels and gun barrels. Another technique in
regular use is the cold expansion of fastener holes in thin sheets [5,6,7], especially fo
aircraft.
All of the techniques above require care in their application, since their overall long
term influence on fatigue performance (particularly after cracks have initiated and
breached the long crack threshold) is often not fully understood.
3.4 Precautions commonly employed against residual stress
Stress relieving heat treatments at moderate temperatures may allow local yielding to
occur, and minimise or eradicate such residual stresses. Vibrational conditioning of
weldments and castings has been shown to compare favourably with thermal treatments.

8/10/2019 The Effect of Residual Stress and Crack Closure on Fatigue Crack
http://slidepdf.com/reader/full/the-effect-of-residual-stress-and-crack-closure-on-fatigue-crack 48/304
Literature Review: Residual Stresses 3 5
H o w e v e r ,
neither can be said to always result in improvements by the eradication of
undesirable residual stresses [8].
Surface treatments, such as shot peening, may be employed to replace residual tensile
stresses with compressive ones, and assist in retarding the initiation of fatigue cracks
etc. However, surface treatments (e.g., shot peening) are not always beneficial for
fatigue life [9] and may, if the fatigue history is largely tensile, result in the
development of deleterious stresses. Similarly, care must be taken when applying
surface treatments to components. For example, Averbach and Lou [10] have shown
that carburising can result in quite different changes in the fatigue properties in two
quite similar high alloy steels.
Large sections will lose some of their residual stresses if cut into smaller pieces. In
large welded structures residual stresses are frequently the origin of catastrophic fail
3.4.1 Stress Relief by Heat Treatment
Thermal stress relieving involves heating the specimen or component to a temperature
at which the material yield stress has fallen, allowing creep to take effect. Large resi
stresses are no longer supported and, if temperatures are high enough, the stress
distribution will become more uniform. Such heat treatment may lead to tempering or
ageing effects, altering the microstructure. The extent of the latter is dependent on the
material concerned. In the case of C/Mn steels stress relieving heat treatment is
beneficial in improving the fracture toughness of the heat affected zone (HAZ)
associated with welds, allowing service at lower temperatures. However, low alloy
steels are routinely supplied in a heat-treated condition. If stress relieving heat trea
is necessary it must be applied without significantly changing the properties of the
parent material.
The scale of the structure to which such thermal stress relief is to be applied is a
significant factor. For very large structures or components, it may be possible to

8/10/2019 The Effect of Residual Stress and Crack Closure on Fatigue Crack
http://slidepdf.com/reader/full/the-effect-of-residual-stress-and-crack-closure-on-fatigue-crack 49/304
Literature
Review:
esidual Stresses 3 6
successfully apply su ch me tho ds to critical areas or in
situ,
using electrical resistance or
induction methods. A general rule applied to butt welds in plate structures [11] is that,
for satisfactory relief of residual stresses, uniform heat input needs to be applied over
bandwidth equal to approximately twice to weld length. Suggested bandwidths for local
stress relieving heat treatment for flat plate situations and circumferential welds are
shown schematically in Figure 3.3.
Various welding codes outline different specifications. However, there are three
principal requirements governing the heat treatment method:
(i) It should be capable of achieving the correct temperature.
(ii) The temperature should be controlled within specified limits, (e.g., ±5° to 10°C
for steels).
(iii) A uniform heating and cooling rate must be obtained through the heaviest
section to be treated, especially where the geometry is complex and the
thickness variable.
Stress relieving heat treatments are generally avoided unless required for adequate
service performance. However, some codes make such procedures mandatory.

8/10/2019 The Effect of Residual Stress and Crack Closure on Fatigue Crack
http://slidepdf.com/reader/full/the-effect-of-residual-stress-and-crack-closure-on-fatigue-crack 50/304
Literature Review: Residual Stresses 3 7
Weld
a)
\
Heated bandwidth 2L
ro
o.
ro
3
CQ
b)
Heated Bandwidth 5V Rt)
•I
Radius R
Figure 3.3, Ban dwidths for local stress relieving heat treatment in: a) butt welded
plate, b) butt joints in cylinders or pipework, after ref [11].
3.4.2 Mechanical Precautions Against Residual Stress
In cases where the metallurgical effects of thermal stress relief are undesirable,
mechanical means of stress relief may be an alternative. This relief may be by means of
a single overload, or by means of vibrational stress relaxation. The latter is less wel
understood than the former.
A single overloading above the yield stress generally results in a reduction in the eff
of any pre-existing residual stresses upon service performance. The application of such
overloads (and proof loads) results in the generation of compressive residual stresses
around existing defects, with beneficial effect upon fatigue performance [12, 13]. This
effect was recently demonstrated quantitatively by Okamato and Nakamura [14].

8/10/2019 The Effect of Residual Stress and Crack Closure on Fatigue Crack
http://slidepdf.com/reader/full/the-effect-of-residual-stress-and-crack-closure-on-fatigue-crack 51/304
Literature Review: Residual Stresses 3 8
Vibratory stress relief (VSR) is an attractive technique not only from a metallurgical
standpoint, but also due to the very large energy savings compared with thermal
treatments. Burck et al have shown that, in the case of weldments, the effect of VSR i
largely complete after IO
5
cycles [15]. A negative aspect is that VSR may induce
appreciable fatigue damage.
3.5 Residual Stress Measurement Techniques
There are several techniques of residual stress measurement of interest in the context
this project. The mechanical methods are the least complicated and require the least
costly equipment. They are based upon the relaxation of material due to the
readjustment of residual stresses following cutting, boring holes or removal of surfac
layers. The ultrasonic technique is based upon changes in the velocity of ultrasound i
the sample. Diffraction methods of residual stress measurement depend on changes in
the distance between the planes of atoms in the crystal lattice (the "d-spacing") brou
about by stress acting on a crystal. This will affect the diffraction of incident radi
providing what is effectively a highly accurate internal strain gauge. As a result of
relative complexity and size of the equipment required, this technique is less easy to
apply. X-ray and neutron diffraction techniques for residual stress measurement share,
with eddy-current, ultrasonic techniques and Barkhausen noise methods, the advantage
of being non-destructive.
3.5.1 Sectioning and cutting methods
Sectioning and cutting methods of residual stress measurement are based on
measurement of the relaxation of material, following the removal of layers or the
extension of a cut into the sample. This relaxation might be large enough to be
measured using a micrometer or vernier calliper, or small enough to require the use of
small strain gauges. These data can be used to compute the original stress state prior
sectioning/cutting. An example is the block removal and layering method described by
8/10/2019 The Effect of Residual Stress and Crack Closure on Fatigue Crack
http://slidepdf.com/reader/full/the-effect-of-residual-stress-and-crack-closure-on-fatigue-crack 52/304
Literature Review: Residual Stresses 3 9
Leggatt
[16],
which involves cutting sample blocks from a test panel, affixing strain
gauges in appropriate positions, and removing successive layers of material using a
milling machine. By recording the attendant strain changes via strain gauges, the
residual stresses existing prior to cutting can be calculated with some confidence.
Reid [17] outlined a similar method for mapping the residual stress distribution in a
compact tension specimen, using a strain gauge mounted on the back face of the
specimen, with its axis normal to the plane of the notch. Spark cutting, allowing
relaxation of residual stresses normal to the notch plane, which would affect crack
closure response in fatigue testing, extends the notch. By recording the attendant strai
changes using a back face mounted strain gauge, or a clip-gauge measuring crack
opening displacement, the residual stresses existing prior to cutting can be calculated.
3.5.2 The hole drilling method
The hole drilling method is probably the most popular and well-developed technique for
the measurement of surface residual stresses. Residual stresses are measured by
measuring the expansion or contraction of a hole drilled in the surface of the specimen.
In large components it can be considered essentially non-destructive, but in small test
pieces the hole might be considered unacceptable damage. A special three-element
strain gauge rosette is attached to the specimen at the point of interest and a small ho
drilled through its centre. The measured relieved strains due to the production of the
hole can be related to the original surface stress.
It is most important that the appropriate hole drilling method for the material being
investigated is used. For the technique to be reliable the hole production method and
geometry must be predictable, repeatable, and not introduce machining stresses,
otherwise inaccurate values will be obtained.

8/10/2019 The Effect of Residual Stress and Crack Closure on Fatigue Crack
http://slidepdf.com/reader/full/the-effect-of-residual-stress-and-crack-closure-on-fatigue-crack 53/304
Literature Review: Residual Stresses 3 10
This method is well described by Beaney and Procter
[18, 19],
and by Boag et al [20],
with appropriate data analysis techniques. Apart from the damage inflicted on the
component being examined the hole drilling method has several limitations [21]:
• Areas of high stress gradients should be avoided because the stress gradient must be
assumed to be constant across the hole;
• Areas where the stresses are greater than one third the yield strength are likely to
give erroneous results due to local plastic strain during metal removal;
• The thickness of the specimen must be at least four times the hole diameter;
• Holes must be at least eight times their diameter apart;
• Accessibility for the sometimes bulky drilling/coring device.
3.5.3 Ultrasonic Residual Stress Measurement
Residual stress measurement by ultrasonic techniques is the subject of increasing
interest [22, 23, 24]. The underlying principle of measurement of stress and/or elasti
strain by ultrasonic techniques is the approximately linear change in ultrasound veloc
with applied stress. It has been shown that residual stress can be measured using this
phenomenon. Ultrasound offers wide-ranging practical application, especially for three
dimensional stress fields. Stress is measured by inducing an ultrasound wave into the
specimen and measuring the time of flight or another velocity related parameter.
Unfortunately, there are several limitations:
• Other phenomena may affect the velocity of ultrasound in metals (e.g., texture and
microstructure) and must be understood quantitatively;
• The characteristics to be accounted for have vectorial quantities, as does acoustic
propagation, hence any mathematical relation must account for these vectorial
interrelations;
• The coupling between transducer and specimen must be reproducible.

8/10/2019 The Effect of Residual Stress and Crack Closure on Fatigue Crack
http://slidepdf.com/reader/full/the-effect-of-residual-stress-and-crack-closure-on-fatigue-crack 54/304
Literature Review: Residual Stresses 3 11
• Lack of suitable reference samples for instrument calibration.
These problems are not insurmountable, and the improvements in digital signal
processing and analysis together with the falling cost and increasingly compact nature
of circuitry, promise to make ultrasonic techniques a more accurate and viable means of
determining residual stresses [22]. The principal limitation is that the shape of the
component to be investigated may require a special probe configuration. Although still
not widely implemented commercially, examples of the successful application of
ultrasonic residual stress measurement (especially in orthotropic materials) have been
reported [23, 24]. A novel method not requiring calibration with a reference sample, has
been reported by Degtyar et al [25].
3.5.4 Residual Stress Measurement by Diffraction
Diffraction methods involve X-rays or neutrons, i.e., ionising radiation, and are
generally considered the best technique for quantitative characterisation. Although the
basic principles of each are identical, neutrons are thousands of times more penetrating
than X-rays. This means that the volume irradiated during neutron diffraction is very
large compared to X-ray diffraction, and hence more grains contribute to diffraction
peaks, minimising effects due to sampling statistics.
The reason for this difference is that in the wavelength range for diffraction - A,=10"
10
- neutrons interact with nuclei whilst X-rays interact with electrons. Otherwise the
methodology and analytical formalism are virtually identical.
Unfortunately, because of practical limitations regarding the size of specimen, the
duration of each individual experiment, and the non-portability of neutron sources,
neutron diffraction is likely to remain a laboratory tool for calibrating other destruct
and non-destructive residual stress measurement tools.
The basis of the technique is that the (x-ray or neutron) detector is moved over a range
of angles, 20, to find the angle, 0, of diffraction from grains that satisfy the Bragg

8/10/2019 The Effect of Residual Stress and Crack Closure on Fatigue Crack
http://slidepdf.com/reader/full/the-effect-of-residual-stress-and-crack-closure-on-fatigue-crack 55/304
Literature Review: Residual Stresses 3 12
condition
(A,=2dhki
s m
9 , where
dhkl is
the interplanar spacing for lattice planes with
the Miller indices
hkl.
When the Bragg condition is satisfied, sharp resonances in the
scattering intensity are observed. Precise determination of 0hki yields dhkl directly.
care it is quite possible to measure unit cell parameters with an accuracy of ±0.01%.
[28].
In the presence of residual stresses the measured interplanar spacings will be changed
by an amount Ad. This change (Ad) provides what is effectively an accurate internal
strain gauge, and hence these strains can be related to residual stresses by using the
elastic constants of the material.
Several excellent reference works have been published in this field [29, 30, 31]. These
deal with the basic theory of neutron diffraction [29, 31], and the analytical formalism
[30] applied to diffraction for residual stress measurement.
Residual stress measurement by neutron diffraction is similar in principle to the well
known X-ray technique, in which the "lattice stress" is obtained from the elastic "lattic
strain" it produces in the crystals of which it is composed. True strain is determined by
Bragg's law.
dhkj is the crystal lattice spacing corresponding to the Bragg reflection hkl observed at
a scattering angle cphkl = 20hkl, do is the unstressed lattice spacing. The scattering v
Q is defined as Q = kj - kf where kj and kf are the incident and final respective wave
vectors of magnitude 27C/X. For diffraction, Q must be perpendicular to the diffracting
planes and of magnitude 27r/d. If
is constant, differentiating Bragg's law for a given
reflection gives:
Ad
— =-cot0A0 (0 in radians)
Equation 3.2

8/10/2019 The Effect of Residual Stress and Crack Closure on Fatigue Crack
http://slidepdf.com/reader/full/the-effect-of-residual-stress-and-crack-closure-on-fatigue-crack 56/304
Literature Review: Residual Stresses
3 13
(d-dp) Ad
indicating that a small lattice strain e =
~ —
=
— w i l l
produce a shift in scattering
angle. From this change in scattering angle, A(J) = 2A0 = -2e.tan0, the lattice strain "
can be determined. Obviously, the direction of measured strain will be the same as the
scattering vector Q. See Figure 3.4 below.
Specimen
d is measured in
this
direction
Figure 3.4, Schematic representation of incident
k),
scattering
Q),
and final
k
r
)
wave vectors with respect to the specimen in neutron diffraction
It is important that the unstressed lattice spacing do is known accurately. Variations i
do
due to compositional differences are only important if these are comparable with
changes in
do
due to stress magnitude and spatial scale. Triaxial stress measurements
utilise the difference Ad (= d - do), which is very small for elastic strains, typically
d
IO"
3
to IO"
4
, requiring high instrumental resolution. A 0.1% error in do can cause very
large errors in Ad, and the implied lattice strains and stresses. To obtain results with
acceptable error (±10%) from a triaxial solution, do must be within 0.01% of its true
value. A relatively simple technique for the determination of do (the unstressed lattice
parameter) is to use powder x-ray or neutron diffraction on a sample of filings of the
material to be investigated. Powder particles of such a sample cannot sustain a

8/10/2019 The Effect of Residual Stress and Crack Closure on Fatigue Crack
http://slidepdf.com/reader/full/the-effect-of-residual-stress-and-crack-closure-on-fatigue-crack 57/304
Literature Review: Residual Stresses 3 14
macrostress,
and the average microstress in a representative sample is
zero.
Hence the
plane spacing obtained from such an experiment should be representative of an
unstressed sample. An alternative is to use an annealed sample of the same material,
such that residual stresses have been relieved, and derive do from such a sample.
However, annealing procedures may themselves introduce other factors affecting plane
spacing. Schwartz and Cohen [28] reviewed the various procedures for determination of
do, including those that may allow do to be derived from data acquired during the stres
measurement itself.
The volume of material sampled is defined by the cross section of the incident and
diffracted beams on the sample. Their directions are defined by "Soller" slit collimat
or by the window presented by the apertures at the sample. The cross sectional area of
the incident beam is defined by neutron absorbing cadmium masks (see Figure 3.5).
Typically, the minimum volume that can be sampled is ~8mm
3
. Small examined
volumes tend to lead to time consuming experiments due to the low intensity of the
neutron beam, and hence larger volumes are necessary, this results in better sampling
statistics compared to X-rays.
Having determined the strain in a given direction and assuming the material is isotropi
the stress is determined using the Young's modulus and Poisson's ratio of the bulk
material. Obviously these must be known with some accuracy if absolute stress is to be
determined. It may be necessary to establish an effective "neutron" Young's modulus by
a diffraction calibration experiment in which the sample is subjected to known strains
rather than to use the bulk value. Steels are composed of crystals with cubic symmetry
that have anisotropic elastic constants, and any texture present will cause the materi
have anisotropic elastic properties. Pintshovus and Jung [32] demonstrated that this
could influence the stress determined by diffraction measurements.

8/10/2019 The Effect of Residual Stress and Crack Closure on Fatigue Crack
http://slidepdf.com/reader/full/the-effect-of-residual-stress-and-crack-closure-on-fatigue-crack 58/304
Literature Review: Residual Stresses 3 15
Energy dispersive neutron diffraction utilises a pulsed neutron source containing a
range of wavelengths. Energy dispersive neutron diffraction has been shown to be better
able to cope with highly textured material, like the steel that is the subject of this
In the present work, the neutron source was a thermal nuclear reactor (HIFAR - High
Flux Australian Reactor) [33], and the wavelength {X of the neutrons was selected
using a single crystal germanium monochromator. Some experimental details differ and
these are covered in the literature [34, 35].
Figure 3.5 Definition of examined volume for neutron diffraction using C d masks

8/10/2019 The Effect of Residual Stress and Crack Closure on Fatigue Crack
http://slidepdf.com/reader/full/the-effect-of-residual-stress-and-crack-closure-on-fatigue-crack 59/304
Literature
Review: Residual Stresses 3 16
3.5.5 Eddy Current and Magneto-elastic Effect Based Methods of Residual
Stress Measurement
Other non-destructive methods of residual stress measurement are available. These
include eddy current techniques and methods utilising the Barkhausen effect (which
involves the interaction of a material's elastic properties with its magnetic domain
structure - known as "magnetoelastic interaction"). Whilst these techniques are often
able to provide engineers with useful on-site information, their capability regarding
quantitative characterisation of residual stress fields is severely limited. Ruud [22],
presented a review of residual stress measurement techniques covering these and other
methods.
3.5.6 Residual Stress Analysis Using the Thermo-elastic Effect
A most promising new method emerging in recent years is SPATE (stress pattern
analysis by thermal emission) [36,37]. This involves observation of the effect of
residual stress on the heat generated when the specimen is vibrated, i.e., the thermo-
elastic effect. The equipment is based around a scanning radiometer able to resolve
variations in temperature as small as 0.001°K. This technique has some unique
attractions, not least that it is non-contact method.
8/10/2019 The Effect of Residual Stress and Crack Closure on Fatigue Crack
http://slidepdf.com/reader/full/the-effect-of-residual-stress-and-crack-closure-on-fatigue-crack 60/304
Literature Review: Residual Stresses
3.17
REFERENCES
1. Andrews, K.W., Physical Metallurgy - Volume 2 Techniques and Applications
(1973),
London, Allen & Unwin.
2. Denton, A.A., Metallurgical Reviews (No. 101), (1966), 11, 1.
3. Noyan, I.C. & Cohen, J.B., Residual Stress: Measurement by diffraction a
interpretation,
(1987),
Springer-Verlag, N e w York.
4. Guo, B.L., Li, T-X and Li, T-X, "Experimental research of the effect of
on fatigue lives of cracked pressurised thick-walled cylinders," in proceedings of
High Pressure Technology: Material, design, Stress Analysis, (1988) A S M E ,
York.
5. Hermann. R. and Reid, C.N., "Enhancing the fatigue life of fastener holes
aluminium-lithium alloy 8090" in Conf Proc, Al-Li 5
(1989),
pp.1607-1616.
6. Clark, G. "Modelling residual stresses and fatigue crack growth at cold-
fastener holes," Fatigue Fract.
Eng.
Mater. Struct.,
(1991),
14, pp579-589.
7. Edwards, L. and Ozdemir, A.T. "Residual stresses at cold expanded fasten
in Measurement of Residual and Applied Stress Using Neutron Diffraction, ed
M.T. Hutchings and A.D. Krawitz, 1992,
Kluwer
Academic Publishers, London.,
pp545-553.
8. Cheever, D.L. & Rowlands, E.W. "Vibrational Conditioning of Castings and
Weldments: A n exploratory study," in Control of Distortion and Residual Stress i
Weldments
ed.
Saperstein Z.P., (1977), A S M .
9. McClinton, M. and Cohen, J.B., "Changes in Residual Stress during the Te
Fatigue of Normalized and Peened S A E 1040 Steel," Materials Science and
Engineering
56, (1982),
pp259-263.
10. Averbach, B.L. and Lou, B., "Fatigue Crack Propagation through Residual
Fields,"
in Advances in Fracture Research: Fracture 84 Proceedings of 6th
International Conference on Fracture, (1986) pub. Pergammon Press,
ppl631-
1640.
11. Papazoglou, V.J., "Study of residual stresses and distortion in structu
in high strength steels," pub: Massachusetts Institute of Technology, Cambridge,
Mass. 1981.
12. Nichols, R.W., "The use of overstressing techniques to reduce the risk
brittle
fracture
-
Part 1," British Welding
Journal,
January 1968.
13. Nichols, R.W., "The use of overstressing techniques to reduce the risk
brittle fracture - Part 2," British Welding Journal, February 1968.
14. Okamato, A. and Nakamura, H., "Influence of residual stress on fatigue
Journal of Pressure Vessel Technology Trans. ASME, 112,
(1990),
pp
199-203.

8/10/2019 The Effect of Residual Stress and Crack Closure on Fatigue Crack
http://slidepdf.com/reader/full/the-effect-of-residual-stress-and-crack-closure-on-fatigue-crack 61/304
Literature Review: Residual Stresses
3.18
15.
Burck, L.H., Miklasiewicz, R.J., and Weiss, S., "A study of vibrational residual
stress relaxation parameters in weldments," in Weldments: physical metallurgy
and
failure phenomena proceedings of the Fifth Bolton Landing Conference, Aug
1978, ed. R. J. Christoffel, E. F. Nippes, H. D. Solomon, Pub: Schenectady, N.Y.,
General Electric Co.,
c
1979.
16. Leggatt, R., Residual Stress Measurements at Repair Welds in Pressure V
Steels in the As-Welded Condition,
(1986),
The Welding Institute, Cambridge.
17. Reid, C.N., "A Method of Mapping Residual Stress in a Compact Tension
Specimen," Scripta Metallurgica,
(1988),
22, pp451-456.
18. Beaney, E.M. & Procter E., "A critical evaluation of the centre hole te
the measurement
of residual
stresses,"
Strain,
Jan.,
(1974).
19. Beaney, E.M., "Accurate measurement of residual stress on any steel usi
centre hole method,"
Strain,
July,
(1976).
20. Boag, J.M., "Considerations of Using the Hole Drilling Method for Measu
Residual Stress in Engineering Components," in Residual Stress ed. Young, W. B.
(1987),
A S M International.
21. Ruud, CO., "A Review of Nondestructive Methods for Residual Stress
Measurement,"
J
of Metals, 33 (6) (July 1981) pp35-40.
22. Bray, D.E. et al, "Application of the L//C//R Ultrasonic Technique for
Evaluation of Post-weld Heat-treatment in Steel Plates," in Nondestructive
Evaluation: NDE Planning and Evaluation,
N D E v 5,
pp
191-197, (1989), A S M E ,
N.Y.,
US A.
23. Degtyar, A.D., Lavrentyev, A. I. Rokhlin, S. I., "New method for determ
applied and residual stresses in anisotropic materials from ultrasonic velocity
measurement," Materials Evaluation, v 55 n 10 Oct 1997.
ppl
162-1168.
24. Schramm, Raymond E. Van Clark, A. Szelazek, Jacek, "Ultrasonic measurem
residual stress in cast steel railroad wheels," in
Determining Material
Characterization: Residual Stress and Integrity with NDE American Society
Mechanical Engineers, Pressure Vessels and Piping Division (Publication) PVP. v
276 1994. A S M E , N e w York, N Y , US A. ppl57-162.
25. Tanala, E. Bourse, G. Fremiot, M. De Belleval, J F "Determination of ne
residual stresses on welded joints using ultrasonic methods," NDT e
International, v 28 n 2 Apr 1995. pp83-88.
26. Koyabashi, H. et al, "Nondestructive Measurement of Welding Residual St
Acoustoelastic Technique and Prediction of Fatigue Crack Growth," in
Nondestructive Evaluation: NDE Planning and Evaluation, N D E v 5, ppl85-18
(1989), A S M E ,
N.Y.,
USA .

8/10/2019 The Effect of Residual Stress and Crack Closure on Fatigue Crack
http://slidepdf.com/reader/full/the-effect-of-residual-stress-and-crack-closure-on-fatigue-crack 62/304
Literature
Review:
Residual Stresses
3.19
27. Allen, D.R., et al, "The Use of Ultrasonics to Measure Residual Stresses," in
Research Techniques in Nondestructive Testing Vol. 6, ed. Sharpe R.S., (1982)
Academic Press.
28. Schwartz, L.H. & Cohen, J.B., Diffraction from Materials, (1987), Springe
N e w York.
29. Bacon, G.E., Neutron Diffraction (2nd edn.), (1962), Clarendon Press, Oxfo
30. Noyan, I.C. and Cohen, J.B., Residual Stress: measurement by diffraction
interpretation,
(1987),
Springer-Verlag, N e w York
.
31. Allen, A.J. et al, "Neutron diffraction methods for the study of residu
fields," Advances in
Physics,
(1985), 34
(4) pp445-473.
32. Pintshovus, L. and Jung, V., "Residual Stress Measurements by means of N
Diffraction,"
Mat. Sci.
Eng.
(1985), 61,
pp43-50.
33. Howard, CJ. et al, "The Australian High Resolution Neutron Powder
Diffractometer," AHA*.
J
Phys.,
(1983),
36,
pp507-18.
34. Allen, A.J. et al, "Neutron diffraction methods for the study of residu
fields," Advances in Physics,
(1985),
34
(4)
pp445-473.
35. Prask, H.J. & Choi, C.S., "Residual Stress Measurements in Armament-Syst
Components by Means
of
Neutron Diffraction,"
in
Residual Stress ed. Young W.B.,
(1987),
A S M International.
36. Wong, A.K., Dunn, S.A. and Sparrow, J.G., "Residual stress measurement b
means
of the thermoelastic effect," Nature, (1988)
332 pp613-615.
37. Stanley, P. and Chan, W.K., "The determination of stress intensity facto
crack-tip velocities from thermoelastic infra-red emissions," in Proceedings of
International Conference
on
Fatigue of Engineering Materials
and
Structures,
I,(1986),ppl05-114.

8/10/2019 The Effect of Residual Stress and Crack Closure on Fatigue Crack
http://slidepdf.com/reader/full/the-effect-of-residual-stress-and-crack-closure-on-fatigue-crack 63/304
Literature Review: Crack Closure
4.1
4 Crack Closure
The mean stress experienced by the specimen during cyclic loading has a marked effect
upon crack propagation. This mean stress effect is intimately connected with the
phenomenon of crack closure, whereby the crack opens for only part of the loading
cycle. Direct proof of crack closure has been obtained from stiffness measurements, an
indirectly from, for example, fatigue crack growth behaviour. It is now widely accepte
that crack closure effects have particularly strong influence at or near the fatigue
threshold.
Elber [1] introduced the concept of crack closure in the late 1960s. Residual strains
material in the wake of the propagating fatigue crack make mating fracture surfaces
incompatible. As a result the crack is open at the tip for only part of the loading cy
even when the cycle is fully tensile. Elber also commented that this phenomenon woul
affect striation shape when the closure stresses exceeded the yield stress in compress
Elber introduced the concept of the effective stress intensity AK
e
ff, which is determi
by the stress intensity at which the crack begins to open K
op
such that:
AK
eff
=K
max ~
K
op
Equation 4.1
Subsequently it has been shown that plastic deformation and/or corrosion debris [2] i
the wake of the crack tip can also lead to the crack being closed for a large part of
loading cycle.

8/10/2019 The Effect of Residual Stress and Crack Closure on Fatigue Crack
http://slidepdf.com/reader/full/the-effect-of-residual-stress-and-crack-closure-on-fatigue-crack 64/304
Literature
Review: Crack Closure
4.2
4.1 Influence of mean load and load ratio*
(R)
upon fatigue crack closure
It is known that increasing the ratio R of the minimum to maximum stress intensity per
K da
cycle (R = —
r m
- is found to increase the crack propagation rate
~TJ^
for the same stress
max
intensity amplitude AK, as well as lowering the crack growth threshold AK
t
h for steels
[3]. The fraction of the load cycle for which the crack will be open is given by:
u=
K
max-
K
op _AK
eff
K
m a x
_ K
m i n
A K
Equation 4.2
Using this relationship, Elber [3] accounted for the influence of mean load, and load
history, on crack advance by assuming that ^ is governed by AKeff, (the portion of the
load cycle for which the crack is open). If the mean stress is higher, then AK
e
ff will
larger since the crack will be open for a greater proportion of the loading cycle. In
if the mean stress is high enough (e.g. typically when R>0.5) then the crack will open
for almost the entire load cycle. AKeff
is
generally considered the appropriate field
parameter for correlation of fatigue crack growth rates under various loading conditio
This is illustrated in Figure 4.1.
* R is the ratio of minimum to maxi mum load P„„„:P
milx
. Since the stress intensity factor K is proportional
to the load, R = - 2 2 - =
— *
x
max
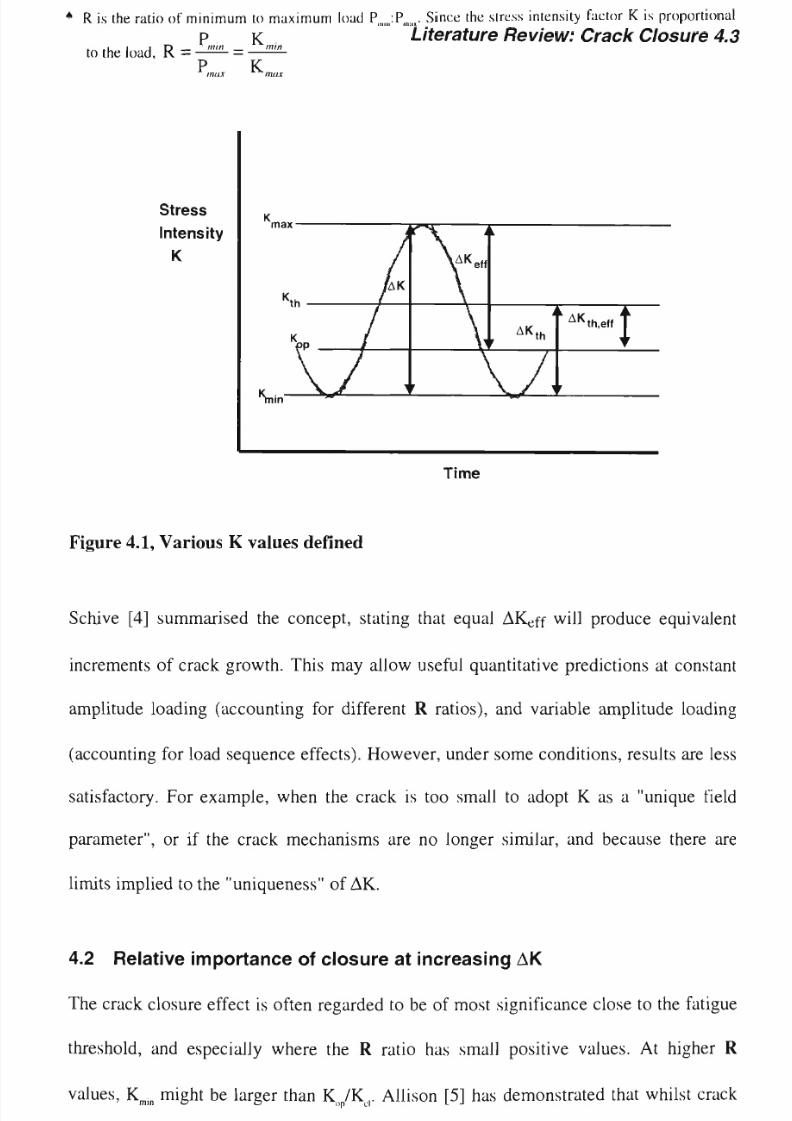
8/10/2019 The Effect of Residual Stress and Crack Closure on Fatigue Crack
http://slidepdf.com/reader/full/the-effect-of-residual-stress-and-crack-closure-on-fatigue-crack 65/304
Literature Review:
Crack Closure 4.3
Stress
Intensity
K
Time
Figure 4.1, Various K values defined
Schive [4] summarised the concept, stating that equal AKeff will produce equivalent
increments of crack growth. This may allow useful quantitative predictions at constant
amplitude loading (accounting for different R ratios), and variable amplitude loading
(accounting for load sequence effects). However, under some conditions, results are les
satisfactory. For example, when the crack is too small to adopt K as a "unique field
parameter", or if the crack mechanisms are no longer similar, and because there are
limits implied to the "uniqueness" of AK.
4.2 Relative importance of closure at increasing AK
The crack closure effect is often regarded to be of most significance close to the fat
threshold, and especially where the R ratio has small positive values. At higher R
values, K
rain
might be larger than K„
p
/K,. Allison [5] has demonstrated that whilst crac
closure effects are considered to be most pronounced at low values of AK, in some case

8/10/2019 The Effect of Residual Stress and Crack Closure on Fatigue Crack
http://slidepdf.com/reader/full/the-effect-of-residual-stress-and-crack-closure-on-fatigue-crack 66/304
Literature
Review:
Crack Closure 4.
(e.g. as Ti-Al alloys) the effect is also large at high A K. This is demonstrated in Figure
4.2, which also shows the ability of AK„
r
to "normalise" fatigue data.
CJ
10"
p
10" r
£
<o%
Z
-a
10 r
10 r
10
=
z
-
jf
'
1
—
z
z
-
-
1
-
X
0
+
Tl-
Ti-
Ti-
o+
•4AI.ST+Q jyt
8AI,
Aged
•8AI. ST+Q „ .
+
Tsstt- JI -; - o
_i
£?>
iff
£
*
?
•
° +
X ° +
x <9
+
2 8 *
f e
*
* s t
x 5 *
x * |
J / * ;
* - i
8, +
• ¥ i i i O i 1 i i i r I i i I
10
100
A K
(MPaVm)
s
B
1tf V
10'
10
10
-
10 =•
10
x Ti-4AI,ST+Q
* Ti-8Al,Aged
o Ti-8AI,ST+Q
xV
up
*+0
J?
y
x t
x
l I 1 I I t I I
10
AK ,
f
(MPaVm)
100
Figure 4.2,
T h e
effect of plotting fatigue data for Ti-Al alloys
as a
function AK
efT
instead
of
AK , also demonstrating
the
importance
of
crack closure
over
a
range of
A K
(after Allison [5])
4.3
Mechanisms
of
crack closure
The three principal mechanisms of crack closure (plasticity, oxide and roughness-
induced) are illustrated schematically in Figure 4.3.

8/10/2019 The Effect of Residual Stress and Crack Closure on Fatigue Crack
http://slidepdf.com/reader/full/the-effect-of-residual-stress-and-crack-closure-on-fatigue-crack 67/304
Literature Review: Crack Closure 4.5
Plastic zone
Plasticity-induced closure
r ^
y +-Ky
^r Oxide-induced closure
oxide debris
Roughness-induced closure
Figure 4.3, schematic representation of closure mechanisms
Vasudevan et al [6] have reviewed closure and related phenomena. Although two other
contributing mechanisms have been identified, i.e. phase transformation and viscous
fluids, plasticity, roughness (apserity), and oxidation are considered the most importan
There is some debate as to the relative importance of plasticity and roughness
mechanisms of crack closure. Crack closure due to oxidation or corrosion products on
the fracture surfaces is obviously affected by environmental conditions, and the
exposure of the fracture surfaces to those conditions, which in turn may be affected by
factors such as load ratio and frequency. Some reviewers such as Vasudevan et al have
questioned the importance of the crack closure phenomenon and its use as a means of
explaining the effect of load ratio on fatigue threshold altogether, but have still
acknowledged its existence as a real effect.

8/10/2019 The Effect of Residual Stress and Crack Closure on Fatigue Crack
http://slidepdf.com/reader/full/the-effect-of-residual-stress-and-crack-closure-on-fatigue-crack 68/304
Literature Review: Crack Closure 4 6
4.3.1 Plasticity induced closure
Schive [7] reviewed plasticity effects and crack closure. Evidence was presented
showing that even very small plastic zone sizes are sufficient to leave residual
deformation causing closure, and residual stress. The size of the plastic zone is
dependent on the plastic flow properties of the material. Its dimensions have been
shown [8] to be roughly proportional to the square of the ratio of the crack-opening
stress intensity factor to the yield stress. It is commonly given the symbol r
p
referring
to the nominal plastic zone radius. Where the plastic zone is small relative to the
specimen dimensions it is given approximately by the following equations:
r
2K
V
2
for plane
stress,
and
Equation 4.3
K
J_
(„ V
i_
in plane strain.
Equation
4.4
Ki is the crack-opening stress intensity factor*, and a
y
is the yield stress.
Such estimates reflect the plastic zone size, but ignore its shape. They imply that more
closure should occur at the surface of e.g., a plate, due to the larger plastic zone. This i
borne out by the well-known phenomenon of curved crack fronts, with the ends of the
crack at the specimen surface trailing behind. In reality, this model proves rather
simplistic. Such a large difference in plastic zone size can only come about if both
develop independently. Due to the continuity of the material, this cannot occur. The
The opening mode stress intensity factor is given by K[ =
G(TZa)
2
a
where
a
is the crack length and a is
a factor dependent on geometry and loading conditions (often taken as 1).

8/10/2019 The Effect of Residual Stress and Crack Closure on Fatigue Crack
http://slidepdf.com/reader/full/the-effect-of-residual-stress-and-crack-closure-on-fatigue-crack 69/304
Literature Review: Crack Closure 4.7
plastic zone size in the plane stress surface area will be smaller than predicted for the 2
dimensional plane stress situation. The tensile stresses in the plane strain plastic zon
will be larger, due to the higher effective (von Mises) yield stress. This approach offe
an alternative explanation for curved crack fronts.
The overall effect is that the plastically deformed material will not "fit in" with the
elastically deformed material surrounding it upon removal of the crack-opening load.
This leads to compressive residual stresses being generated in the wake of the crack tip
as the fracture surfaces are pressed together by the elastic relaxation of the surroundi
material. The extent of this stress field will extend outside the plastic zone. Full ela
unloading will lead to residual compressive stresses at the crack tip in excess of the
compressive yield point. This leads to reversed plastic deformation ahead of the crack
tip or a "reversed plastic zone". The size of this reversed plastic zone is about a quar
of the "monotonic" plastic zone size. The stress required to cause yielding in the
reversed direction may be assumed to be twice the yield stress during uploading.
Finite element analysis of the region about the crack tip by Ohji et al [9, 10], has sho
that fatigue crack growth behaviour is generally consistent with the AKeff predicted.
Fleck [11] (using an elastic-plastic approach) suggested that closure occurs over a
"transient increment" of crack growth. Further, it is suggested (logically) that closure
often discontinuous along the crack front. This is consistent with a variation in plasti
zone size as stipulated above.
Chen and Nisitani [12, 13] applied the extended body force method to the simulation
analysis of plasticity induce closure. Based on their results, they found an apparent li
between the various models [12], and that in a crack growing at constant AK, K
op
does
not become constant. It was stated that where AK is constant the amount of plastic
deformation either side of the crack becomes constant, and where Ao is constant it

8/10/2019 The Effect of Residual Stress and Crack Closure on Fatigue Crack
http://slidepdf.com/reader/full/the-effect-of-residual-stress-and-crack-closure-on-fatigue-crack 70/304
Literature Review: Crack Closure 4.8
becomes proportional to crack
length.
In a more recent paper [13], they applied the same
principles to explain the delaying effects of overloads from a plasticity induced closur
standpoint.
4.3.2 Oxide induced closure
In addition to the effect of plastically deformed material in the wake of the crack tip,
corrosion debris (principally oxides) has a similar effect in closing the crack on remov
of a crack opening load. Corrosion deposits invariably occupy a greater volume than the
original material. Hence, on unloading the crack surfaces are effectively wedged apart
by such material. This is still referred to as "closure" because it is the corrosion deb
that actually fills the space between the fracture surfaces on unloading.
The role of corrosion deposits in fatigue crack closure has been the subject of much
investigation. Ultimately it is probably the most difficult factor to predict in real
situations since it is wholly dependent upon the environment to which the material at th
crack tip is exposed.
Evidence of the role of oxide debris in closing fatigue cracks has been provided by
Ritchie and Suresh et al [14, 15], and by Stewart [16]. Dry hydrogen and helium (i.e.,
non-corrosive environments) have been shown to lower crack growth rates compared to
humid air [15]. This has been interpreted as "oxide induced crack closure". Suresh et al
[18] provided evidence that the thickness of oxide deposits of fracture surfaces can be
related to crack growth rates. Further, it was shown that at AK
m
the thickness of the
oxide layer could be comparable to the predicted crack tip opening displacement
(CTOD). This suggests that a crack might be non-propagating due to being wedged
closed by oxide debris.

8/10/2019 The Effect of Residual Stress and Crack Closure on Fatigue Crack
http://slidepdf.com/reader/full/the-effect-of-residual-stress-and-crack-closure-on-fatigue-crack 71/304
Literature Review: Crack Closure
4 9
Vas ude van et
al's
review [6] su mma rise s the contribution of oxidation/corrosion effects,
generally attributed to mechanical fretting*. Fretting breaks up oxide films that form o
the fracture surfaces, and re-exposes the fresh metal surface to the environment. Withou
fretting asperities due to oxide or corrosion are insignificant in ambient conditions.
However, more severe oxidation or corrosion may occur which is deterministic. The
latter is more likely to produce a contiguous film of oxide, or other corrosion product,
on the fracture surface rather than more random asperities, and hence result in more
complete crack closure.
4.3.3 Roughness induced crack closure
When the "rough" nature of the fracture surface is such that the crack tip opening
displacements are of a comparable scale to the asperities on the fracture surface, this
be a cause of crack closure. This can be the most important closure mechanism where
the plastic zone size is very small (e.g., in low fracture toughness materials), and at
threshold crack growth rates. Suresh and Ritchie [17] reviewed this aspect of closure,
and presented evidence that correlated aspects of roughness induced closure with
maximum plastic zone size and microstructural features.
Halliday and Beevers [19], observing "crystallographic" crack growth in Ti-6A1-4V,
described the phenomenon as "non-closure", since the fracture surfaces contact at
discrete points behind the crack tip.
* Fretting is broadly defined as damage that occurs when two closely fitting metal surfaces are subjected
to
vibration.

8/10/2019 The Effect of Residual Stress and Crack Closure on Fatigue Crack
http://slidepdf.com/reader/full/the-effect-of-residual-stress-and-crack-closure-on-fatigue-crack 72/304
Literature
Review:
Crack Closure 4.10
Roughness induced closure has been modelled geometrically by Li et al
[20].
This work
suggested that roughness induced crack closure could occur in the absence of mode II
and mode III displacements at the rack tip. The idealised geometric relationships
proposed for this are shown in Figure 4.4 and Figure 4.5. This model proposed that the
"most severe contact region is at the crack tip", as a result of the discrete asperitie
coming into contact. Later work by Fitzpatrick et al [21] contradicts this position and
contends that, especially during the stage II "Paris-regime", roughness-induced crack
closure cannot occur from elastic displacements of the crack surfaces alone. This work
asserts that for closure to occur there must be some residual displacement of material
the wake of the crack. Such residual displacement could be due to plasticity, formation
of oxide layer (or corrosion deposit), or relaxation of residual stress.
Wang et al [22] utilised dislocation theory and continuum fracture mechanics to
simulate roughness-induced closure of an ideal crack path. This indicated that K
cl
was a
function of K
mM
, maximum slip length of the dislocation, tilt angle of the crack profile
and the yield strength. Applied to real cracks Wang's model predicts that K
cl
is related
to K
max
and the standard deviations of asperity height and angles of the crack profile.
Jung et al [23] reported that when asperity height is relatively high compared to the
crack length, K
cl
, becomes a function of crack length. Otherwise K
cl
appears virtually
independent of crack length.
Drury et al [24] characterised fatigue crack profiles quantitatively. It was demonstra
that scale-dependent characteristics, such as asperity height, represent the aspects of
crack geometry that have an interactive role in crack closure, and not the dimensionles
scale-independent attributes such as height-to-width ratio of asperities.

8/10/2019 The Effect of Residual Stress and Crack Closure on Fatigue Crack
http://slidepdf.com/reader/full/the-effect-of-residual-stress-and-crack-closure-on-fatigue-crack 73/304
Literature Review: Crack Closure 4.11
h = asperity height ab ov e cra ck pl ane
r
0
,=
distance from crack tip to base of asperity
Figure 4.4, Geometric relation of crack closure with a trapezoidal asperity, after
Li et al [20])
Figure
4.5,
Geometric relation of crack closure with triangular asperities, after Li
et al [20])
Roughness induced crack closure depends upon asperity mismatch. Hence, any
influence of K
max
on fracture surface topography is important. For some materials the
fracture surface can become smoother at high AK. This implies that K decreases with
increasing K
mM
. However, for others (e.g. titanium alloys and some aluminium alloys)
the fracture surface roughness (or topography) appears independent of K
max
. The cause
asperity mismatch is still not fully understood and, as discussed earlier, is the sub
conflicting research, e.g. [20, 21].

8/10/2019 The Effect of Residual Stress and Crack Closure on Fatigue Crack
http://slidepdf.com/reader/full/the-effect-of-residual-stress-and-crack-closure-on-fatigue-crack 74/304
Literature
Review: Crack Closure 4.12
4.4 Effect of microstructure on crack closure
Roughness induced crack closure has also been shown to be affected by structural
considerations. For example Knowles et al [25] have compared the change in crack
shape when growing cracks in SiC reinforced metal matrix composites compared to the
unreinforced matrix alone, Roebuck [26] also reported parabolic curved crack fronts i
metal matrix composites. The principal closure mechanism in these reinforced materials
was attributed to roughness [25]. This was the case even though the actual fracture
surface roughness is similar for both reinforced and unreinforced materials. In the case
of the reinforced material the crack was found to propagate entirely through the matr
The difference in crack closure effect was attributed to the limited asymmetric crack t
deformation possible in the SiC reinforced materials. Sun et al [27] have found that
roughness induced fatigue crack closure effect in dual-phase steels increased with th
volume fraction of martensite present. This would appear to be consistent with work b
Biner et al [28] which indicated that increased surface roughness and crack deflectio
are inevitable in dual phase materials.
Allison [5] commented that microstructure may effect the tendency for fatigue cracks
branch. Crack branching may lead to the displacement of asperities in the wake of the
crack tip, thereby leading to the mismatch responsible for crack closure.
4.5 Measurement of Crack Closure
Crack closure has been measured by a variety of methods, such as ultrasonics, acousti
emission, electrical -PD- methods, and compliance techniques. Electrical methods suffer
from the formation of an insulating layer of oxide on the fracture surfaces, and
ultrasonic methods may indicate that, due to the contact of asperties on the mating
fracture surfaces, the crack is closed when in fact it is mechanically open. It is gener
agreed that compliance based techniques are the most versatile and accurate for standar

8/10/2019 The Effect of Residual Stress and Crack Closure on Fatigue Crack
http://slidepdf.com/reader/full/the-effect-of-residual-stress-and-crack-closure-on-fatigue-crack 75/304
Literature
Review:
Crack Closure 4.13
specimen geometries. A typical response from a clip gauge allowing the determination
of closure load is shown in Figure 4.6. Here the Hookean part of the load vs. crack
opening displacement (COD), or strain, is extrapolated back to zero load, and the strai
deviation (Astrain) of the load v. strain line plotted against load. This enables the
load to be identified, when Astrain becomes zero, (shown by a change to vertical in the
plot of load vs. Astrain). Having established the opening/closing load, Kop/Kd can be
calculated for a given crack length using standard solutions for stress intensity fact
t.2St
l.BEf
•
.BE:
""I
1
F T
t
» ' T 1 P—¥—I
1
• t* '1
'I*
f I '
'f
' I
'
I |
TJ
CO .7
O
e;
.6£-
.5E:
.4E-
,3B-
2E-
" i- r M '«*'
Load vs Astrain
y
i
y
S*
^y
Load vs Strain
^1-
s>
x
y~I_
y
j * \\*r Closure load
•y
e t •
/
/
,i
y*
w
/
0.3Q
.as
- ia
.213
Crack Opening Displacement (COD)
Figure 4.6, Determination of closure load from crack opening displacement [29]
Schive [4] and Allison [5] have reviewed the various options available for closure
measurement in some detail. The back face strain gauge method of measuring crack
closure is dealt with in detail in Chapter 6, which covers experimental techniques. As
rule, compliance methods, using back face strain (BFS) or crack opening displacement
(COD) are much preferred to the other options, and are generally convenient and easy t
understand. These techniques average the effect through the specimen thickness. This is
important, since it has been observed by Fleck [30] that, regardless of the closure va
observed at the specimen surface, bulk closure values tend to influence average fatigue
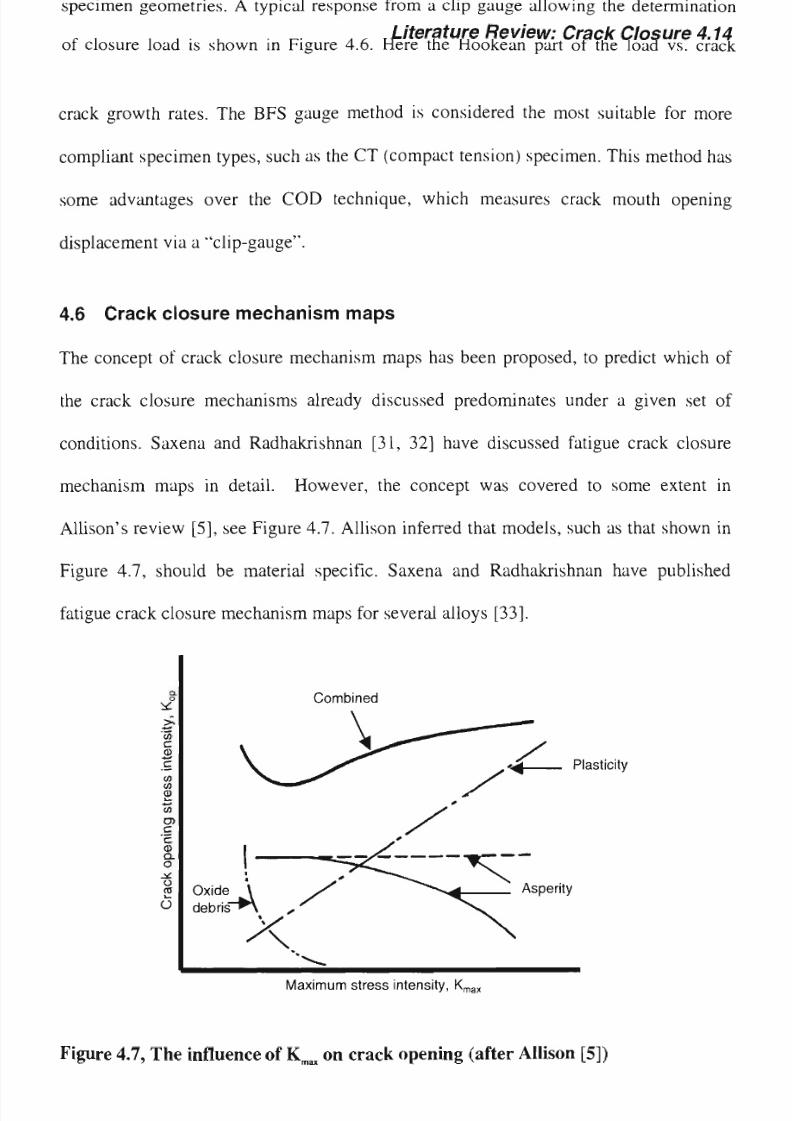
8/10/2019 The Effect of Residual Stress and Crack Closure on Fatigue Crack
http://slidepdf.com/reader/full/the-effect-of-residual-stress-and-crack-closure-on-fatigue-crack 76/304
Literature
Review: Crack
Closure
4.14
crack growth rates. The B F S gauge metho d is considered the m ost suitable for m o r e
compliant specimen types, such as the CT (compact tension) specimen. This method has
some advantages over the COD technique, which measures crack mouth opening
displacement via a "clip-gauge".
4.6 Crack closure mechanism m aps
The concept of crack closure mechanism maps has been proposed, to predict which of
the crack closure mechanisms already discussed predominates under a given set of
conditions. Saxena and Radhakrishnan [31, 32] have discussed fatigue crack closure
mechanism maps in detail. However, the concept was covered to some extent in
Allison's review [5], see Figure 4.7. Allison inferred that models, such as that shown in
Figure 4.7, should be material specific. Saxena and Radhakrishnan have published
fatigue crack closure mechanism maps for several alloys [33].
to
c
ffi
c
to
to
tD
'—
to
cn
c
'c
03
a
o
-<:
O
to
—
Combined
«m Plasticity
Asperity
Maximum stress intensity, K
n
Fig ure 4.7,
T h e
influence of K
m a x
on
cr ac k op e ni ng after Allison
[5])

8/10/2019 The Effect of Residual Stress and Crack Closure on Fatigue Crack
http://slidepdf.com/reader/full/the-effect-of-residual-stress-and-crack-closure-on-fatigue-crack 77/304
Literature Review: Crack Closure 4.15
4.7 Modelling crack closure
Since the concept was first introduced by Elber [1] there has been a large amount of
work published regarding various means of modelling fatigue crack closure. This
includes application of boundary element methods, e.g. [34], and many more
publications where finite element modelling (FEM) techniques have been applied, e.g.
[11, 35, 36, 37, 38, 39, 40, 41]. Chen et al [42] have reviewed the subject of crack
closure and have proposed a model utilising linear elastic fracture mechanics (LEFM).
Nowell's application of a boundary element method to model plasticity-induced crack
closure [34] was found to produce qualitative agreement with experimental data,
predicting crack shape, stress and plastic deformation. This model utilised a Dugdale-
type strip model of the plastic zone at the crack tip together with quadratic program
techniques.
Elastic-plastic finite element analyses of fatigue crack closure have been performed
several research groups, [35, 36, 37, 38, 40, 41]. Choi & Song [36] and Wu & Ellyin
[37] have applied the FEM technique to modelling the closure behaviour of fatigue
cracks in residual stress fields. Both reported that compressive residual stresses
influenced crack closure.
McClung [35] and Gall et al [38] have identified that scale dependent effects,
particularly the mean stress effect, may be affected by the relative magnitude of COD
and plasticity about the crack line. McClung [35] reported that the application of FE
modelling techniques worked well in the small-scale yield regime, but its effectivene
progressively deteriorated as cyclic loading conditions increased beyond this. Gall et
[38] reported that FEM modelling predicted that plasticity induced crack closure woul
occur when the crack tip plastic zone size r
p
) was smaller that the grain size. It was
reported that crystallographic orientation would influence plasticity induced closure,
since orientation will influence the predominant slip-system.
8/10/2019 The Effect of Residual Stress and Crack Closure on Fatigue Crack
http://slidepdf.com/reader/full/the-effect-of-residual-stress-and-crack-closure-on-fatigue-crack 78/304
Literature Review: Crack Closure
4.16
Zhang et al [40] found that using elastic-plastic F E M to predict crack closure resulted in
lower values of crack opening stress than were observed experimentally. Direct
observation of cracks in the SEM, revealed that the difference between the actual crac
opening stress and that predicted by elastic plastic FEM was due to contact of asperi
on the fracture surfaces. It was concluded that crack closure was due to a combination
a "plastic wake" and roughness induced closure.

8/10/2019 The Effect of Residual Stress and Crack Closure on Fatigue Crack
http://slidepdf.com/reader/full/the-effect-of-residual-stress-and-crack-closure-on-fatigue-crack 79/304
Literature Review: Crack Closure 4.17
REFERENCES
1. Elber, W., "Fatigue Crack Closure Under Cyclic Tension," Eng. Fract. Mech
(1970),pp37-45.
2. Scott, P.M., "Effects of Environment on Crack Propagation," in
Developme
Fracture
Mechanics - 1,
ed. Chell, G.G.,
(1979),
pp221-257,
App. Sci .Pubs.,
London
3. Elber, W., "Equivalent constant amplitude concept for crack growth under
loading," in
Fatigue Crack Growth under Spectrum Loads,
ST P 595,
(1976),
A S T M . pp236-250.
4. Schive. J. "Fatigue crack closure, observations and technical significanc
Proceedings of the International
Symposium on
Fatigue
Crack
Closure, 1986
5. Allison, J.E., "On the Measurement of Crack Closure During Fatigue Crack
Growth," in
Proceedings of ASTM 18th National Symposium on Fracture
Mechanics, A S T M , 1985.
6. Vasudeven, A.K., Sadananda, K., Louat. N., "A review of crack closure, fa
crack threshold and related phenomena," Materials Science
Engineering
A-
Structural Materials Properties Microstructure
Processing A188 1^2,
(1
pp. 1-22.
7. Schive, J., "Four Lectures on Fatigue Crack Growth," Eng. Fract. Mech.,
1
ppl
67-221.
8. Brown, W.F. and Srawley, J.E., in
Plane strain crack testing of high str
metallic
materials,
A S T M S TP 410, 1966.
9. Ohji, K., Ogura, K. and Ohkubo, Y., "Cyclic analysis of a propagating cra
correlation with fatigue crack growth,"
Eng.
Fract. Mech.,
7, (1975),
pp457-464.
10. Ogura, K. and Ohji, K, "FEM analysis of crack closure and delay effect i
crack growth under variable amplitude loading," Eng. Fract. Mech., 9,
(1977),
pp471-480.
11. Fleck, N.A., "Finite element analysis of plasticity induced crack closu
Fract. Mech.,
25,
(1986),
pp441-449.
12. Chen, D. and Nisitani, H., "Analysis of Plasticity-Induced Crack Closure
Extended Body Force Method,"
JSME
International
Journal,
Series 1, 31,
(1988),
pp598-605.
13. Chen, D. and Nisitani, H., "Analysis of the delaying effects of overloa
crack propagation," Eng.
Fract. Mech.,
39, (1991), pp287-449.

8/10/2019 The Effect of Residual Stress and Crack Closure on Fatigue Crack
http://slidepdf.com/reader/full/the-effect-of-residual-stress-and-crack-closure-on-fatigue-crack 80/304

8/10/2019 The Effect of Residual Stress and Crack Closure on Fatigue Crack
http://slidepdf.com/reader/full/the-effect-of-residual-stress-and-crack-closure-on-fatigue-crack 81/304
Literature Review: Crack Closure 4.19
27. Sun, L., Li, S.,
Zang,
Q.,. and W a n g Z., "Dependence of fatigue crack closure
behavior on volume fraction of martensite in dual-phase steels,"
Scripta
Metallurgica et Materialia, 32, 4,
(1995), pp.517-21.
28. Biner, S.B., Buck, O., Spitzig, W.A., "Plasticity induced fatigue crack
single and dual phase
materials,"
Engineering Fracture
Mechanics,
47, [
(1994)
pp.1-12.
29. Nethercott, R.B.,
personal communication,
DSTO-AMRL Fishermens Bend, Ju
1991.
30. Fleck, N.A., "An Investigation of Fatigue Crack Closure," PhD Thesis, U
of
Cambridge,
(1984).
31. Saxena, V.K, Radhakrishnan, V.M., "Development of fatigue crack closure
mechanism maps 1. Basic concepts and boundary equations," Materials Science
Technology
14, L2, (1998), pp. 1227-32.
32. Saxena, V.K., Radhakrishnan, V.M., "Development of fatigue crack closur
mechanism maps 2. Construction of maps for various materials," Materials Science
Technology
14,
L2, (1998),
pp.
1233-41.
33. Saxena, V.K., Radhakrishnan, V.M., "Metallurgical aspects and closure m
fatigue crack growth of alloy
steels.
III. Crack closure maps," Transactions of the
Indian Institute of Metals,
49, L2, (1996), pp.67-72.
34. Nowell D., "A boundary element model of plasticity-induced fatigue crac
Fatigue Fracture of Engineering Materials Structures, 21, 7,
(1998),
pp.8
71.
35. McClung, R.C., "Finite element analysis of specimen geometry effects on
fatigue crack closure," Fatigue Fracture of Engineering Materials Structure
17,8, (1994), pp.861-72.
36. Choi, H.C., Song J.H., "Finite element analysis of closure behaviour of
fatigue cracks in residual stress
ields,
atigue Fracture of Engineering
Materials Structures,
18,1, (1995), pp.
105-17.
37. Wu, J., Ellyin, F., "A study of fatigue crack closure by elastic-plasti
analysis for constant-amplitude loading," International Journal of Fracture, 82, 1,
(1996),pp.43-65.
38. Gall, K, Sehitoglu, H., Kadioglu, Y., "Plastic zones and fatigue-crack
plane-strain double slip," Metallurgical Materials Transactions A-Physic
Metallurgy Materials Science, 2 ,
11, (1996),
pp.3491-502.

8/10/2019 The Effect of Residual Stress and Crack Closure on Fatigue Crack
http://slidepdf.com/reader/full/the-effect-of-residual-stress-and-crack-closure-on-fatigue-crack 82/304
Literature Review: Crack Closure 4.20
39.
Dattaguru, B., Seshadri, B.R., "Two and three dimensional inite lement simulation
and experimental correlation of fatigue crack closure,"
Proceedings of
the
Indian
National Science Academy, Part
A,
63, 2, (1997), pp. 159-82.
40. Zhang, J.Z., Halliday M.D., Poole, P., Bowen, P., "Crack closure in small
fatigue cracks - a comparison of finite element predictions with in-situ scanning
electron microscope measurements," Fatigue Fracture of Engineering Materials
Structures,
20,
9, (1997), pp. 1279-93.
41. Park, S-J., Earmme, Y-Y., Song, J-H., "Determination of the most appropriate mes
size for a 2-D inite lement analysis of fatigue crack closure behaviour," Fatigue
Fracture of Engineering Materials Structures,
20 ,
4, 1997, pp.533-45.
42. Chen, D.L., Weiss, B., Stickler, R., "A model for crack closure,"
Engineering
Fracture
Mechanics,
53,
4,
(1996), pp.493-509.

8/10/2019 The Effect of Residual Stress and Crack Closure on Fatigue Crack
http://slidepdf.com/reader/full/the-effect-of-residual-stress-and-crack-closure-on-fatigue-crack 83/304
Literature Review: Residual Stress and Fatigue Crack Growth 5.1
5 Residual Stress and Fatigue Crack Growth
Residual stresses have been shown to have profound effects on the fatigue behaviour of
materials. The control of "harmful" and the application of "beneficial" residual stresse
have been recognised as important to the fatigue performance of components and
structures. Tensile residual stresses are generally considered as having an adverse effe
upon fatigue behaviour, whilst compressive residual stresses are usually considered as
beneficial. It is widely recognised that the effects of fatigue crack closure and residu
stresses on fatigue crack growth are closely linked, although most published work
seems to consider these phenomena separately. For the purposes of this work, the
residual stresses generated by a growing fatigue crack will be initially discussed
separately from larger macro-scale residual stresses, and have been dealt with in the
previous chapter.
5 1 Stress intensity factors for residual stress
In order to understand (and predict) the effect of residual stresses on fatigue crack
propagation, it is necessary to have a means of describing their effect on crack tip str
intensity. The concept of the effective stress intensity amplitude (AKeff) has been
discussed earlier in terms of crack closure. The effective stress intensity, Keff, in th
presence of a residual stress is given by:
K
eff =
K
L
+ K
res
Equation 5 1
(Where KL is the stress intensity due to an external load)
Calculating K for residual stress (or K
res
) is more difficult than for externally applie
loads (KJ. For KL, one of a range of standard solutions (in reference works [1,2]) is
often available to make first order estimates of K. Approximate stress intensity factors

8/10/2019 The Effect of Residual Stress and Crack Closure on Fatigue Crack
http://slidepdf.com/reader/full/the-effect-of-residual-stress-and-crack-closure-on-fatigue-crack 84/304
Literature Review: Residual Stress and Fatigue Crack Growth 5.2
can be derived for many problems by compounding known solutions [3]. Where there
are no large residual stresses these estimates of K are often sufficient to provide the
basis of useful LEFM models.
5.1.1 Superposition as a means of determining stress intensity factors
For complex loading configurations, "superposition" is a common technique available
to obtain stress intensity factors. It pre-supposes that since stress intensity factors
derived from linear elastic analysis, the stress system due to more than one load acting
together being equal to the sum of each acting independently. Complex configurations
are considered as the sum of several separate geometrically identical configurations
with known stress intensity factors and simpler boundary conditions. This is subject to
the condition that the boundary tractions in each of the components are independent.
Also, the crack surfaces must be separated along their entire length in the final
configuration. If overlap occurs in a component configuration (possible even if K[>0)
then it must be ignored, else the answer given by the superposition will be invalid. The
superposition principle for stress intensity factors is valid for an arbitrary number of
loading types, providing they are all crack opening. Aamodt and Bergan [4] proposed
that provided the net result is a crack opening state, this principle can be extended to
include crack closing components.
Superposition may be extended by Bueckner's principle [5]. This permits the stress
intensity factor for a "stress free" crack in a body subject to external forces to be
considered as the same crack subject to stresses in the same body. The boundary
conditions for the latter are that the sum of applied "tractions and displacements" are
zero. The stresses over the area of the crack are determined as those over the crack site
in an uncracked body, under the original applied boundary conditions.
Bueckner's principle is shown graphically in Figure 5.1 (after ref. [5]). A linear elasti
region inside a boundary "O" containing a stress-free crack (A-B) is shown (a). The

8/10/2019 The Effect of Residual Stress and Crack Closure on Fatigue Crack
http://slidepdf.com/reader/full/the-effect-of-residual-stress-and-crack-closure-on-fatigue-crack 85/304
Literature Review: Residual Stress and Fatigue Crack Growth 5.3
boundary is subdivided into two sections 0\ and O2. In (b) this linear elastic body is
subjected to general tractions (7) and displacements V), leading to a body force
distribution F. Under these conditions the stress intensity factor is given by Kb. The
same body is shown in (c) in an uncracked state with the same T and V applied on the
boundary, resulting in the stress distribution \j along the crack site (A-B). Part (d)
shows the body containing the crack (A-B) with its surfaces subject to a pressure
distribution py, and boundary conditions such that T=V=0 and F=0. The stress intensity
factor under this condition is given by Kd. Bueckner's principle is such that when Pij=o
then Kb = Kd- Hence, if the stress distribution is known for the crack site in the
uncracked condition, the stress intensity factor solution to the simpler problem (d) can
be considered applicable to the original problem (b).
Application of the stress distribution for the uncracked body to the crack site forms th
basis of several methods (including weight function and Green's functions methods).
Use of these principles to solve residual stress problems is limited to those where the
crack only changes the elastic stress and strain distribution.
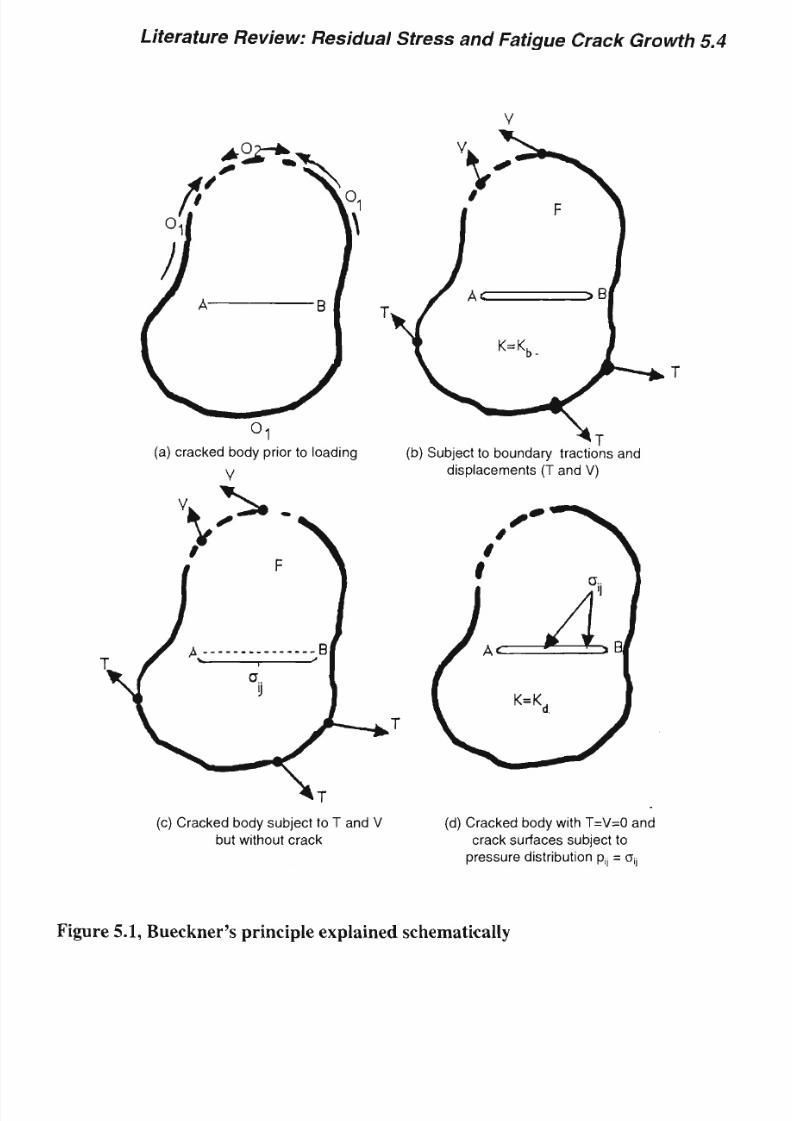
8/10/2019 The Effect of Residual Stress and Crack Closure on Fatigue Crack
http://slidepdf.com/reader/full/the-effect-of-residual-stress-and-crack-closure-on-fatigue-crack 86/304
Literature
Review:
Residual Stress and Fatigue Crack Growth 5.4
c)
Cra cke d b od y subject to
T and V d)
Cracked bod y with T = V = 0
and
but without crack crack surfaces subject
to
pressure distribution p = Oy
Figure 5.1, Bueckner's principle explained schematically

8/10/2019 The Effect of Residual Stress and Crack Closure on Fatigue Crack
http://slidepdf.com/reader/full/the-effect-of-residual-stress-and-crack-closure-on-fatigue-crack 87/304
Literature Review: Residual Stress and Fatigue Crack Growth 5.5
5.1.2 Weight functions and Green's functions*
When the residual stress distribution is known in the crack plane in the uncracked
condition, the application of Bueckner's principle with an appropriate technique to
determine the value of K, allows determination of K
res
. Green's functions or weight
functions are suitable for this purpose.
A weight function provides a means of combining a set of functions or components
over an interval, such that their relative importance is correctly assigned. In the case
the stress intensity factor for a crack, K is a function of the geometry of the componen
about the crack site and the applied load (or forces).
The classical definition of a Green's function is the response of system to a standard
input. The stress field produced in an elastic body in response to force acting at a poi
in that body is one example. Where the body concerned is cracked the stress intensity
factor at the crack tip may be considered a special Green's function. The essential
characteristic of a Green's function is that, suitably defined, it contains all the esse
information about the system. Green's functions used correctly may be capable of
predicting the response of the system to any input. The total response of the system
should be the sum of the responses due to each input acting separately. This can be
neatly summarised into three conditions for a Green's function to be applicable:
(i) Casuality - no input then no response;
(ii) Invariance - given input always delivers same response;
(iii) Linearity - if an input I] gives response R\, and input I2 response R2, then I[
I2 gives a response R| + R2.
The Green's function was conceived by George Green in
1828,
as the response of a system to a standard
input.

8/10/2019 The Effect of Residual Stress and Crack Closure on Fatigue Crack
http://slidepdf.com/reader/full/the-effect-of-residual-stress-and-crack-closure-on-fatigue-crack 88/304
Literature Review: Residual Stress and Fatigue Crack Growth 5 6
Using either Green's functions or weight functions to determine stress intensity fact
involves using Bueckner's principle and evaluation of an integral of the form:
x'
K
n
=Jrj,
J
(x)g(x'
>
x)dx(n= 1,2,3)
o
Equation 5.2
Where x' is the crack length, and x represents a point in the crack plane, Oij(x) is t
pre-cracked stress distribution.
The crack opening mode, Ki, is most important. The function g x\ x) is dependent upon
the geometry of the system, and independent of applied tractions, but dependent on any
displacement conditions imposed. It can be determined as a weight function or as
proportional to a Green's function. Cartwright and Rooke [5, 6] have reviewed the
application of these functions to fracture mechanics. An important aspect of this met
is that existing functions can be used to obtain new ones. As a weight function G(x',
8u
1 8v
G ( x ' , x ) = - ^ — • — r - — T <
x
'
x)
(1+K) K, 5x'
Equation 5.3
3-D
In plane strain * = 3 - 4 D and * =
f ^
in plane stress, D is Poisson's
ratio,
u. is the
shear modulus. K* is a known solution for Ki for the geometric configuration
concerned, and v V, x) is the displacement of the crack surfaces, Gy is replaced by
o(x). The integral takes the form:
X
-
K,=Ja(x)g(x',x)dx
o
Equation 5.4
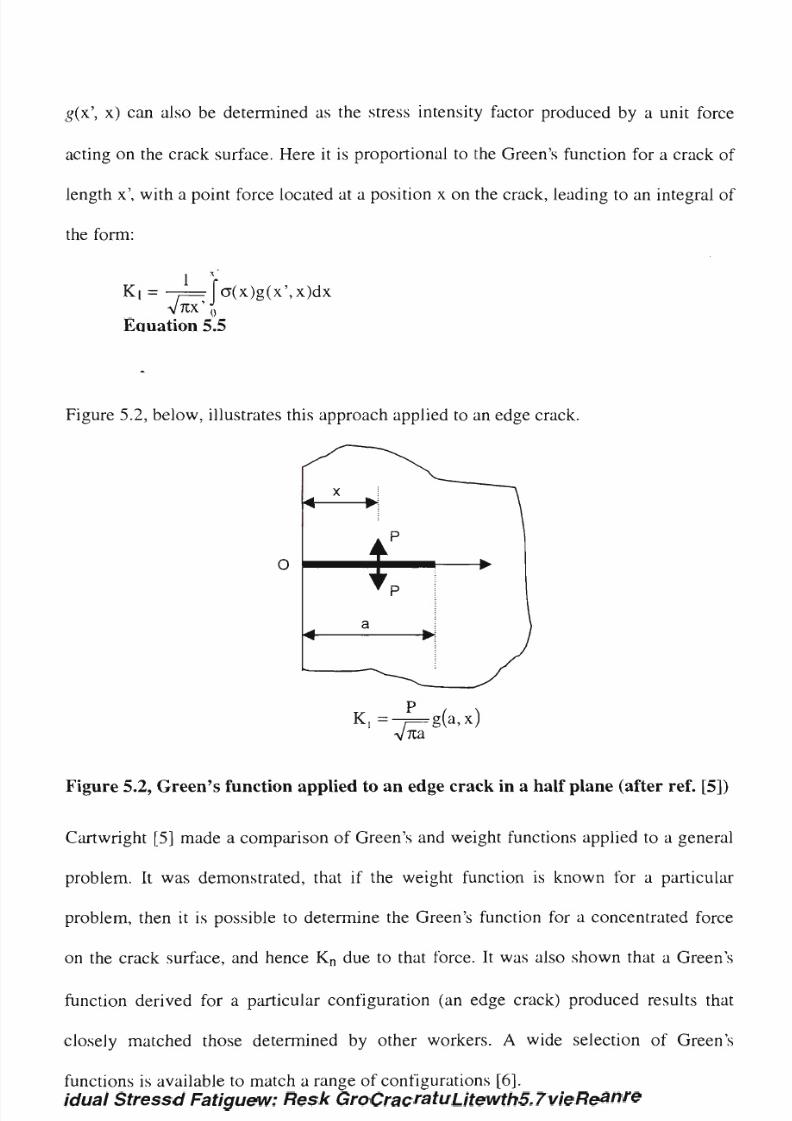
8/10/2019 The Effect of Residual Stress and Crack Closure on Fatigue Crack
http://slidepdf.com/reader/full/the-effect-of-residual-stress-and-crack-closure-on-fatigue-crack 89/304
Literature Review: Residual Stress and Fatigue Crack Growth 5.7
g(x', x) can also be determined as the stress intensity factor produced by a unit fo
acting on the crack surface. Here it is proportional to the Green's function for a c
length x', with a point force located at a position x on the crack, leading to an in
the form:
1 x'
K
1
= -==fo(x)g(x',x)dx
VTIX'^;
Equation 5.5
Figure 5.2, below, illustrates this approach applied to an edge crack.
K,=-7=g(a,x)
VTia
Figure 5.2, Green's function applied to an edge crack in a half plane (after ref. [5
Cartwright [5] made a comparison of Green's and weight functions applied to a genera
problem. It was demonstrated, that if the weight function is known for a particular
problem, then it is possible to determine the Green's function for a concentrated fo
on the crack surface, and hence K
n
due to that force. It was also shown that a Green'
function derived for a particular configuration (an edge crack) produced results tha
closely matched those determined by other workers. A wide selection of Green's
functions is available to match a range of configurations [6].

8/10/2019 The Effect of Residual Stress and Crack Closure on Fatigue Crack
http://slidepdf.com/reader/full/the-effect-of-residual-stress-and-crack-closure-on-fatigue-crack 90/304
Literature Review: Residual Stress and Fatigue Crack Growth 5.8
Green's functions generally approach infinity at the crack tip. Hence, the stress intensit
factor is dominated by near tip stresses in the pre-cracked distribution. For Green's
functions or weight functions to be used in calculating stress intensity factors, the
following conditions must be met:
(i) The functions used must be for the same geometric configuration as the one for
which K is required;
(ii) The stress over the crack site must be determined with the same tractions and
displacements as originally applied, (following Bueckner's principle);
(iii) If both traction and displacement conditions are specified in the original
problem; then functions must be obtained for zero tractions and displacements
on the appropriate boundaries.
5.2 Stress intensity factor approach to fatigue crack growth through
residual stress fields
Braid [7] commented that it is generally incorrect to consider residual stress intensity
factor (K
res
) as equivalent to the stress intensity due to externally applied loads (KL)-
This statement is based upon theory reviewed by Parker [8]. K
res
will vary smoothly
with crack length, and tend toward zero as the crack severs the specimen. K
res
should
not change sign dramatically as the crack tip passes the point at which the stress field
the uncracked body changes sign. Some solutions for K
res
may predict physically
impossible "overlapping" of the fracture surfaces remote from the crack tip. In such
situations it is necessary to correct for non-linear contact conditions. Notches along t
line of the crack may eliminate such "non-linearity" such that "overlapping" does not
occur. The principles of superposition, Green's functions or weight functions, can be
applied to describing residual stress intensity factors.
Braid [7] applied several weight function approaches to the residual stress distribution
in an indented plate. At short crack lengths variations were relatively small. But as th

8/10/2019 The Effect of Residual Stress and Crack Closure on Fatigue Crack
http://slidepdf.com/reader/full/the-effect-of-residual-stress-and-crack-closure-on-fatigue-crack 91/304
Literature
Review:
Residual Stress and Fatigue Crack Growth
5 9
a
ratio
—
increased, significant variations b e c a m e evident. Parke r stated that
W
superposition is not invalidated provided that linear elastic behaviour prevails.
Clark [9] recently demonstrated the effectiveness of a Green's function approach, to
account for residual stress intensity in fatigue crack growth in cold-expanded fastener
holes. This model used several simplifications, including no account being taken of
residual stress redistribution. This simplification is qualified later (5.4).
5.3 Residual stresses generated by a growing fatigue crack
Residual stresses are generated at the crack tip from two sources. The first is due to the
reversed deformation (reversed plastic zone) at the crack tip. The second is due to crack
closure effects. Williams and Stouffer [10] presented evidence that residual stresses
about a propagating fatigue crack were consistent with Elber's closure theory. They
suggested that residual stresses associated with the plastic zone were responsible for a
peak in the residual stress behind the crack tip.
Evidence confirming the existence of the plastic zone residual stresses has been detailed
by Schlosberg and Cohen [11]. In an ideal crack, all residual stresses would originate
from the plastic zone. Sun and Sehitoglu [12] have reviewed this, and applied finite
element modelling techniques to the problem. This work showed that for plane strain
conditions, the residual stresses due to the reversed plastic zone are of greater
significance than those due to crack closure. In plane stress, the situation is reversed.
Especially in plane strain conditions, the point at which the applied stress at the crack
tip becomes tensile, o*
tl
, may be greater than that required to open the crack. Figure 5.3
(after ref. [12]) demonstrates this effect graphically.

8/10/2019 The Effect of Residual Stress and Crack Closure on Fatigue Crack
http://slidepdf.com/reader/full/the-effect-of-residual-stress-and-crack-closure-on-fatigue-crack 92/304
Literature Review: Residual Stress and Fatigue Crack Growth
5.10
(a)
^
°„ +
(c)
•<*„ fatigue
_Cra ck closure contribution
.Residual stress effect in
absence
of
crack closure
Figure 5.3, (a) Stress distribution for a fatigue crack at
o
max
, o
m
j
n
and
Ott-
(b)
Stress-strain behaviour at crack tip indicating when remote stress
reaches
Ott
the crack tip stress becomes tensile, (c) Remote stress vs
time. The contribution to
o~tt
from crack closure, and from residual
stresses at crack tip, due to reverse deformation are shown. (After
Sun & Sehitoglu ref. [12].
5.4 Redistribution of residual stresses during crack propagation
The residual stresses and the moments due to them must always equal zero in any plane.
As the crack propagates the residual stress is, to an extent determined by the geometry
of the system, relieved at the crack surface. The residual stresses must be redistribu
to maintain equilibrium. The residual stress field changes continuously as the crack
propagates. This means that the residual stress at the crack tip is not the same as th
the same position prior to the crack. These changes must be accounted for when

8/10/2019 The Effect of Residual Stress and Crack Closure on Fatigue Crack
http://slidepdf.com/reader/full/the-effect-of-residual-stress-and-crack-closure-on-fatigue-crack 93/304
Literature Review: Residual Stress and Fatigue Crack Growth 5.11
computing stress intensity factors for residual stresses. This is supported by recent wor
byAlmeretal[13].
Redistribution occurs when the displacements involved in the residual stress field are
relaxed, or where crack face displacements are such that superposition of remote and
residual stress fields is prevented. Where this is not the case, residual stress
redistribution can often be ignored in modelling the crack tip stress intensity factor, (
e.g. Clark's paper [9]). Where this is not the case, (e.g., where the crack initiates in
tensile residual stress domain), then it is necessary to account for redistribution.
Residual stresses are relatively easy to measure at surfaces. Lin and Abel [14] estimated
the residual stress distribution associated with a double-V butt weld using a truncated
Fourier series as an interpolation function, and the residual stresses at the surfaces as
boundary conditions. Figure 5.4 (after ref. [14]) shows a simplified schematic
representation of the redistribution of a residual stress field with increasing crack
length, where the crack has started in a tensile residual stress domain. Figure 5.5
illustrates the case where the crack has started in a compressive residual stress domain
(again somewhat over-simplified). This approach [14] is successful in that it explains
crack propagation from tensile into compressive residual stress domains. As the crack
severs the specimen, the residual stress rapidly tends to zero, in the absence of other
effects such as closure, provided the propagation of the crack results in separate piece
Where the crack initiates in a compressive residual stress domain, then crack face
displacements on unloading are such that superposition of remote and residual stress
fields may occur. In such a situation the redistribution is much more limited, and may
even be ignored [9]. Where the plastic zone associated with the advancing crack are
large enough, relaxation of the displacements associated with the stress field will occur
and redistribution will be more significant. This effect is demonstrated by the results
published Lam and Lian [15]. Cracks were grown under constant amplitude loading. At

8/10/2019 The Effect of Residual Stress and Crack Closure on Fatigue Crack
http://slidepdf.com/reader/full/the-effect-of-residual-stress-and-crack-closure-on-fatigue-crack 94/304
Literature Review: Residual Stress and Fatigue Crack Growth
5.12
short crack lengths a weight function model that did not account for redistribution of
residual stresses predicted the behaviour well. At longer crack lengths and higher AK,
da
higher "^ and bigger m a x i m u m plastic zone sizes, such a model was non-conservative.
This would seem to fit well with Clark's statement [9] with respect to relaxation of
crack face displacements and the effect of this on residual stress distribution.
in
in
0)
I—
to tn
CD CO
y
3
tn
2
„
-y tn
0
co
2
rr £
5
c
o
o
CO
-1
— a/W=0.0
- - a/W=0.05
— — _ a/W=0.1
— — a/W=0.15
0.2 0.4 0.6
Fraction of plate width "W"
0.8
Figure 5.4, Residual stress redistribution with an edge crack starting in a tensile
residual stress field, a/W = crack length, after ref. [14].

8/10/2019 The Effect of Residual Stress and Crack Closure on Fatigue Crack
http://slidepdf.com/reader/full/the-effect-of-residual-stress-and-crack-closure-on-fatigue-crack 95/304
Literature Review: Residual Stress and Fatigue Crack Growth 5.13
I
CD
r
tn
tn
CD
co
to
-y
CD CO
J= ^
co
"S
— CO
co CD 0
3
»
1
X
o
c
o
"5
CO
LL
-1
i — I — I — | — i — I — 1 — | >
,
' *
I
N .
1 — ' — ' — ' — 1 — • — — ' —
y y "* ™^*
/ ' V
/ ' V
/ A«\»
/ ' * V \_
/ • \\^^ *w
/ /
*
Jr\
•
X
/ /
«
/ \\
*
1
1 * / V \
/
yl
1
1 1
1 1
/ 1
J 1
f
J 1
s
/ *
*
«
t
»
*
r
•/• \..v...R....\.
/ v A
/
v\
\
s
\ X
y
v>
* \
* ••
f \ *»
*
\ \
• *" V "* -
1 1 1 1 1 1 1 1 1 1 1 1 1 1 I I
I N -
a/W=0.0
a/W=0.1
a/W=0.3
a/W=0.5
0 0.2 0.4 0.6 0.8 1
Fraction
of
plate
width
"W"
Figure 5.5, Residual stress redistribution with an edge crack starting in a
compressive residual stress field, a /W
=
crack length, after ref. [14].
5.5 Fatigue crack growth through tensile residual stress fields
A widely accepted way of explaining the effect of a tensile residual stress field (
fatigue crack propagation) is that the effective R ratio is increased. The effect
ratio,
Reff,
is defined as the ratio
Kmjn+Kres
to K
max
+K
res
. This approach is
commensurate with Elber's crack closure theories [16]. A tensile residual stress
inevitably reduce the fatigue threshold (AKth) where Kmi
n> e
ff would otherwise be
<Ko
p
, so AKeff increased. Fleck et al [17], in an investigation of fatigue crack g
under compressive loading, assumed that the crack opens when KL and K
res
sum to
zero,
so AK
e
ff=K
r e s
+KL, max
Cracks may propagate when loaded in cyclic compression. The net effect of the tensi
residual stress and the compressive stress attributable to an external load will
opening AKeff. This has been applied by Suresh [18], as an accelerated means of

8/10/2019 The Effect of Residual Stress and Crack Closure on Fatigue Crack
http://slidepdf.com/reader/full/the-effect-of-residual-stress-and-crack-closure-on-fatigue-crack 96/304
Literature
Review: Residual Stress and
Fatigue
Crack Growth 5.14
obtaining reliable data for slow
dN
rates, minimising uncertainties inherent in other
methods. Reid et at [19] extended this by direct measurement of residual stress fields
prior to growing a fatigue crack. At short crack lengths some difficulty was encountered
in using these measured values of residual stresses to model crack growth kinetics.
As cracks propagate in cyclic compression, the tensile residual stress will be dissipate
Eventually a point is reached where AK
e
ff falls to the threshold level, and the crack ma
become non-propagating, e.g. [20]. A similar situation may occur when cycling in
tension, depending on the loading conditions (i.e. KL,
max
level).
Fitzpatrick and Edwards [21], reviewed the interaction of residual stresses and fatigue
cracks. It was concluded that although monitoring crack closure could qualitatively
reflect the effects of a residual stress field upon a growing crack, it was unhelpful in
predicting fatigue life. This was attributed to the complexity of crack opening
behaviour.
5.6 Fatigue crack growth in compressive residual stress fields
The AKeff/Reff approach outlined in 4.5 has also been applied to fatigue crack growth
through compressive residual stress fields. Due to the presence of the crack surfaces, t
value of K at the crack tip is either zero or a positive number, negative (i.e.,
compressive) values of K cannot exist. However, as part of a superposition, the use of
negative K
res
values can be meaningful if the final K
e
ff>0. Where KL, min+K
re
s^K
0
p
or zero then AK
e
ff=AKL and R
e
ff is given as in the preceding section 4.5. When KL,
m
'n
+ K
res
> Ko
p
or zero AK
e
ff=AKL,
m
ax
+
K
r
es-K
0
p. The logic of this approach is based
upon the residual stress adding to or detracting from the closure response that would
occur in its absence anyway. Braid's thesis [7] reviewed this in some detail, and
presented evidence that compressive residual stresses caused an increase in the crack
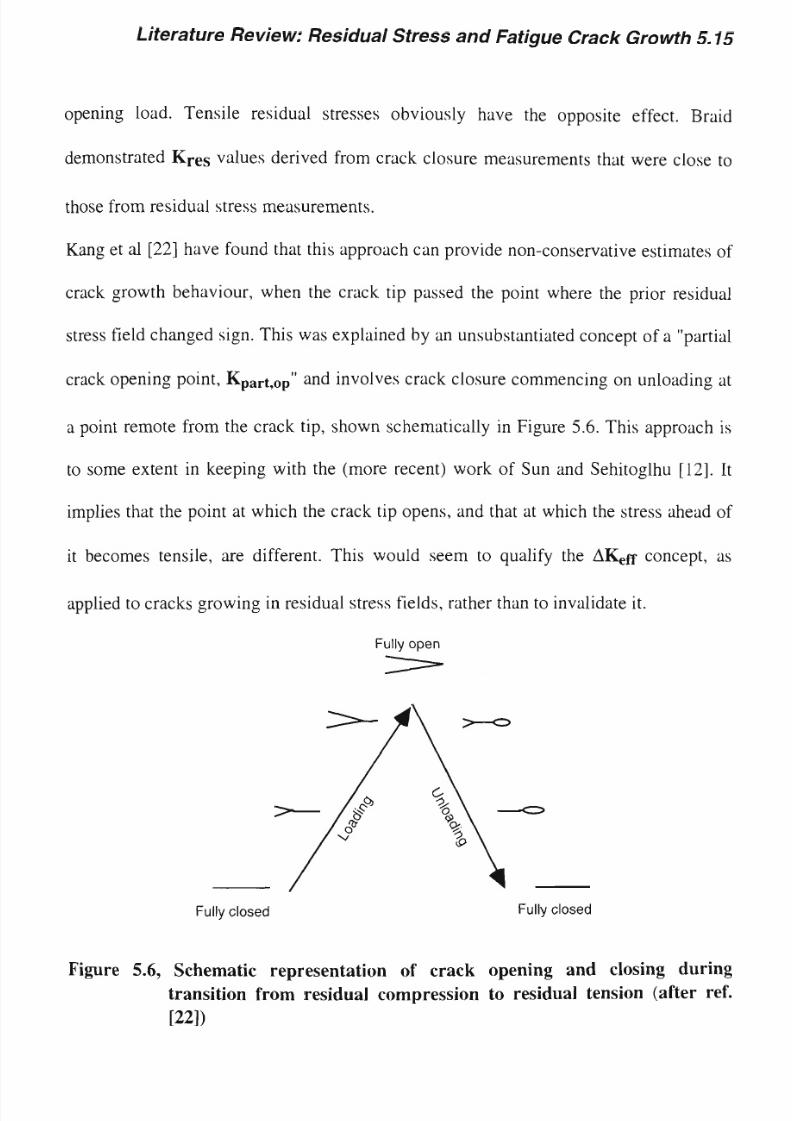
8/10/2019 The Effect of Residual Stress and Crack Closure on Fatigue Crack
http://slidepdf.com/reader/full/the-effect-of-residual-stress-and-crack-closure-on-fatigue-crack 97/304
Literature Review: Residual Stress and Fatigue Crack Growth 5.15
opening load. Tensile residual stresses obviously have the opposite effect. Braid
demonstrated K
re
s values derived from crack closure measurements that were close to
those from residual stress measurements.
Kang et al [22] have found that this approach can provide non-conservative estimates of
crack growth behaviour, when the crack tip passed the point where the prior residual
stress field changed sign. This was explained by an unsubstantiated concept of a "part
crack opening point, K
par
t,
0
p" and involves crack closure commencing on unloading at
a point remote from the crack tip, shown schematically in Figure 5.6. This approach is
to some extent in keeping with the (more recent) work of Sun and Sehitoglhu [12]. It
implies that the point at which the crack tip opens, and that at which the stress ahead
it becomes tensile, are different. This would seem to qualify the
AK
e
ff
concept, as
applied to cracks growing in residual stress fields, rather than to invalidate it.
Fully open
Fully clo sed
Fully closed
Figure 5.6, Schematic representation of crack opening and closing during
transition from residual compression to residual tension (after ref.
[22])

8/10/2019 The Effect of Residual Stress and Crack Closure on Fatigue Crack
http://slidepdf.com/reader/full/the-effect-of-residual-stress-and-crack-closure-on-fatigue-crack 98/304
Literature Review: Residual Stress and Fatigue Crack Growth 5.16
5.7 Welding and residual stress effects
Residual stresses are an almost inevitable consequence of welding processes. Different
cooling rates in the weld metal and the parent plate and, to a lesser extent, phase
transformations contribute to the final residual stress distribution. Figure 5.7 shows i
simplistic manner the development of a residual stress field associated with two plates
joined by a butt weld (after Gurney [23]). Assuming that immediately after welding the
weld and adjacent region are hot and the remainder of the plates are cold, the situation
will be as shown (a). All three elements (both plates and weld) are the same length. If
all three elements were separate the situation after cooling would be as that shown in
(b). However, all three elements are not separate, but are of the same length. This state
is only achieved as a result of stress as shown in (c). In the direction parallel to the
weld, the weld is in tension, balanced by compression in the plates. The actual stress
distribution will be as shown in (d), and the corresponding stresses transverse to the
weld will be tensile near the centre and compressive near the ends (e).
Longitudinal residual stresses
Transverse residual stresses
Figure 5.7, Formation of residual stresses about a butt weld (after Gurney [23])

8/10/2019 The Effect of Residual Stress and Crack Closure on Fatigue Crack
http://slidepdf.com/reader/full/the-effect-of-residual-stress-and-crack-closure-on-fatigue-crack 99/304
Literature Review: Residual Stress and Fatigue Crack Growth 5 17
Once most failures of welded structures were attributed to residual stress. Although this
has been shown to be incorrect, their effect has often been shown as harmful. It is
generally considered to be good practice to avoid such stress fields in finished structu
or components by taking appropriate precautions, e.g. post weld heat treatment
(PWHT). Tensile residual stresses associated with welds can approach yield strength
magnitude. Welds often contain defects such as slag inclusions, gas pores, or lack of
fusion defects, from which cracks may grow rapidly. A Welding Institute report by
Leggatt [24] indicated that defects in repair welds (or their heat-affected zones), should
be assumed to be subjected to tensile residual stresses of yield point magnitude. The
importance of residual stresses in affecting the fatigue performance of welds is reflect
by the large amount of published material pertaining to this subject. Residual stresses
can have a greater effect upon fatigue performance than material variability. Mills and
James [25] found "extremely uneven crack fronts," in the fatigue of stainless-steel
double-V butt welds, due to the effect of residual stresses. Material variability was
insufficient to explain the effect since crack growth rates at various positions were very
similar at given stress intensities.
Nguyen and Wahab [26, 27] have found that post-weld surface treatments, such as
peening etc., can be as effective as post weld stress relieving heat-treatment in
improving the fatigue life of welded components. It was found that the beneficial effect
of such compressive residual stresses was confined to the depth of the compressive
residual stress field, and to the early stage of crack propagation.
5.7.1 Application of AK
e
ft to fatigue cracks in welded joints
The effective stress intensity factor concept (AKeff)
as
applied to welded joints has been
widely reported. It is considered by many (e.g., Itoh et al [28] and Verreman et al [29])

8/10/2019 The Effect of Residual Stress and Crack Closure on Fatigue Crack
http://slidepdf.com/reader/full/the-effect-of-residual-stress-and-crack-closure-on-fatigue-crack 100/304
Literature Review: Residual Stress and Fatigue Crack Growth 5.18
to be an adequate means of describing fatigue behaviour of welds in the presence of
residual stresses.
5.7.2 Distribution of residual stress associated with welded joints
The distribution and redistribution of residual stresses associated with welded joints an
its effect on fatigue crack propagation has been investigated by several workers,
including Lee et al [30]. It was found that using the AK,
rr
concept provided satisfactor
prediction of crack growth rates considering the statistical nature of much fatigue data.
However, crack growth rates were most accurately predicted when the residual stress
intensity factor K ,
s
was calculated using a superposition method.
Toyosada and Gotoh [31 ] have found that the residual stress associated with a weld can
be assessed by considering the sequence of the process, including any preheating and
post weld heat treatment.
5.8 Effect of overload cycles on crack propagation
Deliberate overloading to generate favourable compressive residual stresses is a
recognised means of delaying the initiation of fatigue cracks, and of retarding the
growth of pre-existing cracks, especially short cracks. This "load sequence" effect is
easily demonstrated. If a crack growth experiment is interrupted and then restarted, at
reduced AK greater than AK
lh
, then a large number of load cycles elapse before the
established crack starts to grow again, or is sometimes arrested completely. In industr
this phenomenon is widely utilised especially for components such as some pressure
vessels and large gun-barrels where it is referred to as "autofrettaging" and "proof-
loading". Proof loading of very large pressure vessels is increasingly monitored via
acoustic-emission techniques to ensure that excess damage is not incurred.
Overload cycles can generate compressive residual stress at stress concentrators such as
crack tips and notches. Drew [32, 33] has made a detailed study of this, with particula
attention to the effect of overload cycles on a growing fatigue crack in two structural

8/10/2019 The Effect of Residual Stress and Crack Closure on Fatigue Crack
http://slidepdf.com/reader/full/the-effect-of-residual-stress-and-crack-closure-on-fatigue-crack 101/304
Literature Review: Residual Stress and Fatigue Crack Growth 5.19
steels. The study investigated the effect of R ratio, and the ratio of AK
0
i (overload AK
to AKb (AK prior to the overload cycle) on the number of cycles over which FCG was
retarded (Nd), and the affected crack length (ad). It was found that ad was about the
same as the radius of the overload plastic zone at lower R ratios, but smaller than thi
higher R ratios (R=0.7). It was found that crack tip blunting was caused by the
overload, but that the compressive residual stresses in the overload plastic zone were
more influential in affecting retardation of crack growth following the overload.
Later work by Smith et al [34] used neutron diffraction to measure the residual stresse
in cracked SEN specimens subjected to an overload cycle. It was found that residual
stresses were close to computed predictions away from the "near crack" region, but
smaller than predicted within the near crack tip region. Closer correlation was obtaine
when using sampling volumes appropriate to the measurement technique for the
computed predictions. However, there was still some discrepancy, which was attributed
to Bauschinger type effects not modelled in the analyses.
Underwood [35] reported a series of experiments that compared several methods of
introducing compressive residual stresses in terms of their effectiveness. Overload
cycles were found to be the most effective in increasing fatigue life. This was attribu
to the larger extent of the residual stress field created by overloading compared to th
produced by peening or swaging.
5.9 Interaction between residual stresses generated by the crack tip
plastic zone and macro scale residual stresses
The plastic deformation, or small scale yielding, at the tip of a growing fatigue crack
itself results in the generation of residual stresses. The interaction between this "re
tensile plastic zone" and larger scale residual stresses has been investigated by
Toyosada et al [36]. The equivalent load to generate the re-tensile plastic zone was
described as the "RPG load", and was found to be affected by residual stresses. The

8/10/2019 The Effect of Residual Stress and Crack Closure on Fatigue Crack
http://slidepdf.com/reader/full/the-effect-of-residual-stress-and-crack-closure-on-fatigue-crack 102/304
Literature
Review: Residual Stress and
Fatigue
Crack Growth 5.20
corresponding stress intensity factor range was given the term AK
RP
. Compressive and
tensile residual stresses were found to reduce and increase RPG load respectively, and
da
to have a corresponding effect upon A K
R P
and
.
Wang's review of the crack tip
plasticity of aspect of crack growth, [37], concluded that modelling reverse yielding
the crack tip was the best parameter to use when modelling crack growth behaviour.
However, the difficulties in defining this parameter leads to AKeff concept being a mo
practical compromise, although it depends upon effective measurement or estimation of
Kop-
8/10/2019 The Effect of Residual Stress and Crack Closure on Fatigue Crack
http://slidepdf.com/reader/full/the-effect-of-residual-stress-and-crack-closure-on-fatigue-crack 103/304
Literature Review: Residual Stress and Fatigue Crack Growth 5.21
REFEREN ES
l. Rooke, D.P., "Compendium of Stress Intensity Factors", (1976), pub HMSO,
London.
2. Tada, H., "Stress Analysis of Cracks Handbook", (1985), pub Paris Productions &
Del Research Corp., Hellertown, Pennsylvania.
3. Cartwright, D.J. and Rooke, D.P., "Approximate Stress Intensity Factors
Comp ou nded from Kn o w n Solutions",
Engineering Fracture Mechanics,
6, (1974),
pp563-571.
4. Aamodt, B. and Bergan, P.G. "On the principle of superposition of stress intens
factors", Engineering Fracture Mechanics,
8,
(1976), pp437-440.
5. Cartwright, D.J. "Stress Intensity Factor Determination", in Developments in
Fracture
Mechanics ,
ed.
Chell,
G.G., (1979), Applied Science
Publishers,
Barking,
England.
6. Cartwright, D.J. and Rooke, D.P., "Green's functions in fracture mechanics", in
Fracture
Mechanics: current
status future
prospects
ed. Smith R.A., (1979),
Pergamon, N e w York.
7. Braid, J.E.M. "The Effect of Residual Stress on Fatigue Crack Growth," PhD
Thesis,
University of Cambridge, 1982.
8. Parker, AP., "Stress Intensity Factors, Crack Profiles, and Fatigue Crack Growt
Rates in Residual Stress Fields," in
Residual
Stress Effects
in Fatigue, ASTM STP
776, (1982),
ppl3-31.
9. Clark, G. "Modelling residual stresses and fatigue crack growth at cold-expande
fastener
holes", Fatigue Fract. Eng.
Mater.
Struct.,
(1991), 14, pp579-589.
10. Williams, J.F. and Stouffer, D.C., "An Estimate of the Residual Stress Distrib
in the Vicinity of a Propagating Fatigue Crack," Engineering Fracture Mechanics,
11 (1979),pp547-557.
11. Schlosberg, W.H. and Cohen, J.B., "The Plastic Zone and Residual Stress near a
Notch and a Fatigue Crack in H S L A Steel," Met. Trans. A, 13A (1982), ppl987-
1995.
12. Sun, W. and Sehitoglu, H., "Residual stress fields during fatigue crack growth
Fatigue Fract. Eng. Mater. Struct., 15,
2,
(1992), ppl 15-128.
13. Aimer, J.D., Cohen, J.B., Winholtz, R.A., "Effects of residual macrostresses a
microstresses
on fatigue crack propagation" Metallurgical & Materials Transactions
A-Physical Metallurgy & Materials Science, 29A 8, (1998), pp2127-2136.

8/10/2019 The Effect of Residual Stress and Crack Closure on Fatigue Crack
http://slidepdf.com/reader/full/the-effect-of-residual-stress-and-crack-closure-on-fatigue-crack 104/304
Literature Review: Residual Stress and Fatigue Crack Growth
5.22
14. Lin, Y. and Abel, A., "Residual Stress Redistribution During Fatigue," in
Proceedings
of
the 1990 Symposium
of
the ustralian Fracture Group,
ed.
Mai Y.
W.,
(1990)
Australian Fracture Group.
15. Lam, Y.C. and Lian, K.S., "The Effect of Residual Stress and its Redistr
Fatigue Crack Growth," Theoretical and pplied Fracture Mechanics,
12, (1989),
pp59-66.
16. Elber, W., "Equivalent constant amplitude concept for crack growth under
loading," in Fatigue Crack Growth under Spectrum Loads, ST P 595,
(1976),
A S T M , pp236-250.
17. Fleck, N.A., Shin, CS. and Smith, R.A., "Fatigue Crack Growth Under
Compressive Loading,"
Engineering Fracture Mechanics,
21, 1, (1985),
ppl73-185.
18. Suresh, S., Crack Initiation in Cyclic Compression and its Applications,
Engineering Fracture Mechanics, 21, 3,
(1985),
pp453-463.
19. Reid, C.N., Moffatt, J. and Hermann, R., "Fatigue Under Compressive Load
Residual Stress." Scripta Met., 22,
(1988),
ppl743-1748.
20. Makabe, C, Kaneshiro, H., Nishida, S., Sakihama, H., "Consideration of e
of fatigue crack propagation rate from effective stress intensity factor range,"
Journal of Testing & Evaluation, 23, 3,
(1995),
ppl53-159.
21. Fitzpatrick, M.E., Edwards, L., "Fatigue crack/residual stress field int
their
implications for damage-tolerant design," Journal
of
Materials Engineering
&
Performance, 1, 2,
(1998),
ppl90-198.
22. Kang, K.J., Song, J.H. and Earmme, Y.Y., "Fatigue Crack Growth and Closu
Behaviour Through a Compressive Residual Stress Field,"
Fatigue Fract. Eng.
Mater.
Struct., 13, 1,
(1990),
ppl-13.
23. Gurney, T.R., "Fatigue of Welded Structures" (1968), Cambridge University
24. Leggatt, R., "Residual stress measurements at repair welds in pressure
in the as-welded condition,"
(1986),
The Welding Institute.
25. Mills, W.J. and James, L.A., "Residual Stress Effects on Fatigue Crack G
Stainless Steel Welds,"
J.
Press. Vessel Tech., Trans. ASME,
109 (1987),
pp336-
339.
26. Nguyen, T.N., Wahab, M.A., "The effect of residual stresses and weld geo
the improvement of fatigue life," Journal of Materials Processing Technology 48,
L4,(1995),pp581-588.
27. Nguyen, T.N., Wahab, M.A., "Effect of weld geometry and residual stresse
fatigue of welded
joints
under combined loading," Journal of Materials Processing
Technology
11, L3, (1998),
pp201-208.

8/10/2019 The Effect of Residual Stress and Crack Closure on Fatigue Crack
http://slidepdf.com/reader/full/the-effect-of-residual-stress-and-crack-closure-on-fatigue-crack 105/304
Literature Review: Residual Stress and Fatigue Crack Growth 5.23
28. Itoh,
Y.Z., Suruga,
S. and Kashiwaya, H., "Prediction of Fatigue Crack Growth Rate
in a Welding Residual Stress Field,"
Engineering Fracture Mechanics,
33, 3,
(1989),pp397-407.
29. Verreman, Y., Masounave, J. and Bailon, J.P., "Fatigue life prediction of weld
joints using the effective stress intensity range," in
Mechanism of Fracture ,
(conference proceedings), A S M , Metals Park
Ohio,
pp245-253.
30. Lee, Y-B., Chung, C-S., Park, Y-K., Kim, H-K, "Effects of redistributing resid
stress on the fatigue behavior of SS330 weldment,"
International Journal of
Fatigue, 20 ,
8,
(1998)
pp565-573.
31. Toyosada, M., Gotoh, K, "Effect of welding sequence and line heating on fatigu
strength for welded structures,"
Proceedings of the 1998 17th International
Conference on Offshore Mechanics and Arctic Engineering,
O M A E . Lisbon,
ppl
9980705-19980709.
32. Drew, M., "The effect of overload cycles on fatigue crack propagation in stru
steels,"
P h D
Thesis,
University of N e w South
Wales,
1984.
33. Drew, M., Thompson, K.R.L and Keys, L.H. "The Effect of Overloads on Fatigue
Crack Propagation in Offshore Structural
Steels," Engineering Fracture Mechanics,
30,5, (1988),
pp579-593.
34. Smith, D.J., Bourke, M.A.M., Hodgson A.P., Webster, G.A. and Webster, P.J.,
"Residual stresses in cracked specimens subjected to prior loading," Welding
Institute report
431/1991
35. Underwood, J., "Residual-stress Effects at a Notch Root in A723 Steel to Exten
Fatigue
Life," Experimental Mechanics, 35, J,, (1995),
pp61-65.
36. Toyosada, M., Niwa, T., Sakai, J., "Physical meaning of AK
RP
and fatigue crack
propagation in the residual stress distribution field,".
International Journal of
Fatigue, 19, SI, (1997),
ppS161-S166.
37. "Wang, G.S., "The plasticity aspect of fatigue crack growth," Engineering Frac
Mechanics,
46,
6,
(1993),
pp.909-930.

8/10/2019 The Effect of Residual Stress and Crack Closure on Fatigue Crack
http://slidepdf.com/reader/full/the-effect-of-residual-stress-and-crack-closure-on-fatigue-crack 106/304
Research Objectives 6.1
6 Research Objectives
The preceding chapters have surveyed the literature detailing FCG, the origin of residua
stresses, fatigue crack closure effects, and the effect of residual stress upon FCG. Th
techniques for the investigation of these phenomena have also been outlined. Some
theories designed to model residual stress effects on FCG have been reviewed.
A damage tolerant approach to the remaining life of engineering components and
structures, i.e. the acceptance that the presence of a crack does not necessarily denot
imminent catastrophic failure, is increasingly required. The economic penalty associated
in prematurely withdrawing machinery or structures from service, either for emergency
repairs or to be written-off, is self-evident. Likewise failure to account for tensile
residual stresses acting on a crack tip may result in unsafe conditions, that lead to
unacceptable losses.
The standard fracture mechanics reference works utilised by engineers [1, 2] fail to
sufficiently account for the effect of residual stresses or crack closure upon fatigue c
propagation. Although some corrections to account for small scale yielding at the crack
tip are mentioned [2], these standard reference works for the stress analysis of cracks
make little reference to residual stress effects.
6 1 Objectives
The objectives of the work were to develop an improved understanding of the combined
effects of residual stress and crack closure upon FCG. In particular this was to be in
context of welded components and components that had been deliberately over-loaded
to generate residual stresses. The knowledge derived from this work could then be
applied to the formulation of a set of practical guidelines that might be used by
engineers to better estimate the fatigue performance of structures and components in th

8/10/2019 The Effect of Residual Stress and Crack Closure on Fatigue Crack
http://slidepdf.com/reader/full/the-effect-of-residual-stress-and-crack-closure-on-fatigue-crack 107/304
Research Objectives
6 2
field. S u c h guidelines mig ht be us ed in conjunction with data fro m field me as ur em en ts
and materials property data.
6 2 Background
The experimental study reported within this thesis has been directed toward further
investigation of the interrelationship between crack closure effects and residual stresse
in the context of their effect upon the growth of fatigue macrocracks. A macrocrack will
be defined here as a crack that has reached such a length or size that it is beyond the
initiation stage, and is the dominant flaw. The growth of such cracks is dependent on
bulk conditions, not the local conditions associated with initiation.
The fatigue lives of structures and components can generally be considered as being two
part, crack initiation life and crack growth life. Crack initiation lives are highly
statistical and depend largely on surface conditions. Crack growth lives are, in contrast,
rather more consistent, depending principally upon loading conditions, and stress
intensity conditions at the crack tip.
In the case of small components microcracks will, if detected, result in the rejection of
component before it enters service. In such cases, the crack initiation life usually form
the greater part of the fatigue life. However, in very large, especially welded, structur
and components there are often undetected flaws, or stress raisers, that serve as notches
effectively bypassing the crack initiation life. It is good practice when modelling the
fatigue lives of such structures or components to account for such (presumed) flaws and
stress raisers. However, residual stresses can make predictions of fatigue lives
inaccurate.
This point highlights the need for conservative safety factors to be written into design
lives and preventative maintenance and inspection programs of industrial plant and

8/10/2019 The Effect of Residual Stress and Crack Closure on Fatigue Crack
http://slidepdf.com/reader/full/the-effect-of-residual-stress-and-crack-closure-on-fatigue-crack 108/304
Research Objectives
6.3
structures. Sometimes such safety factors prove dangerously inadequate, on other
occasions they are excessively conservative. In both cases there is an economic penalty.
Deliberate over-stressing of components and structures can be used to enhance their
fatigue lives by generating compressive residual stresses, and this has been discussed
briefly in 3.3. Welding and heat treatment processes have also known to generate
residual stresses, and this has been reviewed in 5.7. There remains much that is not
understood about the effects of such residual stresses. When residual stresses are
measured in real situations the information is frequently incomplete. This can lead to
actual fatigue behaviour, which is rather different from that which might have been
predicted.
6 3 Fatigue tests and outline of associated experimental program
A four part experimental program was undertaken to investigate the combined effect of
crack closure and residual stress fields upon the growth of macrocracks. This involved
the fabrication of compact tension fatigue specimens from the test material, and from a
section of double-V butt weld. The residual stress state of the as received material was
modified by means of stress relieving heat treatment, and by the application of
deliberate overloads to CT specimens generating localised plastic deformation.
6.3.1 Collection of "baseline" (control) data
Baseline, or control data, was required to evaluate the basic fatigue behaviour of the te
material. This comprised a series of constant load (AK increasing) fatigue experiments,
on as received and stress relieved material. Specimens were cut in L-T and T-L
orientations (see Figure 6.1). Experiments were carried out at several R ratios, and the
load was stepped down in discrete steps for the first part of each test with the aim of
estimating the fatigue threshold of the material, and maximising the amount of FCG
data collected at near threshold rates (< IO"
8
m/cycle).

8/10/2019 The Effect of Residual Stress and Crack Closure on Fatigue Crack
http://slidepdf.com/reader/full/the-effect-of-residual-stress-and-crack-closure-on-fatigue-crack 109/304
Research Objectives 6.4
6.3.2 Constant
A K L
fatigue testing of as received material
A constant AKL test program, on as received plate specimens. A range of stress
intensities was used, and the tests were interrupted at pre-determined intervals of cr
growth to make crack closure measurements.
6.3.3 Constant AKL testing of overloaded specimens
A group of specimens was subjected to overloads sufficient to cause a small amount of
local plastic deformation ahead of the notch. This inhomogenous deformation generated
significant residual stress fields on unloading. The residual stress fields generated
evaluated by x-ray and neutron diffraction, and by a few hole-drilling measurements.
Cracks were then grown in these specimens under constant AKL conditions.
6.3.4 Constant AKL testing of welded specimens
A double-V butt weld was prepared according to a standard procedure, detailed in the
Appendix. Compact tension specimens cut from this weld at several positions, and the
residual stress-state of these specimens was examined by neutron diffraction prior to
constant AKL fatigue tests. Crack closure measurements, similar to those mentioned
above (6.3.2), were also performed.
6 4 Experimental procedures
Three basic classes of experiments formed the basis of the program:
1. Residual stress measurement: The residual stress condition of the specimens was
investigated prior to the growth of fatigue cracks, using x-ray and neutron
diffraction techniques. Some "hole-drilling" measurements were also undertaken (by
courtesy of SECV Herman Laboratory). This exercise was to establish a comparison
between this popular semi-destructive (or essentially non-destructive) technique and
the theoretically more accurate diffraction techniques.

8/10/2019 The Effect of Residual Stress and Crack Closure on Fatigue Crack
http://slidepdf.com/reader/full/the-effect-of-residual-stress-and-crack-closure-on-fatigue-crack 110/304
Research Objectives 6.5
Fatigue crack growth experiments: Fatigue cracks have been grown under constant
stress intensity amplitude (AKL) and constant load conditions (AKLincreasing) in the
as received and stress relieved materials. The specimens that had been overloaded
and the weld specimens were fatigued under constant AKL conditions only. The
basic intention of this plan was to use the data generated by the work on as received
material as control data, and to compare this data with that from those specimens
with significant residual stress fields.
3. Crack closure experiments: Crack closure measurements were carried out
throughout the constant AKL test program, on all specimens, as received,
overloaded, and welded. The load history of each fatigue test was recorded in some
detail by the test system, facilitating detailed post-test analysis.
These experimental procedures are described in greater detail in the following chapter
on experimental techniques.

8/10/2019 The Effect of Residual Stress and Crack Closure on Fatigue Crack
http://slidepdf.com/reader/full/the-effect-of-residual-stress-and-crack-closure-on-fatigue-crack 111/304
Research Objectives
6.6
Length, longitudinal rolling direction
Width, long
transverse
Thickness, short
transverse
Figure 6.1, Conventional terminology for comp ac t tension an d single edge notch
specimens

8/10/2019 The Effect of Residual Stress and Crack Closure on Fatigue Crack
http://slidepdf.com/reader/full/the-effect-of-residual-stress-and-crack-closure-on-fatigue-crack 112/304
Research Objectives
6.7
REFEREN ES
1. Rooke, D.P., Compendium of Stress Intensity Factors , (1976), pub H M S O ,
London.
2. Tada, H., Stress Analysis of Cracks Handbook , (1985), pub Paris Productions
Del Research Corp., Hellertown, Pennsylvania.

8/10/2019 The Effect of Residual Stress and Crack Closure on Fatigue Crack
http://slidepdf.com/reader/full/the-effect-of-residual-stress-and-crack-closure-on-fatigue-crack 113/304
Experimental Techniques
7.1
7 Experimental Techniques
7.1 Fatigue testing
The fatigue test program was carried out using an Instron 1603 electromagnetic
resonance fatigue machine fitted with clevis and pin type specimen fixtures. In the
Instron 1603 the specimen is held vertically in a frame designed about a resonant
spring/mass system, see Figure 7.1. A cyclic load is produced in the specimen by
exerting the natural resonance of a mass supported by a spring of which the specimen
a part. This type of machine is essentially a pair of contra-oscillating masses with
spring between them. The mean load is automatically maintained by four acme screws
at the corners of the support structure, driven by a servo motor system. Excitation i
provided by an electromagnet that provides the dynamic load (or demand load).
7.1.1 Specimen geometry
The compact tension (CT) specimen geometry, shown in the Figure 7.2, was utilised
throughout the test programme. The notch root stress intensifier was produced by wir
erosion. This avoided the creation of a worked layer, minimised microstructural
damage, and had the advantage of being more reproducible. The sides of the specimen,
either side of the crack plane, were ground to final size to further minimise the exte
any surface deformation due to the specimen manufacturing process. Prior to testing t
surfaces adjacent to the crack plane were cleaned with acetone to minimise any chanc
of contamination.
7.1.2 Measurement of crack length using DC-PD
Crack length was monitored during testing using a direct current potential drop syst
(DC-PD). This technique has been widely discussed in papers by several authors
[1,2,3]. It has several advantages over crack opening displacement techniques:
• Probe wires are cheap and robust compared to commercial clip gauges,

8/10/2019 The Effect of Residual Stress and Crack Closure on Fatigue Crack
http://slidepdf.com/reader/full/the-effect-of-residual-stress-and-crack-closure-on-fatigue-crack 114/304
Experimental Techniques 7 2
• Resolution of the technique is relatively good (better than 0.05mm).
• Remote monitoring is relatively simple and is easily automated.
• Calibration is straightforward.
Figure 7.1, Instron 1603 resonance fatigue machi ne as used in test p r o g r a m with
sp ec im en held in clevis grips
The system used wa s built in house from commercially available com pon ent s.
Principal components comprised a high quality constant current power supply unit
(Kikisui PAD 16-50LE) and a low noise high gain amplifier, incorporating a low pass
signal filter (Analog Devices 3B03/3B30). Soft iron probe wires (the iron wire from
iron-constantan thermocouple) were utilised to minimise thermocouple effects (also
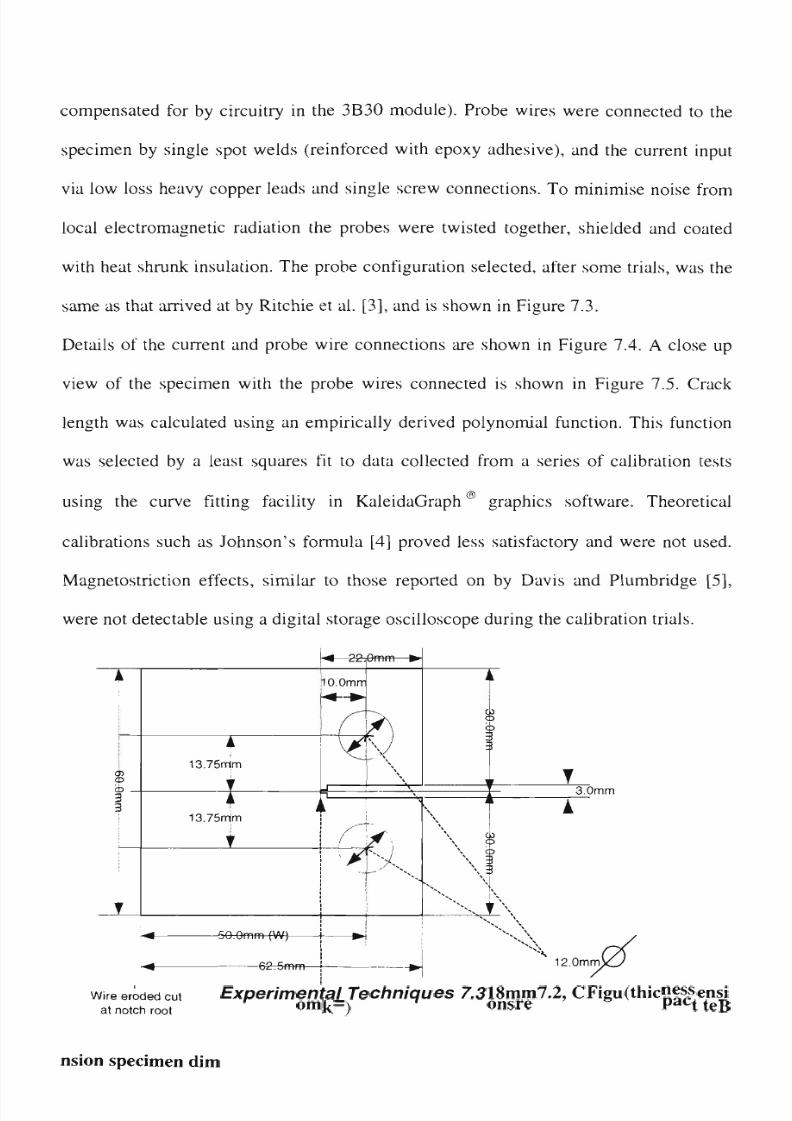
8/10/2019 The Effect of Residual Stress and Crack Closure on Fatigue Crack
http://slidepdf.com/reader/full/the-effect-of-residual-stress-and-crack-closure-on-fatigue-crack 115/304
Experimental Techniques 7 3
compensated for by circuitry in the 3B30 module). Probe wires were connected to the
specimen by single spot welds (reinforced with epoxy adhesive), and the current input
via low loss heavy copper leads and single screw connections. To minimise noise from
local electromagnetic radiation the probes were twisted together, shielded and coated
with heat shrunk insulation. The probe configuration selected, after some trials, was th
same as that arrived at by Ritchie et al. [3], and is shown in Figure 7.3.
Details of the current and probe wire connections are shown in Figure 7.4. A close up
view of the specimen with the probe wires connected is shown in Figure 7.5. Crack
length was calculated using an empirically derived polynomial function. This function
was selected by a least squares fit to data collected from a series of calibration tests
using the curve fitting facility in KaleidaGraph ® graphics software. Theoretical
calibrations such as Johnson's formula [4] proved less satisfactory and were not used.
Magnetostriction effects, similar to those reported on by Davis and Plumbridge [5],
were not detectable using a digital storage oscilloscope during the calibration trials.
3.0mm
Wire eroded cut
at notch root
Figure
7.2,
Compact tension specimen dimensions (thickness B = 1 8 m m )

8/10/2019 The Effect of Residual Stress and Crack Closure on Fatigue Crack
http://slidepdf.com/reader/full/the-effect-of-residual-stress-and-crack-closure-on-fatigue-crack 116/304
Experimental Techniques 7.4
9mm
1mm
E
a
to
18fnm
+ve
Current Input
2mm
Not
to
scale.
Probe location -ve
• Probe
location
ve
ve
Current Input
Figure 7.3. Probe locations for D C - P D system, as used with 5 0 m m wide 1 8 m m
broad C T specimen (similar to the configuration used by Ritchie et al
[3])
Brass washer
Iron probe wire
spot welded in
position
Spring
washer
Brass washer
1/16 B S W Screw
Heavy duty low loss copper lead
Custom made copper
terminal soldered to
current lead
Figure 7.4, Detail of probe wire and current lead connections to CT-specimen

8/10/2019 The Effect of Residual Stress and Crack Closure on Fatigue Crack
http://slidepdf.com/reader/full/the-effect-of-residual-stress-and-crack-closure-on-fatigue-crack 117/304
Experimental Techniques 7.5
Figure 7.5, Close-up view of specimen in-situ ready for testing in Instron 1603 with
probe wires attached
7.1.3 Test control and data acquisition
The fatigue tests were controlled using a combination of the standard control co
supplied with the Instron 1603 and commercially available computer hardware.
Necessary computer software was written in Microsoft QuickBASIC, (program listin
can be found in Appendix 1). The computer hardware comprised an IBM PC-AT
compatible microcomputer interfaced to the control console of the Instron 1603 an
crack monitoring system, via a multi-channel analyser card (Metrabyte Dash 8) and
analogue output card (CIO DAC-02). The output signals from the Instron 1603 conso

8/10/2019 The Effect of Residual Stress and Crack Closure on Fatigue Crack
http://slidepdf.com/reader/full/the-effect-of-residual-stress-and-crack-closure-on-fatigue-crack 118/304
Experimental Techniques 7 6
and the crack length monitoring system were fed into the multi-channel analyser card.
Load control signals were returned to the Instron from the computer via the analogue
output card. Figure 7.6 shows
a
schematic representation of the system.
Using the compu te d value of crack length implied by the potential drop, adjustments to
the me a n
and
dynamic load could
be
effected automatically (at pre-specified crack
lengths or increments of crack growth). This enabled pseudo-constant AK (stress
intensity amplitude), or continuously decreasing AK, fatigue tests to be carried out
well as constant load amplitude (AP) type experiments.
The crack length signal and loading parameters (mean, maximum, minimum and
dynamic
load),
the number of cycles and time, are recorded onto diskette at
approximately 0.05 m m increments crack
growth.
This provided a comprehensive load
history for each test, and facilitated detailed post-test analysis using commercially
available spreadsheet programmes, (e.g. Lotus
123 and
Microsoft Excel).
The
stress
intensity amplitude was calculated using the function given in the A S T M standard E647
[ ]:
AK=^SL
(2 +
°° .
(0.886
+
4.64a- 13.32a
+
14.72a
- 5.6a)
¥
d-«)
T
Equation 7.1
Where AP = load amplitude, B = specimen thickness (breadth), W = specimen width,
and a = ratio of effective crack length to specimen width W (a/W).
The computerised data logging was backed up by analogue systems in the form of a
chart recorder and digital voltmeter. The latter also served a useful purpose during
setting up each
test.

8/10/2019 The Effect of Residual Stress and Crack Closure on Fatigue Crack
http://slidepdf.com/reader/full/the-effect-of-residual-stress-and-crack-closure-on-fatigue-crack 119/304
Experimental Techniques 7.7
l \A
Calibration
The DC-PD system was calibrated by the beach marking method. This procedure
involved interrupting the fatigue cracking process at regular intervals. At each such
interval the amplified signal level from the crack probes is recorded. These intervals
were initially determined by monitoring the crack length from the side of the CT-
specimen using a travelling microscope. At each interruption the loading conditions
were changed, in particular the ratio of minimum load to maximum load, (the R ratio).
This resulted in distinct beach marks on the fracture surface, see Figure 7.7 below.
The calibration experiments also enabled the collection of approximate FCGR/AK data
o
sufficient to identify A K levels at which near threshold F C G R (<10~ m/cycle) were
likely to predominate.
When the crack has grown to a suitable length, the specimen was chilled to below its
ductile-brittle transition temperature using liquid nitrogen. The uncracked ligament w
then broken by the impact of a hammer and cold chisel. The crack length at each beach
mark was then measured using a travelling microscope at 5 points across the fracture
surface, see Figure 7.8. The mean crack length taken as the average of these 5
measurements.
A second order polynomial function was fitted to this calibration data, see Figure 7.9.
This function was incorporated into the computer program monitoring and controlling
the fatigue tests. The calibration could be further checked after each test by similar
examination and measurements of the fracture surface following each experiment using
a travelling microscope. The function fitted to the data was as follows:
Crack length (meas. from notch tip) = -38.06 + 44.236
Equation 7.2
^1
5.6818
f
v
N

8/10/2019 The Effect of Residual Stress and Crack Closure on Fatigue Crack
http://slidepdf.com/reader/full/the-effect-of-residual-stress-and-crack-closure-on-fatigue-crack 120/304
Experimental Techniques 7 8
Constant current
+
1
power supply
Chart recorder
Intron
1603
control
console
Synchro signal-
Mean
load.
Dynamic
load_
Peak loajt
Minimum load
•
k
Heavy copper current leads
• Soft iron probe wire
Digital volt meter
| oo.ooov |
Buffer
Amplifier
•Lt
Micro-computer for
data
acquisition and test
control
Mean load control signal
Dynamic load control signal
Figure
7.6,
Test
control
and
data acquisition
system for fatigue
crack gro wth

8/10/2019 The Effect of Residual Stress and Crack Closure on Fatigue Crack
http://slidepdf.com/reader/full/the-effect-of-residual-stress-and-crack-closure-on-fatigue-crack 121/304
Experimental Techniques 7.9
Notch
Uncracked
ligament
Figure 7.7, Beach-marked fracture surface as used for calibration of DC-PD crack
length monitoring system
a1
Ce nt re of crac k front
a 2 Right of centre
a 3
Left of centre
a 4 :
Right surface
a 5 : Left surf ace
Figure 7.8, Location of crack length measurements on fracture surface of compact
tension (CT) specimen

8/10/2019 The Effect of Residual Stress and Crack Closure on Fatigue Crack
http://slidepdf.com/reader/full/the-effect-of-residual-stress-and-crack-closure-on-fatigue-crack 122/304
Experimental Techniques 7.10
Crack length
(mm)
30-
20-
10-
o- r—>—i—•—i—•—i—•—i—<—i—•—i
1.0 1.2 1.4 1.6 1.8 2.0 2.2 y
Figure 7.9, Calibration of DC-PD crack length measurement system
The correlation coefficient of calibration data to equation 7.2 was better than 0.99
V level, i.e. the amplified signal level, at the start of each test was set at 4.57 v
setting was chosen after considerations of current density and amplifier saturation
were accounted for. Optimum sensitivity demands higher current densities, but the
amplifier circuitry available was unsuitable for this. At the level selected the con
current passing though the specimen was approximately 16 Amps. The initial levels at
the start of each experiment was set using a four and a half digit multimeter this was
also used in the calibration procedures.
Further signal conditioning was required to reduce the input levels to the Dash-8 multi
channel analogue to digital card. This was accomplished by using some simple buffer
amplifiers.
The accuracy of the cycle count was checked by cross-referencing with the counter on
the control console of the Instron 1603. This was further cross-checked by comparing
the calculated frequency actual frequency using an oscilloscope. The method of cycle
counting was not an issue since the load versus time relationship was a simple
sinewave.
Fracture surface measurements
—Projection based
on
calibration data

8/10/2019 The Effect of Residual Stress and Crack Closure on Fatigue Crack
http://slidepdf.com/reader/full/the-effect-of-residual-stress-and-crack-closure-on-fatigue-crack 123/304
Experimental Techniques 7.11
7.1.5
Calculation of crack growth rate and presentation of results
Fatigue crack growth rate (FCGR), ^ , with was calculated using the secant method
and a da increment of 0.5mm, at 0.25mm intervals such that successive data points
overlapped. The secant method has been shown by Bastenaire et al. [7] to be
consistently more accurate than incremental polynomial solutions, and is simple to
apply. The crack growth rate is calculated by dividing the increment of crack growth
selected by the number of cycles that elapsed during that increment, i.e., the gradie
a straight line linking two points on the a versus N curve. Accuracy of -rrr is depen
upon the accuracy with which da can be measured. The effect of the size of da has
been discussed by Ostergaard [8]. Using the DC-PD system to measure crack length an
increment of 0.5mm could be measured with a high level of confidence. Five readings
PD were taken in quick succession, the minimum and maximum values were discarded,
and the average of the remaining three values taken. This average was used to calcula
crack length using the equation above (25).
The counter used to record the number of cycles was accurate. (See section on
experimental errors in Appendix A2 for details). Where AK has been given for a
calculated value of ^- it is an average over the corresponding increment of crack
growth.
7.1.6 Test conditions (temperature and humidity)
All fatigue crack growth (FCG) experiments were performed in an air-conditioned
laboratory, the temperature was maintained at 20 C (±2°) and a relative humidity of 5
(±5%). These conditions were monitored using a simple minimum/maximum
thermometer and periodic checks using a whirling hygrometer.

8/10/2019 The Effect of Residual Stress and Crack Closure on Fatigue Crack
http://slidepdf.com/reader/full/the-effect-of-residual-stress-and-crack-closure-on-fatigue-crack 124/304
Experimental Techniques 7.12
A Constant load amplitude (AP) tests
Residual stress and crack closure effects are of most interest close to the fatigue
threshold, which implies crack growth rates < IO
8
m/cycle. The calibration experime
had allowed estimation of the AK required for such fatigue crack growth rates (FCGR)
In order to maximise the amount of FCGR data gathered in the near threshold regime
for each test, the constant AP tests were performed in two stages, whereby the load
shed in steps for the first part of the test. The crack was then allowed to run to
completion at the terminal AP in a similar manner to that described in ASTM
standard E647 [6]. This allowed the collection of about five equally spaced FCGR/AK
data points for each decade of the first half of each test. A typical loading sch
illustrated in Figure 7.10.
20
18
16
E 14
ro 12
I
10
6
4
2
0
0
W4IVT
y y^
TL
^b
V-i
* •*» . « •
1
--
y
--
5 10 15
Crack length a) /
m m
14
12
10
^^
0
C
— delta K
—
delta
P
0
20
Figure
7.10,
Loading schedule for
a
typical constant load amplitude (AP) test
The rate of load shedding was sufficient to preclude anomalous data resulting from
reductions in AK and concomitant transient FCGRs.

8/10/2019 The Effect of Residual Stress and Crack Closure on Fatigue Crack
http://slidepdf.com/reader/full/the-effect-of-residual-stress-and-crack-closure-on-fatigue-crack 125/304
Experimental Techniques 7.13
7.1.8 Constant AK tests
The constant AK tests were performed under conditions of semi-continuous load
shedding. Crack length was calculated by the computer program, based upon the DC-
PD signal, using the polynomial function empirically derived from the calibration dat
The system was programmed to record data when the DC-PD signal indicated that the
crack had increased in length by 0.05 mm. The system computed the new required mean
and dynamic load required to maintain the desired AK and R, and then adjusted the
control signals accordingly. The system was programmed to stop the test at arbitrary
pre-selected intervals to allow crack closure measurements to be performed.
7.2 Crack closure measurement
Crack closure measurement was performed using a strain gauge mounted on the back
face of the compact tension specimens opposite the crack plane, see Figure 7.11. This
commonly referred to as the back face strain gauge (BFS gauge) method. In the
relatively thick compact tension specimens used in this investigation, plane strain
(Mode 1) conditions predominate. The back face strain gage provides an excellent
means of measuring bulk (through thickness) closure effects, rather than the sometime
unrepresentative effects at the surface due to the lower levels of constraint.
The BFS method has several other advantages that have led to its increased popularity
in recent times, as documented by Allison [9]. It has a relatively high sensitivity
combined with low cost, and ease of application. It does not suffer from the frequenc
limitations and attachment problems associated with the clip gauge. The BFS method is
especially effective when used in samples loaded in bending, e.g., the compact tensio
specimen used in this work. In such specimens the back face strain is compressive

8/10/2019 The Effect of Residual Stress and Crack Closure on Fatigue Crack
http://slidepdf.com/reader/full/the-effect-of-residual-stress-and-crack-closure-on-fatigue-crack 126/304
Experimental Techniques 7 14
during tensile loading. T h e hinging action of the neutral stress axis magnifies sample
deflections.
Figure 7.11, C T spe cim en with strain ga ug e m o u n t e d o n b ac k face opposite the
crack plane B F S gau ge)
7.2.1 Closure m e a s u r e m e n t instrumentation
The strain gauges utilised had a 3mm gauge length and were connected to a digital
strain meter. To preclude thermal drift, an identical second ( compensator ) strai
gauge was utilised in a half bridge configuration. This was mounted on a dummy
specimen of the test material. The outputs from the strain meter and load signal f
the Instron 1603 were input to a computer via an analogue to digital converter. Th
basic configuration is shown schematically in Figure 7.12. The test control (and d
collection hardware used was essentially the same as that used for the FCG
experiments, with software modifications. When used with compact tension specimens

8/10/2019 The Effect of Residual Stress and Crack Closure on Fatigue Crack
http://slidepdf.com/reader/full/the-effect-of-residual-stress-and-crack-closure-on-fatigue-crack 127/304
Experimental Techniques 7.15
the BF S method as used is considered sufficiently sensitive not to require further signal
processing.
CT Specimen
Gauge 1
0.
Dummy specimen
Gauge 2
(Compensator)
Zero adjust
Digital strain
meter
Microcomputer
Figure 7.12, Back face strain gauge set up for crack closure measurement
The performance of the strain gauges themselves were unaffected by fatigue at the
cyclic strain levels encountered during the test program. This has been confirmed by
technical data published by the strain gauge manufacturer, Micro Measurements Group
Inc. [10].
The specimen was loaded and unloaded (in tension) under computer control, with the
crosshead speed set at 3mm/min. The peak stress intensity applied corresponded
approximately to 95% of the peak stress intensity applied during the segment of crack
growth immediately preceding. The outputs of the load cell and the back face strain
were logged during this loading cycle.

8/10/2019 The Effect of Residual Stress and Crack Closure on Fatigue Crack
http://slidepdf.com/reader/full/the-effect-of-residual-stress-and-crack-closure-on-fatigue-crack 128/304
Experimental Techniques 7.16
7.2.2 Analysis of crack opening/closing response
It is widely accepted that at the point at which the strain transducer vs. load trace
becomes linear that the crack is fully open. This linear part of the transducer vs. loa
trace was extrapolated back to the zero load condition. The deviation of the trace from
this extrapolation was plotted (on an expanded scale) against load. This makes
identification of the crack opening/closure load (P
op
/P
c
i) relatively easy. Thus, (if the
crack length is known), the crack opening/closure stress intensity, K
op
/K
c
i, can be
determined using the standard K equation for the specimen geometry (24). Hysteresis
due to the Bauschinger effect is clearly identifiable despite the small plastic zone siz
calculated. Cracks open progressively making determination of closure load difficult.
This is further complicated by the hysteresis (due to plasticity) already mentioned.
Schive [11] argued that K
c
i is more reproducible and less ambiguous. However, the
opening load (or stress intensity) is considered more relevant since damage occurs
during the crack opening part of the cycle. In practice K
op
- K
c
i is often less than the
scatter associated with some closure measurements.
A straight line was fitted to the linear part of the load-strain strain curve using a
proprietary computer graphics package (KaleidaGraph, running on an Apple Macintosh
system). The same program was then utilised to calculate the deviation of the load vs.
strain transducer (BFS) data from this linear regression. The procedure was automated
using a macro command . A typical example of the load vs. strain and Ae versus
load result is shown in Figure 7.13 and Figure 7.14 respectively. Ae is the name
assigned to the difference between the linear regression of the linear part of the BFS
versus load line and the actual BFS data. The point at which Ae approaches zero
corresponds to the crack opening/closing load (P
0
p/P
c
i).

8/10/2019 The Effect of Residual Stress and Crack Closure on Fatigue Crack
http://slidepdf.com/reader/full/the-effect-of-residual-stress-and-crack-closure-on-fatigue-crack 129/304
Experimental
Techniques
7.17
Figure
7.13,
Load vs. BFS response for a cracked specimen (BFS scale
is
reversed)
r ~.\
A
I
4
-
\
J
%
|
Crack
opening
3
\~ point
, _
\
T __ _ _,
.
.\J
.
- - ^
S^V.<-~A.^AA^\=*^
Load
(kN)
Figure 7.14, Example plot of load vs. A e showing point
(P
op
)
at which crack is
presumed to open

8/10/2019 The Effect of Residual Stress and Crack Closure on Fatigue Crack
http://slidepdf.com/reader/full/the-effect-of-residual-stress-and-crack-closure-on-fatigue-crack 130/304
Experimental Techniques 7.18
7.3 Residual stress measurement by X-ray diffraction
The residual stress measurement by X-ray diffraction was carried out using equipment
at the Monash University's Department of Physics. The basic theory behind the
working of this equipment is dealt with in 3.4. Diffraction takes place from crystal
lattice planes parallel to the specimen surface; i.e. the scattering vector is normal to
direction of the measured stress. If the surface is in compression due to forces acting
parallel to the specimen surface then, due to Poisson's effect, these planes will be mor
widely spaced. If in tension the planes will appear closer together.
7.3.1 X-ray diffractometer for residual stress measurement
A Philips X-ray generator operating at 34kV and 20mA was used as the source of Cu
Ka radiation. {2 1 1} reflections were selected as being a suitable Bragg peak for
determination of lattice spacing. The diffractometer had been specially adapted for
residual stress measurement. The specimen stage was manipulated via servomotors
controlled via a PDP-11 type mini-computer. The same mini-computer also managed
data collection. Computation of residual stresses was done using software specially
written by P. Lambrineas running on a VAX mainframe computer.
7.3.2 Specimen preparation
Prior to the X-ray diffraction experiments the specimen surfaces were electro-polished
in the area planned measurement. This removed deformed surface material remaining
after machining of the specimen. This is essential since the x-rays only penetrate a few
micrometres at most, and the deformation associated with machining the specimen
would easily cover this. Hence, for meaningful results a suitable technique is required
for removing this surface layer. This procedure is detailed in Appendix A3.
The instrument utilised a position sensitive detector that remained stationary during th
experiment. Diffracted X-rays are detected over a range of 20 simultaneously,

8/10/2019 The Effect of Residual Stress and Crack Closure on Fatigue Crack
http://slidepdf.com/reader/full/the-effect-of-residual-stress-and-crack-closure-on-fatigue-crack 131/304
Experimental Techniques
7 1
accelerating the rate of data collection. The instrument is shown in Figure 7.15 with a
specimen in place, and schematically in Figure 7.16.
7.3.3 Diffraction measurement conditions
The diffractometer was used in the psi mode, and measurements were taken at ten
\|/(psi) angles (-45.0°, -37.8°, -30.0°, -20.7°, -0.5°, 0.5°, 20.7°, 30.0°, 37.8°, 45.0°
Regression analysis over the entire range of r values was used to obtain the stres
values. The sample normal 28 angle was 180° and dial angle 0°. The data was collecte
via a multi-channel analyser, with 512 memory channels in use. Data collection time
was 60 seconds per psi angle. The 9 angle of the Bragg peak was -78.05°. The sample
was rocked through ±3° at each V|/ angle in 0.5° steps; this assisted in minimising
texture effects. Spatial resolution of approximately ±2mm was achievable, with an X-
ray spot size about 3mm in diameter.
Figure 7.15, X-ray diffractometer adapted for residual stress measurement

8/10/2019 The Effect of Residual Stress and Crack Closure on Fatigue Crack
http://slidepdf.com/reader/full/the-effect-of-residual-stress-and-crack-closure-on-fatigue-crack 132/304
Experimental Techniques
7.20
Figure 7.16, Schematic representation of X-ray residual stress measurement
7.3.4 Unstressed lattice spacing (d
0
) for X-ray diffraction
If the stress state in the irradiated volume is biaxial, an exact value of d
0
(the unstr
lattice parameter) can be determined from plots of d vs. sin
2
\j/ (d
()
) data acquired duri
the stress measurement itself. The method was first described by Hauk et al [12] and is
also described in Noyan & Cohen's standard reference work [13]. The laboratory and
sample co-ordinate system and angles are defined in Figure 7.17 below.

8/10/2019 The Effect of Residual Stress and Crack Closure on Fatigue Crack
http://slidepdf.com/reader/full/the-effect-of-residual-stress-and-crack-closure-on-fatigue-crack 133/304
Experimental Techniques 7 21
Figure 7.17, Definition of laboratory L ) a n d sa mp le (S) coordinate system a n d the
angles j), \\f
For (|)=0:
d
0.
V
_ d
o 1+v
v
; =
— —
a
n
s i n
V
-
— ° n +^22)
Eq ua ti on 7.3
For
V|/=\)/*,
d
v
*=d o, Equati on 7.3 m a y be written:
2..,*_
v / E J ,,cr
2 2
sin v|/* =
1 + -
v / E
((l+v)/E) o
M
(d+v)/E)
l
m,
Eq ua ti on 7.4
(m,,
IIL,
are the slopes of
d
vs.
sin
2
\|/
at
()>=0 ,
90 respectively). H e n c e ,
sin
2
\|/*
can
be
determined, an d then
do
obtained f ro m
d
vs.
sin
2
\|/
at
t])=0 .

8/10/2019 The Effect of Residual Stress and Crack Closure on Fatigue Crack
http://slidepdf.com/reader/full/the-effect-of-residual-stress-and-crack-closure-on-fatigue-crack 134/304
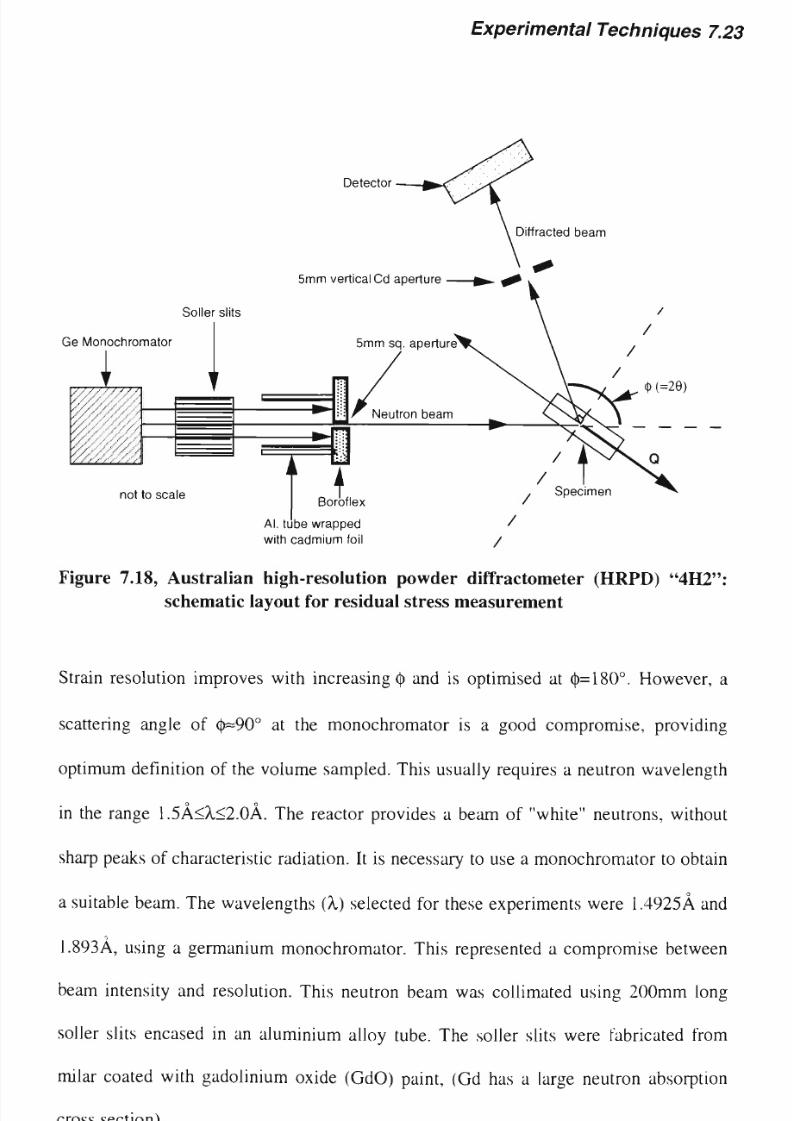
8/10/2019 The Effect of Residual Stress and Crack Closure on Fatigue Crack
http://slidepdf.com/reader/full/the-effect-of-residual-stress-and-crack-closure-on-fatigue-crack 135/304
Experimental Techniques
7 23
Detector
<t> ( =29)
not
to scale
Boroflex
Al. tube wrapped
with ca d m iu m foil
/
/
Figure 7.18, Australian
high-resolution
po wd er diffractometer ( H R P D )
4H2 :
schematic layout for residual stress measurement
Strain resolution improves with increasing
and is optimised at
(p=180°.
However, a
scattering angle of c}>==90
0
at the monochromator is a good compromise, providing
optimum definition of the volume sampled. This usually requires a neutron wavelength
in the range 1.5A<A,<2.0A. The reactor provides a beam of white neutrons, without
sharp peaks of characteristic radiation. It is necessary to use a monochromator to ob
a suitable beam. The wavelengths (A,) selected for these experiments were 1.4925A and
1.893A, using a germanium monochromator. This represented a compromise between
beam intensity and resolution. This neutron beam was collimated using 200mm long
soller slits encased in an aluminium alloy tube. The soller slits were fabricated from
milar coated with gadolinium oxide (GdO) paint, (Gd has a large neutron absorption
cross section).

8/10/2019 The Effect of Residual Stress and Crack Closure on Fatigue Crack
http://slidepdf.com/reader/full/the-effect-of-residual-stress-and-crack-closure-on-fatigue-crack 136/304
Experimental Techniques
7.24
In selecting an appropriate reflection consideration was given to the strong texture in
rolled plate material, and the plastic deformation that must have taken place so that
residual stress might exist. Noyan and Cohen [13] have summarised the principal
advantages of using high multiplicity families of planes. In this case the (112) Bragg
reflection was selected (which has a multiplicity of 24). Multiplicity is an intrinsic
property of a unit cell and the miller indices (h k 1) of the diffracting planes. It ind
the number of equivalent planes that can diffract at a given Bragg angle, i.e. those with
the same spacing. High multiplicity families of planes will tend to give more intense
Bragg peaks.
7.4.3 Data collection and interpretation
The detector(s) were scanned through an angle (^hkl^Ohk]. where 9hkj is the Bragg angle
for the reflection (h k 1), in 0.05° steps. The collection of data and control of the
diffractometer was via a PDP-11 type computer. The position and width of the Bragg
peaks for each scan was determined using a Gaussian non-linear least-squares analysis.
This was done using (a) the PKFTT program available on the Fujitsu VP2200
supercomputer at ANSTO, and (b) the KaleidaGraph package running on an Apple
Macintosh. The results from both programs were very similar. The position of the
diffraction peaks was determined to a consistent accuracy of within ±0.01°. A typical
result is shown in Figure 7.19.

8/10/2019 The Effect of Residual Stress and Crack Closure on Fatigue Crack
http://slidepdf.com/reader/full/the-effect-of-residual-stress-and-crack-closure-on-fatigue-crack 137/304
Experimental Techniques 7 25
260
240
220
200
Counts 180
106
106.5 107 107.5 108 108.5
Diffraction angle 28 (degrees)
Figure 7.19, Typical neutron diffraction result from 112)
reflection,
stress relieved
control sample
H I
The Gaussian equation used for the non-linear least-squares curve
it
as of the form:
y =
m ,
+
m
2
* exp
Equation 7.5
-(mo-m3)*(mo-m3)
>
(m4*iri4)
Where (for the example in Figure 7.18):
mi (noise level)
m 2
(peak height above
mi )
m 3
(peak position)
m 4
(width of peak at
~
max.)
Chisq.
R
Value
125.72558
132.67782
107.17095
0.131520
14294.515825
0.9330315274
Absolute error (relative)
1.90949
(±1.5%)
6.85968
(±5.1%)
0.00551
(±0.0051%)
0.00820
(±6.2%)
NA
NA
Table 7.1, Typical values resulting from Gaussian curve fit to neutron diffraction
data
7.4.4 Stress-strain relationships for isotropic materials
The values Young's Modulus E and Poisson's ratio v of a material are dependent upon
the lattice planes (h k 1) used as the strain gauge. Hutchings [15] has published results
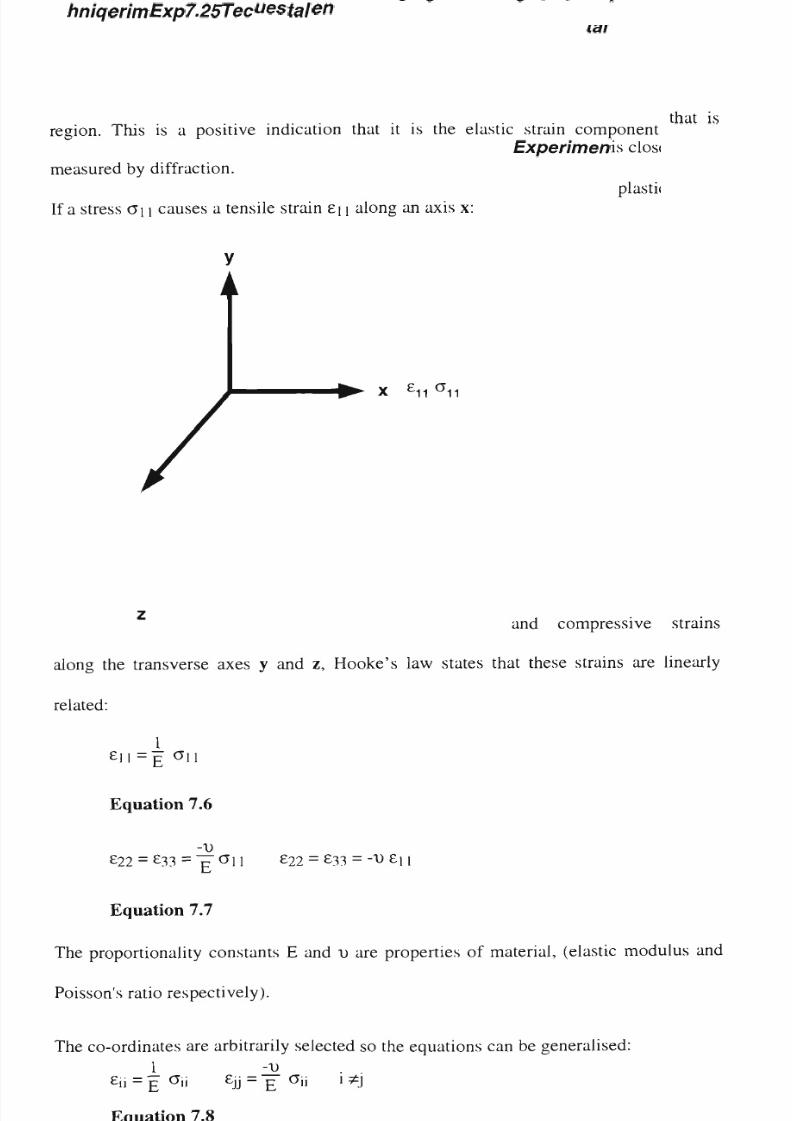
8/10/2019 The Effect of Residual Stress and Crack Closure on Fatigue Crack
http://slidepdf.com/reader/full/the-effect-of-residual-stress-and-crack-closure-on-fatigue-crack 138/304
Experimental Techniques
7.26
showing that the effective neutron Young's Modulus E for the (112) reflection is close
to the macroscopic value. The response was shown to be linear even in the plastic
region. This is a positive indication that it is the elastic strain component that is
measured by diffraction.
If a stress G\ \ causes a tensile strain en along an axis x:
y
i
and compressive strains
along the transverse axes y and z, Hooke's law states that these strains are linearly
related:
£li =
E
an
Equation 7.6
v
£22
=
£33
=
^0 £22
=
£33
= ven
Equation 7.7
The proportionality constants E and t> are properties of material, (elastic modulus and
Poisson's ratio respectively).
The co-ordinates are arbitrarily selected so the equations can be generalised:
1 -i> . .
£ii = £ On £jj =
E
a
'»
*J
Equation 7.8
/

8/10/2019 The Effect of Residual Stress and Crack Closure on Fatigue Crack
http://slidepdf.com/reader/full/the-effect-of-residual-stress-and-crack-closure-on-fatigue-crack 139/304
Experimental Techniques 7 27
Thus for a cube subject
to
three normal stresses 0 n, 0 22,
O33,
the strain along
any
direction x\ is the sum of the strain caused in that direction, and the strains caused
stresses acting in the transverse directions.
No rm al stresses ( a n , 022, 033) only cause dilation in isotropic materials. Distortion
occurs when a shear stress ay is applied. The shear strain is given by:
2£i)
=y--.
Gl]
1
Equation 7.9
The lattice strain is given (as shown in chapter 2) in the direction of the scattering
vector Q, is given by:
g =
Ad _ d-d^
=
_
Ae CQte (Ae=e
_
0}
d d
0
Equation 7.10
0 is half the diffraction angle 20 (expressed in radians), d is the unstressed lattice
spacing, and Ad is the change in lattice parameter (=d-d). A small change in d results
a shift in the position of the Bragg reflection (A0).
To determine the six terms in e, six measurements are necessary. If the directions of
principal stresses are known then 3 orthogonal directions may be sufficient for full
definition. Having determined e the principal strain axes and the residual stresses al
these can be related using macroscopic values of elastic modulus and Poisson's ratio.
However, this ideal was impractical since the amount of instrument time available was
insufficient to carry out such a complete survey. The plane strain conditions existing
the thick CT specimens should not allow z
x
to vary greatly with y and z The stress
tensor acting perpendicular to the crack plane was of principal interest. Hence, a rath
simpler survey of each specimen was undertaken, whereby a single scan was undertaken
at the same 5 positions in each of the specimens examined. The neutron flux at the

8/10/2019 The Effect of Residual Stress and Crack Closure on Fatigue Crack
http://slidepdf.com/reader/full/the-effect-of-residual-stress-and-crack-closure-on-fatigue-crack 140/304
Experimental Techniques 7.28
specimen, and the small irradiated volume, meant that in order to get good sampling
statistics at least 3 hours was required for each scan.
7.4.5 Unstressed lattice spacing (d
0
) for neutron diffraction
In order to calculate absolute values of strain from such experiments the unstressed
lattice spacing (d) must be known. This can be difficult to determine accurately, and a
compromise method is to use the mean d value obtained from a series of measurements
across a section. Since residual stresses and strains must balance within a component,
the mean value obtained from a suitable series of measurements through a section
should be close to d, and sufficient to give a meaningful indication of residual stress.
Edwards and Ozdemir [16] have also used local stress balance considerations in
deriving a suitable stress free zero. This was compared to a value of d obtained from a
fully stress relieved specimen (HI). This specimen was stress relieved more fully than is
practically possible for most commercial situations, see Appendix A5 for details. The
result of this comparison was a difference close to the margin of error expected from the
technique. The peak position differed by a margin of approximately ±0.01°, which
corresponds to an accuracy of =±20MPa. A true stress free value of d is a largely
academic issue, for the purposes of this type of study residual stresses relative to a
stress relieved state is arguably a sufficiently useful measurement.
7.5 Measurement of residual stresses by the hole-drilling method
Several specimens were sent to the Herman Research Laboratory (formerly part of the
State Electricity Commission of Victoria but now known as HRL Technology Pty Ltd)
for residual stress measurement by the hole-drilling method. The purpose being to
obtain a set of control data to compare with residual stress data obtained by other
means. The advantages and disadvantages of the technique have been described in some

8/10/2019 The Effect of Residual Stress and Crack Closure on Fatigue Crack
http://slidepdf.com/reader/full/the-effect-of-residual-stress-and-crack-closure-on-fatigue-crack 141/304
Experimental Techniques 7.29
detail in Chapter 2. The rosette strain gauge type used is illustrated in Figur
Figure 7.21.
The experimental method, data reduction and interpretation performed by Herman
Research Laboratory was in accordance with ASTM Standard Test Method E837-85
[17] and the technical note supplied by the manufacturer of the strain gauges a
instrumentation [18].
7.5.1 Calculation of the residual stress from relieved strains
The hole is drilled at small increments, and the observed strains recorded at e
increment. This enables inferences to be made regarding the uniformity of the r
stress with depth, thereby validating the use of full depth coefficients a an
calculating stresses. These coefficients have been determined by finite element
The partial-depth coefficients a and b are plotted against Z/D
0
for each value
diameter ratio, D/D„, see Figure 7.20. In principle, it is then possible to rea
coefficients for any combination of Z/D„ and D/D
(1
from these graphs, and substi
these into the equations below to give the residual stresses.
-
1
+
v
-
A = x a
2E
Equation 7.11
^ 1 r
B =
x b
2E
Equation 7.12
E, +£, . V2
min/max
4A 4B
Equation 7.13
±
T ^ ^
e
i -
e
2 / + (
/
e
2
- £ 3 ^

8/10/2019 The Effect of Residual Stress and Crack Closure on Fatigue Crack
http://slidepdf.com/reader/full/the-effect-of-residual-stress-and-crack-closure-on-fatigue-crack 142/304
Experimental Techniques 7.30
tan2a =
t«i
^t *j
T O i
£3 £1
(38)
Equation 7.14
Where:
a is
the angle between the closest principal axis and gauge 1
Ei is the strain indicated by gauge 1, £2 is the strain indicated by gauge 2 etc
Figure 7.20, Rosette strain gauge for residual stress measurement by the hole-
drilling method, to left of the gauge is a
milar
pad for connection of
the gauge leads to the instrumentation

8/10/2019 The Effect of Residual Stress and Crack Closure on Fatigue Crack
http://slidepdf.com/reader/full/the-effect-of-residual-stress-and-crack-closure-on-fatigue-crack 143/304
Experimental Techniques
7.31
—Gauge
+ D • £
k
I I
I
- Do •
Figure 7.21, Schematic representation of cross-section through strain gauge rosette
on the surface of specimen

8/10/2019 The Effect of Residual Stress and Crack Closure on Fatigue Crack
http://slidepdf.com/reader/full/the-effect-of-residual-stress-and-crack-closure-on-fatigue-crack 144/304
Experimental Techniques
7.32
REFERENCES
1. Pickard, A.C. and Hicks, M.A., "Crack Length Determination using the d.c.
Electrical P.D. Technique
-
A Comparison of Calibration Methods,"
in
dvances in
Crack Length Measurement ed. Beevers, C. J.,
(1982),
E M A S Ltd., London.
2. "Guidelines for use of electrical potential drop for crack length determi
Annex
Al
to A S T M Standard E1457-98, Standard Test Method for Measurement of
Creep Crack Growth Rates in Metals,
(1999),
A S T M , Philadelphia, P A.
3. Gilbey, D.M. and Pearson, S., "Measurement of the Length of a Central or E
Crack in a Sheet of Metal by an Electrical Resistance Method," R A E Technical
Report 66402,
(1966),
Ministry of Aviation, Farnborough.
4. Ritchie, R.O. et al, "Crack-Growth Monitoring: Optimisation of the Electri
Potential Technique Using an Analogue Method," Int. J Fract. Mech., 7,
(1971),
pp462-467.
5. Davis, F.H. and Plumbridge, W.J., "Magnetostriction Effects in Crack Lengt
Measurements," Fat. Fract. Eng. Mat. Struct,
11,
4,
(1988),
pp241-250.
6. "Standard Test Method for MEASUREMENT OF FATIGUE CRACK GROWTH
RATES," A S T M Standard E64 7
-
86a,
(1986),
A S T M , Philadelphia, P A.
7. Bastenaire, F. et al "Statistical Analysis of Fatigue Crack Growth," in
Fa
Crack Growth and Data Analysis,
A S T M ST P 738, ed. Hudak, S.J. and Bucci, R. J.,
A S T M ,
(1981),
pp
163-170.
8. Ostergaard, D.F. et al, "Effect of Aa -Increment on Calculating da/dN fro
N
Data,"
in
Fatigue
Crack Growth and Data Analysis,
A S T M STP 738, ed. Hudak,
S.J.
and
Bucci,
R.
J.,
A S T M ,
(1981),
pp
194-204.
9. Allison, J.E., "On the Measurement of Crack Closure During Fatigue Crack
Growth," in
Proceedings of ASTM 18th National Symposium on Fracture
Mechanics, A S T M , 1985.
10. "Fatigue Characteristics of Micro-Measurements Strain Gages," Measurement
Group Technical Note TN-508-1,
(1991),
Measurements Group Inc. Raleigh N C .
11. Schive, J. "Fatigue crack closure, observations and technical significanc
Proceedings of the International Symposium on Fatigue Crack Closure, 1986.
12. Hauk, V.M, and Macherauch, E., "A useful guide for X-ray stress evaluati
Advances in X ray Analysis, eds. Cohen, J.B., Russ, J.C., Leyden, D.E., Barrett,
C.S., and Predecki, P.K.,
27,
Plenum
Press,
N e w York, pp81-99.
13. Noyan, I. C. & Cohen J.B., Residual Stress: Measurement by diffraction an
interpretation,
(1987),
Springer-Verlag, N e w York.

8/10/2019 The Effect of Residual Stress and Crack Closure on Fatigue Crack
http://slidepdf.com/reader/full/the-effect-of-residual-stress-and-crack-closure-on-fatigue-crack 145/304
Experimental Techniques
7.33
14.
Howard, C. J. et al, "The Australian High Resolution Neutron Powder
Diffractometer" Aust.
J.Phys.,
(1983),
36,
pp507-18.
15. Hutchings, M. T., "Neutron diffraction of residual stress fields - the engine
dream co me true?" Neutron News, 3, No.3, (1992), ppl4-19.
16. Edwards, L. and Ozdemir, A. T. "Residual stresses at cold expanded fastener ho
in Measurement of Residual and Applied Stress Using Neutron Diffraction, ed. M .
T. Hutchings and A. D. Krawitz, 1992, Kluwer Academic Publishers, London,
pp545-553.
17. "Determining Residual Stresses by the Hole-drilling Strain-Gage Method" ASTM
Standard E837-85, A S T M , Philadelphia.
18. "Measurement of Residual Stresses by the Hole-Drilling Strain Gage Method,"
Measurements Group Technical Note TN-503-3, (1988), Measurements Group Inc.
Raleigh NC .
8/10/2019 The Effect of Residual Stress and Crack Closure on Fatigue Crack
http://slidepdf.com/reader/full/the-effect-of-residual-stress-and-crack-closure-on-fatigue-crack 146/304
Experimental Program Results 8.1
8 Experimental Program Results
The material chosen for the experimental program was a high strength low alloy
structural steel grade AB3542, low-carbon low-sulphur high-manganese, with a yield-
strength of approximately 440MPa. AB3542 is similar to British standard BS4360-50D
specification. The microstructure was characteristic of this type of material, consisting
of alternate bands of ferrite and pearlite, with inclusions concentrated in the plate cen
All the test specimens were cut from a single section of plate, from a batch designated
for the construction offshore petroleum production facilities. Bodies such as API [1] an
EEMUA* [2] publish recommended practices for pre-production qualification of these
materials. Complete details of the laboratory "heat analysis" and standard mechanical
testing data for this material are provided in Appendix A4.
8.1 As received and stress-relieved materials
Compact tension (CT) specimens were machined in T-L and L-T orientations from the
sample plate supplied by BHP. One set of specimens was prepared from material that
had been subjected to a minimum stress relieving heat treatment, see Appendix A5.
8.1.1 Residual stress state of as-received and stress relieved material
The residual stress condition of both as received and stress relieved material was
established by X-ray and neutron diffraction and by hole drilling. The resulting data ar
summarised in Table 8.1. The X-ray diffraction and hole drilling techniques are both
confined to the outer surfaces of the specimen investigated. The X-ray technique is
restricted due to the depth of penetration and the hole-drilling technique by physical
constraints; (the useful data is confined to that which can be obtained by drilling a ho
no deeper than its diameter). Neutron diffraction enabled the residual stress within the
* API - American Petroleum Institute, EEMUA - Engineering Equipment & Material Users Association

8/10/2019 The Effect of Residual Stress and Crack Closure on Fatigue Crack
http://slidepdf.com/reader/full/the-effect-of-residual-stress-and-crack-closure-on-fatigue-crack 147/304
Experimental Program Results 8.2
interior (bulk) of the specimen to be measured from a sample volume of approximately
125mnr, (a cube of edge 5mm in the centre of the plate sample).
Since the specimens were machined from plate material, it was expected that there
would be compressive residual stresses in the surfaces. The origin of these stresses
briefly explained in section 2.2. Some of the original residual stresses were proba
removed when the specimens were machined to a thickness (B) of 18.0mm from plate
originally ~20mm thick. However, both the X-ray diffraction and hole drilling resid
stress measurements confirmed that significant residual stresses remained.
8 1 1 1 Hole drilling measurements
Initially two "blank" specimens were submitted for residual stress measurement by h
drilling. Both specimens were approximately the same dimensions as the CT specimens
used for the fatigue crack growth (FCG) experiments, approximately 60mm x 62.5 mm
x 18mm (L x W x B), but were without the notch or clevis-pin holes. The position of
strain gauge rosette on the specimen is shown below in Figure 8.1.

8/10/2019 The Effect of Residual Stress and Crack Closure on Fatigue Crack
http://slidepdf.com/reader/full/the-effect-of-residual-stress-and-crack-closure-on-fatigue-crack 148/304
Experimental Program Results 8.3
62.5mm
Figure 8.1 Position of rosette strain gauge on specimen w hen performing hole-
drilling residual stress measurements on as-received and stress relieved
blank specimens.
Using the method prescribed by the gauge manufacturer [3] the residual stresses were
measured at seven discrete points (hole depths) to a depth of approximately 1.02mm
beneath the specimen surface. (Note: The "x" and "y" axes were reversed in these
experiments, compared to the X-ray and neutron diffraction work where the "y" axis
refers to the direction perpendicular to the crack plane).
The results for the blank specimens, in the as-received and heat-treated conditions
respectively, are shown in detail in Table 8.1 and Table 8.2 and graphically in Figure
8.2 and Figure 8.3. The data appeared to indicate that the surfaces of both specimens
were in a state of biaxial compressive stress. The results of the hole-drilling residual
stresses do not appear to show any significant difference in the residual stress conditi
of the as-received and stress relieved material.
8.1.1.2 X-ray diffraction measurements
The X-ray diffraction measurements were performed under the conditions described in
section 6.3.3. A minimal amount of surface material was removed by electro-polishing,

8/10/2019 The Effect of Residual Stress and Crack Closure on Fatigue Crack
http://slidepdf.com/reader/full/the-effect-of-residual-stress-and-crack-closure-on-fatigue-crack 149/304
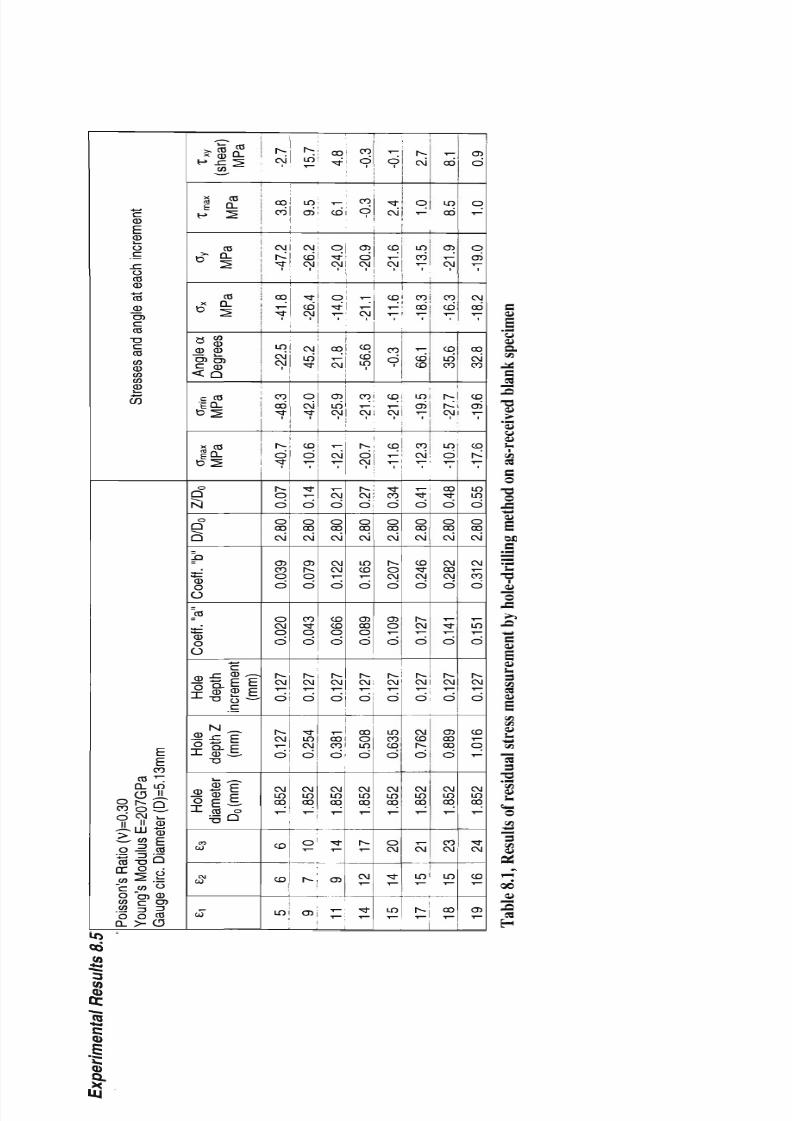
8/10/2019 The Effect of Residual Stress and Crack Closure on Fatigue Crack
http://slidepdf.com/reader/full/the-effect-of-residual-stress-and-crack-closure-on-fatigue-crack 150/304
c
CD
E
CD
c
u
CO
CD
4-^
CO
_CD
CO
c
CO
T3
C
CO
CO
CD
CO
O
CD
_
CO
CO
CL
y.
s
**-
CO
o
C M
II
"
> CO
o-2
a
t
i
M
o
d
u
c w
8 °>
52 c
2
o o
E
E
CO
LO
II
Q
CD
CD
E
CO
b
6
O
CD
CO
CO
Q- > CD
^^
x CD °-
H
* 5
S
>
'
I S
CO
< * * £
CO
*
1
a co
° CD
JS CD
O cb
C
CD
< Q
c
CO
10-
0 2
s *
iS=
0 2
o
Q
Nl
o
Q
Q
JD
*CD
O
o
"co
"55
o
O
_,
c
^^ |-E;
-*-
T3
o ~^
C
-—
'
-3>x:
p
-a
^ ,^
CD
p
-92 53 F
X cO o
*5Q
m
00
CVJ
CO
w
I
s
-
CM
1
CO
CO
CM
I
s
-'
• *
1
CO
yl
y?
LO
CM
CM
i
CO
00
1*
I
s
-
d
"*
I
s
-
o
d
o
00
cvi
CJ>
CO
o
d
o
CM
o
d
I
s
-
CM
d
I
s
-
CM
s
CM
LO
00
CD
CO
LO
I
s
-
LO
«?
O0
CM
CO-
CM
'
r
CD
CM
CM
LO
• *
o
CM
1
CD
d
1
• *
T -
d
o
00
cvi
CD
I
s
-
o
d
CO
•sl-
o
d
r--
CM
d
• > *
LO
CM
d
CM
LO
00
o
T —
I
s
-
CD
oo
^
CO
O
• *
CM
1
O
r
T ~
00
,-.:
CM
CJ)
LO
CM
1
_
CM
i
,_
CM
d
o
CO
CM
CM
CM
-i—
d
CO
CO
o
d
I
s
-
CM
d
CO
CO
d
CM
LO
CO
"3-
,—
OO
• " -
CO
d
i
CO
d
CD
d
CM
1
•r -
yl
CM
CO
CO
LO
i
CO
CM
1
I
s
-
d
CM
1
I
s
-
CM
d
o
CO
CM
LO
CO
T -
d
CD
OO
o
d
I
s
-
CM
.
o
oo
o
O
d
CM
LO
00
I
s
-
CM
• *
T -
d
1
•*t
cvi
CO
yl
CM
1
CD
yl
y
CO
d
CO
CM
i
CO
y 1
^
TT
CO
d
0
00
CM*
I
s
-
0
CM
d
O0
0
1 —
d
I
s
-
CM
d
LO
CO
CD
d
CM
LO
00
0
CM
• « -
LO
I
s
-
CM
q
'-
LO
CO
1 —
1
CO
CO
T ~
y
CD
CO
LO
ai
CO
CM
"
7
,_
•sf
d
0
00
CM
CO
• *
CM
d
I
s
-
CM
y—
d
I
s
-
CM
d
CM
CO
I
s
-
d
CM
LO
CO
,_
CM
LO
I
s
-
T
_
00
LO
06
CD
T-:
CM
'
CO
CO*
T —
CO
LO
CO
I
s
-
N*
CVI
IO
d
1
00
• *
d
0
00
cvi
CM
00
CM
d
• t
y—
d
I
s
-
CM
d
00
00
00
d
CM
LO
00
CO
CM
LO
00
CO
d
0
y
1
0
CD
1 —
1
CM
00
y—
00
cvi
CO
CD
ai
1
CO
I
s
-*
I
LO
LO
d
0
00
CM*
CM
• ^ -
CO
d
LO
T —
d
I
s
-
CM
d
CO
T ~
q
^
CM
LO
OO
• *
CM
CO
ao

8/10/2019 The Effect of Residual Stress and Crack Closure on Fatigue Crack
http://slidepdf.com/reader/full/the-effect-of-residual-stress-and-crack-closure-on-fatigue-crack 151/304
X
>,
*"
g g «
C t CD
s D) r:
w 'co CO
HI
to
CO
3
(0
OJ
CC
B
c
Q)
.|
QJ
CM
E
E
CD
O
(0
3
(0
E
o
a
CD
o
o
X
o
CO
o
LO
o o
CO
o
CM
o o
i- CM
O
CO
O
O
LO
O
CD
(edlAl) ssajis
e
cu
eu
cu
CB
c
13
cu
,>
33
u
cu
s-
Cfl
rt
s-
•*->
cu
E
cu
s-
cu
e
a
cu
•a
i
"3
CA
>•
CA
cu
u
CA
3
cu
OC
CU
S -
3
WO

8/10/2019 The Effect of Residual Stress and Crack Closure on Fatigue Crack
http://slidepdf.com/reader/full/the-effect-of-residual-stress-and-crack-closure-on-fatigue-crack 152/304
c
cu
CJ
cu
a
CA
s
rt
-a
>
cn
cn
cu
u
T-'
i- &n
3
O
IS
o
-3
c
CD
E
D
i_
O
£.
_C
O
CO
CD
*-
CO
D
"cb
c
CO
T3
c
CO
CO
CD
CO
O
CD
CO
CO
0_
CD
CO o
d
CM
> CO
o
-2
y
3
CO TJ
CC o
co -==
C W
O CO
<2 <=
.2 =>
o o
E
E
CO
LO
Jl
Q
CD
CD
£
O
b
d
o
CD
CO
CO
a.
> U
_
»*r?
H
|
S
I £
H 2
CO
<*
1
CO
tf I
a
m
°
CD
CD CDO cb
C 0
< Q
c
CO
10-
0 2
s
co
lo
os
o
Q
N
o
Q
Q
JD
"cD
o
O
jB
"ao
o
O
*-*
c
c
•~•
0*5.1
X 0 .3,
u.
^_^
.2
P
®
0)
|
o ES
X
cO
o
T J O
CO
CJ
CM
OJ
CO
I
s
-
^
LO
00
CO
CM
LO
LO
d
CO
CM
d
•
o
CO
LO
1
q
CO
CO
1
I
s
-
o
d
o
00
CM
ao
CO
q
d
o
CM
q
d
I
s
-
CM
O
I
s
-
CM
d
CM
LO
00
I
s
-
co
rt
I
s
-
cvi
q
T-"
ao
rr
CVI
CM
d
CVI
rr
rt
CM
T -
d
CM
1
q
d
i
rt
d
o
00
CM
ao
I
s
-
o
d
CO
rt
o
d
I
s
-
CM
O
rt
LO
CM
d
CM
LO
oo
T —
T —
ao
I
s
-
y
LO*
q
T-"
1 —
d
CM
CD
d
CM
rf
d
rt
rt
T-:
CO
i
°i
T- -
C\J
1
,_
^
o
o
CO
CM
CM
CM
y—
d
CO
CO
o
d
I
s
-
CM
O
,_
00
CO
d
CM
LO
00
LO
CM
^z
y
o
CM
d
i
00
d
CM
T —
,~:
CM
I
s
-
d
I
s
-
-r-
- -"
CM
1
CO
d
CM
1
I
s
-
<"N
o
o
00
cvi
LO
CO
y—
d
ao
CO
o
d
I
s
-
CM
O
CO
O
LO
d
CM
LO
00
00
T —
LO
rr
LO
cvi
rt
d
00
CM
CM
00
h-
-
y
CO
Cvi
CM
oo
d
CM
00
d
l
rt
CO
d
o
CO
CM
I
s
-
o
CM
d
CD
o
—
d
I
s
-
CM
o
LO
CO
CO
d
CM
LO
00
T —
CM
I
s
-
co
LO
CO
d
CO
I
s
-"
CM
rt
r
CM
rt
rt
rt
CO
cvi
CO
rt
cvi
CM
•
,_
rt
d
o
00
cvi
CO
rt
CM
d
I
s
-
CM
1 —
d
I
s
-
CM
o
CM
CO
I
s
-
d
CM
LO
CO
rt
OJ
CD
ao
ao
rt
1
CO
i
CO
d
1 —
CO
LO
y
LO
d
rt
i
q
y
CM
CM
y
1
00
rt
d
o
00
CM
CM
00
CM
d
rt
1 —
d
I
s
-
CM
O
CD
00
00
d
CM
LO
OO
LO
CM
CM
O
CM
q
d
CO
d
o
d
CM
1
CM
d
T —
05
CM
rt
1 -
d
CM
1
o
rt
t
LO
LO
d
o
CO
CM
CM
T —
CO
d
LO
T
-
d
r
CM
O
CO
T —
q
T
~
CM
LO
00
CD
CM
CM
CM
CU
s
3
•-
•
"o
.y.
.3
3
CU
CU
3
cn
rt
cu
cn
cn
cu
•-
cn
"rt
3
T3
cn
cu
u
CM
O
3
cn
cu
yi
Q0
s
rt
H
N .
CO
3
«>
QJ
DC
S
C
S

8/10/2019 The Effect of Residual Stress and Crack Closure on Fatigue Crack
http://slidepdf.com/reader/full/the-effect-of-residual-stress-and-crack-closure-on-fatigue-crack 153/304
X >s x *
s
s
S
h
e
a
r
+ H
CO
CO
fi
3
(0
o
oc
s
c
I
tu
CM
O
CO
o
LO
o
rt
O
CO
O
CM
— i —
o
E
E
o
o
to
l_
3
(A
E
o
*-•
CL
CD
XI
fl)
o
I
-e-r
o
CM
O
CO
o
rf
O
LO
o
CO
(BdlAl) SS3JJS
3
CJ
cu
cn
3
rt
3
-3
cu
S*
.2-
"3
s-
CA
CA
CU
u
u
a
• * - »
3
cu
s
cu
s-
u
3
cu
-a
y~
•
cn
>
CA
CA
CU
u
rt
3
cu
•v
90
CU
IM

8/10/2019 The Effect of Residual Stress and Crack Closure on Fatigue Crack
http://slidepdf.com/reader/full/the-effect-of-residual-stress-and-crack-closure-on-fatigue-crack 154/304

8/10/2019 The Effect of Residual Stress and Crack Closure on Fatigue Crack
http://slidepdf.com/reader/full/the-effect-of-residual-stress-and-crack-closure-on-fatigue-crack 155/304
Experimental Results 8 10
measurements, for as-received material and stress relieved material, is shown below in
Table 8.4.
Stress = - 13 4 ± 4 P = -1 32 N = - 13 7 MPa
156.0 i—
<
—i—
<
—r-
• i i
i i i
i i
155.9
CD
CN
155.8
155.7
0.0
;f-
' • •
0.1
0.2 0.3
sin
2
\|/
. ^ ~ i '
0.4 0.5
Figure 8.5, Position of {211} Bragg reflections of
Cu-K
ra
radiation, from as-received
specimen, (29) vs. sin
2
\|/, for
all
ten values of \|/
Scan#
As received 1
2
3
Mean
Stress relieved
1
2
3
Mean
Parallel to
rolling
direction
X
-131
-133
-137
-134MPa
-55
-75
-63
-66MPa
Across to
rolling
direction
Y
-87
-111
-115
-104MPa
-30
-24
-33
-29MPa
Table 8.4, S u m m a r y of X-ray residual stress measurement results for as received
and stress relieved materials using the sin
2
\|/ technique.

8/10/2019 The Effect of Residual Stress and Crack Closure on Fatigue Crack
http://slidepdf.com/reader/full/the-effect-of-residual-stress-and-crack-closure-on-fatigue-crack 156/304
Experimental Results
8 11
8 1 1 3 Neutron diffraction measurements
The number of measurements of residual stress by neutron diffraction was severely
constrained by the limited amount of "beam-time" available within the operating
schedule of the HIFAR reactor. However, the limited amount of data collected was
complimentary to that generated by the hole-drilling and X-ray diffraction experiments.
The first group of neutron diffraction experiments incorporated several tests to establi
the most suitable specimen and shielding configuration. These tests also measured the
relative attenuation of the sample material for comparison with published values. This
was accomplished by placing various combinations of specimen and shielding in the
beam path and recording the number of counts over a fixed time. The final
configuration is shown in Figure 8.6 below.
Boroflex
Neutron j
)eam
v
\
Cd
i"
foil
c
CD
T
CD
Q.
C/D
5mm
Boroflex
aperture
2nd Boroflex shield
prevents any stray
neutrons reaching
the
detector
Detector
(Not to scale)
Figure 8.6, Final specimen and shielding configuration used in neutron diffraction
experiments to define beam path accurately.

8/10/2019 The Effect of Residual Stress and Crack Closure on Fatigue Crack
http://slidepdf.com/reader/full/the-effect-of-residual-stress-and-crack-closure-on-fatigue-crack 157/304
Experimental Results
8 12
The attenuation of the beam was calculated from the equation:
1= Io-e"^
Equation 8.1
Where:
Io = incident beam intensity = number of counts without sample
I = output beam intensity = number of counts with sample in place
\i
= linear absorption coefficient
t = thickness
Bacon [4] defines the linear absorption coefficient from a component using:
H =
P X
V
w
;
Equation 8.2
Where:
LL
— = mass absorption coefficient
P
Wj = proportion by weight
p = density
The linear absorption coefficient only takes account of scattering by the specimen, an
does not include "attenuation by scattering", which produces apparent or effective
"absorption".
The published [4] theoretical value for iron (Fe) is u=l. 1617cm"
1
. The value calculate
for the specimen material (steel) from the experiment using the HRPD was
|i= 1.1525cm"
1
. This indicated that the HRPD's detector and associated instrumentation
was functioning correctly.

8/10/2019 The Effect of Residual Stress and Crack Closure on Fatigue Crack
http://slidepdf.com/reader/full/the-effect-of-residual-stress-and-crack-closure-on-fatigue-crack 158/304
xperimental Results
8 13
Since the specimen material consisted of rolled steel
plate,
a highly textured material,
the {3 10} reflection was initially selected. The use of such high mult
some benefits, in terms of resolution, explained by Noyan and Cohen [5]
Lambrineas et al [6]. However, these are offset by the low intensity of
angle (29) reflections. This would have required very long experiments
instrument with limited availability for this work. Hence, the {2 1 1}
selected for the later experiments as a compromise, required to accommo
minimum number of measurements within the beam time available at HIFAR.
1} reflection was expected to give residual stress data with an uncerta
Using the stress-strain relationships described at 6.4.4 the bulk resi
the interiors of an as-received specimen and of a stress-relieved speci
calculated. The sample volume in each case was approximately 125mm
3
in
the specimen. Macroscopic values of Poisson's ratio (D) and Young's mo
used: D=0.29, E=206.9GPa. The value of do used was obtained from a "fully
relieved" specimen, see Appendix A5.2.
As received specimen
Stress
relieved specimen
Residual
stress ±15MPa
v
+84MPa
-4MPa
Table 8.5, Residual stresses in the centre of as received and stress relieved
specimens (parallel to the rolling direction) determined by neutron
diffraction from {3
10}
planes, (relative to fully stress relieved
specimen).
An accuracy
of
±0.01"
in the
measurement
of \\f
corresponds
to an
error
of
± 1 5 M P a
in the
mean
residual stress over the volume sampled.

8/10/2019 The Effect of Residual Stress and Crack Closure on Fatigue Crack
http://slidepdf.com/reader/full/the-effect-of-residual-stress-and-crack-closure-on-fatigue-crack 159/304
Experimental Results
8 14
If unlimited instrument time had been available the "sin V technique, as described
by
Lambrineas et al [6], would have been used. That technique has the particular advantag
of not requiring a value for the unstressed lattice parameter (do). However, since the
specimen was relatively thick, (18mm compared to 4mm for Lambrineas et al), each
stress measurement would have taken approximately 54 hours compared to
approximately 7 hours for each measurement with the method used for this work.
8.1.2 Constant load (AK increasing) fatigue crack growth experiments
A series of constant-load amplitude (AP) fatigue crack growth experiments were
undertaken, for both as received material and stress relieved material, at R (load) r
of 0.1 and 0.5 and in both T-L and L-T specimen orientations. The experimental matrix
for the constant load tests is shown in Table 8.6 below. An example of the typical
fatigue loading sequence is shown in Figure 8.7.
Specimen condition
As received
As received
As received
As received
Stress relieved
Stress relieved
Stress relieved
Stress relieved
Specimen orientation
T-L
T-L
L-T
L-T
T-L
T-L
L-T
L-T
• t"min-"maxj
0.1
0.5
0.1
0.5
0.1
0.5
0.1
0.5
Table
8.6,
Conditions for constant load fatigue crack growth experiments

8/10/2019 The Effect of Residual Stress and Crack Closure on Fatigue Crack
http://slidepdf.com/reader/full/the-effect-of-residual-stress-and-crack-closure-on-fatigue-crack 160/304

8/10/2019 The Effect of Residual Stress and Crack Closure on Fatigue Crack
http://slidepdf.com/reader/full/the-effect-of-residual-stress-and-crack-closure-on-fatigue-crack 161/304
Experimental Results 8 16
Linear regression analysis of the
F C G
data collected allowed formal estimates of AK
t h
(at R=0.5), and calculation of constants "C" and "m" from the Paris equation,
da
(
— =
C ( A K )
m
) which are listed below in Table 8.7, and Table 8.8 respectively.
Specimen
condition
As received
As received
Stress relieved
Stress relieved
Specimen
orientation
T-L
L-T
T-L
L-T
A K
t h
v
6.0 MPaVm
6.5 MPaVm
5.5 MPaVm
5.7
MPaVm
Table 8.7, Effect of specimen orientation
a nd
heat treatment condition
on
fatigue
threshold of the chosen specimen material
(R=0.5).
Specimen
condition
As received
As received
As received
As received
Stress relieved
Stress relieved
Stress relieved
Stress relieved
Specimen
orientation
T-L
T-L
L-T
L-T
T-L
T-L
L-T
L-T
R
0.1
0.5
0.1
0.5
0.1
0.5
0.1
0.5
m
2.26
3.30
2.62
3.50
3.45
3.02
2.95
3.18
C
2.66
x 10
2.75
x
10'
2
9.79
x
10 '
2
1.42 x 10'
2
1.45
x
IO '
2
5.88
x
IO'
2
4.76
x 10 '
2
3.98
x
10'
2
Table 8.8, Paris equation constants C
a n d m
(derived
by
linear regression
of
logdog
F C G vs. A K
data) from constant load crack growth
experiments.
V
For the purposes of this set of experiments the fatigue threshold
A K
l h
will
be
defined as the
A K
L
at
which
the F C G rate
is less
than
10
<J
m/cycle.

8/10/2019 The Effect of Residual Stress and Crack Closure on Fatigue Crack
http://slidepdf.com/reader/full/the-effect-of-residual-stress-and-crack-closure-on-fatigue-crack 162/304
Experimental Results
8 17
Ex am in at io n of fracture surfaces revealed that the shap e (curvature) of crack fronts, as
indicated by the crack tip and beach-marks, was noticeably different in the case of the
as-received material and the stress relieved material respectively. Despite the significa
residual stresses that were measured, the crack fronts in both as-received specimens and
the stress relieved specimens were relatively straight. There was little tendency for the
crack to "lag behind" at the side of the specimen, see Figure 8.14 and Figure 8.15.

8/10/2019 The Effect of Residual Stress and Crack Closure on Fatigue Crack
http://slidepdf.com/reader/full/the-effect-of-residual-stress-and-crack-closure-on-fatigue-crack 163/304

8/10/2019 The Effect of Residual Stress and Crack Closure on Fatigue Crack
http://slidepdf.com/reader/full/the-effect-of-residual-stress-and-crack-closure-on-fatigue-crack 164/304

8/10/2019 The Effect of Residual Stress and Crack Closure on Fatigue Crack
http://slidepdf.com/reader/full/the-effect-of-residual-stress-and-crack-closure-on-fatigue-crack 165/304
X X
o o
II II
DC CC
+ •
1
1
L
1
_
_B
1
— i
1
b_
TL
1
"
1
L
-J 0
LO
CO
CO
CO*
oo
00
CM
f-
C\l
(M
CO
CV
E
CO
Q.
2
<
C
OJ
oo
m
in
co co
03
o
CN
CM
(9|oAo/ui - NP/ep)
u|
©
II
Py
rt
y\
°b
CU
rt
13
cu
i>
.-
"cu
b
[A
CA
CU
b
CA
b
a
CA
a
"S3
a
*b
O
I
H
13
a
rt
H
a
CA
CU
-4-"
rt
b
o
u
fa
bH
©
a
o
CA
*b
rt
©
3
co
3
SP
oc
s
c
QJ
.§
v.
QJ
00
cu
b
fa

8/10/2019 The Effect of Residual Stress and Crack Closure on Fatigue Crack
http://slidepdf.com/reader/full/the-effect-of-residual-stress-and-crack-closure-on-fatigue-crack 166/304
ii
- i i -
^ JJ
-4 X
1
r ^ j '
1
i ^ > f i / —
r
L
1
,
3(R0
**>
_
1
r
^ B r
,
r
X
in
co
CO
CO
CO
O)
C\j
cvi
E
CO
Q.
u, ^
CM* I
_l
^ C
CM
—
CM
O)
LO
io
CO
CO O)
o
CM
CM
(eioAo/ui
-
NP/ep)
u|
©
II
tt
• * - >
rt
[rt
*b
rt
13
cu
>•
CJ
• *N
— I
CJ
b
CA
CA
CU
b
«2
CA
8
©
"S3
rt
a
.2-
*b
O
H
13
a
rt
H
a
CA
rt
b
o
u
fa
©
a
o
CA
.y*
b
rt
a
&
o
U
CM
CO
•8
3
SP
oc
3
c
QJ
I
QJ
X
CU
b

8/10/2019 The Effect of Residual Stress and Crack Closure on Fatigue Crack
http://slidepdf.com/reader/full/the-effect-of-residual-stress-and-crack-closure-on-fatigue-crack 167/304
d
CD
OT
<
-»—
Q
H
_i
X
d
CD
CO
<
r
O
1
l
h
1
•
,
:
,
JL 1 L
k
T i — - f
IO <D
LN-
00 0
i
•
i i
D C
0
• •
3 i-
J CM
i
IO
CO
CO
CO
(apAo/iu - NP/ep)
u|
rt
"rt
CO
(T)
CM
h-
Ol
in
cvi
CO
CM
,_
CM
05
N;
in
__
E
-?-
(0
0.
2
_l
c
CJ
rt
£
-a
u
"3
CJ
CU
b
i
CA
t
b
£
CA
a
+ J
a
a
cu
b
O
H
T3
a
t
H
a
CA
CU
«
b
o
u
a
o
a
©
CA
b
«
1
O
U
X
cu
b
CO
fi
3
"fl
QJ
oc
s
c
QJ
.g
b.
QJ
ft
y+
fa

8/10/2019 The Effect of Residual Stress and Crack Closure on Fatigue Crack
http://slidepdf.com/reader/full/the-effect-of-residual-stress-and-crack-closure-on-fatigue-crack 168/304
d
to
OT
<
m
2
_i
±
•
d
CD
CO
<
n
1
\-
_i
•
io
CO*
00
CO
CO
LO
C\i
CO
CM C
CM
O)
LO
(apAo/ui - NP/ep)
u|
CJ
.1
S3
bH
b
cu
JO
rt
ex
,e
"S3
rt
CJ
©
II
->
rt
"rt
b
CU
OO
CM
c\i
/
—
s
E
CO
cu
'3
CJ
cu
b
A
rt
b
o
A
a
"S3
rt a
a S
M -y~
•« ccj
b ••-
o a
b
H
°
J^
fa
***'
-
c
a
—
— < y-
c« a
CJ CJ
rt
b
o
u
fa
CA
a
cu
s
3
cu
a
CA
§ ©
°£
b 2
rt o
ax
a tt
s?
CM
cd
fi
3
"fl
QJ
oc
3
c
QJ
X
CU
b
So
fa
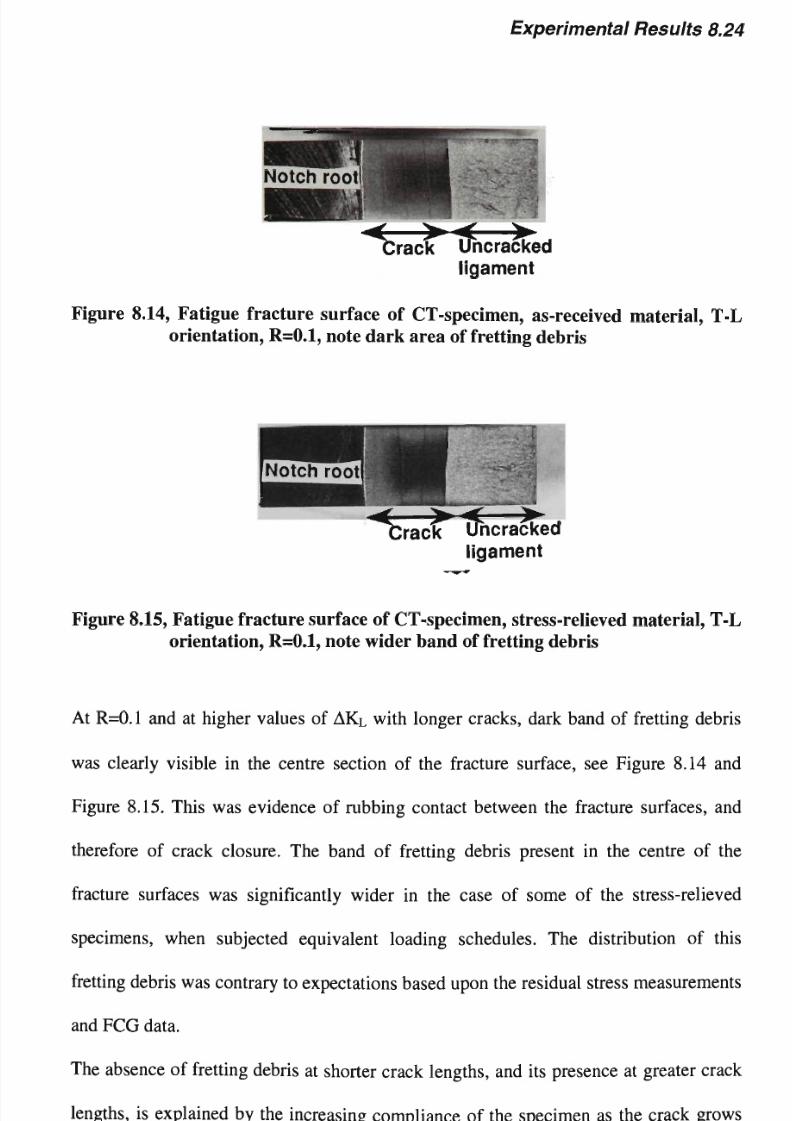
8/10/2019 The Effect of Residual Stress and Crack Closure on Fatigue Crack
http://slidepdf.com/reader/full/the-effect-of-residual-stress-and-crack-closure-on-fatigue-crack 169/304
Experimental Results 8.24
Figure 8.14, Fatigue fracture surface of CT-specimen, as-received material, T-L
orientation,
R=0.1,
note dark area of fretting debris
Figure 8.15, Fatigue fracture surface of CT-specimen, stress-relieved material, T-L
orientation, R=0.1, note wider band of fretting debris
At R=0.1 and at higher values of AK
L
with longer cracks, dark band of fretting debris
was clearly visible in the centre section of the fracture surface, see Figure 8.14 a
Figure 8.15. This was evidence of rubbing contact between the fracture surfaces, and
therefore of crack closure. The band of fretting debris present in the centre of the
fracture surfaces was significantly wider in the case of some of the stress-relieved
specimens, when subjected equivalent loading schedules. The distribution of this
fretting debris was contrary to expectations based upon the residual stress measure
and FCG data.
The absence of fretting debris at shorter crack lengths, and its presence at greater
lengths, is explained by the increasing compliance of the specimen as the crack grow
under otherwise similar conditions of R and AK
L
. It appears likely that in-plane and

8/10/2019 The Effect of Residual Stress and Crack Closure on Fatigue Crack
http://slidepdf.com/reader/full/the-effect-of-residual-stress-and-crack-closure-on-fatigue-crack 170/304

8/10/2019 The Effect of Residual Stress and Crack Closure on Fatigue Crack
http://slidepdf.com/reader/full/the-effect-of-residual-stress-and-crack-closure-on-fatigue-crack 171/304
Experimental Results 8.26
closure effect measured was not simply a function of m a x i m u m plastic zone
size.
However, the crack closure data do show that (for positive load ratios) the crack closu
effect becomes less important as AK increases. Likewise, when Ko
P
is compared at
similar crack lengths over a range of K
L
,
m
ax, no clear trend is apparent, although the
number of data points is small. Some workers have reported that there is a tendency for
Ko
P
to increase with crack length initially and then fall. The data in Table 8.9 appear
agree with this.

8/10/2019 The Effect of Residual Stress and Crack Closure on Fatigue Crack
http://slidepdf.com/reader/full/the-effect-of-residual-stress-and-crack-closure-on-fatigue-crack 172/304
Experimental Results
8.27
N
s
i
n
t
e
n
s
i
t
y
a
A
K
L
14MPaVm
16MPaVm
18.5MPaVm
21MPaVm
22MPaVm
L
R
0.10
0.10
0.10
0.05
0.10
xT
•y^
(00
G
JJ
-4
CJ
U
0.30
0.40
0.50
0.60
0.30
0.40
0.50
0.60
0.40
0.50
0.60
0.30
0.35
0.40
0.50
0.55
0.60
0.30
0.35
0.40
0.45
0.50
0.55
0.60
M
a
x
i
m
u
m
s
i
K
,
15.7
15.8
16.1
15.8
18.0
18.5
18.5
19.5
20.5
20.8
21.0
22.2
24.2
22.6
22.2
22.6
22.1
24.6
24.6
24.3
24.5
24.5
24.6
24.8
C
s
t
r
e
s
s
i
n
t
e
n
s
i
t
y
,
2.0
3.3
3.8
2.9
2.5
2.6
2.0
2.1
2.1
2.5
2.4
3.5
3.3
3.7
2.9
2.8
3.0
2.1
2.9
3.3
3.7
3.4
2.3
2.0
C
r
o
w
t
h
a
t
e
,
d
a
/
d
N
9.96xl0~
9
9.03xl0~
9
8.95xl0~
9
8.96xl0~
9
1.82x10*
1.41x10"*
1.46x10*
1.39x10*
2.10x10-*
2.51x10"*
2.71x10"*
1.13xl0"
7
1.33xl0"
7
4.11x10"*
3.82x10"*
3.77x10"*
3.40x10*
5.41x10*
7.34x10"*
5.57x10"*
5.34x10"*
5.18x10"*
5.15x10"*
4.80x10*
E
s
i
n
t
e
n
s
i
t
y
A
13.7
12.5
12.3
12.9
15.5
15.9
16.5
17.4
18.4
18.3
18.6
19.7
20.9
18.9
19.3
19.8
19.1
22.1
21.7
21.0
20.8
21.1
22.1
22.3
Table 8.9, Crack opening stress intensities and F C G rates resulting from
"constant" A K
L
at low R ratio for as received material (L-T specimen
orientation), a =
effective crack length,
W =
specimen width.
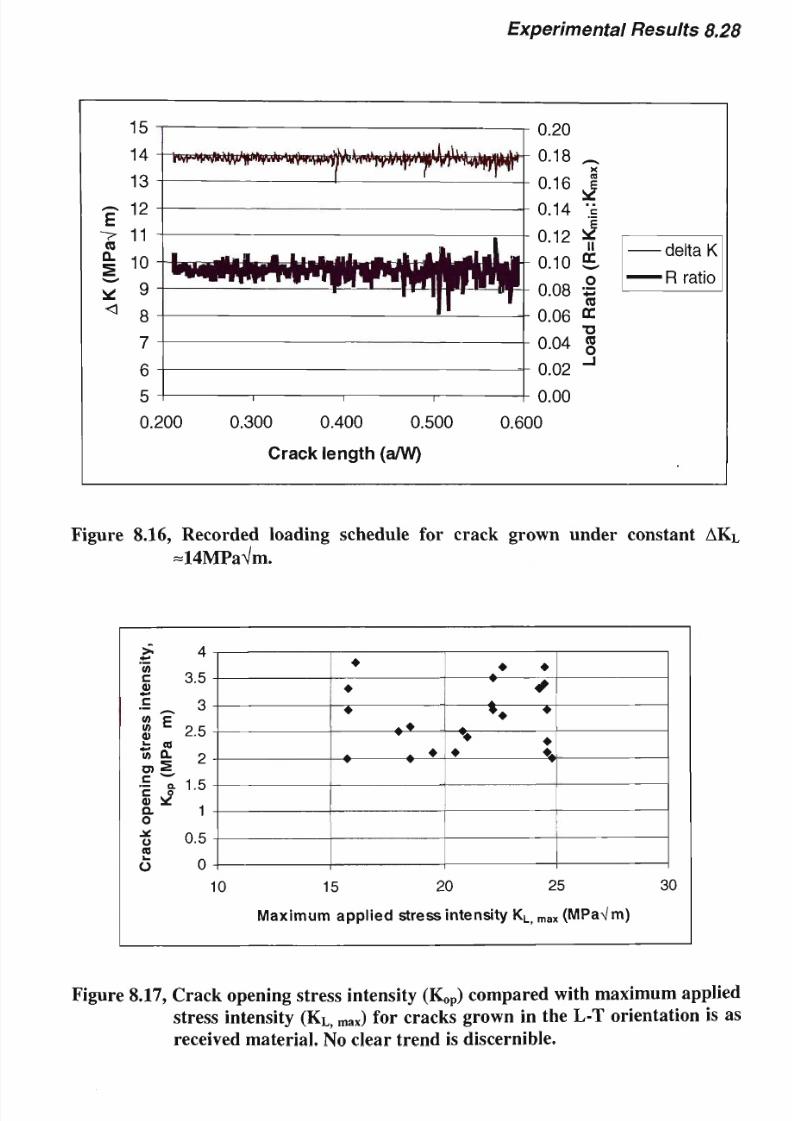
8/10/2019 The Effect of Residual Stress and Crack Closure on Fatigue Crack
http://slidepdf.com/reader/full/the-effect-of-residual-stress-and-crack-closure-on-fatigue-crack 173/304
Experimental Results 8 28
CO
Q.
0.300 0.400 0.500
Crack length (a/W)
0.600
Figure 8.16, Recorded loading schedule
for
crack grown under constant AKL
=14MPaVm.
n
c
0)
CO c
(0
c
o
*-
CU
(0 Q-
c
5 *°
Q.
O
o
CD
U
4
3.5
3
2.5
2
1.5
1
0.5
0
• • •
^ <T
— • * — * •
•
y^±
10
15 20 25 30
Maximum applied stress intensity K
L
,
ma
x (MPaVm)
Figure 8.17, Crack opening
stress
intensity
(Ko
P
)
compared with ma ximum applied
stress intensity (K
L)
max)
for cracks grown in the L-T orientation
is
as
received material. No clear trend is discernible.

8/10/2019 The Effect of Residual Stress and Crack Closure on Fatigue Crack
http://slidepdf.com/reader/full/the-effect-of-residual-stress-and-crack-closure-on-fatigue-crack 174/304
Experimental Results
8 29
1.00E-07
o
u
£, 1.00E-08
z
TJ
1.00E-09
^.
»•
*
•
«r»
4
4*
^"¥
•
10
AKe,, (MPaVm)
100
Figure 8.18,
F C G
rate (da/dN) as
a
function of effective stress intensity (AKeff) for
cracks grown at constant A K
L
, (14MP aVm A K
L
21
M P a V m ) .
W h e n the data from the constant
A K
L
F C G
tests
was used to graph F C G
rate
vs.
AKeff, a
strong positive correlation was found, see Figure 8.18. At higher values of AK
L
and
higher R ratios KL, min is clearly greater than Ko
P
. This confirms that the closure
effectively avoided during the earlier set of FCG experiments with AK increasing and
R=0.5. It is reasonable to attribute the difference between crack growth rates at l
and higher R-values, at the same AK, to crack closure effects and residual stresses.
was supported when FCG rates, in the same specimen condition and crack plane
orientation, for AK
L
increasing conditions at R=0.5 were compared with those for the
constant AK
L
conditions at R=0.1, see Figure 8.19. As expected, AKe
ff
had the effect
normalising the fatigue data.

8/10/2019 The Effect of Residual Stress and Crack Closure on Fatigue Crack
http://slidepdf.com/reader/full/the-effect-of-residual-stress-and-crack-closure-on-fatigue-crack 175/304
Experimental Results 8 30
1 00E-06 -i
o
1.00E-07
-
o
E
z
3> 1.00E-08
TJ
1 nnp no
- F ^
• K increasing
• Constant K
i.
uuc -uy
10 100
A
K (MPaVm)
Figure 8.19,
F C G
rate vs.
AKeff,
comparison
of
results
of
crack grown
at
R=0.5
under A K L increasing conditions with several cracks grown
at
R=0.1
and R=0.05
and
constant A K L -
A H the
results were generated from
specimens in the L-T orientation with material in as-received
condition.
During the crack-closure measurements, it
was
noted that the
BFS
gauge indicated
a
residual strain at zero load that increased with crack length. The strain met
at the start of each test prior to the crack being grown. This residual strai
with crack length, and was indicative of a small amount of permanent deformat
occurred under otherwise elastic loading conditions because of the crack-tip
deformation. The residual BFS increased with crack length and with K
L
,
m
ax, se
8.20. When the residual back face strain was compared with the ratio of the
corresponding theoretical maximum plastic zone size* (r
p
,
max
), due to the prev
applied load at the relevant crack length, to the size of the uncracked ligame
The relationship was almost linear, see Figure 8.21. These residual strains w
1
Fo r plane strain r
n
=
p
6K
'IO
V
y
J
(see 3.3.1 Plasticity ind uc ed closure)

8/10/2019 The Effect of Residual Stress and Crack Closure on Fatigue Crack
http://slidepdf.com/reader/full/the-effect-of-residual-stress-and-crack-closure-on-fatigue-crack 176/304

8/10/2019 The Effect of Residual Stress and Crack Closure on Fatigue Crack
http://slidepdf.com/reader/full/the-effect-of-residual-stress-and-crack-closure-on-fatigue-crack 177/304
Experimental
Results
8 32
'5
a>
>
'5
n
4)
a
E
o
O
a>
CO
LL
m
80 -
70 -
60 -
50 -
40 -
30 -
20 -
10
-
0
-
•
•
•
• • •
••••
•
•
1 —r~
•
•
•
•
•
•
—
T
•
T"
•
0.000 0.002 0.004 0.006
r
p
,
m
ax/(W-a)
0.008 0.010
Figure 8.21, Residual BFS vs. ratio of ma xim um plane strain plastic zone size
(rp,max) to uncracked ligament, cracks grown at R=0.1

8/10/2019 The Effect of Residual Stress and Crack Closure on Fatigue Crack
http://slidepdf.com/reader/full/the-effect-of-residual-stress-and-crack-closure-on-fatigue-crack 178/304
Experimental Results 8 33
8.2 Effect of residual stresses introduced by deliberate overloading
Several specimens were subjected to deliberate overloads. These loads were sufficient
to generate a small amount of plastic deformation ahead of the notch. This
inhomogeneous deformation generated large residual stresses when the specimens were
unloaded. These residual stresses were evaluated by X-ray diffraction and by hole
drilling measurements. Where possible fatigue cracks were then grown through these
residual stress fields under constant AKL conditions. The tests were interrupted at
predetermined intervals to perform crack closure measurements.
8.2.1 Application of overloads
The CT specimens used had the same dimensions as those used for the other
experiments. The tensile overloads were applied using the same pin and clevis grips as
was used for the FCG experiments. The compressive overloads were applied using a
500kN capacity servo-hydraulic testing machine.
The specimens were monitored during the application of the overloads using strain
gauges. The procedure by which overloads were applied to the CT specimens is
described fully in Appendix A6.
8.2.1.1 Specimens overloaded in compression
When the compressive load (up to 275kN) was applied, the material immediately in
front of the notch tip was plastically deformed. On removal of the compressive load the
back face of the specimen was in tension (=160ue), as indicated by the strain gauges.
This implied that the material in front of the notch tip would also be in tension, and t
these tensile stresses would have been balanced by a compressive stress field in
between, see Figure 8.22 (a).
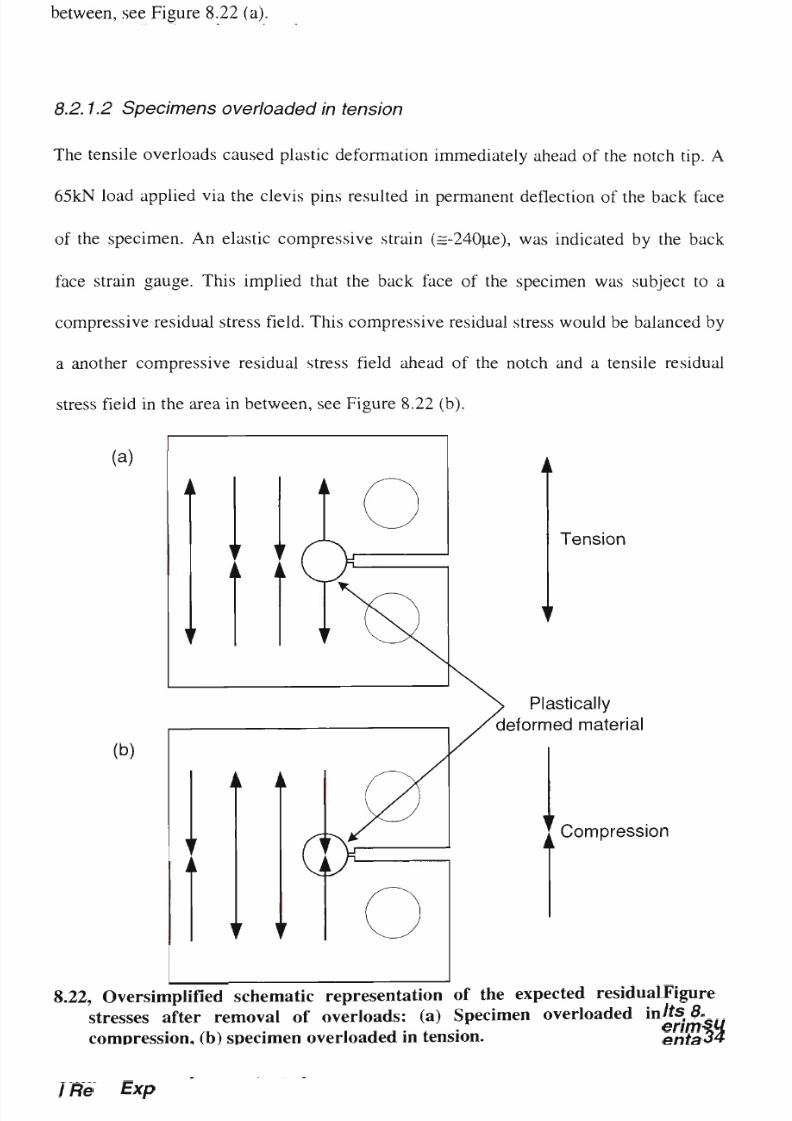
8/10/2019 The Effect of Residual Stress and Crack Closure on Fatigue Crack
http://slidepdf.com/reader/full/the-effect-of-residual-stress-and-crack-closure-on-fatigue-crack 179/304
Experimental Results 8.34
8.2.1.2 Specimens overloaded in tension
The tensile overloads caused plastic deformation immediately ahead of the notch tip. A
65kN load applied via the clevis pins resulted in permanent deflection of the back fac
of the specimen. An elastic compressive strain (=-240u,e), was indicated by the back
face strain gauge. This implied that the back face of the specimen was subject to a
compressive residual stress field. This compressive residual stress would be balanced
a another compressive residual stress field ahead of the notch and a tensile residual
stress field in the area in between, see Figure 8.22 (b).
(a)
(b)
i o
6=
Tension
Plastically
deformed material
Compression
Figure 8.22, Oversimplified schematic representation of the expected residual
stresses after removal of overloads: (a) Specimen overloaded in
compression, (b) specimen overloaded in tension.

8/10/2019 The Effect of Residual Stress and Crack Closure on Fatigue Crack
http://slidepdf.com/reader/full/the-effect-of-residual-stress-and-crack-closure-on-fatigue-crack 180/304
Experimental Results 8.35
8.2.2 Residual stress m ea sur em ent of overloaded specime ns
8 2 2 1 Hole drilling
Hole drilling measurements were performed on a pair of specimens that had been
overloaded in compression in an identical manner as described earlier. One hole was
drilled parallel to the crack plane on the side of each specimen. The hole centres we
positioned 7.5mm and 20mm from the notch tip, see Figure 8.23. The results were
broadly in accordance with expectations, and are detailed in Table 8.10 and Table 8.1
respectively.
(a)
y
<
32.5mm
.y\.
N
(b)
„ 20mm
w
o
O
=
O
Figure 8.23, Locations of rosette strain gauges for residual stress measurements
on
specimens overloaded in compression: (a)
7.5mm
from notch tip
(32.5mm from back face), (b) 2 0 m m from notch tip (20mm from back
face).

8/10/2019 The Effect of Residual Stress and Crack Closure on Fatigue Crack
http://slidepdf.com/reader/full/the-effect-of-residual-stress-and-crack-closure-on-fatigue-crack 181/304
<_,
c
CO
E
D
i_
O
o
CO
CO
"S
CD
D)
c
CO
TJ
c
CO
CO
CD
CO
O
CD
y
CO
CO
Q_
y. V
9, **-
CO o
CVJ
ll
"
> CO
O -2
CO TJ
cr o
co "
"c co
co c
W 3
o o
E
E
CO
in
n
Q
a;
53
E
CO
b
6
o
CD
OJ
3
CO
0.
>
D
^
CD Q-
H
.c
CO
^^
« °
1
Q-
1-
2
CO
CO
0
2
JD CD
OJ OJ
C CD
< Q
c
CO
10-
e>2
2 CO
0 2
o
O
o
Q
Q
ij
'53
o
O
JO
*a3
o
O
-«—«
c
c
"
X CD -3
TJ
v. ^ ^
® "55 I
x
E
~
-J- (0 o
J Q
CD
CU
CM
CO
T -
CJ
00
00
<?
CO
Tt
I
s
-
d
CM
CO
N *
CO
I
s
-
CO
CO
CT)
UO
CO
1
CM
CO
CO
I
s
-
o
d
m
I
s
-
CM
CO
CO
o
d
00
o
d
r-
CM
d
I
s
-
CM
d
CM
CO
00
Tl-
-
CO
1
CO
I
s
-
cd
Tt
00
OJ
UO
d
00
CO
d
uo
o
CO*
TT
CO
CO
CO
Tt
1 —
d
LO
I
s
-
CM
Tt
I
s
-
o
d
Tt
o
d
I
s
-
CM
d
Tt
LO
CM
d
CM
CO
00
OJ
00
CO
1~
Tt
CO
CM
Tt
CO
CM
UO
CO
Tt
CJJ
cvi
00
CO
yi
1
CM
co
co
o
^
o
UO
h-
cvi
Tt
• ^ ~
1 —
d
CO
CO
q
o
I
s
-
CM
d
CO
CO
d
CM
CO
00
CO
T —
Tt
CO
y
CM
CO
o
CN
CO
2
CO
CM
CM
CM
5
o
CM
CO
CO
I
s
-
I
s
-
I
s
-
cri
I
s
-
r--
CM
d
UO
I
s
-
CM
uo
LO
t—
d
LO
CO
o
d
I
s
-
CM
d
CO
o
LO
d
CM
CO
CO
uo
CM
CJJ
1
I
s
-
o
Tt
CM
CO
CO
d
1
CO
CO
I
s
-
1
o
00
uo
uo
1
CO
UO
Tt
Tt
CO
d
LO
r>-
CM
CO
OJ
T —
d
Tt
o
—
d
I
s
-
CM
d
UO
CO
CO
d
CM
CO
CO
I
s
-
CM
00
1
OJ
CO
OJ
CO
CO
c\i
I
s
-
o
OJ
Tt
CM
uo
1
I
s
-
cd
UO
CO
CO
o
1
OJ
,_
Tt
_
Tt
d
UO
I
s
-
CM
Tt
CO
CM
d
o
CM
7 —
d
r--
CM
d
CM
CO
I
s
-
d
CM
CD
oo
I
s
-
CM
I
s
-
CM
1
I
s
-
CM
CO
CO
I
s
-
Tt
CT)
I
s
-
I
s
-
CD*
c?
uo
CO
CO
1
OJ
a>
Tt
UO
ai
CM
CO
ai
CM
CO
Tt
d
UO
I
s
-
CM*
00
CO
CM
d
Tt
CO
y—
d
I
s
-
CM
d
OJ
00
CO
d
CM
CO
00
CO
CM
UO
CO
1
LO
CO
CO
CO
CO
CO
I
s
-
CD
d
Tt
co
Tt
Tt
1
CO
UO
Tt
CO
ai
1
o
Tt
CO
UO
UO
d
uo
r--
CM
I
s
-
OJ
CM
d
Tt
Tt
1 —
d
I
s
-
CM
d
CO
r-
q
y-
CM
CD
00
CO
1 —
CO
Tt
1
OJ
CO
a>
m
>
CU
u
o
U
S
"35
Cfl
ii
u
ft
-a
cu
-a
t
_o
Ty
ii
>
o
a
cu
u
cu
a
• ^
y.
o
JS
cu
o
a
cu
O
Ti
SS
cu
J3
SB
a
cu
a
cu
s-
cu
c
a
cu
"O •
JjS
O
QO
. J-
.2f
c/)
Esh
u .5
•§1
00
—
s
S3
H
"o
co
fi
s
C
.6

8/10/2019 The Effect of Residual Stress and Crack Closure on Fatigue Crack
http://slidepdf.com/reader/full/the-effect-of-residual-stress-and-crack-closure-on-fatigue-crack 182/304
5^
X
>.
X
s
i
g
m
a
s
i
g
m
a
S
h
e
a
r
HI
CM
E
E
CD
O
(0
t
3
CO
E
o
Q.
<D
TJ
jD
O
X
o
LO
o
o
o
LO
o
LO
o
o
o
LO
m
CJ.
GO
CU
bl
s>
on
E
c
c
o
O
c«
BS
.2
SB
CU
Ui
cu
o
CJ
TJ
CU
O
72
cu
o
C
CJ
0)
Cfl
u
si
CU
E
cu
u
CJ
.5
.fl
ft
cu
TJ
*©
.fl
•
>
CB
CU
u
CO
Cd
J3
3
<0
CO
CC
s
c
CO
.1
v-
CO
8
(edlW) ssaiis
S
TJ
cn
cu
Pi
oo
SU
I
• l — t

8/10/2019 The Effect of Residual Stress and Crack Closure on Fatigue Crack
http://slidepdf.com/reader/full/the-effect-of-residual-stress-and-crack-closure-on-fatigue-crack 183/304
CD
CD
i_
O
c_
JZ
o
CO
CD
"CO
<D
OJ
c
CO
TJ
c
CO
CO
0
CO
CO
CD
i_
yy
CO
o
CO
CO
co -:
Q_
LO
O A
CM
II
•LU
-O co
o-i
CO
tr
CO
"c
o
co
co
'o
Q.
£
"53
E
CO
b
co 0
O J gj
OJ
u
CO
> D
CO
CO
CD Q-
-c 2
CO
00
CO
CO
CM
Tt
1
«?
*"f ^
UO CO
| y\
Tt
Tt
UO
Tt CO
E
CO
Q_
00
Tt'
T -
CM
OJ
r-*i
Tt
CO
Ol CO CO
CO
^ M I
s
- OJI ^
CO
00
T~ ' I
s
-
i- LO
CO'
I
s
-
co
I
s
-
Tt
co
OJ
LO
COI
CO
CL
Tt CD
y\
I
s
-*
CO: CO:
LO
CO:
I
s
-
* * i
uo
UO CM
CD
I
s
-
O
I
s
-
x
CO
-
CD
Q)
CD
OJ OJ
3 CD
< Q
PI
,
~
UO
CM
Tt
UO'
Pi
ud
:
LO
co
Tt
LO
r-.|
Tt
oil
I
s
-*
CO CD
c
CO
ICL
- "S
CO
CT)
CT):
CO
UOi
O i
I
s
-:
CO I
00
2
CO
-
2
co
CO
CO
CM
di
P'
:
PI
odi cdi
CO LO:
Q
N
Q
Q
CD
o
O
CO
0
O
O
silt
c
x^E
J-
CD -S-
TJ
2.
"p-
® "53 |
x
E
~
T 3 Q
CO
0J
I
s
-
Tt
Ol
T-
di d
O '
CMI
I
s
-
CM
Coi Tt
di
d
o
CO
o
COi
°
001
o
00
Ol
CO
o
CO
MI CM CMI CMj CM CM
Tt
CO
o
o
o
r--
o
o
CO
o
CO
Tt
00
CO
LO
CM
CM
CO
O
O
I
s
-
CM
OJ
CO
O
I
s
-
CM
COI
Ol
00
o
OJ
OJ
o
I
s
-
CM
I
s
-
CM
I
s
-
CM
I
s
-
Tt
CM
LO
y
CM
7-
CO
CO
o
CO' uo
UO
CO
CO
LO
Tt
1
Tt
00 00
Tt Tt
COi col
Tt Tt
00|
oo
OJI °2
CMI I
s
-
y CM
OJ
CM
OJ I
s
-
CMI CO
OJI
T-
COI uo
Tt
Tt
O
CO
CM,
CM
COi Tt
UO
OJ
Tt
t-
co
00
LO
CM
CT) CMi OJ
UO LO Tt
COI
di
co
T -
001
i
[
CM'
"*l
col
1
LO
CVI
I
s
-
1
CO
CO
LO
I
s
-
o
*>
CM
•I—
UO
1
00
Tt
d
o
00
CM
CO
UO
CM
d
CO
CM
CM
OJ
00
00
Tt
00
CM
UO
CM
I
s
-
Tt
CD
O
CO
CD
uoi
I
s
-
l< Tt
I
s
-
CD
1
i '
i
o
co
co
uri
uo
uo
o
oo
cvi
CO
00
CM
O
00
CO
I
s
-
CM
CO
o
Tt
00
CO
I
s
-
e
"3>
ji
CU
u
ft
o
CJ
T5
cu
TJ
SS
"*£
cu
>
o
C
cu
CJ
cu
a
cn
C M
©
-fi
CJ
o
s
TJ
e
cs
cu
CJ
C M
^
CJ
C3
J2
fi
CU
cu
"5
.fi
> >
ss
it
s co
CU f S
E oo
= |
cu ••"
<y
w
o
JS
.
/)
>
Ji
J)
CU
Ui
e
o
-4-1
tn
O
t
rv
CU
>
03 cu
TJ g-
1 i
90
CU
J2
SS
H
00
CO
oo
"3
CO
3
CO
s
CO
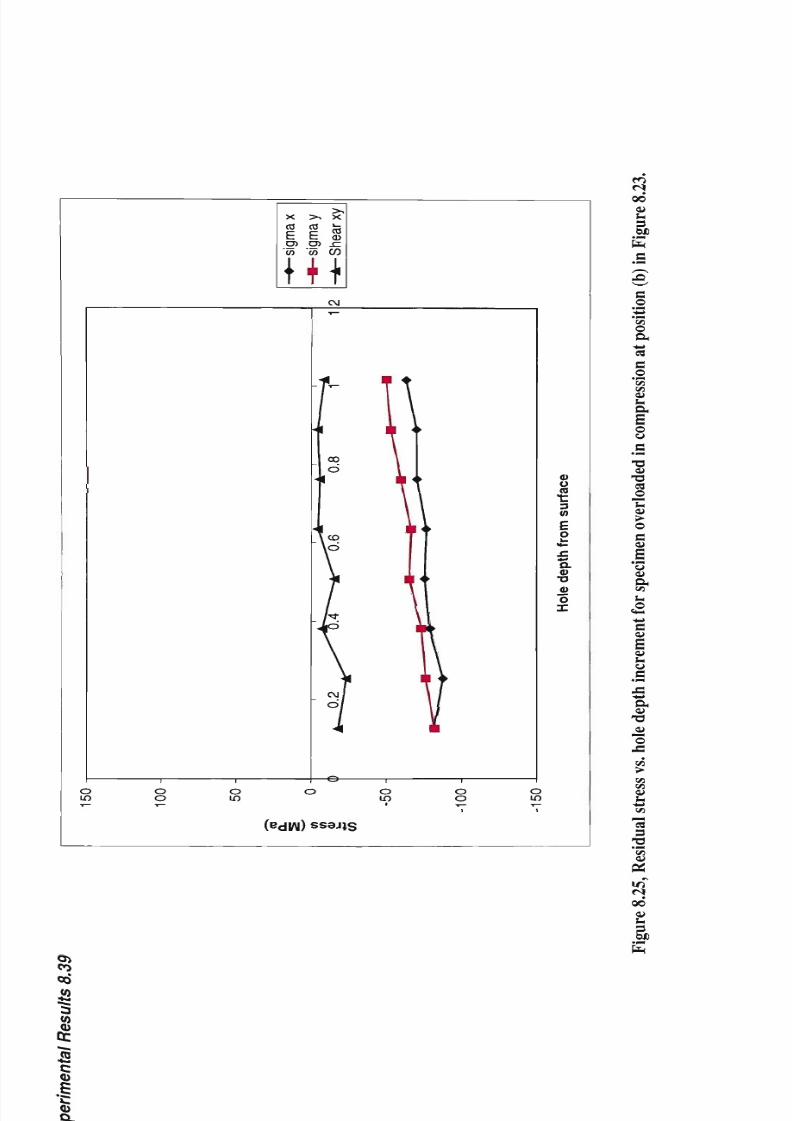
8/10/2019 The Effect of Residual Stress and Crack Closure on Fatigue Crack
http://slidepdf.com/reader/full/the-effect-of-residual-stress-and-crack-closure-on-fatigue-crack 184/304
X 5-. X
s
i
g
m
a
s
i
g
m
a
S
h
e
a
r
{ + +
CM
I
CO
d
o
LO
o
o
o
LO
o
LO
o
o
o
uo
(edIAl) ss aj js
CO
00
cu
u
3
c
c
o
cn
O
Cl,
*J
08
C
o
"53
cn
cu
u
o
CJ
TJ
cu
a>
o
CO
r
CO
b
o
«•—
£
a
u
T>
<D
O
I
TJ
03
©
Ui
cu
>
O
fi
32
S
CJ
cu
ft
cn
u
£
c
cu
CU
u
CJ
fi
a
cu
TJ
©
fl
Ji
>
Ji
Ji
cu
u
y<
Vi
73
fi
s
CU
OO
cu
u
So
OJ
co
00
"3
V)
CO
DC
s
c
CO
I
CO

8/10/2019 The Effect of Residual Stress and Crack Closure on Fatigue Crack
http://slidepdf.com/reader/full/the-effect-of-residual-stress-and-crack-closure-on-fatigue-crack 185/304
Experimental Results 8.40
Unfortunately, the hole-drilling equipment was not available to perform similar
measurements on specimens subject to tensile overload. However, it was considered
worthwhile reporting the limited set of results above. Set in the context of the
experimental work, the hole drilling residual stress data supports the results of
experimental work, i.e. the X-ray diffraction measurements and crack growth studi
8.2.2.2 X ray diffraction
Residual stress measurements by X-ray diffraction were performed on specimens tha
had been subject to compressive overload, and on specimens that had been subjecte
a tensile overload. The area ahead of the notch in the crack plane on the side of
specimen was electro-polished (as per Appendix A3). A series of seven residual st
measurements were taken along the crack plane on each specimen. The data was
processed in a manner identical to that described earlier (7.1.1.2) and the resul
detailed below in Table 8.12 and represented graphically in Figure 8.26.
Position
(Distance from
notch tip)/mm
2
6
10
10.5
14
14.5
18
18.5
22
22.5
26
Tensile Overload
Residual stress
MPa
-135
-38
70
-
114
-
91
-
88
-
120
Compressive
Overload
Residual stress
MPa
5
67
-
58
-
-22
-
-42
-
-121
-98
Table 8.12, Residual stresses in tension and specimens overloaded in compression
as indicated by X-ray diffraction.

8/10/2019 The Effect of Residual Stress and Crack Closure on Fatigue Crack
http://slidepdf.com/reader/full/the-effect-of-residual-stress-and-crack-closure-on-fatigue-crack 186/304
Experimental Results 8 41
150
100 -
50
ro
Q.
co
0
10
CD
CO
-50
-100
-150
30
•Tensile Overload
-Compressive
Overload
Position (from notch
tip)
m m
Figure 8.26, Residual stress distribution prior to growth of a fatigue crack in C T
specimens overloaded in compression and in tension, as indicated by
X-ray diffraction.
8 2 2 3 Neutron diffraction
Residual stress measurements were planned for the overloaded specimens. However,
due to the reactor operating schedule the necessary "beam time" was not available.
8.2.3 Crack growth in specimens subject to tensile overload
The large compressive residual stresses at the notch root effectively prevented initia
and growth of a fatigue crack at the loading conditions that had been effective in the
received specimen material. The AKL was increased incrementally until a fatigue crack
started to grow. However, once the crack had initiated it accelerated dramatically.
Hence, in order to keep the crack growth rate in the near threshold range, the AKL was
reduced after the periodic interruptions to the experiment where crack closure
measurements were performed. See Figure 8.27.

8/10/2019 The Effect of Residual Stress and Crack Closure on Fatigue Crack
http://slidepdf.com/reader/full/the-effect-of-residual-stress-and-crack-closure-on-fatigue-crack 187/304
Experimental Results 8 42
1.60E-08
1.40E-08
^
1.20E-08
a>
u
o 1.00E-08
1
•o
8.00E-09
6.00E-09
4.00E-09
2.00E-09
4
:
-25
:
/ "
i >i I m imi»i»iti
^
30
20 ~
E
IS
15
8=
10 <
-5
0.2 0.25 0.3 0.35 0.4 0.45 0.5 0.55 0.6
Relative crack length (a/W)
da/dN
-delta K
Figure 8.27,
F C G
rate
and
A K L VS. relative crack length (a/W), specimen
overloaded in tension prior to crack growth.
A second specimen, which had been overloaded in an identical manner, was then
subjected to constant AKL=26MPaVm. The second experiment was also interrupted at
predetermined intervals to perform crack closure measurements. The data from both
experiments are shown in Table 8.13. A comparison of the crack growth rates at AKef
with baseline data for as received material is shown in Figure 8.28. The FCG rate d
for the overloaded specimens at AKeff correlate well with the baseline data.

8/10/2019 The Effect of Residual Stress and Crack Closure on Fatigue Crack
http://slidepdf.com/reader/full/the-effect-of-residual-stress-and-crack-closure-on-fatigue-crack 188/304
Experimental Results
8 43
Relative crack
length a (—)
W
0.27
0.38
0.48
0.58
0.30
0.35
0.40
0.45
0.52
0.55
0.60
A K
L
(MPaVm)
27.4
23.9
18.9
16.9
26.0
26.0
26.0
26.0
26.0
26.0
26.0
AKop
(MPaVm)
13.4*
8.6*
12.5
10.8
19.5
19.0
16.2
15.5
14.0
11.2
10.8
AKeff
(MPaVm)
16.75
17.8
8.34
7.37
9.0
10.0
12.8
13.2
16.8
17.5
18.0
da
d N
(m/cycle)
1.30E-08*
1.07E-08*
4.18E-09
3.86E-09
5.72E-09
9.20E-09
2.42E-08
2.56E-08
3.02E-08
4.47E-08
5.06E-08
* These data points appear to have been affected by the load sequence effect.
Table 8.13, F C G rates and
K,
)p
for specimens subject to a tensile overload (65kN)
prior to growing a fatigue crack at
R=0.1,
specimens

8/10/2019 The Effect of Residual Stress and Crack Closure on Fatigue Crack
http://slidepdf.com/reader/full/the-effect-of-residual-stress-and-crack-closure-on-fatigue-crack 189/304
Experimental Results 8 44
1 00E-07 -i
o
>.
E 1.00E-08-
z
1
1
rVfVF-flQ
i .uuc-uy
i
l— A
l
I
AKefl
j
|
•
^
•
•
i
m
1
h
/ _
M
Jf
M
i
Jt
iii
•
I
p
V
f-.
"-,.
*^N
s
"
\
•->
^ • s ;
^
^ s
10 100
(MPaVm)
•Tensile overload
• As rec (R=0.5)
*"V> data affected by
load sequence
Figure 8.28, Crack growth rates at AKeff for specimens subjected to a 65kN tensile
overload compared with baseline data
for
as
received material.
All
specimens were cut in the L-T orientation and were in the as-received
heat treatment condition.
8.2.4 Crack growth in specimens subject to compressive overload
The specimen was expected to have tensile residual stresses ahead of the notch ti
Hence, to observe the effect of the residual stresses on fatigue crack growth, th
was grown at a low value of AK
L
of approximately 10.5MPaVm, R=0.1. The crack
initiated and the FCG rate accelerated to a peak rate of 8xl0"
9
m/cycle, and subse
slowed to a rate between 2xl0"
9
m/cycle and 4xl0"
9
m/cycle. See Figure 8.29.

8/10/2019 The Effect of Residual Stress and Crack Closure on Fatigue Crack
http://slidepdf.com/reader/full/the-effect-of-residual-stress-and-crack-closure-on-fatigue-crack 190/304
Experimental Results 8 45
The test was interrupted at pre-determined intervals to perform crack closure
measurements. The crack closure data were commensurate with the observed FCG
rates, see Table 8.14 and Figure 8.30.
1.60E-08
1.40E-08
_ 1.20E-08
o
o
1.00E-08
Z 8.00E-09
1
"° 6.00E-09
4.00E-09
2.00E-09
--
•
•
•
•
* • •
m\
•
,
fLl,
, , , ,
30
25
20
15
10
?
T
flj
CL
2
_i
\y
0
0.2 0.25 0.3 0.35 0.4 0.45 0.5 0.55 0.6
Relative crack length (a/W)
da/dN
-delta K
Figure
8.29, F C G
rate
a nd A K L
VS. relative crack length (a/W), specimen
overloaded in compression prior to crack growth.
Relative crack
length a (—)
W
0.30
0.39
0.49
0.59
A K
L
(MPaVm)
10.5
10.5
10.5
10.5
Ko
P
(MPaVm)
0.70
1.75
1.86
2.30
AKeff
(MPaVm)
10.5
10.0
10.1
9.5
da
dN
(m/cycle)
7.85E-9
2.60E-9
3.50E-9
2.55E-9
Table 8.14, F C G rates and Ko
P
observed for specimen subjected to a compressive
overload.

8/10/2019 The Effect of Residual Stress and Crack Closure on Fatigue Crack
http://slidepdf.com/reader/full/the-effect-of-residual-stress-and-crack-closure-on-fatigue-crack 191/304
Experimental Results 8.46
1 00E-07 -
"ST
o
E,
1.00E-08 -
z
1
•o
1 nnP-Tio
i .uucTjy
I
AKgff
IA
I
f
2f
4-t
i
A
ii
JF
#
f
1
^i
11
10
(MPaVm)
100
• Compr. overload
A As rec (R=0.5)
Figure 8.30, C rac k g ro wt h rates at AKeff for specimens subjected to a 2 7 5 k N
compressive overload compared with baseline data for
as
received
material. All speci mens w ere cut in the L - T orientation a nd we re in
the as-received heat treatment condition
The stabilisation of the F C G rate and
Ko
P
appear to confirm that once the tensile
residual stress field has been relaxed, as the crack length increases, the fatigue
behaviour of the specimen tends towards that of a stress relieved specimen. This is
further supported by the BFS data at zero load for various crack lengths, see Table
Initially a large deflection was observed, but then the rate at which this increase
crack length fell. This is consistent with the initial relation of a tensile residu
followed by the gradual "wedging" open of the crack by plastically deformed material
in the wake of the crack tip.

8/10/2019 The Effect of Residual Stress and Crack Closure on Fatigue Crack
http://slidepdf.com/reader/full/the-effect-of-residual-stress-and-crack-closure-on-fatigue-crack 192/304
Experimental Results 8 47
Relative crack
length a (—)
W
0.20
0.30
0.39
0.49
0.59
BFS
at
zero
load
0
-60
-82
-109
-93
Table
8.15,
Back face strain gauge readings
at
progressive crack lengths
for
specimen overloaded in compression and then fatigued at constant
AK
L
-10.5MPaVm (R=0.1).

8/10/2019 The Effect of Residual Stress and Crack Closure on Fatigue Crack
http://slidepdf.com/reader/full/the-effect-of-residual-stress-and-crack-closure-on-fatigue-crack 193/304
Experimental Results 8 48
8.3 Effect of residual stresses introduced by welding
A double-V butt weld (parallel to the rolling direction) was prepared as detailed in t
Appendix A7. A set of four CT-specimens (Wl to W4) was machined from around the
welded joint. The location of the weld with respect to the each specimen is shown in
Figure 8.31 to Figure 8.34. The residual stress condition of each specimen was
measured, and then fatigue cracks were grown under controlled conditions. As with the
earlier experiments, the tests were periodically interrupted to perform crack closure
measurements.
8.3.1 Specimen configurations
Specimen Wl was fabricated such that the notch was at 90° to the weld and its notch tip
lay at the centreline of the weld, see Figure 8.31. It was expected that the notch tip
would be in tension, and the back face of the specimen in compression.
Weld metal
Figure 8.31 Location of notch and crack plane with respect to double-V butt weld
Specimen W l . The notch tip is at centreline of weld and the crack
plane is at 90° to weld. Specimen is in L-T orientation with respect to
parent plate.

8/10/2019 The Effect of Residual Stress and Crack Closure on Fatigue Crack
http://slidepdf.com/reader/full/the-effect-of-residual-stress-and-crack-closure-on-fatigue-crack 194/304
Experimental Results 8 49
To investigate the effect of the significant through-thickness residual stress distribution
that was expected, specimen W2 was cut such that the crack plane was adjacent and
parallel to the weld, as shown in Figure 8.32. Due to the multi-pass nature of the weld,
the material laid down last was likely to be in tension relative to the material laid dow
earlier. This was expected to result in a through thickness residual stress distribution.
Weld metal-
<
Figure 8.32 Location of notch and crack plane with respect to double-V butt weld
Specimen W 2 . The notch and crack plane are parallel to centreline of
weld.
Specimen is in T-L orientation with respect to parent plate.
Specimen W3 was cut such that its back face was at the centre-line of the weld, see
Figure 8.33. It was expected that the back face of the specimen would be in tension,
balanced by a compressive residual stress further away from the back face, and possibly
a tensile field just ahead of the notch.

8/10/2019 The Effect of Residual Stress and Crack Closure on Fatigue Crack
http://slidepdf.com/reader/full/the-effect-of-residual-stress-and-crack-closure-on-fatigue-crack 195/304
Experimental Results 8.50
Figure
8.33
Location of notch and crack plane with respect to double-V butt
weld
Specimen W 3 . Centreline of weld is along the back face of the
specimen. Notch and crack plane are at 90° to weld with the crack
grown towards the weld. Specimen is in L-T orientation with respect
to the parent plate.
/
O
o ;
CYJ
or]
r'x
f'Yj
r
Y
< ^
o
Yj
CO
CD
-E
CD
Figure 8.34 Location of notch and crack plane with respect to double-V butt weld
Specimen W 4 . Weld centreline is along at front face of the specimen
notch is cut through the weld and the crack is grown away from the
weld. Specimen
is
in L-T orientation with respect to the parent plate.

8/10/2019 The Effect of Residual Stress and Crack Closure on Fatigue Crack
http://slidepdf.com/reader/full/the-effect-of-residual-stress-and-crack-closure-on-fatigue-crack 196/304
Experimental Results 8 51
Where a notch or crack has cut through a tensile residual stress ield, t is expected that
the residual stress normal to the crack plane will have been largely dissipated. To test
this hypothesis specimen W4 was machined with its notch through the weld. The
centre-line of the weld was at the front face of the specimen, see Figure 8.34. The
fatigue crack growth and crack closure behaviour was expected to be similar to that of
as received plate specimens.
8.3.2 Residual stress fields in the welded specimens
The residual stress field in each specimen was examined, prior to the crack growth
experiments, by neutron diffraction. The X-ray and hole-drilling equipment was
unavailable for this series of specimens.
The specimen was positioned in the HRPD and the reflection selected such that the
scattering vector Q was normal to the notch and the crack growth plane. The (125mm'
1
)
diffracted volume for each of measurement was in the centre of the specimen thickness.
Residual stress measurements were performed at five locations for each specimen (Wl-
4), see Figure 8.35. The results have been tabulated in Table 8.16.
The residual stress condition of each specimen, as indicated by the residual stress
measurements, was broadly in keeping with the expectations. Specimens Wl, W2, and
W3, all had significant residual stresses present due to the weld. The neutron diffract
measurements indicated that specimen W4 was comparatively free of residual stresses.
The residual stresses due to the welding process appeared to have been virtually
eliminated by cutting the notch.

8/10/2019 The Effect of Residual Stress and Crack Closure on Fatigue Crack
http://slidepdf.com/reader/full/the-effect-of-residual-stress-and-crack-closure-on-fatigue-crack 197/304
Experimental Results
8.52
5 4 3 2 1
• • • • • <
o
Figure 8.35, Position of neutron diffraction residual stress measurements along the
crack plane.
Position
1
2
3
4
5
Distance
from
back face
35.0
27.5
20.0
14.5
9.0
Specimen
W l
(MPa)
+73
-40
-2
+2
+6
W2
(MPa)
-56
-52
-35
-10
-25
W3
(MPa)
+41
+7
-16
-7
-20
W4
(MPa)
+5
+24
+19
+20
+10
Table 8.16, Residual stresses in welded C T specimens normal to the crack plane
(measured
by
neutron diffraction ±20MPa)

8/10/2019 The Effect of Residual Stress and Crack Closure on Fatigue Crack
http://slidepdf.com/reader/full/the-effect-of-residual-stress-and-crack-closure-on-fatigue-crack 198/304
Experimental Results 8 53
8.3.3 Fatigue crack growth and crack opening behaviour in welded specimens
Following the residual stress measurements the specimens were each fatigued at near
constant AKL ~ 12MPaVm. The crack growth experiments were each interrupted at
predetermined intervals of crack length and crack closure measurements made. The
Table 8.17 details the crack growth rates and K
op
values measured at specific crack
lengths.
8.3.3.1 Effect of residual stress on crack growth rates at constant AK
L
As the cracks were grown through the residual stress fields that were present in the
specimen, the residual stresses were expected to affect the FCG rate and crack opening
response (Ko
P
). The crack growth rate under near threshold conditions was expected to
be lower in the presence compressive residual stress and increased in the presence of
tensile residual stress. Figure 8.36 shows the FCG rate (da/dN) against relative crack
length for specimens Wl, W3, W4, as well as an as-received specimen were all cut in
the L-T orientation. Figure 8.37 shows the corresponding result for specimen W2,
which was cut in the T-L orientation.
The crack growth rates for the specimens cut in the L-T orientation (Wl, W3 and W4)
varied significantly for the initial part of the experiment, but then showed a tendency
converge with increasing crack length. This most likely explained by the dissipation of
the residual stresses by the crack. However, the FCG rate behaviour of specimen W2 is
relatively consistent throughout the experiment, with a higher values of K,,
p
being
reported compared to the other specimen configurations (Wl, W2, W4, and as
received).

8/10/2019 The Effect of Residual Stress and Crack Closure on Fatigue Crack
http://slidepdf.com/reader/full/the-effect-of-residual-stress-and-crack-closure-on-fatigue-crack 199/304
Experimental Results 8.54
1.20E-08 -.
1.00E-08
-
^s
8.00E-09 -
o
u
1
6.00E-09
z
"°
4.00E-09
-
2.00E-09 -
•
•
• •
V
yy
•
•V
* ^ " ^
: • * .
^v^^A
£
iV
\9^A§
yt+Jr*
•
V
M
4-trfc- .
* » %
t*+
•
da/dN (W1)
• da/dN (W3)
• da/dN (W4)
• As rec (L-T)
0.00E+00
-1 1 1 1
0.2 0.3 0.4 0.5 0.6
Relative crack length a/W)
Figure 8.36, A comparison
of
F C G rates at corresponding crack lengths, under
constant A K
L
conditions (AK
L
«12MPaVm,
R=0.1),
for C T specimens
cut in various positions about a double-V butt weld. Also shown is the
corresponding result
for a
control specimen
(as received). All
specimens were cut in the
L-T
orientation.

8/10/2019 The Effect of Residual Stress and Crack Closure on Fatigue Crack
http://slidepdf.com/reader/full/the-effect-of-residual-stress-and-crack-closure-on-fatigue-crack 200/304
Experimental Results 8.55
1.20E-08 -i
1.00E-08
~ 8.00E-09
o
E, 6.00E-09
z
1
•°
4.00E-09
2.00E-09
O.OOE+00
^
% * *
3t»
H^A+Vlhkt
.~AW
A da/dN (W2)
• As rec (T-L)
0.2 0.3 0.4 0.5
Relative crack length (a/W)
0.6
Figure 8.37, A comparison of F C G rates at corresponding crack lengths, under
constant A K L conditions. C T specimen W 2 cut with the notch and
crack plane parallel to the double-V butt weld, A K
L
= 1 2 M P a V m and
R=0.1, and corresponding the results for a control specimen (as
received), A K L
« H M P a V m
and R=0.1. Both specimens were cut in the
T-L orientation.
8.3.3.2 Comparison of FCG rates atAK
eff
with baseline data
When the crack growth rates at AKeff (determined by crack closure measurements) w
compared with the baseline data collected at R=0.5 for the same specimen orientat
high level of agreement was observed. Figure 8.38 and Figure 8.39 show the crack
growth rates at AKeff for the specimens Wl, W3, and W4, and for specimen W2
compared with base line data for L-T and T-L specimen orientations respectively.
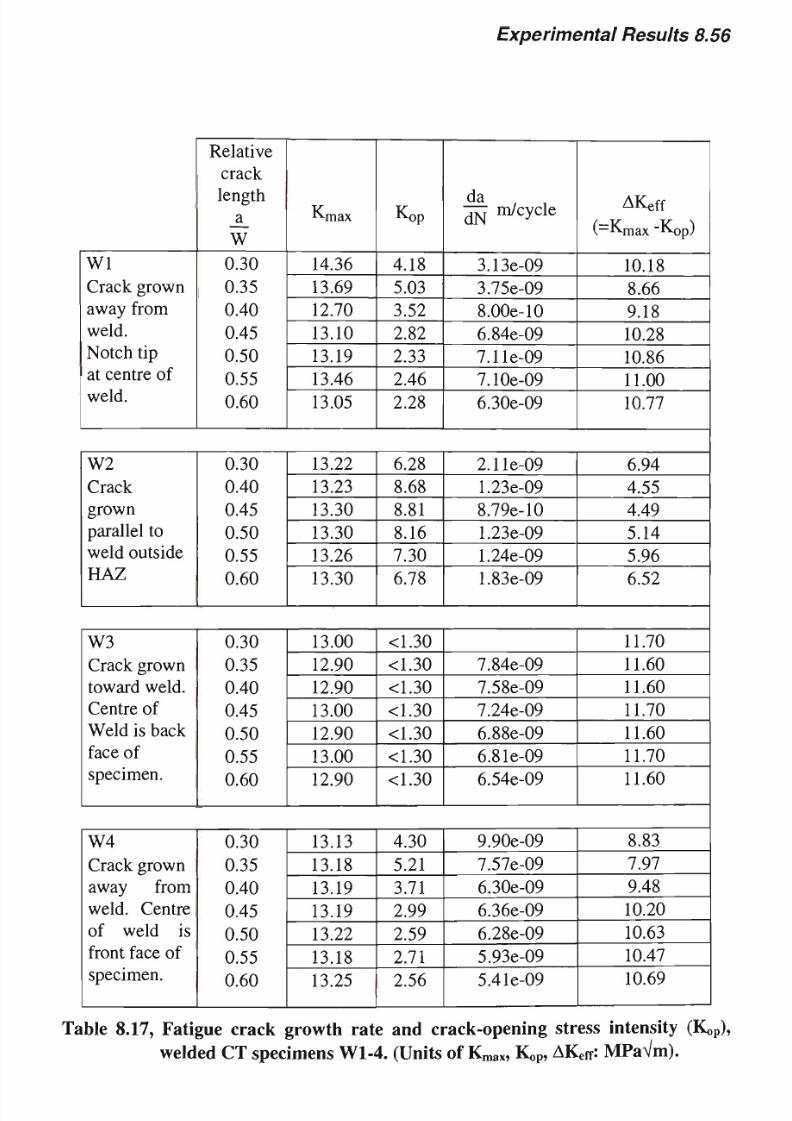
8/10/2019 The Effect of Residual Stress and Crack Closure on Fatigue Crack
http://slidepdf.com/reader/full/the-effect-of-residual-stress-and-crack-closure-on-fatigue-crack 201/304
Experimental Results 8.56
W l
Crack grown
away from
weld.
Notch tip
at centre of
weld.
Relative
crack
length
a
W
0.30
0.35
0.40
0.45
0.50
0.55
0.60
Kmax
14.36
13.69
12.70
13.10
13.19
13.46
13.05
Kop
4.18
5.03
3.52
2.82
2.33
2.46
2.28
da
d N m/cycle
3.13e-09
3.75e-09
8.00e-10
6.84e-09
7.11e-09
7.10e-09
6.30e-09
AKeff
(
=
Kmax "Kop)
10.18
8.66
9.18
10.28
10.86
11.00
10.77
W 2
Crack
grown
parallel to
weld outside
HAZ
0.30
0.40
0.45
0.50
0.55
0.60
13.22
13.23
13.30
13.30
13.26
13.30
6.28
8.68
8.81
8.16
7.30
6.78
2.11e-09
1.23e-09
8.79e-10
1.23e-09
1.24e-09
1.83e-09
6.94
4.55
4.49
5.14
5.96
6.52
W3
Crack grown
toward weld.
Centre of
Weld
is
back
face of
specimen.
0.30
0.35
0.40
0.45
0.50
0.55
0.60
13.00
12.90
12.90
13.00
12.90
13.00
12.90
<1.30
<1.30
<1.30
<1.30
<1.30
<1.30
<1.30
7.84e-09
7.58e-09
7.24e-09
6.88e-09
6.81e-09
6.54e-09
11.70
11.60
11.60
11.70
11.60
11.70
11.60
W4
Crack grown
away from
weld. Centre
of weld is
front face of
specimen.
0.30
0.35
0.40
0.45
0.50
0.55
0.60
13.13
13.18
13.19
13.19
13.22
13.18
13.25
4.30
5.21
3.71
2.99
2.59
2.71
2.56
9.90e-09
7.57e-09
6.30e-09
6.36e-09
6.28e-09
5.93e-09
5.41e-09
8.83
7.97
9.48
10.20
10.63
10.47
10.69
Table 8.17, Fatigue crack growth rate
and
crack-opening stress intensity (Ko
P
),
welded C T specimens
Wl-4.
(Units of
K „ ,
Ko
P
, AK
eff
: MP aVm).

8/10/2019 The Effect of Residual Stress and Crack Closure on Fatigue Crack
http://slidepdf.com/reader/full/the-effect-of-residual-stress-and-crack-closure-on-fatigue-crack 202/304
IO
o
1
^^
o
in
<
*>
1
CO
$
_
—
5
•
o
o
^—v
E
(0
Q.
o 2
a>
*
<1
H
U
u
,o
«tH
r-N
V>
o
II
X
•*J
3
cS
CS
T3
"o
i*
+J
C
o
J3
-4-1
£
Vi
8
a>
s
)
u
s
i
S
a
/yy^
H
SJ
Ui
3
as
o
u
yt\
yi
SS
u
ii
y,
JO
TJ
ii
M
u
XM^S
o
•J
u
ii
u
T3
#
8
o
u
3
a
S
T3
ii
y
IV
V
*J
"3
(0
i>
tt
«8
c
>
y
0.
• " ^
(Q
4 M
a>
.E
V.
,x
uj
(apAo/ui) NP/BP
a>
ai
w
*J
es
tr
v
J
cS
Ui
e
u
*
y .
©
co
u
CS
a
o
U
O
fO
00
ii
u
s
on
CS
s
i
o
c
CJ
e
s
a
^
o
cs
u
X
•M
• rt
£
VI
s
CJ
s
"3
ii
V
fa

8/10/2019 The Effect of Residual Stress and Crack Closure on Fatigue Crack
http://slidepdf.com/reader/full/the-effect-of-residual-stress-and-crack-closure-on-fatigue-crack 203/304
N
in
o
P
o
CO
<
•
W
N
1
•
-•tfr
•-
•
•
•
i i
CO h- OO 05 C
O O O O T
LU LU LU LU U
O O O O C
p p p p C
(apAo/iu) NP/ep
o
- o
?
~y*
CO
- y 1
fc
<
•
J
H
U
u
„©
«M
/
y^
IT)
O
II
yy
*J
es
cs
CS
T3
o
M
•> >
a
o
X
•<->
£
a
rt
cd
0)
*i
3
iP
.S*
OC
08
s
2
S>
s
.
•
<B
*>•
C
Q)
.s
c
)
Q.
£
CJ
s
CJ
u
8 •
Vi /-~*
sb
«J 8
U o
8 •«
i; »
« .8
-
"t3
u en
g 8
U «rt
^ 5
C J
cS
•a 2
8
3
CJ
*^
•*-> CJ
CJ rj
W £
<-yS
es g
» rr
CJ
CJ
•2
fi
ft
fa 2
8 -
©
.a «
U rj
es S
|.i
o <•>
U ft
»
w
0\
CO
00
CJ
u
fa

8/10/2019 The Effect of Residual Stress and Crack Closure on Fatigue Crack
http://slidepdf.com/reader/full/the-effect-of-residual-stress-and-crack-closure-on-fatigue-crack 204/304
Experimental Program Results 8.59
8.3.4 Fracture surfaces of welded C T specimens and implications of crack
growth rates and crack opening response at constant A K
L
At the conclusion of each crack growth experiment, the specimen was broken open to
enable the fatigue fracture surfaces to be examined. The shape of the fatigue crack tip
(from one side of the specimen to the other) is indicative of the
AKeff
conditions
prevailing at the crack tip.
8.3.4.1 Crack plane
parallel to the
weld
(T-L)
The specimen prepared with its notch and crack plane parallel to the weld (W2) had a
distinctive fracture appearance. The crack front was curved such that the crack tip at the
centre lagged behind compared the sides of the plate, see Figure 8.40. The shape of the
crack front remained virtually constant, as shown by the "beach-marks" at the interrupt
points.
This implied that the residual stress across the specimen thickness was not
relieved by a crack growing in this direction. The shape of the crack was commensurate
with the residual stress measurements. These indicated that the centre of the specimen
was subject to significant compressive residual stresses normal to the crack plane. This
implied that the material either side (at the top and bottom of the plate specimen) was in
relative tension. If the X-ray diffraction facility had been available, it is considered
likely that
this
could have been supported by appropriate measurements.
da
The measured K
o p
and ^ 7 results remained within a small range throughout the
experiment. Because the principal residual stresses affecting the crack growth in this
specimen balance across the thickness, and were not affected by crack length, the
residual B F S at zero load was slightly larger than that in an as received specimen
fatigued under the similar loading
conditions,
A K L and R, see Figure 8.41. This may be
explained by the relaxation of the compressive residual stress on the side of the

8/10/2019 The Effect of Residual Stress and Crack Closure on Fatigue Crack
http://slidepdf.com/reader/full/the-effect-of-residual-stress-and-crack-closure-on-fatigue-crack 205/304

8/10/2019 The Effect of Residual Stress and Crack Closure on Fatigue Crack
http://slidepdf.com/reader/full/the-effect-of-residual-stress-and-crack-closure-on-fatigue-crack 206/304
Experimental Program Results
8.61
Parent metal adjacent
o weld in compression
eld metal in
tension
Specimen
sides in
tension
Weld
Crack plane
Centre of
specimen in
compression
Figure 8.42, Schematic showing likely residual stress distribution normal and
parallel to the crack plane parallel to the weld (specimen W 2 ) .
8/10/2019 The Effect of Residual Stress and Crack Closure on Fatigue Crack
http://slidepdf.com/reader/full/the-effect-of-residual-stress-and-crack-closure-on-fatigue-crack 207/304
Experimental Program Results 8.62
8.3.4.2 Crack plane normal to the weld L-T)
The FCG behaviour of specimens W1 and W3 was expected to be similar. The residual
stress measurements indicated that the material ahead of the notch tip was in tension. I
was expected that, as the crack grew, the material either side of the crack would relax
away from the crack plane. The relaxation of these tensile residual stress fields was
expected to be reflected by lower values of K,,
p
, and FCG rates that would be higher
than for a stress relieved or as received specimens under similar loading schedules. The
relaxation of the tensile residual stress was also expected to be reflected by larger
deflection of the back face of the specimen at zero load, indicated by the BFS gauge.
However, as can be seen in Figure 8.36, the initial crack growth rate in specimen Wl
(where the notch tip was positioned at the centreline of the weld) was significantly
lower than that in an as received specimen under similar conditions. The measured
values of Ko
P
were higher than expected, yet the back face strain at zero load was
similar to that for specimen W3, which behaved in a manner that was expected.
The unexpected behaviour of this specimen (Wl) is attributed to different material
properties of the material immediately ahead of the notch. The mechanical properties
(yield strength, toughness and ductility) of the weld metal and heat affected zone are
likely to be significantly different from that of the parent plate. Since the first part
crack grown in this specimen passed through this material, it seems that this has
significantly affected the crack opening response. When the crack had grown through
this material its behaviour tended towards that of the parent plate. The deflection of th
back face of the specimen at zero applied load indicates that the growth of the crack w
accompanied by the relief of the significant residual stresses that were detected by the
neutron diffraction measurements.

8/10/2019 The Effect of Residual Stress and Crack Closure on Fatigue Crack
http://slidepdf.com/reader/full/the-effect-of-residual-stress-and-crack-closure-on-fatigue-crack 208/304
Experimental Program Results 8.63
-4-
•W1
•W3
W4
Stress relieved
0.20 0.30
0.40
0.50 0.60
Relative crack length (a/W)
Figure 8.43, Back face strain (BFS) at zero load vs. relative crack length. A
comparison of specimens W l , W 3 , and W 4 (with the crack plane
normal to the weld) and a stress relieved control specimen with no
weld. (All specimens in L-T orientation).
Figure 8.44 shows the expected residual stress distribution in the specimens W l and
W3. In the case of specimen W4 the FCG behaviour, crack closure (Ko
P
), and residual
BFS at various crack lengths were very similar to a piece of as received plate fat
under similar conditions. This is explained by the relative remoteness of the mater
the crack plane to the weld, and because the residual stresses associated with the
were effectively released by cutting the notch in the specimen.
c
5
0
>
cn
cn
o>
i-
Q.
E
o
O
0
=1
C/)
LL
CD
-250
-200
-150
•100
-50
y£<f^*^

8/10/2019 The Effect of Residual Stress and Crack Closure on Fatigue Crack
http://slidepdf.com/reader/full/the-effect-of-residual-stress-and-crack-closure-on-fatigue-crack 209/304
Experimental Program Results 8.64
Weld metal
to
I I
• * =
..
o
Tension
—-^
Compression
Figure 8.44, Schematic showing likely residual stress distribution normal to the
crack plane parallel to the weld in specimens W l and W 3 , (not to
scale .
It was also noted that the crack shape, as indicated by the beachmarks on the fracture
surface, was quite different for specimen Wl, see Figure 8.45. Close to the start of th
crack the beachmarks are sigmoidal, and the crack became increasingly straighter as
the test progressed. This was probably due to the residual stress profile across the w
which had left one side in tension relative to the other. This is a result of the seque
which the weld metal was deposited. One V having been filled before the other was
started, (see Appendix A7). The first V was expected to be in compression relative to
the second. The crack tip shapes of specimens W3 and W4 were relatively straight,

8/10/2019 The Effect of Residual Stress and Crack Closure on Fatigue Crack
http://slidepdf.com/reader/full/the-effect-of-residual-stress-and-crack-closure-on-fatigue-crack 210/304
Experimental Program Results 8.65
similar to the as received or stress relieved specimens, see Figure 8.46 and Figure 8.47
respectively.
fffffffffffffffffffffffffffffffffff
Figure 8.45, Fracture surface of specimen with crack plane normal to
weld,
and
notch tip at centreline of double-V butt weld. Note that sigmoidal
shaped beachmarks , indicating that the crack tip lagged behind on
lower side of the specimen relative to the upper side. The crack has
grown from left to right. The uncracked ligament was on the right
hand side of the picture.
Figure 8.46, Fracture surface of specimen with crack plane normal to and opposite
to the double-V butt weld. The centreline of the weld is at the back
face of the specimen ( R H S of photo). The crack has grown from left to
right. The uncracked ligament was on the right hand side of the
picture. Note relatively straight beachmarks .
Figure
8.47,
Fracture surface of specimen with crack plane normal to the double-V
butt weld. The centreline of the weld is at the front face of the
specimen (L HS of
photo).
The crack has grown from left to right. The
uncracked ligament was on the right hand side of the picture. Note
relatively straight beachmarks .

8/10/2019 The Effect of Residual Stress and Crack Closure on Fatigue Crack
http://slidepdf.com/reader/full/the-effect-of-residual-stress-and-crack-closure-on-fatigue-crack 211/304
Experimental
Program
Results
8.66
REFERENCES
1. Recommended Practice for Pre-production Qualification for Steel Plates for
Offshore Structures,
API Recommended Practice 2Z (RP
2Z ,
First Edition, M a y 1,
(1987), American Petroleum Institute, Washington D C .
2. Steel Specification for Fixed Offshore Structures (Adapted for Offshore from
BS4360:1986), Engineering Equipment & Material Users Association Publication
No.
150, (1987), E E M U A , London.
3. Measurement of Residual Stresses by the Hole-Drilling Strain Gage Method,
Measurements Group Technical Note TN-503-3, (1988), Measurements Group
Inc
Raleigh N C .
4. Bacon, G.E., Neutron diffraction, 2nd edition. (1962), Clarendon Press, Oxford
5. Noyan, I. C. & Cohen J.B., Residual Stress: Measurement by diffraction and
interpretation, (1987), Springer-Verlag, N e w York.
6. Lambrineas, P., Finlayson, T.R., Griffiths, J.R., Howard, C.J., and Smith, T.F.,
Neutron diffraction residual stress measurements on a thin steel plate,
NDT
International,
20,
5,
(1987),
pp285-290.
7. Standard Test Method for MEASUREMENT OF FATIGUE CRACK GROWTH
RATES,
A S T M Standard E647
-
86a, (1986), A S T M , Philadelphia, PA.
8. Reid, C.N., A method of mapping residual stress in a compact tension specimen,
Scripta
Metallurgica, 22 , (1988), pp453-463.
9. Prime, M.B., Measuring residual stress and the resulting stress intensity fact
compact tension specimens,
Fatigue Fracture of Engineering Materials and
Structures,
22 , 3, (1999), ppl95-204.

8/10/2019 The Effect of Residual Stress and Crack Closure on Fatigue Crack
http://slidepdf.com/reader/full/the-effect-of-residual-stress-and-crack-closure-on-fatigue-crack 212/304
Discussion and Analysis
9 1
Discussion and Analysis
The results of the experimental program, detailed in the preceding chapter, have
demonstrated that residual stress and of the crack closure effect are closely linked.
Residual stresses affect the crack opening response, and this effect is measurable. The
crack closure effect can also be measured in specimens that are relatively free of
residual stresses prior to the growth of a crack. This chapter will now retrospectively
consider the principal experimental methods and then discuss the results; firstly, each
group in isolation (as-received and stress relieved plate, then overloaded specimens, and
lastly the welded specimens), and then in a broader overall context.
9 1 Experimental
9.1.1 Residual stress measurements
The various residual-stress measurement techniques utilised displayed only qualitative
agreement. The X-ray diffraction method for measuring residual stress was considered
the most useful. It represented the best compromise between spatial resolution, speed,
and accuracy. However, major equipment failure prevented its use for most of the
experimental program.
Neutron diffraction was extremely time-consuming due to the low intensity of the
neutron beam, and its use was limited by reactor operating schedules and the demands
of other users of the diffractometer. The attenuation of the neutron beam by the
specimen forced a compromise between spatial resolution and the duration of each
experiment. Increased spatial resolution is only possible with significantly longer scans.
Due to these difficulties, the residual stress measurements performed represented a less
than ideal compromise compared to the preferred experimental plan.
The hole-drilling method delivered comparatively inconclusive results, and in some
respects contradicted the data from the crack growth experiments.

8/10/2019 The Effect of Residual Stress and Crack Closure on Fatigue Crack
http://slidepdf.com/reader/full/the-effect-of-residual-stress-and-crack-closure-on-fatigue-crack 213/304

8/10/2019 The Effect of Residual Stress and Crack Closure on Fatigue Crack
http://slidepdf.com/reader/full/the-effect-of-residual-stress-and-crack-closure-on-fatigue-crack 214/304
Discussion and Analysis 9 3
• The vibration of the machine results in reliability problems with the power
amplification circuitry (housed in the base of the machine) that energises the
electromagnet.
Appropriately, configured, servo-hydraulic mechanical testing equipment overcomes all
of these disadvantages, at a relatively small additional capital cost. Hence, if the
experimental plan were to be repeated or extended, servo-hydraulic mechanical testing
equipment would be preferred if the option were available.
The DC potential-drop (DC-PD) crack measurement system performed reliably,
although it was more difficult to set up than a commercially developed system. After
each test, it was possible to crosscheck the mean crack lengths indicated by the DC-PD
system and use the data from each of the previous experiments to further refine the
empirically derived calibration. This engendered a high level of confidence in the crack
length measurement, critical to the calculation of FCG rates and for feedback control of
the load during the constant AKL experiments.
The CT specimen has the advantage of being a recognised standard geometry, popular
with many fracture research groups world-wide. This facilitated relatively
straightforward comparison of crack growth data collected here with that published
elsewhere. It also eliminated the need to develop stress intensity solutions for the
selected specimen, since these are readily available from reference handbooks and
standards.
9.1.3 Crack closure measurements
The crack closure measurements required the crack growth experiments to be
interrupted. The rate of loading and unloading during these measurements was much
slower than during the growth of the crack. Hence, it is important to consider that Ko
P
determined this way might be unrepresentative of K
op
during cycling at 80-90Hz. The

8/10/2019 The Effect of Residual Stress and Crack Closure on Fatigue Crack
http://slidepdf.com/reader/full/the-effect-of-residual-stress-and-crack-closure-on-fatigue-crack 215/304
Discussion and Analysis 9 4
F C G data for increment of crack growth immediately following these interruptions was
discarded to avoid any spurious data associated with load sequence effects. These
concerns might be avoided if a suitable means of measuring the crack opening response
on-line during the crack growth could be applied. Such a technique would allow
continuous measurement of Ko
P
, as well as eliminating the need for interruptions.
During this study such an attempt was made, albeit unsuccessfully.
The BFS strain gauge (via the digital strain meter) and load cell output were connected
to a Tektronix spectrum analyser, and the specimen cycled at 90Hz using the Instron
1603. Unfortunately, the response of the strain transducer appeared to be damped by
the circuitry of the intermediate instrumentation, and it was not possible to identify
crack opening level. However, with a suitable strain transducer, and circuitry, it may
possible to monitor the crack opening response on-line during the test. Such a series o
experiments would be a logical component of any extension of the work described
herein.

8/10/2019 The Effect of Residual Stress and Crack Closure on Fatigue Crack
http://slidepdf.com/reader/full/the-effect-of-residual-stress-and-crack-closure-on-fatigue-crack 216/304
Discussion
and
Analysis 9.5
9.2 C r a c k g r o w t h in as-rec eived material a n d stress relieved material
The experimental programme initially investigated the effect of crack plane orientat
load ratio, and partial stress-relief, on fatigue crack growth and crack closure. The
minimum stress relieving heat treatment was found to have had a significant effect on
da
the fatigue crack growth rate ( — ) and u pon the crack closure effect. This effect wa s
d N
greatest at lower load ratios where Kmin was likely to be below Ko
P
. When the crack
growth data was compared with published data for a similar material (BS4360-50D
steel), a high level of agreement was found, see Figure 9.1.
1 OF-07
M
<D
U
>.
,0
E 1.0E-08
z
1
D
1.0E-09
I
1
m
w
J
10
AK MPaVm
1C
0
• AB3542, R=0.5
• BS4360-50D, R=0.7
A BS4360-50D, R=0.08
Figure 9.1, Co mp ar is on of F C G data for the spec imen material AB 35 42 ) vs. data
for an equivalent grade BS4360-50D) published by Woodtli et al [1].
9.2.1 Effect of residual stress condition and specimen orientation L-T vs. T-L)
The as received steel plate material was found to contain significant residual stres
These residual stresses were larger across the rolling direction than parallel to it
minimum stress relieving heat treatment considerably reduced these residual stresses
At low R ratios the stress relieved specimens tended to have higher crack growth rate
under the same loading conditions and specimen orientation than the as-received
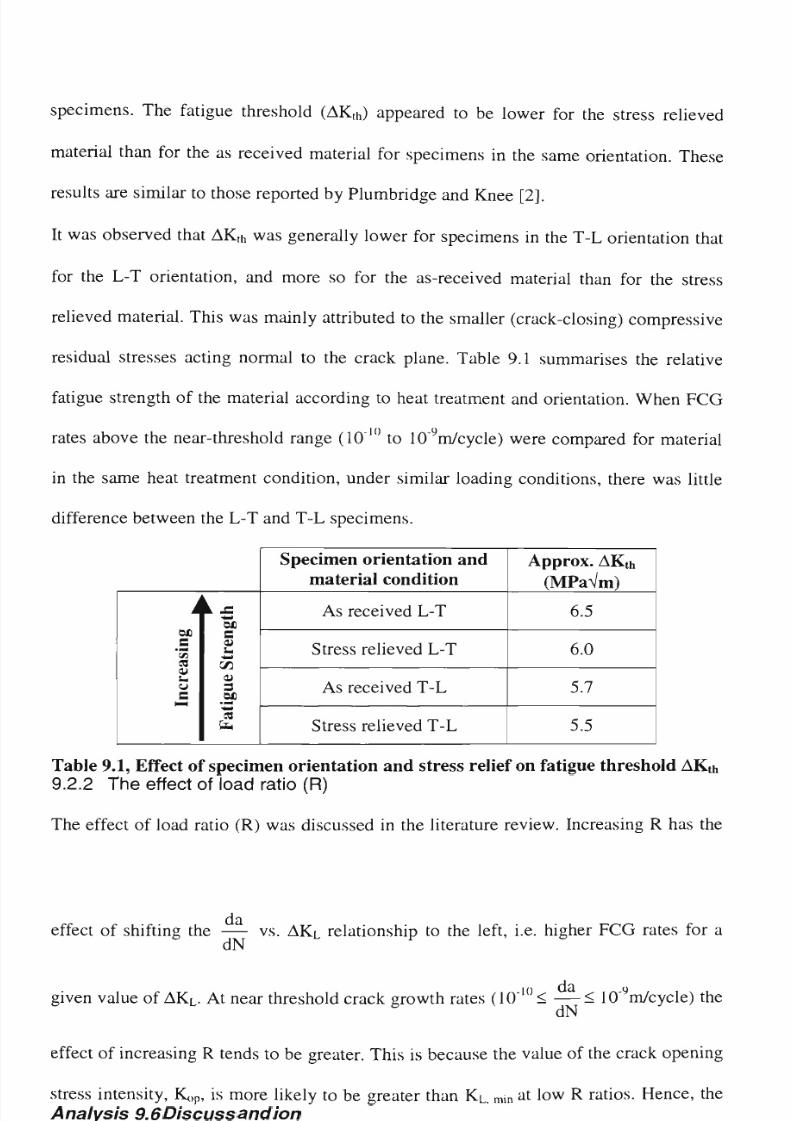
8/10/2019 The Effect of Residual Stress and Crack Closure on Fatigue Crack
http://slidepdf.com/reader/full/the-effect-of-residual-stress-and-crack-closure-on-fatigue-crack 217/304
Discussion and Analysis 9 6
specimens. The fatigue threshold
(AK
th
)
appeared to be lower for the stress relieved
material than for the as received material for specimens in the same orientation. These
results are similar to those reported by Plumbridge and Knee [2].
It was observed that AK
th
was generally lower for specimens in the T-L orientation that
for the L-T orientation, and more so for the as-received material than for the stress
relieved material. This was mainly attributed to the smaller (crack-closing) compressiv
residual stresses acting normal to the crack plane. Table 9.1 summarises the relative
fatigue strength of the material according to heat treatment and orientation. When FCG
rates above the near-threshold range (10
I()
to 10
9
m/cycle) were compared for material
in the same heat treatment condition, under similar loading conditions, there was little
difference between the L-T and T-L specimens.
n
c
r
e
a
s
i
n
g
I
on
&
i
ii
3
OH
s
Specimen orientation and
material condition
As received L-T
Stress relieved L-T
As received T-L
Stress relieved T-L
Approx. AK
t
h
(MPaVm)
6.5
6.0
5.7
5.5
Table 9.1 Effect of specimen orientation and stress relief on fatigue threshold AK
t
h
9.2.2 The effect of load ratio (R)
The effect of load ratio (R) was discussed in the literature review. Increasing R has th
da
effect of shifting the — vs. A K
L
relationship to the left, i.e. higher F C G rates for a
d N
given value of AK
L
. At near threshold crack growth rates (10
1()
< —< 10
9
m/cycle) the
d N
effect of increasing R tends to be greater. This is because the value of the crack openi
stress intensity, K<,
P
, is more likely to be greater than K
L
, min at low R ratios. Hence,

8/10/2019 The Effect of Residual Stress and Crack Closure on Fatigue Crack
http://slidepdf.com/reader/full/the-effect-of-residual-stress-and-crack-closure-on-fatigue-crack 218/304
Discussion and Analysis 9 7
crack is more likely to be closed for part of the load cycle. The effect of R ratio was
similar for the stress relieved specimens and for the specimens machined from as
received plate.
During the experimental program reported here, the measured crack opening response
(Kop) indicated by the BFS gauge that at R=0.1 and R=0.05 the crack was closed during
part of the cycle. However, crack closure was largely avoided at R=0.5, except at very
da
low AK. The crack closure data were effective in normalising the — vs. A K
d N
relationship.
9.2.3 Microstructural effects
The microstructures and material properties of the as received and stress relieved fatig
specimens were essentially identical, and the variations in FCG behaviour and crack
opening response were attributed to the significant differences in residual stress
condition. The minimum stress relieving heat treatment used did not induce any
noticeable microstructural changes that could be observed by optical metallography, nor
was there any significant change in the Vickers hardness.
It was considered possible that microstructural or textural factors might also provide a
easier path for cracks in the T-L orientation than for the L-T. To conclusively confirm
whether indications of a lower AK
t
h in the T-L orientation might be partially due
microstructural factors, (i.e. sulphide stringers or some textural phenomena), fatigue
threshold testing would be required. This would involve testing fully stress relieved
specimens using the K
c
max
technique, described in 2.4.2. However, the FCG behaviour
was considered in the context of the residual stress measurements, and most of the
experimental programme focused on the L-T orientation. Determination of an absolute
value of AK
t
h for the test material was not amongst the primary objectives of the

8/10/2019 The Effect of Residual Stress and Crack Closure on Fatigue Crack
http://slidepdf.com/reader/full/the-effect-of-residual-stress-and-crack-closure-on-fatigue-crack 219/304
Discussion and Analysis 9.8
research. The optical metallographic evidence also suggested that concentration of
inclusions in a narrow band at the centre of the plate had left relatively isotropic
microstructures above and below. Hence, fatigue threshold testing using the K
c
max
technique is suggested as part of a programme of further work.
9.2.4 Effect of the fracture surface fretting debris
The development of (fretting) oxide debris on the fracture surface and roughness
induced fatigue crack-closure was considered significant. This is because this
phenomenon is usually associated with contact between the fracture surfaces.
It was noticed that, at the lower R ratios, fretting debris was more widespread on the
fatigue-fracture surfaces of the stress relieved specimens than for the as received
specimens. It was also noticed that, for both stress-relieved and as-received specimens,
the fretting debris was concentrated towards the centre of the specimen, especially at
greater crack lengths. This may be explained partly by the increasing compliance of the
specimen with greater crack length. As the crack grew the specimen was expected to
become increasingly compliant and, beyond a certain crack length, that secondary
(Mode II and Mode HI) fracture mechanisms might begin to contribute. This was
despite the relatively thick CT specimen and careful alignment of the testing machine
promoting predominantly plane strain or Mode I conditions. In-plane shear (Mode II)
may only contribute to a minor extent at the crack lengths studied, but even small
overall displacements of this nature may be large relative to the scale of the asperities
on the fracture surface. Modes I, II and III are described schematically in Figure 9.2.
A supplementary set of experiments was undertaken using a Talysurf type instrument to
establish the asperity height on the fracture surfaces. This work is detailed in Appendix
A8. For a crack grown at 11 MPaVm and R=0.1 the mean maximum asperity height was
approximately 20 micrometres. Measurements were repeated on areas of the same

8/10/2019 The Effect of Residual Stress and Crack Closure on Fatigue Crack
http://slidepdf.com/reader/full/the-effect-of-residual-stress-and-crack-closure-on-fatigue-crack 220/304
Discussion
and
Analysis
9 9
fracture surface with and without fretting debris at comparable crack lengths, but no
significant difference in fracture surface topography was measurable using the Talysurf.
This indicated that the layer of fretting debris might be a thin contiguous layer or fil
on the affected area.
The BFS gauge used to measure the crack opening response suggested that (assuming
linear elastic bending) the crack opening displacement was approximately 60
micrometres for the same crack. The maximum plastic zone size (r
p
, under plane strain
conditions) for the same crack was calculated to be approximately 40 micrometres*.
Figure 9.3 shows the relative scale of fracture surface topography to the calculated
plastic zone size on loading and unloading and crack opening displacement.
The thickness of the fretting debris was likely to be small compared to the crack
opening displacement, average asperity height, and plastic zone size. Therefore, it was
considered reasonable to conclude that any oxide-induced contribution to crack closure
during this experimental programme was small compared to likely contributions from
residual stresses, fracture surface roughness or plasticity. Although no accurate direct
measurements of the fretting debris thickness were made, optical metallography of
cross-sections through a typical sample of fracture surface indicated that it was too
small to be easily observed. The fracture surfaces of several specimens were also
examined by scanning electron microscopy. The topographical features observed were
similar at the same crack length and load history for those areas with and without the
dark (visually) reddish film of fretting oxide , see Figure 9.4 and Figure 9.5
* (K,=K
m ax
=12.1MPaVm,a
y
=440MPa),r
/ 7
= M | = J L
[44 J
2
= 0.040mm

8/10/2019 The Effect of Residual Stress and Crack Closure on Fatigue Crack
http://slidepdf.com/reader/full/the-effect-of-residual-stress-and-crack-closure-on-fatigue-crack 221/304
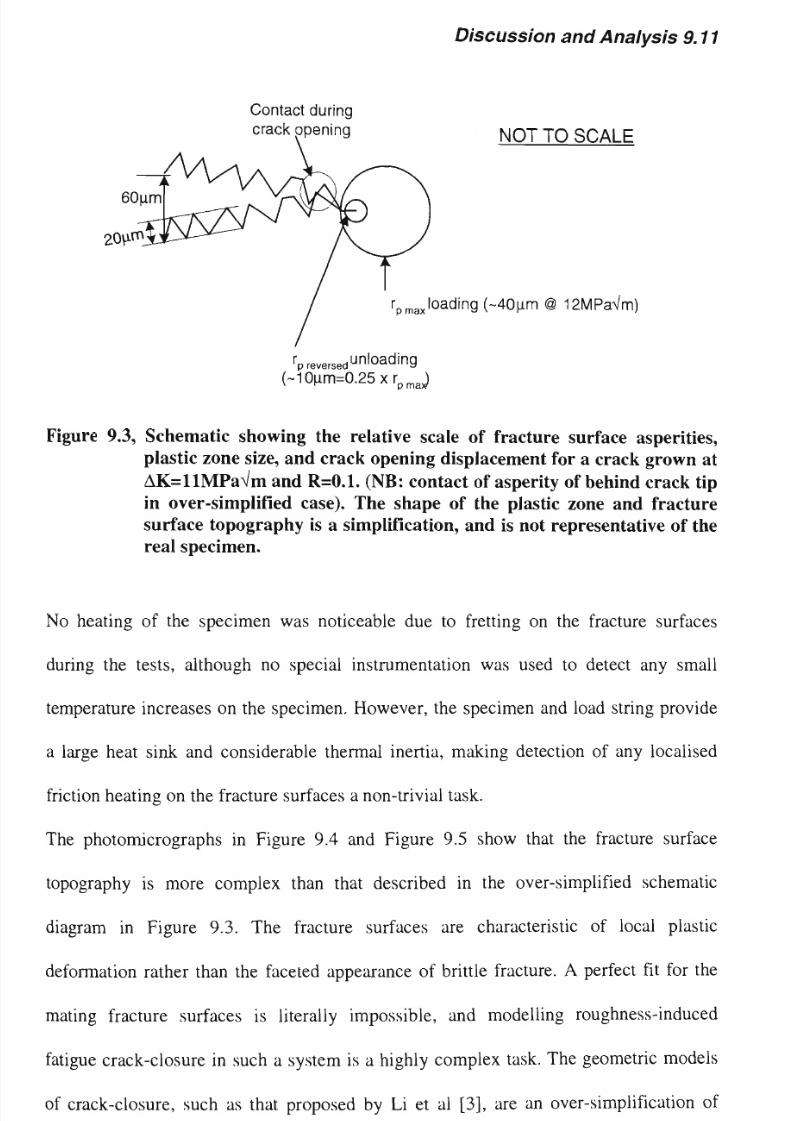
8/10/2019 The Effect of Residual Stress and Crack Closure on Fatigue Crack
http://slidepdf.com/reader/full/the-effect-of-residual-stress-and-crack-closure-on-fatigue-crack 222/304
Discussion and Analysis 9 11
Contact during
crack opening N O T T O
S C A L E
60|im /\^$i/zrN I
20y^Aj^^
V
^'^ A. J
/
r
P
max
loadin
9 (~40am @ 12MPaVm)
r
P
reversed unloading
(~10um=0.25xr
pm
J
Figure 9.3, Schematic showing the relative scale of fracture surface asperities,
plastic zone
size, and
crack opening displacement
for a
crack grown
at
A K = l l M P a V m
and
R=0.1. NB: contact
of
asperity
of
behind crack
tip
in over-simplified case .
The
shape
of the
plastic zone
and
fracture
surface topography is a simplification, and is not representative of the
real specimen.
No heating of the specimen was noticeable due to fretting on the fracture surfaces
during the tests, although no special instrumentation was used to detect any small
temperature increases on the specimen. However, the specimen and load string provide
a large heat sink and considerable thermal inertia, making detection of any localised
friction heating on the fracture surfaces a non-trivial task.
The photomicrographs in Figure 9.4 and Figure 9.5 show that the fracture surface
topography is more complex than that described in the over-simplified schematic
diagram in Figure 9.3. The fracture surfaces are characteristic of local plastic
deformation rather than the faceted appearance of brittle fracture. A perfect fit for t
mating fracture surfaces is literally impossible, and modelling roughness-induced
fatigue crack-closure in such a system is a highly complex task. The geometric models
of crack-closure, such as that proposed by Li et al [3], are an over-simplification of
roughness induced crack closure. However, it appears that these models correctly

8/10/2019 The Effect of Residual Stress and Crack Closure on Fatigue Crack
http://slidepdf.com/reader/full/the-effect-of-residual-stress-and-crack-closure-on-fatigue-crack 223/304
Discussion and Analysis
9 12
demonstrate that roughness induced closure can be expected to occur close to the crack
tip without Mode II or Mode III displacements.
The crack tips of both the as received and stress relieved specimens were consistently
straight. This can be confirmed by examination of the beach-markings in Figure 8.14
and Figure 8.15. This observation implies that AKeff was relatively constant across the
breadth of the crack as per observations by Mills and James [4].

8/10/2019 The Effect of Residual Stress and Crack Closure on Fatigue Crack
http://slidepdf.com/reader/full/the-effect-of-residual-stress-and-crack-closure-on-fatigue-crack 224/304
Discussion and Analysis
9 13
O
o
3
O
-*
o
D)
O
(Q
Figure 9.4, Fracture surface in area affected by fretting debris. Crack grown at
constant AK =llMPaVm, R=0.1. Magnification -2000X.
(0
o
o'
3
o
o
0)
o
Figure 9.5, Fracture surface in area not affected by fretting debris. Crack grown at
constant AK=llMPaVm,
R=0.1,
same specimen as shown in Figure 9.3
at
similar crack length. Magnification -2000X.

8/10/2019 The Effect of Residual Stress and Crack Closure on Fatigue Crack
http://slidepdf.com/reader/full/the-effect-of-residual-stress-and-crack-closure-on-fatigue-crack 225/304
Discussion and Analysis
9 14
9.2.5 Relaxation of residual stresses in wake of the fatigue crack
Since residual stresses and moments must balance within a body, it follows that
compressive residual stresses in the surface layers must be balanced by equivalent
tensile stresses in the bulk. As the crack propagates through the specimen, it creates a
new free surface either side of it. When the fracture surfaces are pulled apart on loading,
the material either side of the crack is able to relax into the free space. If the materia
the centre of the specimen is subject to residual tensile stress prior to the crack, it is
expected to relax in the opposite direction from the other fracture surface. The larger
the residual-stress the greater the relaxation and vice versa. Likewise, if the material a
the sides of the specimen was subjected to a compressive residual stress it would be
expected to relax into the free space made available by the crack as the fracture surfaces
are pulled apart. This concept is well established and is best explained with the help of
the diagram in Figure 9.6.
It was expected that a greater amount of crack closure would occur at the sides of the
crack. This would be due to a combination of the shear lip effect and the relaxation of
the compressive residual stresses in the plate surfaces as the crack opened on uploading.
The residual stress measurements indicated that the bi-axial compressive residual
stresses in the surface of the plate material were reduced by the heat treatment. These
results were supported by the FCG data, which indicated higher FCG rates in the stress
relieved specimens under similar load conditions.

8/10/2019 The Effect of Residual Stress and Crack Closure on Fatigue Crack
http://slidepdf.com/reader/full/the-effect-of-residual-stress-and-crack-closure-on-fatigue-crack 226/304
Discussion and Analysis 9 15
Figure
9.6,
Simplified representation of relaxation of residual stresses either side of
an edge crack in a plate specimen, a) Uncracked specimen with
surfaces in bi-axial compression, b) Crack fully open on uploading,
exaggerated relaxation of fracture surfaces, c) Crack fully closed at
zero
load.
Plastic deformation in wa ke of crack and asperity mismatch
prevents return to exact pre-cracked arrangement. This is
demonstrated in real fatigue specimens by the residual compressive)
elastic strains as indicated by B F S gauges.
However, the thin dark-reddish film of fretting-oxide, on the fatigue fracture surface
the as-received specimens and the stress relieved specimens, was not distributed in a
manner that was expected based upon the residual stress measurements or the FCG data.
This feature is normally associated with intermittent rubbing contact between the

8/10/2019 The Effect of Residual Stress and Crack Closure on Fatigue Crack
http://slidepdf.com/reader/full/the-effect-of-residual-stress-and-crack-closure-on-fatigue-crack 227/304
Discussion and Analysis 9 16
fracture surfaces during the lower part of the load cycle. It was expected that the are
of the fracture surfaces most likely to contact were those at the sides of the specimen
yet these were clear of the fretting oxide expected in these circumstances. Conversely,
the areas of the fracture surfaces in the centre of the specimens, at greater crack lengt
were clearly covered in a film of fretting-oxide. It was also noted that there was more
fretting debris over a wider band, and at similar crack lengths, on the fracture surfac
of the stress relieved specimens.
The occurrence of fretting debris mainly at extended crack lengths, given that the crac
is grown at constant AK and R, is best explained by the increasing contribution of Mode
II and Mode III load components with increasing crack length. However, the
concentration of the fretting oxide in the centre of the specimen is more difficult to
explain. There are several possible theories:
1. The residual stress measurements are incorrect and the surfaces of the specimen are
in tension relative to the centre, leading to a longer period of closure compared to
the surface, (i.e. all three techniques delivered results which indicate tension where
there is compression and vice versa).
2. The lack of constraint at the free surfaces at the sides of the specimens has kept t
crack open for the entire load cycle except in the specimen bulk (or centre).
3. The high frequency load cycle (80-90Hz), and repeated impact of the two fracture
surfaces over approximately 1,000,000 cycles in 3 to 4 hours, has mechanically
displaced the friable fretting-oxide close to the sides of the specimen. The associated
debris has settled in the centre of the specimen or fallen out of the sides of the crac
or may have been swept away at the sides by Mode III displacements.
Of these possible explanations, a combination of 2 and 3 is the considered to be most
plausible, for the following reasons:

8/10/2019 The Effect of Residual Stress and Crack Closure on Fatigue Crack
http://slidepdf.com/reader/full/the-effect-of-residual-stress-and-crack-closure-on-fatigue-crack 228/304
Discussion and Analysis 9 17
1. It is highly unlikely that the FCG data and residual stress measurements would agree
unless the latter were at least qualitatively correct (i.e. indicating correctly whether
the area measured was in tension or compression).
2. The crack is likely to be closed, or at least partly closed, on unloading across the
breadth of the fracture surface. If the residual stress fields across the specimen
thickness were reduced by the heat treatment, the period and area of contact of the
fracture surfaces in the centre of the specimen would be expected to increase. This
would be likely to produce a wider and more concentrated deposit of fretting oxide
(as was observed).
Unfortunately, it is impossible to directly observe the fracture surfaces of the specimen
during the experiment. However, it may be possible to detect which parts of the fracture
surface are contacting, and the period of contact, using advanced ultrasonic techniques,
although this is a non-trivial task. It is suggested that this investigation could form the
basis of a future stand-alone project requiring specialised resources.
It has been noted, by Clark [5], that redistribution of residual stresses during crack
growth is likely to be significant where the plastic zones associated with the growing
crack are large enough to give rise to relaxation of the displacements associated with the
residual stress field. Redistribution of residual stresses may also be significant where
crack face displacements are large enough to avoid superposition of remote and residual
stress fields. Unlike Clark's work (with cold expanded fastener holes), the work
reported here is concerned with residual stresses local to the crack, and there is a need t
distinguish between the residual stresses and the remotely applied stress.

8/10/2019 The Effect of Residual Stress and Crack Closure on Fatigue Crack
http://slidepdf.com/reader/full/the-effect-of-residual-stress-and-crack-closure-on-fatigue-crack 229/304
Discussion and Analysis 9 18
9.2.6 Crack closure during constant AK crack growth
The constant AK experiments grew cracks under conditions where the load was reduced
incrementally at fixed small increments of crack length such that AK
L
and R were
maintained at an almost constant level. Useful data were compared from five distinct
combinations of AK
L
and R. Material conditions were normalised by conducting these
experiments only on as received specimens in the L-T orientation.
When the relationship between Ko
P
and K
L
,
max
was investigated no clear trend emerged.
The crack opening level Ko
P
was independent of AK and K
max
over the range
investigated, this is consistent with work by others on ferrous materials, e.g. Dutta
[6]. There was some tendency for Ko
P
to initially increase with crack length, and then
decrease again as the effective crack length (a/W) increased beyond about 0.5, see
Figure 9.7. Although the trend is not conclusive based upon the data reported here,
similar phenomena have been reported in the literature by Newman [7], and by
Minakwawa and McEvily [8].
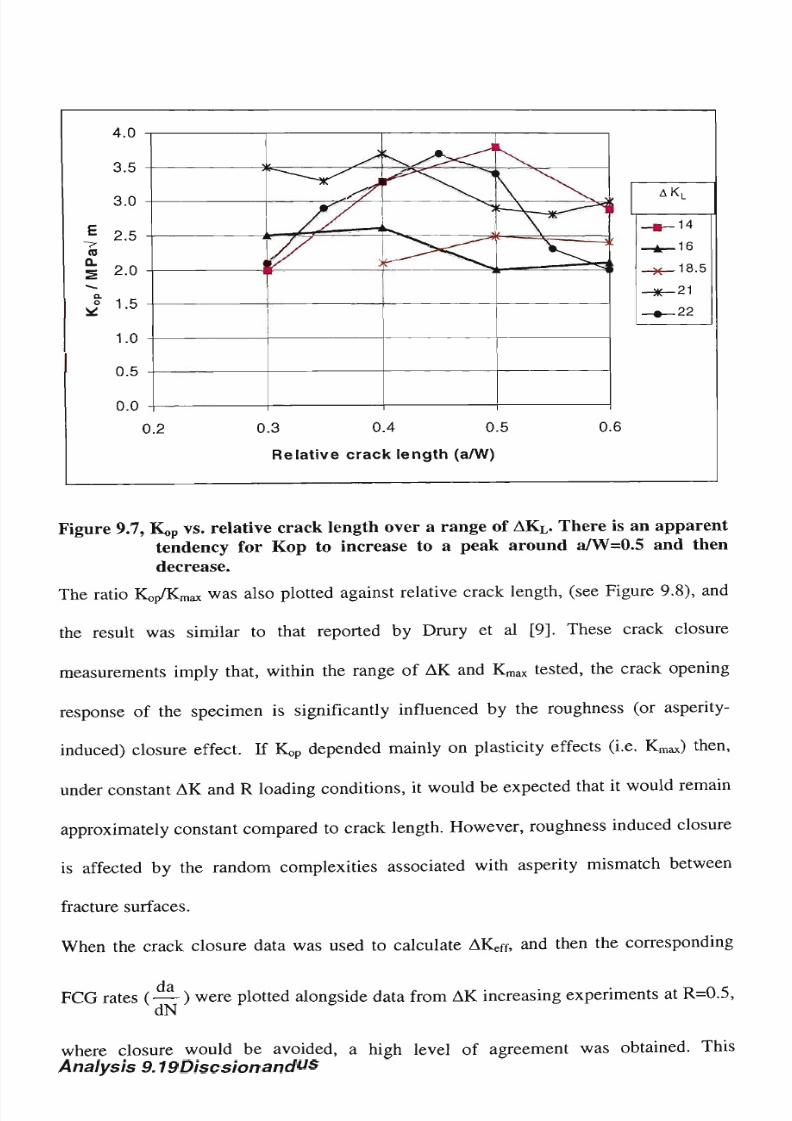
8/10/2019 The Effect of Residual Stress and Crack Closure on Fatigue Crack
http://slidepdf.com/reader/full/the-effect-of-residual-stress-and-crack-closure-on-fatigue-crack 230/304

8/10/2019 The Effect of Residual Stress and Crack Closure on Fatigue Crack
http://slidepdf.com/reader/full/the-effect-of-residual-stress-and-crack-closure-on-fatigue-crack 231/304
Discussion and Analysis 9.20
normalising effect of crack closure data was also demonstrated in the following
F C G
experiments with overloaded specimens and welded specimens.
0 25 T -
0.20 -
| 0.15 -
J
0.10 -
0.05 -
o on -
0.20
0.25
•
•
: • •
• •
• •
•
0.30 0.35 0.40 0.45 0.50
Relative crack length (a/W)
•
0.55
i
•
l
•
0.60
Figure 9.8, Ratio
K„p:K
m
ax
compared
to
relative crack length
a/W),
revealing
a
tendency for
K„p
to increase to
a
peak value as
a
fraction of
Kmax)
and
then decrease again as the crack length increases.
9.2.7 Residual back face strains at zero load
It was noticed that the residual strain measured by the BFS gauge at zero load (during
the crack closure measurements) increased with KL,
max
and crack length, see Figure
8.20. When this residual strain was plotted against the ratio of the plane strain plasti
zone size (as calculated) to the width of the uncracked ligament, an almost linear
relationship emerged, as shown in Figure 8.21. This appears to be evidence that the
permanent deflection on the back face of the specimen was at least in-part due to plasti
deformation at the crack tip, in addition to any contribution from mismatch of the
fracture surface asperities.
Reid suggested that BFS could be used as a means of mapping residual stress in the CT
specimen [10], although this method has been discounted as inaccurate, at least it is
likely to provide a qualitative indication of residual stress. If the material in the c
plane was in tension prior to the growth of the crack, then a residual BFS indication

8/10/2019 The Effect of Residual Stress and Crack Closure on Fatigue Crack
http://slidepdf.com/reader/full/the-effect-of-residual-stress-and-crack-closure-on-fatigue-crack 232/304
Discussion
and
Analysis
9 21
might be expected as these stresses were released by a growing crack. However, if the
relaxation of residual stress were primarily responsible for the increasing residual BFS,
then this effect would be expected to be consistent within the range of KL,
max
studied,
provided the specimen conditions were normalised. The effect witnessed in this series
of experiments increased significantly with KL,
max
and, by inference, maximum plastic
zone size. Hence, the residual BFS was most likely to be mainly due to the deformation
in the wake of the crack, and the mismatch of fracture surface asperities, wedging the
fracture surfaces apart. This would have created (on unloading) a compressive residual
stress field at the crack tip and a tensile stress field ahead of itself, and supporting
existing theory.
If a suitable wire electric discharge machining equipment, (such as that used by Reid)
had been available, a control experiment would have been performed where instead of
growing a fatigue crack, a slot was cut in the specimen. In such a control experiment,
the BFS deflection attributable to prior residual stresses could be measured, and
additional BFS due to plasticity and/or asperity mismatch (during fatigue crack growth)
identified. Such an experiment should be performed as part of future work. More
suitable formulae than those suggested by Reid, and an appropriate fracture mechanics
solution for the CT specimen, has been described by Prime [11].
If Krfa) is the stress intensity factor due to the tensile residual stress released by a
growing crack, or by cutting, then it can be calculated from the measured BFS using
equations 9.1 and 9.2:

8/10/2019 The Effect of Residual Stress and Crack Closure on Fatigue Crack
http://slidepdf.com/reader/full/the-effect-of-residual-stress-and-crack-closure-on-fatigue-crack 233/304
Discussion and nalysis
9 22
Z(a) da
-2.532
Z(a) =
( W - a )
2
Equation
9.1
For plane strain E'= —
Equation 9.2
Z(a) is the influence function, dependent on the specimen geometry and strain
measurement (strain gauge) location. The solution above is for measurements at the
back face of the specimen directly opposite the cut or crack plane. When the BFS data
from the constant AKL experiments was used with the above formulae negative values
of Kr(a) resulted. These values of Kr(a) were of similar magnitude (but opposite sig
the values of Ko
P
measured at corresponding positions, see Table 9.2.
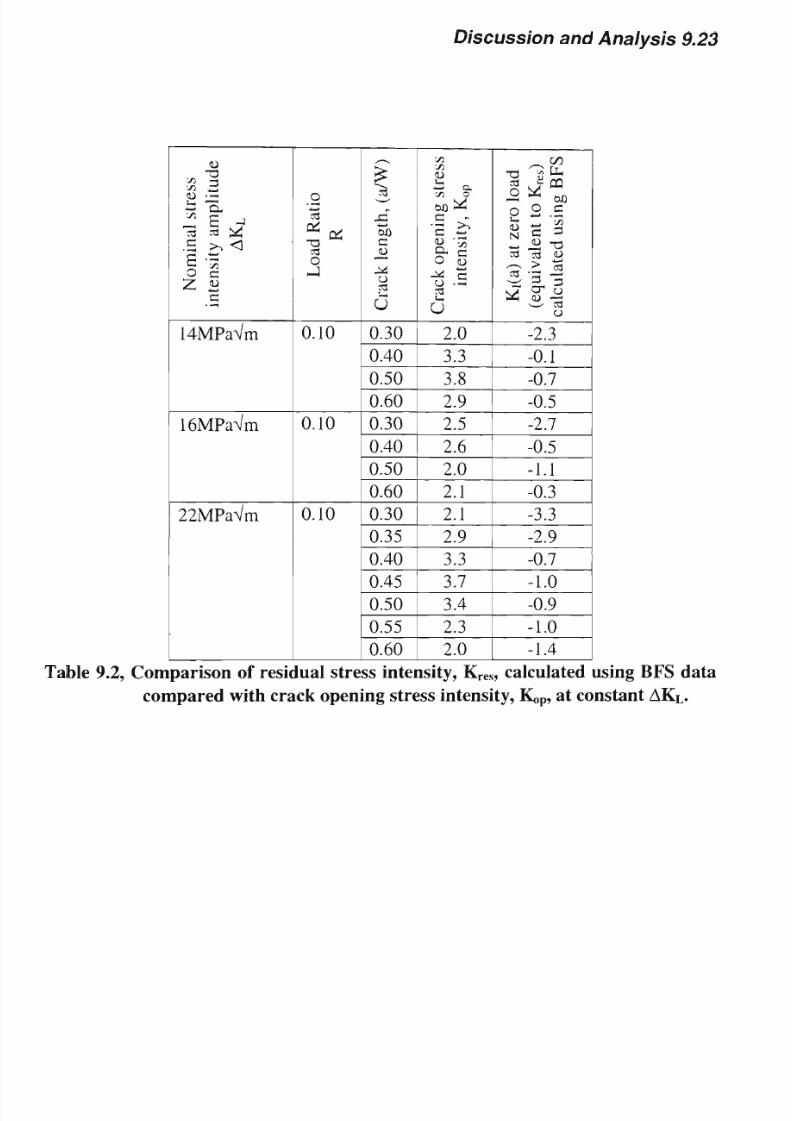
8/10/2019 The Effect of Residual Stress and Crack Closure on Fatigue Crack
http://slidepdf.com/reader/full/the-effect-of-residual-stress-and-crack-closure-on-fatigue-crack 234/304
Discussion
and
Analysis
9 23
N
o
m
i
n
a
l
t
r
e
s
s
i
n
t
e
n
s
i
t
y
A
K
L
14MPaVm
16MPaVm
22MPaVm
L
R
0.10
0.10
0.10
y£
-4—»
tofl
C
Ji
O
cd
u
0.30
0.40
0.50
0.60
0.30
0.40
0.50
0.60
0.30
0.35
0.40
0.45
0.50
0.55
0.60
C
t
r
e
s
s
i
n
t
e
n
s
i
t
y
o
p
2.0
3.3
3.8
2.9
2.5
2.6
2.0
2.1
2.1
2.9
3.3
3.7
3.4
2.3
2.0
K
a
t
c
B
F
S
-2.3
-0.1
-0.7
-0.5
-2.7
-0.5
-1.1
-0.3
-3.3
-2.9
-0.7
-1.0
-0.9
-1.0
-1.4
Table
9.2,
Comparison of residual stress intensity,
K
res
,
calculated using B F S data
compared with crack opening stress intensity,
Ko
P
,
at constant A K
L
.

8/10/2019 The Effect of Residual Stress and Crack Closure on Fatigue Crack
http://slidepdf.com/reader/full/the-effect-of-residual-stress-and-crack-closure-on-fatigue-crack 235/304
Discussion and nalysis 9.24
The same method was also applied to a specimen that had been overloaded in
compression. In this specimen the tensile residual stresses opened the crack on
unloading, and the measured K,
)p
was small, see Table 8.14. When K
res
was calculated
using equations 9.1 and 9.2, the results indicated large crack closing K
res
compared to
the low values of K
op
that were measured, see Table 9.3.
Relative crack
length a
—)
W
0.30
0.39
0.49
0.59
K
re
.s
(MPaVm)
-7.1
-2.3
-2.0
0.8
Ko
P
(MPaVm)
0.70
1.75
1.86
2.30
Table 9.3, Comparison of residual stress intensity, K
res
, calculated using B F S data
compared with crack opening stress intensity, K,,
p
, for a specimen
overloaded in compression and containing
a
tensile residual stress field
ahead of the crack tip.
Unfortunately,
the
calculated values
of K
res
in
Table
9.2 and
Table
9.3
proved
unsatisfactory compared to K<
)p
as a means of accounting for the FCG behaviour of the
specimens tested. It was judged that the residual stresses determined in this manner
were likely to be similarly inaccurate, although if the strains measured were obtained
from a cutting experiment as described then useful results might be obtained. It was
considered possible that the increments of crack length (and associated BFS
de
measurements) were too widely spaced to resolve
—
accurately enough to derive the
da
true K
res
and prior residual stresses. Hence, it was decided not to proceed with the tas
of attempting to calculate the residual stresses from the BFS data. This would have
necessitated a complex numerical integration exercise, and the data available was
judged insufficient to obtain anything conclusive from such an exercise.

8/10/2019 The Effect of Residual Stress and Crack Closure on Fatigue Crack
http://slidepdf.com/reader/full/the-effect-of-residual-stress-and-crack-closure-on-fatigue-crack 236/304
Discussion and Analysis 9.25
9.3 Fatigue crack growth and fatigue crack closure in overloaded pre-
stressed) specimens
The overloading of the CT specimens resulted in residual stresses distributions broadly
in keeping with prior expectations. However, the spatial resolution of the residual stress
measurement techniques was such that it was only possible to map the stress fields on a
macro scale prior to growing cracks through them.
9.3.1 Residual stresses and fatigue crack growth in overloaded specimens
The residual stresses generated by the compressive overload and tensile overload were
distributed according to expectations. The application of the tensile overload applied
using the clevis grips was more controlled than the compressive overload applied via
platens acting on the top and bottom edges of the specimen.
The X-ray diffraction residual stress measurements and subsequent fatigue crack growth
behaviour of the overloaded specimens displayed an impressive level of agreement. The
prior compressive residual stresses (after the specimen had been subjected to a tensile
overload) initially retarded the FCG rate considerably compared to an as-received
specimen that had not been overloaded prior to the experiment. Likewise, the tensile
residual stresses (after the specimen had been subjected to a compressive overload)
resulted in a small but significant initial acceleration of FCG rate. However, in both
cases the FCG rate tended towards that of the as-received material as the crack length
approached half the width of the specimen. It is important to note that the residual
stresses are affected by the growth of the crack. This was discussed earlier (4.4),
especially Lin and Abel's model of residual stress redistribution during fatigue [12],
which predicts the dissipation of prior residual stresses as crack length increases.
The crack growth rate, under controlled constant AKL, provided a crude means of
mapping the actual residual stress intensity (K
res
), attributable to the prior residual

8/10/2019 The Effect of Residual Stress and Crack Closure on Fatigue Crack
http://slidepdf.com/reader/full/the-effect-of-residual-stress-and-crack-closure-on-fatigue-crack 237/304
Discussion and Analysis 9.26
stresses, acting at the crack tip during the growth of the crack. This was accomplished
by comparing the crack growth rates and/or crack opening response under otherwise
similar loading conditions in the presence and absence of the prior residual stress. Wh
this was applied to the overloaded specimens, there was closer agreement between the
K
res
implied by the FCG rate and that implied by the measured K<,
p
, at a given AK
L
, for
the specimen overloaded in tension than the one overloaded in compression. This can
possibly be attributed to the larger relative error in measuring K<,
p
in the former cas
9.3.2 Crack opening response of overloaded specimens
When the crack closure data were used to calculate AKeff (=Kmax-Ko
P
) the FCG data
were normalised relative to the as received condition at R=0.5. As expected, tensile
residual stresses resulted in a lower measured K„
p
, and compressive residual stresses
resulted in higher Ko
P
.
As crack length increased, JQ,
P
tended towards the values measured in specimens that
had not been subjected to an overload cycle, see Figure 9.9 and Figure 9.10. The crack
growth rates also displayed a tendency to converge upon the behaviour of material that
had not been overloaded. However, in the case of the specimen subjected to tensile
overload Ko
P
remained much higher than for the as-received specimen even when the
crack had grown to exceed 50% of the specimen width.
The observed fatigue crack closure and fatigue crack growth behaviour seems to
confirm that the residual stresses are dissipated by the growing fatigue crack. The
beneficial effect of the compressive residual stresses, produced by the tensile overloa
persisted even for longer cracks, although at a reduced level. However, the tensile
residual stresses, generated by the compressive overload, had a much smaller effect tha
was quickly dissipated.

8/10/2019 The Effect of Residual Stress and Crack Closure on Fatigue Crack
http://slidepdf.com/reader/full/the-effect-of-residual-stress-and-crack-closure-on-fatigue-crack 238/304
Discussion and Analysis 9 27
4 0
3 5 -
3.0-
E
2.5
i
CO
s
20-
1 0
0 i -
0 0
-
^<
•
f
0.2
-
0.3 0.4 0.5 0.6
Relative crack length a/W)
0.7
• Compressive O/L
• As received
Figure 9.9, Crack opening stress intensity
(Ko
P
)
at increasing crack length for
a
specimen overloaded in compression (with tensile residual stress at
notch tip) compared with an as-received specimen fatigued at
14MPaVm, R=0.1.
9 .
Ci
E
ce 1 5 -
n.
1 10-
2
R
_
n -
0.
' ~N*__
•—+
m- - ^~ ^~m
2 0.3 0.4 0.5 0.6
R e l a t i ve c r a c k l e n g t h
a/W)
0.7
» Tensile
O/L
U A s received
Figure 9.10, Crack opening stress intensity
(Ko
P
)
at increasing crack length for a
specimen overloaded in tension (with compressive residual stress at
notch
tip)
compared with
an
as-received specimen fatigued
at
22MPaVm,
R=0.1.

8/10/2019 The Effect of Residual Stress and Crack Closure on Fatigue Crack
http://slidepdf.com/reader/full/the-effect-of-residual-stress-and-crack-closure-on-fatigue-crack 239/304
Discussion and Analysis 9.28
9.3.3 Residual back face strains in overloaded specimens at zero load
When the FCG experiments were interrupted to perform crack closure measurements, it
was noted that the back face strain (BFS) at zero load increased with crack length. It ha
already been reported that this strain was a function of K
max
and crack length (see
Figure 8.20). The BFS at zero load was compared for the overloaded specimens and for
the as received specimens subjected to similar fatigue loading conditions. It was found
that the BFS for the compressively overloaded specimen (with a tensile residual stress)
was greater than for the as received specimen, see Figure 9.11. The BFS for the
specimen that had been subjected to a tensile overload (with a compressive residual
stress) was similar to the as received specimen, see Figure 9.12.
The relaxation of tensile residual stresses (at the notch tip of the compressively
overloaded specimen), as expected, caused the fracture surfaces to effectively spring
apart. The crack was automatically opened by the residual tensile stress until the crack
had grown to such a length that the crack-opening residual stress was relieved. When
the effect of the residual tensile stress had passed, the residual stresses generated by
small scale yielding and roughness induced closure effect of asperity mismatch between
the fracture surfaces become more important. The FCG behaviour then tends toward
that in an as-received specimen. This is shown schematically in Figure 9.13.
The compressive residual stress (at the notch tip of the tensile overload specimen) was
not relieved by the growth of a fatigue crack. Additional crack-closing residual stresse
are generated by the crack itself. When the load is applied via the clevis pins, the
material in compression (due to the residual stress) either side of the crack plane will
relax towards the crack plane. The crack is closed on uploading until these stresses are
overcome. This crack opening behaviour of the overloaded specimens appears to be

8/10/2019 The Effect of Residual Stress and Crack Closure on Fatigue Crack
http://slidepdf.com/reader/full/the-effect-of-residual-stress-and-crack-closure-on-fatigue-crack 240/304
Discussion
and
Analysis 9.29
consistent with the concepts
of
partial crack opening described
by
Kang
et al
[13].
These were discussed earlier (5.6) and shown schematically in Figure 5.6.
5
(0
tt
_>
<0
0)
tt
a
E
o
o
a>
=1
CO
U.
00
-190 -,
-100 -
-80 -
-60 -
-40 -
-20 -
01
0
v ^ ^
X
/
/ * - •
l —^
2
• Compressive O/L
As received
0.3 0.4 0.5 0.6 0.7
Relative crack length (a/W)
Figure 9.11, B F S at zero load vs. crack length for a specimen overloaded in
compression (with tensile residual stress at notch tip) compared with
an as-received specimen fatigued
at
14MPaVm, R=0.1. N B : Effective
crack length (a/W)
is
0.2 at the notch
tip.
The strain instrumentation is
zeroed prior
to
application
of the
fatigue load
and
growth
of the
fatigue crack.
•Tensile
O/L
•As received
0.2 0.3 0.4 0.5
0.6 0.7
Relative crack length (a/W)
Figure
9.12,
B F S at zero load
vs.
crack length for a specimen overloaded in tension
(with compressive residual stress
at
notch tip) compared with
an
as-
received specimen fatigued at 2 2 M P a V m ,
R=0.1.

8/10/2019 The Effect of Residual Stress and Crack Closure on Fatigue Crack
http://slidepdf.com/reader/full/the-effect-of-residual-stress-and-crack-closure-on-fatigue-crack 241/304
Discussion
and
Analysis 9.30
(a)
(b)
(c)
Residual
stress
Figure 9.13, A schematic representation of the residual stress distribution in a
specimen overloaded in compression at zero load, (a) Prior to crack
growth tensile residual stress ahead of the notch root, (b) After crack
has grown a short distance, the residual stresses have been
reduced,
(c)
The crack has gr ow n more than 5 0 through the specimen the
compressive residual stresses generated by the growing crack out
weigh the prior tensile residual stress and the crack-tip opening
behaviour tends toward that of a (residual) stress free specimen.

8/10/2019 The Effect of Residual Stress and Crack Closure on Fatigue Crack
http://slidepdf.com/reader/full/the-effect-of-residual-stress-and-crack-closure-on-fatigue-crack 242/304
Discussion and Analysis 9.31
9.4 Fatigue crack growth and closure in residual stress fields introduced
by welding
The effect of residual stresses due to welding is of particular interest in the context of
the specimen material, since its designated application is in the construction of large
welded structures destined for offshore service. The experimental work discussed here
involved specimens containing a double-V butt weld that was not subjected to a stress
relieving heat treatment. However, the double-V geometry and deposition sequence of
the weld metal ensured that the residual stress distribution was such that gross specimen
distortion was avoided.
Welding processes generate large residual stresses. When the weldment has cooled to
ambient temperature, the weld metal is generally left in tension relative to the parent
metal, see Chapter 3. These residual stresses, that may adversely or positively affect the
fatigue strength of the structure, are often reduced or removed by stress-relieving heat-
treatment. However, care must be taken since such heat treatment may have an adverse
effect on the material properties, e.g. temper-embrittlement, or if performed incorrectly
resulting in an actual worsening of the residual stress condition.
Fatigue crack growth in welded structures is a complex problem, to simplify the
problem CT specimens were fabricated about a high-quality double-V butt weld.
Although the surfaces of the specimens were machined to final dimensions, no specific
stress relieving process was applied to the specimens prior to testing. Work by
Verreman, Masounave and Bailon [15] using welded specimens with more complex
geometry has established the value of measuring the crack opening response to account
for the effect of residual stresses on fatigue life.

8/10/2019 The Effect of Residual Stress and Crack Closure on Fatigue Crack
http://slidepdf.com/reader/full/the-effect-of-residual-stress-and-crack-closure-on-fatigue-crack 243/304

8/10/2019 The Effect of Residual Stress and Crack Closure on Fatigue Crack
http://slidepdf.com/reader/full/the-effect-of-residual-stress-and-crack-closure-on-fatigue-crack 244/304
Discussion and Analysis 9.33
welded specimens, due to the heat input during the welding process.
It
may also be due
to longer-range residual stress fields (also due to the welding process) continuing to
influence the crack growth behaviour. X-ray residual stress measurement of the weld
metal and adjacent parent-plate material would confirm or disprove the latter.
9.4.1.2 Crack plane parallel to the weld T-L)
The crack growth behaviour of the specimen (W2) with its crack plane parallel to the
weld (in the T-L orientation with respect to the original parent plate) was highly
consistent throughout the experiment, see Figure 8.37. The shape of the crack tip was a
remarkable feature of this specimen, being very similar to that reported by Mills and
James [3], see Figure 8.40. As expected, the crack appeared to be retarded at the centre
of the specimen parallel to the root of the double-V butt weld compared to the sides of
the specimen.
The shape of the crack implies that the sides of the specimen crack plane were in
tension relative to its centre. The virtually constant FCG rate indicated that the resid
stresses transverse to the weld were not dissipated by the growing fatigue crack.
9.4.2 Crack opening response of welded specimens
9.4.2.1 Crack plane normal to the weld L-T)
As with the overload experiments, the use of K,
)p
to calculate AKeff was reasonably
effective in normalising the FCG data. The crack opening responses of specimens Wl
and W4 were almost identical at the corresponding points where Kop was measured, see
Figure 9.14. It is inferred that once the crack had severed the weld completely, the
tensile residual stress normal to the crack plane that was associated with the weld metal
was released. The crack opening response then tends towards that of the parent plate.
The slower initial FCG rate in Wl was associated with crack growth in the (coarser

8/10/2019 The Effect of Residual Stress and Crack Closure on Fatigue Crack
http://slidepdf.com/reader/full/the-effect-of-residual-stress-and-crack-closure-on-fatigue-crack 245/304
Discussion and Analysis 9.34
grain size) weld metal
and
heat-affected
zone, and so the
crack growth rate
was
probably affected by a higher a
y
and microstructure.
fi
c
_
E
4
CO
***- 3
-
5/ P
1 -
n
f
•A
L
* = * = * = *
0.2
0.3 0.4 0.5 0.6
Relative crack length a/W
—•—W1
» W4
0.7
Figure 9.14,
A
comparison of the crack opening responses of specimens with crack
gr own from centre of
weld
into parent metal
W l ) ,
and with notch cut
through weld W4).
The
tensile residual stresses associated with
the
weld metal appear
to
have little influence
on K
o p
once
the
crack
has
severed the weld.
Where the crack
was
grown towards the weld (in specimen W 3 )
Ko
P
was
too small to
be
measured with confidence at each of the points measured. It appeared that the crack
opened-up continuously as it propagated, with the crack tip in a tensile residual s
field throughout the experiment. If the balancing tensile residual stresses opposit
weld in the parent metal were of equal magnitude W3 would have been expected to
behave like Wl, with similar values of Ko
P
at the equivalent crack length. The resul
these experiments indicated otherwise.
This result implies that the residual stress field was such that the weld metal con
large elastic tensile stresses. These appear to have been balanced by smaller tensi
compressive residual stresses spread over a larger area in the parent metal. The net
amount of strain energy stored must balance hence the relaxation of the specimen, as
indicated by the recorded change in BFS at zero load.

8/10/2019 The Effect of Residual Stress and Crack Closure on Fatigue Crack
http://slidepdf.com/reader/full/the-effect-of-residual-stress-and-crack-closure-on-fatigue-crack 246/304
Discussion and Analysis 9.35
9.4.2.2 Crack plane parallel to the weld T-L)
In specimen W2 the crack opening response was such that K,,
p
was higher than for the
specimens where the crack plane was normal to the weld. As the crack grew Ko
P
increased slightly and then fell again. The FCG rate behaved in a complementary
manner, initially decreasing and then increasing again. The residual stresses normal to
the weld were expected to be unaffected by the growth of the crack. The measured crack
opening response, K„p, implied that although the residual stresses acting normal to the
crack plane, dominated the crack opening response of the specimen, there were other
contributing factors to the crack opening response. These factors include roughness and
plasticity induced fatigue crack-closure, which are affected by crack length and crack
opening displacement.
9.4.3 Residual back face strains in welded specimens at zero load
Bertini [14] reported that a significantly larger effect on BFS due to oxide induced
closure than was due to residual stresses was possible under corrosive conditions.
However, in laboratory air the effect of "oxide wedging" was relatively minor compared
to residual stresses. Crack closure measurements derived from BFS were (as reported
here) found to be an effective means of estimating the crack opening stress intensity,
Kop, and AKeff.
9.4.3.1 Crack plane normal to the weld L-T)
Specimens Wl and W3 responded in a similar manner when the applied load was
removed, see Figure 8.43. The residual stress distribution, as shown in Figure 8.44, in
these two specimens was expected to be very similar. However, as has been discussed
above, their crack opening responses, as indicated by K,,
p
, were quite different. The BF
indication at zero load was slightly greater for specimen Wl (with the notch tip at cent

8/10/2019 The Effect of Residual Stress and Crack Closure on Fatigue Crack
http://slidepdf.com/reader/full/the-effect-of-residual-stress-and-crack-closure-on-fatigue-crack 247/304
Discussion and Analysis 9.36
of weld) than for W3 (where the back face of specimen was the centreline of the weld).
In both cases it was much greater than for a stress relieved specimen, and for specimen
W4 (where the front face of the specimen was at the centreline of the weld). The BFS
response of specimen W4 closely resembled that of a stress-relieved specimen fatigued
under similar conditions.
9.4.3.2 Crack plane parallel to the weld T-L)
This specimen (W2) displayed relaxation behaviour, as indicated by BFS, very similar
to an as received (T-L) specimen fatigued under corresponding loading conditions, see
Figure 8.41. This implies that the large tensile stresses parallel to the crack plane
exercised little influence over the relaxation of the specimen. However, they may have
contributed to a small Mode II displacement, thereby enhancing roughness induced
closure due to mismatch of the mating fracture surfaces, and fretting debris where the
fracture surfaces contacted on downloading, see Figure 8.40. Such Mode II
displacements were not measured during this work, but it is suggested that such
measurements be included in any extension of this experimental programme.
The residual stresses normal to the crack plane balanced over the thickness of the
specimen. These residual stresses were also expected to be of approximately similar
magnitude over the entire length of the crack plane. Hence, it was not unexpected that
whilst they significantly influenced the crack opening response they did not
significantly affect the relaxation of the specimen when the externally applied load wa
removed.

8/10/2019 The Effect of Residual Stress and Crack Closure on Fatigue Crack
http://slidepdf.com/reader/full/the-effect-of-residual-stress-and-crack-closure-on-fatigue-crack 248/304
Discussion and Analysis 9.37
9.5 Overview of all experimental findings
9.5.1 Residual stress measurements and FCG rates
The residual stresses measured were found to be broadly in accordance
expectations. These residual stresses had the expected effect upon fat
rates. Tensile residual stresses increased fatigue crack growth rates
value of the constant m in the Paris equation (10) when it was fitte
part of the vs. AK data.
dN
1
=C(AK)
m
dN
Equation 2.10
When a specimen was stress relieved the effect of increasing the R rat
diminished.
Although the residual stress fields investigated varied in complexity
distribution, it was clear that the residual stresses normal to the cr
primary importance. Those residual stresses parallel to the crack appe
effect on crack growth rates or on the shape of the fatigue crack.
9.5.2 Crack closure and back face strain measurements
The crack closure measurements, Ko
P
, were effective in normalising the
the range of specimens, residual stress conditions, and loading schedul
from all three groups of experiments were combined, and represented on
da
— vs. AKeff, a clear trend of Stage 2 F C G behaviour was discernible, see Figure 9.15.
dN
Regardless of the various conflicting theories relating to crack closur

8/10/2019 The Effect of Residual Stress and Crack Closure on Fatigue Crack
http://slidepdf.com/reader/full/the-effect-of-residual-stress-and-crack-closure-on-fatigue-crack 249/304

8/10/2019 The Effect of Residual Stress and Crack Closure on Fatigue Crack
http://slidepdf.com/reader/full/the-effect-of-residual-stress-and-crack-closure-on-fatigue-crack 250/304
Discussion and Analysis 9.39
The effect of K
m a x
upon residual bending/deflection of the specimen at zero load is
clearly related to the extent of plastic deformation at the crack tip, see Figure 8.20 and
Figure 8.21. This also implied that the formula commonly used to estimate the plastic
zone size (r
p
) in plane strain conditions is accurate. However, the relaxation of large
residual stresses normal to the crack plane was also clearly affected by residual stresses
Where the material ahead of the specimen's notch was in tension, the growth of a crack
was accompanied by relaxation of the specimen. This led to larger strains measured at
zero load by the BFS gauge compared to a specimen where such tensile stresses were
absent. Hence, the changing back face strain can be used in such specimens to
determine the prior tensile residual stresses.
9.5.3 Relationship between crack closure and residual stresses
The crack closure measurements clearly indicated that residual stresses affect the crack
opening/closing response as indicated by Kop/Kcj. Compressive residual stresses resulted
in higher Kop/Kd, and tensile residual stresses resulted in lower Kop/Kd. At equivalent
FCG rates the fracture surface roughness was essentially similar, although the applied
AK required to achieve these rates was much greater where there was a tensile residual
stress. Similar results were reported by Ohta et al [17], where it was found that tensile
residual stresses associated with a weld had a measurable effect upon AK
th
, and that
tensile residual stresses increased the effective stress intensity range.
Where the crack initiated in a tensile residual stress field the crack closure behaviour
tended towards that of a specimen that was (prior to the crack) relatively free of residua
stress at an early stage. In the case of a crack initiating in compressive residual stress
field, although the measured value of K,
)p
fell with increasing crack length, higher
measured values of K<,
P
(compared to specimens relatively free of residual prior
stresses) persisted. The effect of residual stresses far outweighed any crack closure

8/10/2019 The Effect of Residual Stress and Crack Closure on Fatigue Crack
http://slidepdf.com/reader/full/the-effect-of-residual-stress-and-crack-closure-on-fatigue-crack 251/304
Discussion and Analysis 9.40
contribution due to fracture surface roughness or plasticity. This phenomena, and the
effects of load sequence and overloads that were observed, agreed conceptually with
predictions generated by simulations performed by Chen and Nisitani [18] using
extended body force methods.
8/10/2019 The Effect of Residual Stress and Crack Closure on Fatigue Crack
http://slidepdf.com/reader/full/the-effect-of-residual-stress-and-crack-closure-on-fatigue-crack 252/304
Discussion and nalysis 9.41
REFEREN ES
1. Woodtli, J., Muster, W., and Radon, J.C., "Residual stress effects in fati
growth," Engineering Fracture Mechanics, 24, 3,
(1986),
pp399-412.
2. Plumbridge, W.J. and Knee, N. "Effect of heat treatment on fatigue crack g
chain steels", Materials Science Technology 3,
(1987),
pp905-911.
3. Li, S., Sun, L., Zang Q., and Wang Z., A geometric model for fatigue crac
induced by fracture surface roughness under mode I displacements," Mat. Sci.
Eng.
A150
(1992),
pp209-212.
4. Mills, W.J. and James, L.A., "Residual Stress Effects on Fatigue Crack Grow
Stainless Steel
Welds," J
Press. Vessel Tech., Trans. ASME, 109
(1987), pp336-
339.
5. Clark, G. "Modelling residual stresses and fatigue crack growth at cold-ex
fastener holes,"
Fatigue Fract. Eng. Mater. Struct.,
(1991), 14, pp579-589.
6. Dutta, V.B., Suresh, S., and Ritchie, R.O., "Fatigue crack propagation in
steels:
Effects of Ferritic-Martensitic microstructures on crack path morphology,"
Met. Trans
A.,
15
(1984), ppl 193-1207.
7. Newman, J.C., Jr., "A finite element analysis of fatigue crack closure," M
of Crack Growth, ASTM STP 590,
(1976),
pp.281-301.
8. Minakawa, K. and McEvily, A.J., "On near-threshold fatigue crack growth in
and aluminium alloys," Fatigue Thresholds, ed. J. Backlund et
al, (1981),
E M A S ,
pp373-390.
9. Drury, W.J., Gokhale A.M., Antolovich S.D., "Effect of crack surface geome
fatigue crack closure," Metallurgical Materials Transactions A-Physical
Metallurgy Materials Science, 26A
10, (1995),
pp.2651-63.
10. Reid, C.N., "A method of mapping residual stress in a compact tension spe
Scripta Metallurgica, 22
(1988),
pp453-463.
11. Prime, M.B., "Measuring residual stress and the resulting stress intensit
compact tension specimens," Fatigue Fracture of Engineering Materials and
Structures,
22
3,
(1999),
pp
195-204.
12. Lin, Y. and Abel, A., "Residual Stress Redistribution During Fatigue," in
Proceedings of the 199 Symposium of the Australian Fracture Group, ed. Mai Y.-
W.,
(1990)
Australian Fracture Group.
13. Kang, K.J., Song, J.H. and Earmme, Y.Y., "Fatigue Crack Growth and Closure
Behaviour Through a Compressive Residual Stress Field," Fatigue Fracture of
Engineering Materials Structures, 13, 1,
(1990),
ppl-13.

8/10/2019 The Effect of Residual Stress and Crack Closure on Fatigue Crack
http://slidepdf.com/reader/full/the-effect-of-residual-stress-and-crack-closure-on-fatigue-crack 253/304

8/10/2019 The Effect of Residual Stress and Crack Closure on Fatigue Crack
http://slidepdf.com/reader/full/the-effect-of-residual-stress-and-crack-closure-on-fatigue-crack 254/304
Concluding Remarks
10.1
10 Concluding Remarks
10 1 Conclusions
1. Residual stresses acting normal to the crack plane affect the crack growth rate fatigue
crack growth rates, and the shape (or profile) of the fatigue crack tip. However, those
residual stresses parallel to the crack appear to have little effect on crack growth rates
on the shape of the fatigue crack.
2. As a consequence of 1, it may be unnecessary to fully resolve the tri-axial residual
stress conditions about the crack to obtain sufficient information to perform a useful
fracture mechanics assessment of a cracked structure or component. It may often be
sufficient to know only the residual stress acting normal to the crack plane.
3. Residual stresses affect the crack opening/closing response on loading and unloading.
Compressive residual stresses lead to higher crack opening and closing stress intensities
(Kop/Kd).
4. The effect of residual stress, due to welding or local plastic deformation due to
overloading, are more influential on the fatigue crack closure effect (in the material
investigated) than contributions due to fracture surface roughness or plasticity.
5. The crack opening/closing stress intensity (Kop/Kd) provides the basis for reliable
empirical estimates of the remaining high-cycle fatigue life of a component that is
already cracked.
6. If a suitable means of measuring the crack opening/closing load response (P
op
/P
c
i) in
situ is feasible, then this could be used in conjunction with application of suitable
fracture mechanics to predict the remaining fatigue lives of cracked components with

8/10/2019 The Effect of Residual Stress and Crack Closure on Fatigue Crack
http://slidepdf.com/reader/full/the-effect-of-residual-stress-and-crack-closure-on-fatigue-crack 255/304
Concluding Remarks 10.2
greater confidence. This would be especially useful where residual stresses would
otherwise complicate such a task.
7. At near threshold crack growth rates, roughness induced fatigue-crack closure, due to
the mismatch of mating fracture surfaces and random contact of asperities, is of greater
importance than plasticity induced crack-closure close to the crack tip.
10 2 Suggestions for further work
Several possible areas of further investigation were identified in the course of the work
reported here.
1. Fatigue threshold testing could be conducted using the K
c
max
technique on a similar
selection of specimen configurations to that tested in the work reported in this thesis. In
addition to identifying a more accurate estimate of the fatigue threshold (AK
t
h) for the
specimen material, the effect of residual stresses upon the threshold could be more
accurately assessed.
2. Advanced ultrasonic techniques could be applied to investigate contact between fracture
surfaces during fatigue loading and the effect of residual stress on contact. The location
and period of contact is of some interest, especially in regard to theories of partial crac
closure. It is suggested that this investigation could form the basis of a future stand
alone project requiring specialised resources.
3. Residual stresses could be measured by a cutting method in a set of CT specimens as
tested in this work, with essentially similar residual stress distributions. This could be
compared with prior X-ray and/or neutron diffraction residual stress measurements.

8/10/2019 The Effect of Residual Stress and Crack Closure on Fatigue Crack
http://slidepdf.com/reader/full/the-effect-of-residual-stress-and-crack-closure-on-fatigue-crack 256/304
Concluding Remarks
10.3
4. A method of measuring the crack opening and closing response without the need to
interrupt the experiment could be developed. It is suggested that this could be
accomplished using a suitably adapted/programmed spectrum analyser to process the
output of a fast response strain transducer mounted in an appropriate location on a
fatigue specimen. This would enable the investigator to establish the effect of frequency
on crack closure, and investigate whether there are any material specific damping
effects on fatigue crack closure.

8/10/2019 The Effect of Residual Stress and Crack Closure on Fatigue Crack
http://slidepdf.com/reader/full/the-effect-of-residual-stress-and-crack-closure-on-fatigue-crack 257/304
ppen ix
1 1
A QuickBasic programs for control and monitoring of fatigue
tests
This program (written in Microsoft QuickBasic) records the crack length
of constant amplitude fatigue tests run on the Instron 1603 electro-mag
machine, equipped with the DC-PD system to measure crack length. These
run on an IBM PC-AT compatible computer, equipped with a Metrabyte Dash
channel analyser card and an analogue output card (CIO DAC-02). The latt
generate control signals for the mean and dynamic load settings, where
automatically during testing.
DECLARE SUB Dash8Channel (Channel%)
"DECLARE SU B OpenFile (FileName$, FileNum%)
"DECLARE S U B InputString
(InDataS, WidthField%,
AllowBlank )
6OOO66OO6606OOO6066OO FATIGUE MONITORING PROGRAM
06666666666666666666666666*
' •
This program
is
uesd
to
log
fatigue of specimens tested
on
the
INST RON •
' • 1603 fatigue testing machine using the N E C A P C IV.
WRITTEN BY: Paul Kelly &
*•
Jonathan Lloyd •
Date 25 O C T 1990
6666666666666666666666666666666666666666666666666
66666666666666666666666666s
"DECLARE SUB Dash8SingleConversion (Channel%, Value%)
"DECLARE SUB Dash8MUXLimits (LowerChannel%,
UpperChannel%)
"DECLARE SUB Dash8Error
(Mode%, ErrorValue%)
"DECLARE SUB Dash8ConfigureTimer
(CounterNum%,
Configuration%)
"DECLARE SUB Dash8Init (BaseAddress%)
"DECLARE SU B Dash8LoadTimer
(CounterNum%,
LoadData&)
"DECLARE SUB Dash8ReadTimer
(CounterNum%,
ReadValue&)
"DE CLA RE SUB Das8 (Mode%, B Y V A L D um my %, Flag%)
'" Set variables available to subprograms
"COMMON SHARED Delete$, Enter$, Backspaces, Negatives, Esc$, Home$, Ctrl
CtrlNumLock$
" C O M M O N S H A R E D
Fl$, F2$, F3$, F4$, F5$, F6$, F7$, F8$, F9$, F10$
" C O M M O N S H A R E D
CtrlF7$, CtrlF8$, CtrlF9$, CtrlFlOS

8/10/2019 The Effect of Residual Stress and Crack Closure on Fatigue Crack
http://slidepdf.com/reader/full/the-effect-of-residual-stress-and-crack-closure-on-fatigue-crack 258/304
Appendix
1 2
Setup Constants
"CONST False = 0, True = NOT False ' Set true and false
"C ON ST Pi# = 3.141592653589# ' Set pi as constant
"* The system frequency of the NEC APC IV is 8 MHz this is dived by two on the
D A S H 8 boerd so that the clock frequency feed into the D A S H 8 is halved.
"CONST SysFreq = 8000000, Dash8Freq = SysFreq / 2 ' System & Dash 8 Freq in H
"CONST SpanCounts = 4096, Span Volts = 1 0 ' Input range from A/D
"CONST Slope
Volts
=
SpanVolts
/
SpanCounts
'
Volts per A/D count
"C ONST KNperCount = 200 / SpanCounts
"* Set interrupt level & base address for location of DASH-8 board.
* Note: These are only changed on the hardware setup of the Dash 8 board.
The Interrupt
level is set
by
a
jumper.
The Base Address is set by DIP switches.
' An Interrupt level of 2 interferes with the hard Disk drive on the
N E C A P C IV computer therefore it is set to 3.
"CONST BaseAddress% = &H300, InterruptLevel% = 3
'" Set up colour values
"CONST Black% = 0
"CONST Blue% = 1
"CONST
Green%
= 2
"CONST C y a n % = 3
"CONST
Red% = 4
"CONST Magenta% = 5
"CONST Brown%
= 6
"CONST White%
= 7
"CONST Grey% = 8
"CONST LightBlue% = 9
"CONST
LightGreen% = 10
"CONST
LightCyan% =
11
"CONST
LightRed%
= 12
"CONST
LightMagenta% =
13
"CONST
Yellow% = 14
"CONST Bright
White% = 15
"CONST Flashing% =16 ' Value to add to get flashing text
"* Setup DASH-8 board arrays
* This requires an array for passing setup parameters
' and another for holding the results of logging.
8/10/2019 The Effect of Residual Stress and Crack Closure on Fatigue Crack
http://slidepdf.com/reader/full/the-effect-of-residual-stress-and-crack-closure-on-fatigue-crack 259/304
Appendix 1 3
*
Create
SSTATIC arrays
variables
"DIM D%(6)
" C O M M O N S H A R ED D%() ' Data transfer array
"* Setup arrays as SDYNAMIC stored as FAR OBJECTS. This means that they
occupy memory in
the
program variable
space.
"REM SDYNAMIC ' Set the rest of arrays to Dynamic
This array contains the data collected by the background interrupt mo
*
A/D board. The Maximum allowed
is
one 64K segment. As each
integer takes
2
* bytes the
max dimesion must be
(64k"2)-l.
This
was changed
to
allow
a REDIM statement just prior to the
use
of this
* array by
the
sampling program. This allows more program space but could cause
an
out of
memory
error to
occur when
the
R E D I M
is
executed.
"DEVI SHARED Datt%(100)
"DIM S H A R E D ChanValue%(0 T O 7)
"DIM
Volts( 1
T O 5)
" Define useful keys for input checking
"DeleteS = CHR$(0) + CHR$(83)
EnterS
=
CHRS(
13)
"Backspaces = CHRS(8)
"Negatives = CHR$(45)
'EscS =
CHR$(27)
HomeS = CHR$(0) + CHR$(71)
TtrlBreakS
=
CHR$(4)
+ CHR$(70)
CtrlNumLockS
=
CHR$(4)
+ CHR$(69)
"" Function keys
"F1S = CHR$(0) + CHR$(59)
T2$
=
CHR$(0)
+ CHR$(60)
T3S = CHR$(0) + CHR$(61)
T4$
=
CHR$(0)
+ CHR$(62)
T5$
=
CHRS(O)
+ CHR$(63)
F6S
=
CHRS(O)
+ CHR$(64)
F7S = CHR$(0) + CHR$(65)
T8S
=
CHR$(0)
+ CHR$(66)
T9$
=
CHR$(0)
+ CHR$(67)
F10S = CHR$(0) + CHR$(68)
TtrlF7$ = CHR$(0) + CHRS(IOO)
CtrlF8$
=
CHR$(0)
+
CHRS(lOl)
CtrlF9$
=
CHR$(0)
+ CHR$(102)

8/10/2019 The Effect of Residual Stress and Crack Closure on Fatigue Crack
http://slidepdf.com/reader/full/the-effect-of-residual-stress-and-crack-closure-on-fatigue-crack 260/304
Appendix
TtrlFlOS
=
CHR$(0)
+ CH R$( 103)
Define size of screen to use
"WIDTH
80,
43
~TextHeight% = 43
TextWidth% = 80
'
Text
resolution
Height
'
Text
resolution
Width
"SCREEN 9
'
Try max screen mode
"ScreenHeight% = 349
'
Graphics Resolution Height
"ScreenWidth% = 639 ' Graphics Resolution Width
"VIEW
(1,1
)-(629,
339),
Black%, Red%
' Set grahpics area
and border
'CALL
Dash8Init(BaseAddress%)
'
Configure D A S H 8 Board
"Counter%
= 0
'
Use counter 0
"CALL
Dash8ConfigureTimer(Counter%, 4) '
Setup
counter zero for event
countin
"LoadData& = 65535
' Set counts to
load
"CALL Dash8LoadTimer(Counter%, LoadData&) ' Load counter
"CAL L Dash8MUXLimits(0, 7)
"COLOR Red%
"LOCATE
43,
10
Press Esc to
Exit";
"COLOR LightGreen%
"LOCATE 5, 10
"CALL OpenFile(CrackFile$, CrackFNum%)
1
Set input channels to
scan
1
Colour for messsage
'
Bottom
line
position
1
Message
to
"CALL
Dash8ReadTimer(Counter%,
ReadValue&)
"FirstCount& = ReadValue&
StartTest = False
1
Read counter
"COLOR
Green%
"DO
'
Display
Color to
use
'
Loop
to
check inputs
C A L L
Dash8ReadTimer(Counter%,
ReadValue&)
Cycles& = 65536
-
ReadValue&
Change& = Cycles&
-
01dcycles&
StartCount& = FirstCount& - ReadValue&
IF
Change& < 0 TH E N
Change& = Change& + 65536
ENDEF
IF StartCount& <> 0 A N D StartTest = False T H E N
StartTest
= True
TotCycles& = 0
Read counter
First counts

8/10/2019 The Effect of Residual Stress and Crack Closure on Fatigue Crack
http://slidepdf.com/reader/full/the-effect-of-residual-stress-and-crack-closure-on-fatigue-crack 261/304
Appendix
1 5
Change& = Cycles&
" E N D IF
Vmax
=
0: Vmin
=
100:
Tvolts = 0
' Resets
intermediate values
" TotCycles& = TotCycles& + Change&
" FOR
1% = 1
T O 5
CALL Dash8Channel( 1)
C A L L Dash8SingleConversion(ChannelNum%,
CrackCounts%) '
Get crack
measure number
Volts(I%)
= CrackCounts%
/
SpanCounts *
Span
Volts
'
Convert
to
volts
IF
Volts(I%)
> Vmax T H E N Vmax =
Volts(I%)
IF Volts(I%) < Vmin T H E N Vmin = Volts(I%)
Tvolts
=
Tvolts
+
Volts(I%)
" N E X T I %
Crvolts
=
(Tvolts -
Vmax
- Vmin) /
3
" IF Crvolts - Crack > .005 T H E N
Crack = Crvolts
C A L L Dash8Channel(0)
C A L L
Dash8SingleConversion(ChannelNum%, MeanLoadC%)
C A L L Dash8Channel(5)
C A L L
Dash8SingleConversion(ChannelNum%, MinLoadC%)
C A L L
Dash8SingleConversion(ChannelNum%, MaxLoadC%)
C A L L Dash8SingleConversion(ChannelNum%, DynamicC%)
MeanLoad = MeanL oad C% * KNperCount
MinLoad = MinL oadC % * KNperCount
MaxLoad = MaxLoadC% * KNperCount
Dynamic = DynamicC% * KNperCount
W R I T E
#CrackFNum%,
Crack,
TotCycles&,
TIMER,
MeanLoad,
MinLoad,
MaxLoad,
Dynamic
"
END
IF "
" L O C A T E
14,
11
PRINT USING "Channel 0
level =
#.### Volts"; Crvolts
" L O C A T E 12,11
'
Position
to print
counter
" PRINT USI NG Total Cycles =###,###,###,###"; TotCycles& 'Print
counter value
" L O C A T E
16,
10
" Equiv = 4.5899 +1.116* Crvolts
" PRINT USI NG Equivalent on C R = ##.### volts ; Equiv
" L O C A T E 18, 10
" PRINT USING
Crack Length
=
##.### m m
;
-38.06 +
44.236
* (Equiv
/ 4.57) -
5.6818
*
(Equiv
/ 4.57) *
(Equiv
/
4.57)
" 01dcycles& = Cycles&
" L O C A T E
20,
10
" PRINT USI NG
Counter Value = #####"; ReadValue&
" L O C A T E 22, 10
" PRINT USING Mean Load =##.###
kN";
MeanLoad
" L O C A T E 24, 10
PRINT USING
Minimum Load = ##.### kN"; MinLoad

8/10/2019 The Effect of Residual Stress and Crack Closure on Fatigue Crack
http://slidepdf.com/reader/full/the-effect-of-residual-stress-and-crack-closure-on-fatigue-crack 262/304
Appendix 1 6
"
LOCATE
26, 10
"
PRINT USING
Maximim
Load =
##.### kN ;
MaxLoad
"
LOCATE
28,
10
" PRINT USING
Dynamic Load = ##.###
kN ;
Dynamic
/
2
alpha
=
(-38.06 + 54.236
*
(Equiv / 4.57) -
5.6818
* (Equiv / 4.57) * (Equiv /
4.57))
/ 5
" Alphaconst
= ((2
+
alpha)
/
((1
-
alpha)
A
1.5))
*
(.886 + (4.64 *
alpha)
- (13.32 * (alpha
A
2)) + (14.72
*
(alpha
3)) - (5.6
*
(alpha
4)))
" DeltaK = (((MaxLoad
-
MinLoad) * .001)
/
(.018 * (.05
A
.5))) * Alphaconst
" LOCATE
30,
10
"
PRINT USING
Delta
K
=
##.# MPa.m
A
0.5";
DeltaK
"
A$ = INKEY$
'
Check for keyboard input
"LOOP UNTIL AS = EscS ' Loop unitl exit
"CLOSE #CrackFNum%
'
Close file
"END
'
End
of
program
"REM SSTATIC
""6 666 666 666 666 666 666 6 SET DASH
8
MULTIPLEXER LIMITS
666666666666666666666666-
This procedure
is
used
to
assign channel scan
limits
for the Analogue
to •
Digital conversion using the Dash 8 Board. This
sets
the upper and •
lower channels to be scanned using one of the other
modes.
•
Parameters •
Inputs •
Channel Next channel to scan •
Outputs •
None •
NOTE: See information on Mode 2 in the Dash 8 manual •
Uses special Dash 8 assembler subroutine •
•
WRITTEN BY: Paul Kelly
Date 15 NOV
1990
*
'6666666666666666666666666666666666666666666666666
66666666666666666666666666a?
SUB Dash8Channel (Channel%)
Mode% = 2 'Set Dash 8 Mode
D%(0) =
Channel% ' Set multiplexer channel
T l a g %
= 0
'
Initialise
Flag

8/10/2019 The Effect of Residual Stress and Crack Closure on Fatigue Crack
http://slidepdf.com/reader/full/the-effect-of-residual-stress-and-crack-closure-on-fatigue-crack 263/304
Appendix
1 7
"CALL
Das8(Mode%,
VARPTR(D%(0)),
Flag%)
"* Check value returned in flag for error
TF Flag% <> 0 THEN CALL Dash8Error(Mode%, Flag%)
END
SUB
"REM SDYNAMIC
"SUB Dash8ConfigureTimer (CounterNum%, Configuration%)
"Mode% =10 'Set Dash 8 Mode
T>%(0) = CounterNum% ' Counter number
D%(
1)
=
Configuration% '
Configuration number
Tlag% =
0 ' Initialise
Flag
"CALL Das8(Mode%, VARPTR(D%(0)), Flag%)
*" Check value returned in flag for error
"IF Flag% <> 0 THEN CALL Dash8Error(Mode%, Flag%)
END SUB
"REM SSTATIC
"SUB Dash8Error
(Mode%, ErrorValue%)
SS
"Messages = "Error
+
STR$(ErrorValue%)
+
Setting up DASH-8 Board"
SS
"SELECT C A S E ErrorValue%
ss
CASEO
Messages = "No
error in
Mode
+
STR$(Mode%)
" CASE
1
Messages = Base address not known. Mode + STR$(Mode%)
" CASE 2
Messages
= "Mode Number
out of range.
Mode
+
STR$(Mode%)
"
CASE
3
Messages = Invalid base address. Mode + STR$(Mode%) + Base Address = +
HEX$(BaseAddress%)
* CASE
4
MessageS
= "MU X
scan limits out of range or reversed.
Mode
+
STR$(Mode%)
* CASE 5
MessageS = "Channel number
out of range.
Mode
+
STR$(Mode%)

8/10/2019 The Effect of Residual Stress and Crack Closure on Fatigue Crack
http://slidepdf.com/reader/full/the-effect-of-residual-stress-and-crack-closure-on-fatigue-crack 264/304
Appendix
1.8
"
CASE
6
MessageS = "A/D Timeout. Incorrect busy signal from A/D. Mode +
STR$(Mode%)
"
CASE
7
MessageS = Interrupt level out of raneg. Mode + STR$(Mode%)
CASE 8
MessageS =
Data transfer parameters out of range.
Mode
+
STR$(Mode%)
CASE
9
MessageS = Data transfer parameters out of range. Mode + STR$(Mode%)
" CA SE 10
MessageS =
Counter
number
out of range.
Mode
+
STR$(Mode%)
" CASE
11
MessageS = Counter configuration out of range. Mode + STR$(Mode%)
" CA SE 12
MessageS =
Digital output out of range.
Mode
+
STR$(Mode%)
" CAS E 13
Messages = Trigger channel out of range. Mode + STR$(Mode%)
" CASE H
MessageS =
Trigger level out of range.
Mode
+
STR$(Mode%)
" CAS E 15
MessageS =
Trigger slope not 1 or 0.
Mode
+ STR$(Mode%)
" CAS E 16
MessageS = "PGA
gain codes
illegal. Mode
+
STR$(Mode%)
" CASE 17
MessageS = "PGA
function not avalable.
Mode
+
STR$(Mode%)
CA SE 18
MessageS = "Mode
+
STR$(Mode%)
+
unavailable for this
language"
CA SE 19
MessageS = "Mode
+
STR$(Mode%)
+
not initialled as
Mode 21"
"
CASE
ELSE
MessageS = Error type unkown. Error Number + STR$(ErrorValue%) + Mode +
STRS(Mode%)
E N D SELECT
ss
TRLNT MessageS
SS
"END SUB
SS
"REM
SDYNAMIC
"SUB
Dash8Init (BaseAddress%)
T>%(0) = BaseAddress%
"Mode%
= 0
Tlag%
= 0
SS
"CALL Das8(Mode%, VARPTR(D%(0)), Flag%)
8/10/2019 The Effect of Residual Stress and Crack Closure on Fatigue Crack
http://slidepdf.com/reader/full/the-effect-of-residual-stress-and-crack-closure-on-fatigue-crack 265/304
Appendix
1 9
Check value returned
in
flag
for
error
ss
"IF Flag% <> 0 THEN CALL Dash8Error(Mode%, Flag%)
ss
"END SUB
"SUB Dash8LoadTimer (CounterNum%, LoadData&)
"* Because the counter is 16 bits wide and integers are treated as
signed integer 16
bit
form w e have to convert
to
load a number between
* 0 and 65,536.
fS
"IF
LoadData& <= 32767 T H E N
CounterData% = LoadData&
"ELSE
" CounterData% = LoadData&
-
65536
"END
IF
ss
"Mode%
=11 'Set Dash 8 Mod e
"D%(0)
=
CounterNum% '
Counter number
"D%( 1)
=
CounterData%
'
Counter load data
"Flag% = 0 ' Initialise Flag
"CALL Das8(Mode%, VARPTR(D%(0)), Flag%)
"" Check value returned in flag for error
TF Flag% o 0 THEN CALL Dash8Error(Mode%, Flag%)
ss
END SUB
"REM SSTATIC
^66666666666666666666 SET DASH
8
MULTIPLEXER LIMITS
666666666666666666666666«
This procedure is used to assign channel scan limits for the Analogue to
•
Digital conversion usisnng the Dash 8
Board.
This
sets
the upper and •
lower channels to be scanned using one
of the
other modes.
•
Parameters •
Inputs •
LowerChannel Lower channel number
to
scan •
UpperChannel Upper channel number
to
scan •
Outputs •
None •

8/10/2019 The Effect of Residual Stress and Crack Closure on Fatigue Crack
http://slidepdf.com/reader/full/the-effect-of-residual-stress-and-crack-closure-on-fatigue-crack 266/304
Appendix
1
NOTE:
See information on Mode 1 in
the
Dash
8
manual •
Uses
special
Dash
8
assembler
subroutine
•
WRITTEN BY: Paul Kelly
Date 20 M A Y 1990
""6666666666666666666666666666666666666666666666666
66666666666666666666666666a;
SS}
"SUB Dash8MUXLimits (LowerChannel%, UpperChannel%)
"Mode% = 1 'Set Dash 8 Mode
T>%(0) = LowerChannel%
D%( 1) = UpperChannel%
"Flag% = 0
' Initialise
Flag
"CALL Das8(Mode%, VARPTR(D%(0)), Flag%)
"" Check value returned in flag for error
TF Flag% o 0 THEN CALL Dash8Error(Mode%, Flag%)
"END SUB
"REM SDYNAM1C
"SUB Dash8ReadTimer
(CounterNum%,
ReadValue&)
"" Because the counter is 16 bits wide and integers are treated as
'
signed
integer 16 bit
form
we
have
to convert to
read
a
number between
0 and 65,536.
"Mode% = 12 'Set Dash 8 Mode
T)%(0) = CounterNum% '
Counter number
D%(1)
= 0 'Any value
"Flag% = 0 ' Initialise Flag
SS
"CALL Das8(Mode%,
VARPTR(D%(0)),
Flag%)
'" Check value returned in flag for error
ss
'TF
Flag% <> 0 T H E N C A L L Dash8Error(Mode%,
Flag%)
sS
TounterData% = D%(l)
ss
TF CounterData% < 0 T H E N

8/10/2019 The Effect of Residual Stress and Crack Closure on Fatigue Crack
http://slidepdf.com/reader/full/the-effect-of-residual-stress-and-crack-closure-on-fatigue-crack 267/304
"
ReadValue& = CounterData% + 65536
"ELSE
ReadValue&
= CounterData%
"END IF
"END
SUB
ss
"SUB Dash8SingleConversion (Channel%, Value%)
ss
* Do a single A/d conversion on curently selected channel
*
then increment
M U X
selection
to
next channel
SS
"Mode% = 4 'Set Dash 8 Mode
Tlag% = 0 ' Initialise Flag
"CALL Das8(Mode%, VARPTR(D%(0)), Flag%)
ss
*
Check value returned
in flag for error
ss
TF Flag%
<>
0 T H E N C A L L Dash8Error(Mode%,
Flag%)
sS
Convert
data
returned from channel
Converted
data is
stored
as
an
integer variable in 2's
complement
ss, r
I.e.
ssj
~ Channel number Enabled
D7 D6 D5 D4 D3 D2
Dl
DO
High Byte
Bl 0 MA2
MAI
MAO B2 B3 B4
SS}
Sign M U X Address A/D data
Channel number Disabled
D7 D6 D5 D4 D3 D2
Dl
DO
High Byte Bl 0 0 0 0 B2 B3 B4
Sign A/D data
ss
B5
B6 B7 B8 B9 BIO Bll B12
Low Byte
A/D data (LSB)
&H7800 = 0111 1000 0000 0000
&H8000 = 1000 0000 0000 0000
& H 8 7 F F =
1000 0111 1111 1111

8/10/2019 The Effect of Residual Stress and Crack Closure on Fatigue Crack
http://slidepdf.com/reader/full/the-effect-of-residual-stress-and-crack-closure-on-fatigue-crack 268/304
Appendix 1 12
"Value% = D%(0)
END SUB
"REM SSTATIC
"SUB Dash8WriteDigitalOutput
(Outl.
0ut2, Out3, 0ut4)
The output data represents 4 bits decimal 0 to 15.
•
Out
1 to
4
are logical values
False=0 and
true
=
-1
ss
"DigitalOut% = Out4 * -8 + Out3 * -4 + Out2 * -2 + Outl * -1
"Mode% =1 4
'Set
Dash 8 Mode
D%(0) = DigitalOut% ' OutputData
"Flag%
= 0
' Initialise
Flag
"CALL Das8(Mode%, VARPTR(D%(0)), Flag%)
*" Check value returned in flag for error
TF Flag% <> 0 THEN CALL Dash8Error(Mode%, Flag%)
"END SUB
"SUB InputString (InDataS, WidthField%, AllowBlank)
ss
"CursorLine% = CSRLIN ' Store current cursor position.
"CursorRow% =
POS(O) '
Line & Row Number
SS
STRING$(WidthField%, ); ' Clear input
area
"DO
" In$ = INKEY$ ' Read Keyboard
ss
SELECT CASE In$ ' Action based on input
C A S E
'
Do Nothing
C A S E Backspaces,
DeleteS '
Backspace
or Delete
key
Chars% =
LEN(InDataS) '
Find length
of string
IF
Chars%
> 0 T H E N InDataS = LEFT$(InData$,
Chars%
- 1)
'
Remove
last
character
C A S E
EnterS ' Enter
key pressed
IF InDataS <>
TH EN EXIT D O
'
Quit
if a String
entered
C A S E ' Blank input
IF
AllowBlank
= True TH E N
' If blanks
allowed
in
string
InDataS = InDataS +
In$ '
Add blank

8/10/2019 The Effect of Residual Stress and Crack Closure on Fatigue Crack
http://slidepdf.com/reader/full/the-effect-of-residual-stress-and-crack-closure-on-fatigue-crack 269/304
Appendix
1 13
^ S E '
Blanks
not
allowed
L O C A T E
41,
5
PRINT "Blanks
not
allowed";
E N D IF
CA SE ELSE
'
Anything
other
key
InDataS = InDataS +
In$ '
Add
to
string
" E N D SELEC T
ss
LOCATE CursorLine%, CursorRow% ' Starting position
InDataS = LEFT$(InData$,
WidthField%) '
Truncate
to
width
of input field
PRINT InDataS + ; ' Print current string
LOOP '
Loop
until
exited
"END SUB
"SUB OpenFile (FileNameS,
FileNum%)
"CursorLine% = CSRLLN ' Store current cursor position.
"CursorRow% =
POS(O) *
Line & Row Number
"PRINT "Input Directory in form Drive:\Path\ ";
"CALL InputString(Directory$,
30,
False)
T O C A T E CursorLine% +
2,
10
T R I N T Input FileName ";
"CALL InputString(FileName$, 8, False)
"FileNameS =
DirectoryS
+ FileNameS + ".FAT"
"FileNum%
=
FREEFILE
ss
"OPEN FileNameS FOR OUTPUT AS FileNum%
TOCATE
10,
10
TRINT
Start machine NOW Within 5 seconds"
delay =
TIMER
"WHILE TIMER
< delay + 10
"WEND
TOCATE
10,
10
TRINT
ss
END SUB
The following program
is
designed
to
do much
the
same
as
the preceding one except
that it
adds the facility to run constant AK tests. This is done by monitoring t

8/10/2019 The Effect of Residual Stress and Crack Closure on Fatigue Crack
http://slidepdf.com/reader/full/the-effect-of-residual-stress-and-crack-closure-on-fatigue-crack 270/304
Appendix
1 14
the D C-PD system and computing the mean and dynamic load settings required to maintain
the desired AK and R values.
D E C L A R E SUB loadadjust (al, aO, W , dK, R, LC, Gfactor, alpha, Alphaconst, deltaP,
Pmax, Pmin. MeanLoad, Demand, M L
Volts,
DL
Volts,
ChannelO%, Channel 1%, LSB0%,
MS B0 %, LSB1%, MSB1%)
"DECLARE SU B setup (W ,
B , R ,
dK , aO , Gfactor , LC ,
aFin,
increment)
OOOOOOOOOO CO NS TA NT STRESS AMPL ITUD E FATIGUE TEST P R O G R A M
66666666666666660-
This program is controls and logs constant delta K (stress intensity •
amplitude) fatigue tests
on
the
Instron
1603
E M R
fatigue
machine using •
the
N E C A P C IV equipped with MetraByte Dash 8 and CIO DAC02 boards
WRITTEN BY: Jonathan Lloyd and Paul Kelly
Department
of Materials
Engineering, •
University
of
Wollongong, N S W 2500, Australia
Date May 1991
'6666666666666666666666666666666666666666666666666
66666666666666666666666666ae
"DECLARE SUB Dash8SingleConversion (Channel%, Value%)
"DECLARE SU B Dash8MUXLimits (LowerChannel%,
UpperChannel%)
"DECLARE S U B Dash8Error (Mode%,
ErrorValue%)
"DECLARE S U B Dash8ConfigureTimer (CounterNum%, Configuration%)
"DECLARE S U B Dash8Init
(BaseAddress%)
"DECLARE SU B Dash8LoadTimer
(CounterNum%,
LoadData&)
"DECLARE SU B Dash8ReadTimer (CounterNum%, ReadValue&)
"DE CLA RE S UB Das8 (Mode%, B Y V A L
D u m m y % ,
Flag%)
"DECLARE SU B Dash8Channel
(Channel%)
"DECLARE S U B OpenFile (FileNameS,
FileNum%)
"DECLARE S U B InputString (InDataS, WidthField%, AllowBlank )
'" Set variables available to subprograms
"COMMON SHARED DeleteS, EnterS, Backspaces, Negatives, EscS, HomeS, CtrlB
CtrlNumLockS
" C O M M O N S H A R E D
F1S, F2$, F3S, F4S, F5S, F6$, F7$, F8$, F9$,
F10$
" C O M M O N S H A R E D CtrlF7$, CtrlF8$, CtrlF9$,
CtrlFlOS
'
Setup Constants
ss
"CONST False = 0, True = NOT False ' Set true and false

8/10/2019 The Effect of Residual Stress and Crack Closure on Fatigue Crack
http://slidepdf.com/reader/full/the-effect-of-residual-stress-and-crack-closure-on-fatigue-crack 271/304
Appendix
1 15
"CONST
Pi# = 3.141592653589* ' Set pi as
constant
The system frequency of the NEC APC IV is 8 MHz this is divided by two
* D A S H 8 board so that the clock frequency feed into the D A S H 8 is halved.
"CONST SysFreq = 8000000, Dash8Freq = SysFreq / 2 ' System & Dash 8 F
"CONST SpanCounts = 4096, Span Volts =
10 ' Input range
from A/D
"CONST Slope
Volts
= Span Volts / SpanCounts ' Volts per A/D count
"C ONST KNperCount
=
200
/
SpanCounts
ss
Set interrupt level & base address for location of DASH-8 board.
Note:
These
are
only changed on
the
hardware setup
of the
Dash 8 board.
The
Interrupt level is set
by
a
jumper.
The Base Address
is set
by DIP switches.
' An Interrupt level of 2 interferes with the hard Disk drive on the
NEC AP C IV
computer
therefore it is set to
3.
"CONST BaseAddress% = &H300, InterruptLevel% = 3
"CONST DACadr % = &H310: 'base address of DAC0 2
' Set
up
colour
values
"CONST Black% = 0
"CONST
Blue%
= 1
"CONST
Green% = 2
"CONS T Cyan% = 3
"CONST
Red% = 4
"CONST Magenta% = 5
"CONST Brown%
= 6
"CONST White%
= 7
"CONST
Grey% = 8
"CONST LightBlue% = 9
"CONST
LightGreen% = 10
"CONST
LightCyan% =
11
"CONST
LightRed%
= 12
"CONST
LightMagenta%
= 13
"CONST
Yellow% = 14
"CONST
Brightwhite% = 15
"CONST Flashing% =16 ' Value to add to
get
lashing ext
ss
~ Setup DASH-8 board arrays
This requires an array for passing setup parameters
*
and another
for
holding
the results of
logging.
ss
Create
SSTATIC arrays
variables
"DIM D%(6)
" C O M M O N S H A RE D
D%() '
Data
transfer
array

8/10/2019 The Effect of Residual Stress and Crack Closure on Fatigue Crack
http://slidepdf.com/reader/full/the-effect-of-residual-stress-and-crack-closure-on-fatigue-crack 272/304
Appendix 1 16
*
Setup
arrays as SDYNAM1C
stored
as FAR
OBJECTS.
This
means
that
they don't
*
occupy memory
in the
program variable
space.
sS
"REM
SDYNAMIC '
Set
the rest of arrays to
Dynamic
SS
This array
contains
the
data
collected by
the
background
interrupt
mode
of
A/D
board.
The
Maximum allowed is one 64K segment. As each integer takes 2
bytes the max
dimesion must be
(64k"2)-1.
* This
was changed
to
allow
a
R E D I M
statement just prior to the
use
of this
*
array by the sampling
program.
This
allows
more program
space but
could cause
*
an
out
of
memory
error
to
occur when
the
REDIM
is
executed.
"DEVI SHARED Datt%( 100)
DEVI S H A R E D ChanValue%(0 TO 7)
DEVI Volts( 1 TO 5)
s
Define
useful
keys
for input
checking
"DeleteS = CHR$(0) + CHR$(83)
TnterS
=
CHRS(13)
TackspaceS
= CHR$(8)
"Negatives = CHR$(45)
Tsc$ =
CHRS(27)
HomeS
=
CHR$(0)
+
CHR$(71)
CtrlBreakS = CHR$(4) + CHR$(70)
CtrlNumLockS = CHR$(4) +
CHR$(69)
ss
Function keys
T1S =
T2$
=
T3$
=
T4$
=
T5$ =
T6$
=
T7S
=
T8S
=
T9$ =
T10S
-. CHR$(0)
=
CHR$(0)
=
CHR$(0)
=
CHR$(0)
= CHR$(0)
=
CHR$(0)
=
CHR$(0)
= CHRS(O)
=
CHR$(0)
+ CHR$(59)
+ CHR$(60)
+ CHR$(61)
+ CHR$(62)
+ CHR$(63)
+ CHR$(64)
+ CHR$(65)
+ CHR$(66)
+ CHR$(67)
=
CHR$(0)
+ CHR$(68)
"CtrlF7$
=
CHR$(0)
+
CHR$( 100)
"CtrlFSS = CHR$(0) + CHR$( 101)
"CtrlF9$ = CHR$(0) + CHR$( 102)
"CtrlFlOS
=
CHR$(0)
+ CHR$(103)
* Define size of screen to use
SS

8/10/2019 The Effect of Residual Stress and Crack Closure on Fatigue Crack
http://slidepdf.com/reader/full/the-effect-of-residual-stress-and-crack-closure-on-fatigue-crack 273/304
Appendix 1
" W I D T H
80,
43
*TextHeight% = 43
'
Text resolution Height
TextWidth%
= 80
'
Text resolution Width
"SCREEN 9 ' Try max screen mode
"ScreenHeight% = 349
'
Graphics Resolution Height
"ScreenWidth%
= 639 ' Graphics Resolution Width
"VIEW (1,1
)-(629,
339), Black%,
R e d %
' Set grahpics area and border
"CALL Dash8Init(BaseAddress%) ' Configure DASH 8 Board
"Counter% = 0 ' Use counter 0
"CALL Dash8ConfigureTimer(Counter%,
4) '
Setup counter zero
for
event countin
ToadData& = 65535 ' Set counts
to
load
"CALL Dash8LoadTimer(Counter%, LoadData&) ' Load counter
"CALL Dash8MUXLimits(0, 7) ' Set input channels to scan
"al = 0: aPrevious = 0: 'sets values to zero
"CLS
"CALL
setup(W, B,
R, dK, aO, Gfactor,
LC, aFin,
increment)
"CLS
"COLOR Red% ' Colour for messsage
T O C A T E
43,
10
'
Bottom
line
position
T R E N T
Press Esc to Exit"; ' Message to print
" C OL O R LightGreen%
T O C A T E 5, 10
"CALL OpenFile(CrackFile$,
CrackFNum%)
"CALL Dash8ReadTimer(Counter%,
ReadValue&) '
Read counter
TirstCount& = ReadValue&
"StartTest = False
"COLOR Green% ' Display Color to use
"DO
'
Loop to check inputs
" CALL Dash8ReadTimer(Counter%, ReadValue&) ' Read counter
" Cycles& = 65536
-
ReadValue&
Change& = Cycles& - 01dcycles&
" StartCount& = FirstCount& - ReadValue&
"
IF
Change&
<
0 T H E N
Change& = Change& + 65536
" E N D IF
"
IF StartCount&
< > 0 A N D
StartTest
=
False T H E N ' First counts
StartTest = True
TotCycles& = 0

8/10/2019 The Effect of Residual Stress and Crack Closure on Fatigue Crack
http://slidepdf.com/reader/full/the-effect-of-residual-stress-and-crack-closure-on-fatigue-crack 274/304
Appendix
1 18
CTime
= 0
Change& = Cycles&
"
END
IF
Vmax = 0: Vmin = 100: Tvolts = 0 ' Resets intermed values
" TotCycles& = TotCycles& + Change&
" FOR
1%
=
1
T O 5
C A L L Dash8Channel( 1)
C A L L Dash8SingleConversion(ChannelNum%, CrackCounts%) ' Get crack
measure number
Volts(I%)
= CrackCounts%
/
SpanCounts
*
SpanVolts
'
Convert
to
volts
IF Volts(I%) > Vmax TH E N Vmax = Volts(I%)
IF
Volts(I%)
< Vmin TH E N Vmin =
Volts(I%)
Tvolts =
Tvolts
+
Volts(I%)
" N E X T I %
Crvolts = (Tvolts - Vmax - Vmin) / 3
" IF
Crvolts -
Crack >
.005
T H E N
Crack = Crvolts
C A L L Dash8Channel(0)
C A L L Dash8SingleConversion(ChannelNum%, MeanLoadC%)
C A L L Dash8Channel(5)
C A L L
Dash8SingleConversion(ChannelNum%, MinLoadC%)
C A L L Dash8SingleConversion(ChannelNum%, MaxLoadC%)
C A L L
Dash8SingleConversion(ChannelNum%, DynamicC%)
MeanLoad = MeanLoadC% * KNperCount
MinLoad = MinLoadC% * KNperCount
MaxLoad = Ma xLo ad C% * KNperCount
Dynamic = DynamicC% * KNperCount
W R I T E
#CrackFNum%,
Crack, TotCycles&, TIMER,
MeanLoad,
MinLoad,
MaxLoad,
Dynamic
"
END IF
'
"
IF TEMER - CTime
> 300 T H E N
CTime = TEVIER
C A L L Dash8Channel(0)
C A L L
Dash8SingleConversion(ChannelNum%, MeanLoadC%)
C A L L Dash8Channel(5)
C A L L
Dash8SingleConversion(ChannelNum%, MinLoadC%)
C A L L Dash8SingleConversion(ChannelNum%, MaxLoadC%)
C A L L
Dash8SingleConversion(ChannelNum%, DynamicC%)
MeanLoad = MeanLoadC%
*
KNperCount
MinLoad = MinLoadC%
*
KNperCount
MaxLoad = Max Lo adC % * KNperCount
Dynamic = DynamicC% * KNperCount
W R I T E
#CrackFNum%,
Crack, TotCycles&, TIMER,
MeanLoad,
MinLoad,
MaxLoad,
Dynamic
" END IF '
" L O C A T E 12, 10
" PRINT USI NG
Volts
on Channel
1
##.### V"; Crvolts

8/10/2019 The Effect of Residual Stress and Crack Closure on Fatigue Crack
http://slidepdf.com/reader/full/the-effect-of-residual-stress-and-crack-closure-on-fatigue-crack 275/304
Appendix
1 19
L O C A T E
16,
10
'
Position
to print
counter
PRINT USING
Cycles value ###,###,###
;
TotCycles&
counter
value
" L O C A T E 14, 10
" Equiv = 4.6030568# +
1.10754 *
Crvolts
" PRINT USI NG
Equivalent on C R = ##.### V"; Equiv
" L O C A T E
18,
10
al = -38.363 + 44.57 * (Equiv / 4.57) - 5.7726 * (Equiv / 4.57) * (Equiv / 4.57)
" PRINT USIN G
Crack Length = ##.### m m
;
al
IF
al -
aPrevious > increment T H E N
C A L L loadadjust(al, aO, W , dK, R, LC, Gfactor, alpha, Alphaconst, deltaP, Pmax,
Pmin,
MeanLoad, Demand, M L
Volts,
DLVolts, Channel0%, Channell%,
LSB0% ,
MS B0%, LSBl%, MSB1%)
aPrevious
= al
"
END
IF
01dcycles& = Cycles&
" LOCATE
20,
10
"
USING
delta
K =
##.#MPa.m
A
'";
dK
" LOCATE 22, 10
" PRINT USING Mean Load =##.###
kN";
MeanLoad
" LOCATE
24.
10
USING
Minimum Load =
##.###
kN"; MinLoad
" LOCATE 26, 10
" PRINT USING Maximum Load = ##.###
kN";
MaxLoad
" LOCATE 28, 10
"
PRTNT
USING
Dynamic Load =
##.###
kN"; Dynamic
" LOCATE 31, 10
" PRINT USING
Actual
R
Ratio
=
#.### ;
MinLoad
/
MaxLoad
" LOCATE 30, 10
" PRINT USING
R
value input
=
#.### ;
R
" A$ = INKEY$ ' Check for keyboard input
TOOP UNTIL AS = Esc$ OR al > aFin ' Loop unitl exit
' Remove
load i.e.
set
mean and dynamic
to zero to stop test
"OUT &H310, 0: OU T &H311, 128
"OUT &H312,
0:
O U T &H313, 128
"CLOSE
#CrackFNum% '
Close file
'END ' End of program
ss
"REM SSTATIC
66666666666666666666 SET DASH 8 MULTIPLEXER LIMITS
066666666666666666666666*
* •
This procedure
is
used
to set the next
channel
to
be used
for
Analog
to
•
• Digital
conversion usisnng
the
Dash 8 Board. •
' .
' •
Parameters •

8/10/2019 The Effect of Residual Stress and Crack Closure on Fatigue Crack
http://slidepdf.com/reader/full/the-effect-of-residual-stress-and-crack-closure-on-fatigue-crack 276/304
Appendix 1 20
Inputs .
Channel Next
channel to
scan
Outputs •
None •
NOTE: See information on Mode 2 in the Dash 8 manual
Uses special Dash 8 assembler subroutine •
WRITTEN BY: Paul Kelly
Date
15
NOV 1990
"" 0666666666666666666666666666666666666666666666666
66666666666666666666666666ce
s\
"SUB Dash8Channel (Channel%)
"Mode% = 2 'Set Dash 8 Mode
T)%(0) = Channel% ' Set multiplexer channel
Tlag% = 0 ' Initialise
Flag
"CALL Das8(Mode%, VARPTR(D%(0)), Flag%)
TF Flag% <> 0 THEN CALL Dash8Error(Mode%, Flag%)' Check value for error
TNDSUB
"REM SDYNAMIC
"SUB Dash8ConfigureTimer
(CounterNum%, Configuration%)
"Mode%
=10 'Set
Dash 8 Mode
T)%(0)
=
CounterNum% '
Counter number
T)%(1) = Configuration% ' Configuration number
Tlag% = 0 ' Initialise Flag
"CALL Das8(Mode%, VARPTR(D%(0)), Flag%)
'" Check value returned in flag for error
"IF Flag% <> 0 THEN CALL Dash8Error(Mode%, Flag%)
END SUB
ss
"REM SSTATIC
"SUB Dash8Error (Mode%,
ErrorVaIue%)
"MessageS = "Error" + STR$(ErrorValue%) + " Setting up DASH-8 Board"

8/10/2019 The Effect of Residual Stress and Crack Closure on Fatigue Crack
http://slidepdf.com/reader/full/the-effect-of-residual-stress-and-crack-closure-on-fatigue-crack 277/304
Appendix
1 21
"SELECT C A S E ErrorValue%
" CASEO
MessageS = "No
error in
Mode
+
STR$(Mode%)
" CA S E 1
MessageS = "Base address not known. Mod e + STR$(Mode%)
"
CASE
2
MessageS = "Mode Number
out of range.
Mode
+
STR$(Mode%)
"
CASE
3
MessageS = "Invalid base address. Mode + STR$(Mode%) + Base Address = +
HEX$(BaseAddress%)
"
CASE
4
MessageS = " M U X scan
limits out of range or reversed.
Mode
+
STR$(Mode%)
" CASE 5
MessageS = "Channel number
out of range.
Mode
+
STR$(Mode%)
"
CASE
6
MessageS = "A/D Timeout. Incorrect busy signal from A/D. Mod e +
STR$(Mode%)
"
CASE
7
MessageS =
Interrupt level out of
raneg. Mode
+ STR$(Mode%)
" CASE 8
MessageS = "Data
transfer parameters out of range.
Mode
+
STR$(Mode%)
"
CASE
9
MessageS = "Data
transfer parameters out of
range. Mode
+
STR$(Mode%)
" C A S E 10
MessageS = "Counter number
out of range.
Mode
+
STR$(Mode%)
" CASE
11
MessageS = "Counter configuration out of range. Mode + STR$(Mode%)
" C A S E 12
MessageS =
Digital
output
out of range.
Mode
+
STR$(Mode%)
" C A S E 13
MessageS = Trigger channel out of range. Mode + STR$(Mode%)
" C A S E 14
MessageS =
Trigger level out of range.
Mode
+
STR$(Mode%)
" C A S E 15
MessageS = "Trigger slope not 1 or 0. Mode + STR$(Mode%)
" C A S E 16
MessageS = "PGA gain codes illegal. Mode
+
STR$(Mode%)
" C A S E 17
MessageS = "PGA function not avalable. Mode + STR$(Mode%)
" C A S E 18
MessageS = "Mode
+
STR$(Mode%)
+
unavailable
for this
language"
" CASE 19
MessageS = "Mode + STR$(Mode%) + not initialled as Mode 21"
"
CASE
ELSE

8/10/2019 The Effect of Residual Stress and Crack Closure on Fatigue Crack
http://slidepdf.com/reader/full/the-effect-of-residual-stress-and-crack-closure-on-fatigue-crack 278/304
Appendix 1 22
MessageS =
Error type
unkown.
Error
Number
+
STR$(ErrorValue%)
+
Mode
+
STR$(Mode%)
T N D SELECT
TRINT MessageS
TND SUB
"REM SDYNAMIC
"SUB Dash8Init
(BaseAddress%)
T)%(0) = BaseAddress%
"Mode%
= 0
Tlag%
= 0
"CALL Das8(Mode%, VARPTR(D%(0)), Flag%)
"* Check value returned in flag for error
TF Flag% <> 0 THEN CALL Dash8Error(Mode%, Flag%)
END SUB
"SUB Dash8LoadTimer (CounterNum%, LoadData&)
'" Because the counter is 16 bits wide and integers are treated as
' signed integer 16
bit
form
w e
have to convert
to
load a number between
-
0 and 65,536.
"IF LoadData& <= 32767 THEN
CounterData%
=
LoadData&
ELSE
CounterData% = LoadData&
-
65536
END
IF
"Mode% =11 'Set Dash 8 Mode
T)%(0)
=
CounterNum% ' Counter
number
D%( 1) = CounterData% ' Counter load data
Tlag% = 0 ' Initialise Flag
"CALL Das8(Mode%, VARPTR(D%(0)), Flag%)
ss
'" Check value returned in flag for error
ss
TF Flag% <> 0 THEN CALL Dash8Error(Mode%, Flag%)
ss
TND SUB
8/10/2019 The Effect of Residual Stress and Crack Closure on Fatigue Crack
http://slidepdf.com/reader/full/the-effect-of-residual-stress-and-crack-closure-on-fatigue-crack 279/304
Appendix
1
REMSSTATIC
799999990000000666666 SET DASH 8 MULTIPLEXER LIMITS
OOOOOOOOo666666666666666«
This procedure is used to assign channel scan limits for the Analogue to •
Digital conversion usisnng the Dash 8 Board. This sets the upper and •
lower channels to be scanned using one of the other modes.
Parameters .
Inputs
LowerChannel Lower channel number to scan
UpperChannel Upper channel number to scan
Outputs .
None •
NOTE: See information on Mode 1 in the Dash 8 manual
Uses special Dash 8 assembler subroutine
WRITTEN BY: Paul Kelly
Date 20 MAY 1990
0000000000000666666666666633
"SUB Dash8MUXLimits (LowerChannel %, UpperChannel%)
"Mode% =1 'Set Dash 8 Mode
T)%(0) = LowerChannel%
T)%(1) = UpperChannel%
Tlag% = 0 ' Initialise Flag
CALL
Das8(Mode%, VARPTR(D%(0)), Flag%)
'" Check value returned in flag for error
ss
TF Flag% 0 0 THEN CALL Dash8Error(Mode%, Flag%)
ss
END SUB
ss
"REM SDYNAMIC
"SUB Dash8ReadTimer (CounterNum%, ReadValue&)
ss
'
Because the counter is 16 bits wide and integers are treated as

8/10/2019 The Effect of Residual Stress and Crack Closure on Fatigue Crack
http://slidepdf.com/reader/full/the-effect-of-residual-stress-and-crack-closure-on-fatigue-crack 280/304
•
signed integer
16 bit
form we have
to convert to
read
a
number between
*
0 and 65,536.
"Mode% =12 'Set Dash 8 Mode
T>%(0)
=
CounterNum% '
Counter number
T>%(1)
= 0
'Any
value
Tlag% = 0
' Initialise
Flag
"CALL Das8(Mode%, VARPTR(D%(0)), Flag%)
"* Check value returned in flag for error
TF Flag% o 0 THEN CALL Dash8Error(Mode%, Flag%)
"CounterData% = D%(1)
TF CounterData% < 0 THEN
" ReadValue& = CounterData% + 65536
TLSE
" ReadValue& = CounterData%
TNDEF
T ND SUB
"SUB Dash8SingleConversion (Channel%, Value%)
* Do a single A/d conversion on curently selected channel
' then
increment M U X
selection to next
channel
"Mode% = 4 'Set Dash 8 Mode
Tlag% = 0
' Initialise
Flag
"CALL Das8(Mode%, VARPTR(D%(0)), Flag%)
'" Check value returned in flag for error
TF Flag% <> 0 THEN CALL Dash8Error(Mode%, Flag%)
"" Convert data returned from channel
' Converted data is stored as an integer variable in
2's
complement
T
I.e.
"" Channel number Enabled
D7 D6 D5 D4 D3 D2
Dl
DO
High Byte Bl 0 MA2 MAI MAO B2 B3 B4

8/10/2019 The Effect of Residual Stress and Crack Closure on Fatigue Crack
http://slidepdf.com/reader/full/the-effect-of-residual-stress-and-crack-closure-on-fatigue-crack 281/304
Sign M U X Address A/D data
Channel number Disabled
D7 D6 D5 D4 D3 D2
Dl
DO
High Byte Bl 0 0 0 0 B2 B3 B4
Sign A/D data
B5 B6 B7 B8 B9 BIO Bll B12
Low Byte
A/D
data
(LSB)
* &H7800 =
0111
1000 OOOO 0000
* &H8000 =
1000
0000 0000 0000
- &H87FF=
1000 0111
1111 1111
"Value% = D%(0)
TND SUB
"REM SSTATIC
"SUB Dash8WriteDigitalOutput (Outl,
Out2,
Out3,
Out4)
" The output data represents 4 bits decimal 0 to 15.
'
Out
1 to 4 are logical values
False=0 and
true =
-1
T>igitalOut% = Out4 * -8 + Out3 * -4 + Out2 * -2 + Outl * -1
"Mode% = 14
' Set
Dash 8 Mode
T>%(0)
= DigitalOut%
'
OutputData
Tlag% = 0 ' Initialise Flag
"CALL Das8(Mode%, VARPTR(D%(0)), Flag%)
'" Check value returned in flag for error
'TF Flag% <> 0 THEN CALL Dash8Error(Mode%, Flag%)
END SUB
"SUB InputString (InDataS, WidthField%, AllowBlank)
ss
"CursorLine% = CSRLIN ' Store current cursor position.
"CursorRow%
= POS(0) '
Line
& Row
Number

8/10/2019 The Effect of Residual Stress and Crack Closure on Fatigue Crack
http://slidepdf.com/reader/full/the-effect-of-residual-stress-and-crack-closure-on-fatigue-crack 282/304
ppen ix 1 26
T R I N T
STRING$(WidthField%, ); '
Clear
input
area
"DO
In$
=
INKEYS '
Read Keyboard
SELECT CASE In$ ' Action based on input
CASE""
'Do Nothing
C A S E
Backspaces, DeleteS '
Backspace
or Delete
key
Chars% =
LEN(InDataS) '
Find
length of string
EF Chars% > 0 T H E N InDataS = LEFT$(InData$, Chars% - 1)
'
Remove
last
character
C A S E
EnterS ' Enter
key pressed
EF InDataS <>
T H E N EXIT D O
'
Quit
if a String
entered
C A S E ' Blank input
EF AllowBlank = True T H E N
' If blanks
allowed
in
string
InDataS = InDataS +
In$ '
Add blank
ELSE ' Blanks not allowed
L O C A T E 41,5
PRINT "Blanks not allowed";
E N D IF
CA SE ELSE ' Anything other key
InDataS = InDataS +
In$ '
Add
to
string
" E N D SELECT
LOCATE CursorLine%, CursorRow% ' Starting position
" InDataS =
LEFT$(InData$, WidthField%) '
Truncate
to
width
of input
field
" PRINT InDataS +
; ' Print current
string
T O O P ' Loop until exited
TND SUB
"SUB loadadjust
(al, aO,
W ,
dK, R, LC, Gfactor, alpha, Alphaconst, deltaP, Pmax, Pmin,
MeanLoad, Demand, M L
Volts,
DL
Volts, ChannelO%,
Channel 1%,
LSB0%, MS B0 %,
LSB1%,MSB1%)
alpha = (aO + a 1) / W:' Calculate alpha constant
Alphaconst = (2 + alpha) / (1 - alpha)
A
1.5 * (.886 + (4.64 * alpha)
2)) + (14.72 * (alpha
A
3)) - (5.6 * (alpha
A
4)))
"
deltaP
= (Gfactor
*
1000 *
dK) /
Alphaconst:
'Calculate
load amplitude
for
specified
delta
K
" Pmax = deltaP / (1 - R) : Pmin = Pmax - deltaP: MeanLoad = Pmin + deltaP /
2:
Demand
= Pmax - MeanLoad
" ' Calculate output
signal levels to control unit
on Instron 1603
"
M L Volts
= (MeanLoad
/ LC) * 10: DL Volts
= (Demand
/ LC) *
10

8/10/2019 The Effect of Residual Stress and Crack Closure on Fatigue Crack
http://slidepdf.com/reader/full/the-effect-of-residual-stress-and-crack-closure-on-fatigue-crack 283/304

8/10/2019 The Effect of Residual Stress and Crack Closure on Fatigue Crack
http://slidepdf.com/reader/full/the-effect-of-residual-stress-and-crack-closure-on-fatigue-crack 284/304
Appendix
1 28
TRINT
"OPEN FileNameS FOR OUTPUT AS FileNum%
TND SUB
"SUB setup (W, B, R, dK, aO, Gfactor, LC, aFin, increment)
"
CLS
"
O U T & H 3 1 0 , 0:OUT&H311, 128
" OUT &H312,
0:
OUT
&H313,128
Input specimen details and loading conditions
" LOCATE
2,
10
" INPUT "What is the specimen width
W
in
m m
;
W
" LOCATE 4, 10
INPUT "What
is the
specimen
thickness
B
in mm";
B
" LOCATE 6, 10
" INPUT "What
load ratio
R
is required":
R
" LOCATE
8,
10
" IN PU T "What is the constant delta K required for the test in MPa.m'"; dK
" LOCATE 10, 10
" IN PU T "What
is the effective
aO
at the
notch
root (in
mm)";
aO
' Calculate "geometrical factor"
" Gfactor
=
(B
/ 1000)
* ((W
/ 1000)
A
.5)
" ' Specify load
cell (default is
20kN)
" L O C A T E 12, 10
INPUT "At what crack length (in m m ) should the test stop"; aFin
" L O C A T E 14,
10
" INPUT "Which load
cell is
connected 20kN
(A)
or
lOOkN (B)"; LCS
" EF LCS =
"B"
T H E N LC = 100 ELSE LC = 20
" L O C A T E
16,
20
"O.K.,"; LC;
"kN
cell selected":
'Confirms which
load cell
" L O C A T E
18,
10
" PRINT "At what increment of crack length (in m m ) should the "
" L O C A T E
19,
10
" INPUT "load be
adjusted";
increment
" L O C A T E 22,
10
" C O L O R LightRed%
"
DIMVolts(21)
" FOR
1%
=
1
TO 20
C A L L
Dash8Channel( 1)
C A L L Dash8SingleConversion(ChannelNum%, CrackCounts%) ' Get crack
measure number
Volts(I%)
= CrackCounts%
/
SpanCounts
*
SpanVolts
'
Convert
to
volts
IF Volts(I%) > Vmax T H E N Vmax = Volts(I%)
IF Volts(I%) < Vmin T H E N Vmin = Volts(I%)
Tvolts = Tvolts +
Volts(I%)
" N E X T I %

8/10/2019 The Effect of Residual Stress and Crack Closure on Fatigue Crack
http://slidepdf.com/reader/full/the-effect-of-residual-stress-and-crack-closure-on-fatigue-crack 285/304
Appendix
1 29
Crvolts
=
(Tvolts -
Vmax
- Vmin) / 18
" Equiv = 4.6030568# + 1.10754 * Crvolts
" al
=
-38.363 +
44.57
* (Equiv
/
4.57)
-
5.7726
*
(Equiv
/
4.57)
*
(Equiv
/
4.57)
" PRINT USI NG Current crack length = ##.##
mm";
al
" LOCATE 24, 10
" PRINT "*** ENSURE AUT O M E A N LOAD
IS
SET TO A U TO
*** then press
any
key"
" DO: LOO P WHILE
INKEYS
=
: wait for key press
'now set mean and dynamic load using loadadjust subroutine
CALL loadadjust(al, aO, W ,
dK,
R, LC, Gfactor,
alpha,
Alphaconst,
deltaP,
Pmax,
Pmin, MeanLoad, Demand, ML
Volts,
DL
Volts,
Channel0%, Channel 1%,
LSB0%,
MS B0 %, LSB1%,
MSB1%)
" LOCATE 26, 10
" COLOR LightBlue%
" PRINT "MAKE SURE LIMITS ARE SET O N 1603 CONTROL CONSOLE "
SLEEP
(7):
'makes small delay before next screen
T N D SUB

8/10/2019 The Effect of Residual Stress and Crack Closure on Fatigue Crack
http://slidepdf.com/reader/full/the-effect-of-residual-stress-and-crack-closure-on-fatigue-crack 286/304
Appendix A2 1
A2 Experimental Errors
A2.1 Crack length
Crack length was measured using the DC potential drop method. The DC-PD system was
calibrated empirically against fracture surface measurements of crack length performed
using a travelling microscope. The travelling microscope was subject to parallax error, a
operator error in reading the micrometer scale.
Parallax error was estimated to contribute approximately: ±0.0 lmm
Micrometer error was estimated to contribute a further: ±0.005mm
To minimise the effect of errors the values used to produce the calibration curve were the
average of five repeat measurements. The crack length was further averaged over five
positions as shown in Figure 7.8.
The accuracy of the crack length measured using the DC potential drop method is
predicated on: -
• the accuracy of the calibration curve (see above)
• the accuracy of the voltage (potential drop) measurement
• the noise level present in the voltage signal and the stability of the constant current
power supply used.
The potential drop across the crack was measured to an accuracy of +0.001 Volt, and the
noise level in the signal was less than ±0.015Volts. This was checked by a "soak" test
whereby the signal level was monitored for 24 hours. It was established that the DC-PD
system was fully stabilised after 1 hour. During calibration trials, there was no additio
measurable noise that could be attributed to magneto-striction effects.
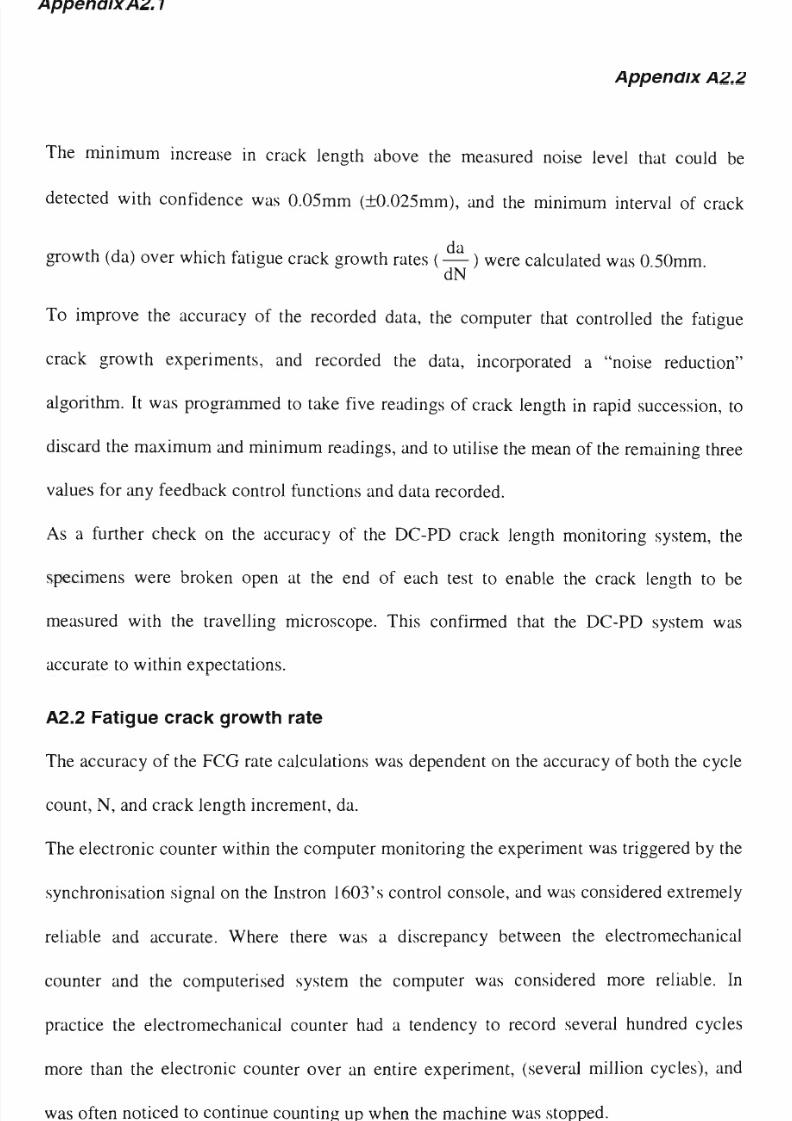
8/10/2019 The Effect of Residual Stress and Crack Closure on Fatigue Crack
http://slidepdf.com/reader/full/the-effect-of-residual-stress-and-crack-closure-on-fatigue-crack 287/304
Appendix A2.2
The minimum increase in crack length above the measured noise level that could be
detected with confidence was 0.05mm (±0.025mm), and the minimum interval of crack
growth (da) over which fatigue crack growth rates (—) were calculated was 0.50mm.
d N
To improve the accuracy of the recorded data, the computer that controlled the fatigue
crack growth experiments, and recorded the data, incorporated a "noise reduction"
algorithm. It was programmed to take five readings of crack length in rapid succession,
discard the maximum and minimum readings, and to utilise the mean of the remaining thr
values for any feedback control functions and data recorded.
As a further check on the accuracy of the DC-PD crack length monitoring system, the
specimens were broken open at the end of each test to enable the crack length to be
measured with the travelling microscope. This confirmed that the DC-PD system was
accurate to within expectations.
A2.2 Fatigue crack growth rate
The accuracy of the FCG rate calculations was dependent on the accuracy of both the cy
count, N, and crack length increment, da.
The electronic counter within the computer monitoring the experiment was triggered by
synchronisation signal on the Instron 1603's control console, and was considered extre
reliable and accurate. Where there was a discrepancy between the electromechanical
counter and the computerised system the computer was considered more reliable. In
practice the electromechanical counter had a tendency to record several hundred cycles
more than the electronic counter over an entire experiment, (several million cycles),
was often noticed to continue counting up when the machine was stopped.

8/10/2019 The Effect of Residual Stress and Crack Closure on Fatigue Crack
http://slidepdf.com/reader/full/the-effect-of-residual-stress-and-crack-closure-on-fatigue-crack 288/304
Appendix A2.3
The maximum error in crack length at the start and finish of the crack growth increment
was taken to be ±0.025mm, and the increment of crack growth used was 0.50mm. Since
cycle counter is considered accurate, the maximum error in FCG rate was estimated t
±10%.
A2.3 Load
The ±20kN Instron dynamic load cell used was calibrated to the appropriate Australi
Standard, and certified as accurate to within ±1% over its range.
A2.4 Stress intensity
Stress intensity was calculated using the formula in the ASTM Standard E647 for the
specimen:
AK=-^E=.
(2 + a)
. (0.886 + 4.64a - 13.32a + 14.72a
3
- 5.6a
4
)
a
a
y
Where P = load, B = specimen thickness (breadth), W = specimen width, and a = — the
ratio of effective crack length to specimen width).
The specimen dimensions are tightly controlled to within ±0.05mm
When maximum errors in these input data are adjusted to arrive at the maximum compo
error in stress intensity, the overall error in K was calculated to be not more tha
A2.5 Crack closure measurements
Unambiguous identification of the crack opening and closing load depended upon the
linearity of strain gauge response, and on correct determination of the point wher
vs. strain response achieved linearity. The strain gauge manufacturer (Measurement
8/10/2019 The Effect of Residual Stress and Crack Closure on Fatigue Crack
http://slidepdf.com/reader/full/the-effect-of-residual-stress-and-crack-closure-on-fatigue-crack 289/304
Appendix A2.4
Inc.) stated that under conditions similar to those of the experimental programme reported
in this thesis, that the gauges have "moderate" accuracy, which is further defined as bei
within ±5%. Under the experimental conditions, and strain range of the fatigue tests, the
same documentation indicated that the strain gauges had a projected fatigue life in exces
IO
8
cycles.
Noise due to asperity contact or detachment, as well as hysteresis due to plasticity at t
crack-tip may make accurate determination of the actual P
op
/P
c
i somewhat difficult. Under
these circumstances, P
op
/Pd may be determined to an accuracy of only ±20%. Errors in the
crack length may introduce further inaccuracy in the crack opening/closing stress intensi
(Kop/Kd). The inaccuracy of K„p values reported may (in some instances) be as much as
±22%.
A2.6 Residual stress measurement by hole drilling
Since the number of parameters involved is larger than for routine experimental stress
analysis, the potential for error is correspondingly greater. The accuracy with which the
hole is drilled is highly critical. Unfortunately, the hole-drilling measurements and dat
reduction were performed by a third party, (SECV's Herman Research Laboratory), and
complete details of the estimated errors were not available. Hence, for this study, the h
drilling measurements are included only for qualitative comparison with the X-ray and
neutron diffraction residual stress measurements.
A2.7 Residual stress measurement by X-ray diffraction
The X-ray diffraction residual stress measurements utilised the y
2
technique. Thus, it was
not necessary to obtain a value of the unstressed lattice parameter prior to the experime
The accuracy of this technique depends on the ability to measure small differences in the

8/10/2019 The Effect of Residual Stress and Crack Closure on Fatigue Crack
http://slidepdf.com/reader/full/the-effect-of-residual-stress-and-crack-closure-on-fatigue-crack 290/304
Appendix A2.5
diffraction angles accurately. Absolute alignment of the diffractometer and position of the
Bragg peak are not considered critical, since the T
2
technique measures relative changes in
29 angle. The residual stress is computed from plots of 29 vs. sin
2x
P, which should ideally
be linear. The software used to process the diffraction data and calculate the residual st
automatically included an estimate of the precision of the residual stress value returned.
This was generally less than ±10MPa. A series of repeat scans on control specimens
returned results with corresponding consistency. See Table 7.4.
A2.8 Residual stress measurement by neutron diffraction
Due to the low intensity of the neutron beam, it was not practical to apply the T
2
techniqu
to the neutron diffraction measurements. Instead the residual stress was measured relative
to a stress relieved specimen, from which and "unstressed" lattice parameter, d
()
, was
measured. Macroscopic values of Poisson's ratio and Young's modulus have been shown
by other researchers to yield satisfactory results in calculating results, and hence
"handbook" values were used for these material-specific constants in this work.
As with the X-ray diffraction method, the accuracy of the technique is primarily dependent
on the ability to measure the diffraction angle T (=29) accurately. It was determined that
the *F angle could be measured with an accuracy of ±0.01°. This resolution corresponded to
an accuracy of ±15MPa for the residual stress measured; relative to the stress relieved
specimen.

8/10/2019 The Effect of Residual Stress and Crack Closure on Fatigue Crack
http://slidepdf.com/reader/full/the-effect-of-residual-stress-and-crack-closure-on-fatigue-crack 291/304
Appendix A3 1
A 3 Electropolishing conditions for steel plate
The surface of the specimens investigated by x-ray diffraction was electro-polished
using a Struers Polectrol polishing cell. This piece of equipment passes a stream of
electrolyte over an area of the flat specimen surface defined by a mask. Polishing
conditions are pre-set, with control over temperature of the electrolyte, flow-rate,
current density and processing time.
The electrolyte utilised comprised perchloric acid (30%), 2-butoxyethanol and ethanol
mixed in the ratio 2:1:7 by volume. An area 4.5cm was polished on the side of the
specimen ahead of the notch tip parallel to the crack plane. This required a potential
~50Volts, a current between 6 and 9 Amps for about 1 minute (±20 sec). The flow rate
was set at between 2 and 2.5, on the arbitrary control panel scale.

8/10/2019 The Effect of Residual Stress and Crack Closure on Fatigue Crack
http://slidepdf.com/reader/full/the-effect-of-residual-stress-and-crack-closure-on-fatigue-crack 292/304
Appendix A4.1
A4
Test material
The material chosen for the experimental program was a H S L A structural steel supplied
by
B H P
Steel, Slab
and
Plate Products Division
(SPPD),
Port Kembla.
The
grade,
AB3542, is similar to the British BS4360-50D specification, and was intended for use
in the construction of offshore petroleum production
platforms.
The product analysis
of
the 2 1 m m thick plate sample is shown in Table A4.1 below.
c
P
Mn
Si
S
Ni
Cr
Mo
Cu
H
0.06%
0.014%
1.43%
0.27%
0.004%
0.21%
0.029%
0.004%
0.18%
6.8ppm
Al
Sn
Nb
Ti
V
Btotal
Ca
N
Fe
0.012%
0.002%
0.018%
0.008%
0.003%
<0.0003%
<0.0005%
0.0046%
Balance
(heat analysis plate lower)
Table
A4.1
Product analysis of AB3542 steel plate as used for specimen material
Mechanical test data supplied by B H P SPPD's Central Laboratory was as follows:
443MPa
497MPa
3 2 %
43-45%
155-160 P N
The microstructure
of
the test material
was
typical
of
rolled plate, i.e.,
a
"banded"
appearance with alternate bands of ferrite and
pearlite.
The micrographs, Figure A4.1
and Figure
A4.2,
shown overleaf
are
typical. The stress relieving heat treatments did not
alter microstructure or hardness noticeably.
Yield strength
Ultimate tensile strength
%Elongation
Reduction of area
Hardness

8/10/2019 The Effect of Residual Stress and Crack Closure on Fatigue Crack
http://slidepdf.com/reader/full/the-effect-of-residual-stress-and-crack-closure-on-fatigue-crack 293/304
Appendix A4 2
Figure A4 .1 , Microstructure of A B 3 5 4 2 steel plate magnification 180X). Note
compositional band ing, runni ng f ro m top to bottom, comprising
regions of
ferrite
a n d bands of pearlite/bainite.
sulphides ar ro we d) in centre of picture.
Non-metallic inclusions we re observed concentrated in the centre of the plate. B H P
were contacted regarding this observation and provided further information. Resis
to hydrogen cracking was a higher priority for this product than inclusion level.
reason the heat was calcium injected prior to vacuum degassing, since hydrogen c

8/10/2019 The Effect of Residual Stress and Crack Closure on Fatigue Crack
http://slidepdf.com/reader/full/the-effect-of-residual-stress-and-crack-closure-on-fatigue-crack 294/304
Appendix
A4.3
picked up during injection. Vacuum degassing further lowers the final calcium level so
that sulphide modification can be incomplete. Sulphides can then occur in stringer form
in the final product, located towards the product centre together with melt formed TiN
inclusions. Sulphides were clearly observed during optical metallography, see Figure
Figure A4.2. BHP considered that that the sulphur level in the final product (0.004%)
was not sufficient to give inadequate transverse impact values or through thickness
ductility in this product.

8/10/2019 The Effect of Residual Stress and Crack Closure on Fatigue Crack
http://slidepdf.com/reader/full/the-effect-of-residual-stress-and-crack-closure-on-fatigue-crack 295/304
Appendix
A5.1
A Procedures for stress relieving specimen material
A5.1 Stress relieving heat treatment simulating typical field methods
A set of specimens was subjected to a minimum stress relieving heat treatment. A
section of plate sufficient to yield six standard (60 x 62.5 x 18mm) CT-specimens
cut into six pieces. These pieces, each approximately 65 x 70 x 20mm, were placed
furnace at ambient temperature and heated to 400°C in a laboratory furnace at a ra
2°C/minute, held at this temperature for 1 hour, and then cooled to ambient temper
at a rate of l"C/minute. As expected, no significant microstructural or hardness c
were observable, (HV
S
=155-160). However, measured residual stresses were
considerably reduced.
450
400 -
O 350 -
<u 300 -
B
250 -
i 200 -
g 150 -
,2
100 -
50
.
0 '
0
Figure A5.1, Stress relieving heat treatment, heating-cooling, of fatigue crack
growth specimens
A5.2 Control specimen for neutron diffraction and to obtain unstressed
lattice parameter
d
0
The control specimen required for the neutron diffraction work was intended to provide
an "unstressed" lattice parameter d. This control specimen was heated to 650"C (we
above the creep temperature for the material) in a laboratory furnace at a rate of
2"C/minute, held at this temperature for 3 hours, and then cooled to ambient
temperature at a rate of l"C/minute, see Figure A5.2.
-r-
8
10 12
Time/hours
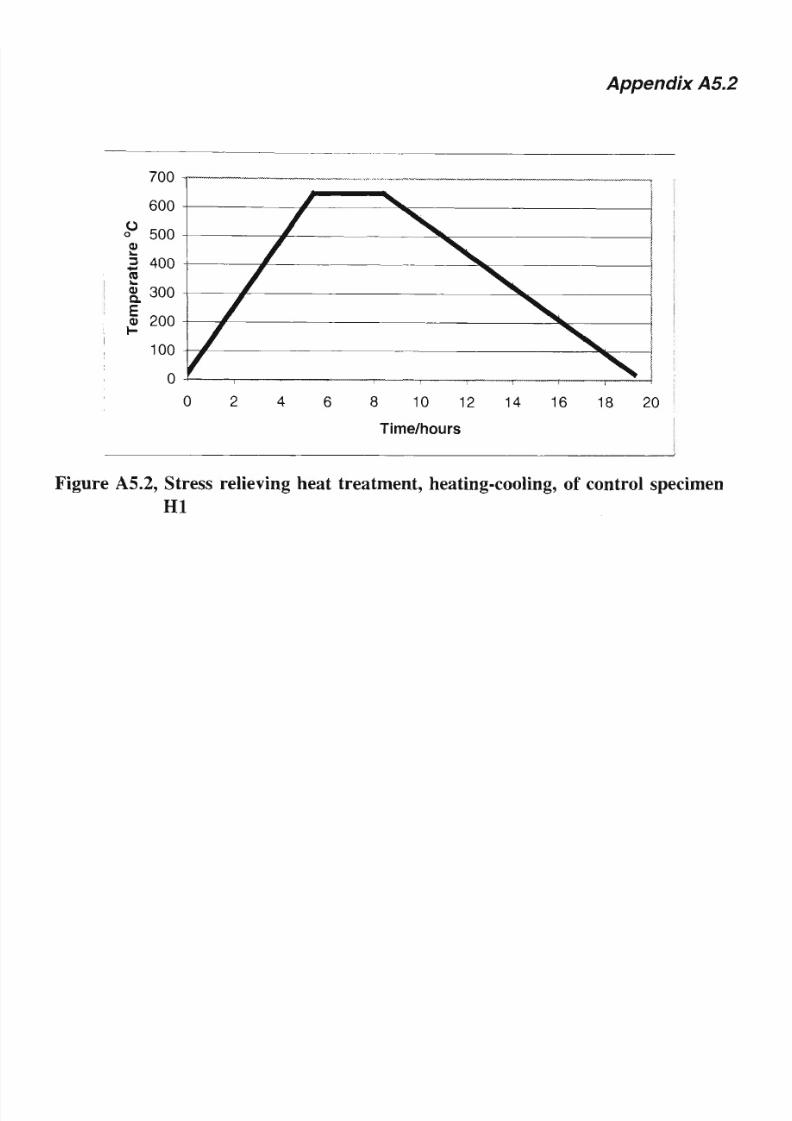
8/10/2019 The Effect of Residual Stress and Crack Closure on Fatigue Crack
http://slidepdf.com/reader/full/the-effect-of-residual-stress-and-crack-closure-on-fatigue-crack 296/304

8/10/2019 The Effect of Residual Stress and Crack Closure on Fatigue Crack
http://slidepdf.com/reader/full/the-effect-of-residual-stress-and-crack-closure-on-fatigue-crack 297/304

8/10/2019 The Effect of Residual Stress and Crack Closure on Fatigue Crack
http://slidepdf.com/reader/full/the-effect-of-residual-stress-and-crack-closure-on-fatigue-crack 298/304
Appendix A6.2
A6.2 Compressive overloading
The compressive loads were applied using a servo-hydraulic frame of 500kN capacity,
courtesy of the department of Civil and Mining Engineering. The specimen was placed
in the machine between platens such that the principal deformation occurred in the ar
ahead of the notch i.e., offset so that the material ahead of the notch was in the ce
the loading axis. Three strain gauges were used to monitor the specimen, one on eac
side of the specimen, and one on the back face as for the crack closure measurements
see Figure A6.1 below.
Strain gauges
Back face of specimen
Figure
A6.1,
Location of strain gauges during compressive overloading.

8/10/2019 The Effect of Residual Stress and Crack Closure on Fatigue Crack
http://slidepdf.com/reader/full/the-effect-of-residual-stress-and-crack-closure-on-fatigue-crack 299/304
Appendix A7.1
A7 Weld preparation
A double-V butt weld was prepared courtesy of the welding development section of
Central Laboratory at BHP Steel Port Kembla. The weld was fabricated in an automa
submerged arc-weld operation, in the down-hand-flat position. No pre-heat was use
The maximum inter-pass temperature measured with a contact pyrometer was less tha
150°C. The electrode used was 1.8mm diameter, and conformed to AWS classification
E71T8. The process used DC-electrode negative, 250Amps at 21 Volts, 20mm electric
stick out. The pass speed was 300-350mm/min. Heat input was between 0.9 and 1.0
kJ/mm. The pass location and sequence is detailed below in Figure A7.1 and Table
A7.1. The relative location of the CT specimens is shown in Figure A7.2
Run
number
1
3
4
5
6
7
8
9
10
11
12
Interpass
temp.
(°C)
16
60
80
80
90
105
25
65
95
105
105
120
Current
(Amps)
250
250
250
250
250
250
250
250
250
250
250
250
Voltage
(Volts)
21
21
21
21
21
21
21
21
21
21
21
21
Travel
speed
(mm/min)
300
300
300
350
350
350
300
300
300
350
350
350
Heat input
(kj/mm)
1.0
1.0
1.0 I
0.9
0.9
0.9
1.0
1.0
1.0
0.9
0.9
0.9
Table
A7.1,
Pass by pass detail of welding conditions used for preparation of the
double-V butt weld

8/10/2019 The Effect of Residual Stress and Crack Closure on Fatigue Crack
http://slidepdf.com/reader/full/the-effect-of-residual-stress-and-crack-closure-on-fatigue-crack 300/304
Appendix A7 2
Joint preparation
90°
1-2mm
Pass location and sequence
21mm
(not to scale)
Figure A7.1, Joint preparation and run sequence of double-V butt weld from
which CT-specimens were cut.

8/10/2019 The Effect of Residual Stress and Crack Closure on Fatigue Crack
http://slidepdf.com/reader/full/the-effect-of-residual-stress-and-crack-closure-on-fatigue-crack 301/304
Appendix A7.3
W1
..
|o
SW3
fo
."S
&
^•?^
^ • %
fe
1
O"-.
•:•£:
-Z-~:
\*.-
V~-
>£
«
\ .• •.
S-~
y>.
iv
v \
g
Jc
W2
| W4
l
500mm
1 c
l
a)
*-
T
5
±
O)
• c
•
•—
• =
1 o
1 DC
1
l
T
250mm
(Not to scale)
Figure A7.2, Relative location of CT-specimens
W l
to
W 4 .

8/10/2019 The Effect of Residual Stress and Crack Closure on Fatigue Crack
http://slidepdf.com/reader/full/the-effect-of-residual-stress-and-crack-closure-on-fatigue-crack 302/304
Appendix A8.1
A8 Fracture Surface Roughness Measurements
A8.1 Experimental objective
The objective of this series of experiments was to establish the effect of load conditi
and of residual stresses on the surface topography of fatigue crack fracture surfaces.
A8.2 Method
The compact tension specimens had been subjected to fatigue crack growth
experiments. The specimens were cooled to below their ductile range by immersion in
liquid nitrogen, then broken open to expose their fracture surfaces. After the specimen
had been ultrasonically cleaned, their fracture surfaces were examined using a Rank-
Taylor-Hobson Form-Talysurf-120 instrument. This device maps the surface profile (or
topography) of the specimen surface by measuring the position and vertical
displacement of a stylus that is drawn across the specimen surface at a controlled rate.
The instrument was controlled by a microprocessor and automatically generated a
report after each measurement detailing the results. Two samples of such reports are
shown in Figure A8.1.
Four essential statistics were reported for each scan:
• R
j
- The average deviation from a centreline through a described sampling length
"L". The centreline is automatically drawn such that sum of the area within the
profile above the line is equal to the sum of that below it.
• R, - Maximum peak to valley height within the assessment sample length L.
• R - Maximum height above the centreline within the assessment sample length L.
• R - Mean of the peak values within the assessment sample length L.

8/10/2019 The Effect of Residual Stress and Crack Closure on Fatigue Crack
http://slidepdf.com/reader/full/the-effect-of-residual-stress-and-crack-closure-on-fatigue-crack 303/304
Appendix A8.2
A8.3 Experimental plan
Four specimens were selected for investigation:
• As received
• Stress relieved
• Tensile overload - compressive residual stress
• Compressive overload - tensile residual stress
In several specimens, a darkened area was present along the centreline of the frac
surface. This was presumed to be fretting debris. Hence, measurements were taken
along the centre of the specimen including this feature, and to the sides of the f
surface where this feature was absent. Three scans were taken at each location and
results reported are the mean of all three. The specimens had been subjected to a
of load amplitudes and corresponding fatigue crack growth rates.
A8.4 Results
It was found that there was remarkably little difference between the results of the
Talysurf scans from all four specimens, see Table A8.1.
Position
R
(um)
R, (pm )
R
p
(urn)
R
pm
(Mm)
As received
Edge
2.834
23.78
11.34
8.570
Centre
2.999
22.03
11.10
8.426
Stress relieved
Edge
2.885
19.87
9.942
8.516
Centre
2.813
22.60
12.38
8.883
Tensile
residual stress
Edge
2.597
21.44
11.06
9.138
Centre
3.141
18.78
9.8
8.029
Compressive
residual stress
Edge
3.162
18.84
8.850
7.421
Centre
3.438
23.66
11.31
9.63
In the context of the crack opening displacement during the fatigue
tests,
the variation
in fracture surface roughness is relatively insignificant.
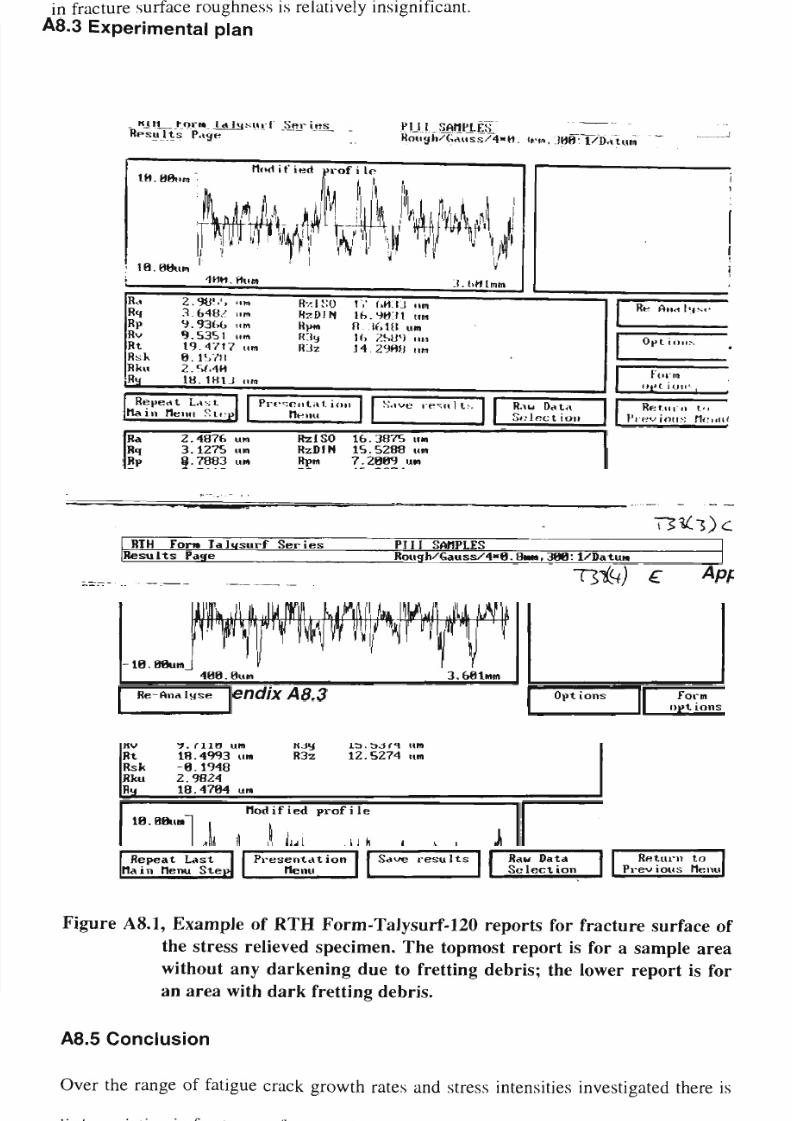
8/10/2019 The Effect of Residual Stress and Crack Closure on Fatigue Crack
http://slidepdf.com/reader/full/the-effect-of-residual-stress-and-crack-closure-on-fatigue-crack 304/304
Appendix A8.3


![NAVAL POSTGRADUATE SCHOOL · Virtual Crack Closure Technique for Two-dimensional Solid Elements. From [2].....6 Figure 3. Deformed Crack Geometry—Without Resin Interface.10 Figure](https://static.fdocuments.in/doc/165x107/605ee27cb41d710d4940bcf6/naval-postgraduate-school-virtual-crack-closure-technique-for-two-dimensional-solid.jpg)