MYANMAR - Home | Food and Agriculture Organization of the ... · PDF fileMyanmar)...
52
Forestry Department Food and Agriculture Organization of the United Nations FRA2010/141 Rome, 2010 GLOBAL FOREST RESOURCES ASSESSMENT 2010 COUNTRY REPORT MYANMAR
Transcript of MYANMAR - Home | Food and Agriculture Organization of the ... · PDF fileMyanmar)...

Forestry Department Food and Agriculture Organization of the United Nations
FRA2010/141
Rome, 2010
GLOBAL FOREST RESOURCES
ASSESSMENT 2010
COUNTRY REPORT
MYANMAR

2
The Forest Resources Assessment Programme Sustainably managed forests have multiple environmental and socio-economic functions important at the global, national and local scales, and play a vital part in sustainable development. Reliable and up-to-date information on the state of forest resources - not only on area and area change, but also on such variables as growing stock, wood and non-wood products, carbon, protected areas, use of forests for recreation and other services, biological diversity and forests’ contribution to national economies - is crucial to support decision-making for policies and programmes in forestry and sustainable development at all levels.
FAO, at the request of its member countries, regularly monitors the world’s forests and their management and uses through the Forest Resources Assessment Programme. This country report forms part of the Global Forest Resources Assessment 2010 (FRA 2010). The reporting framework for FRA 2010 is based on the thematic elements of sustainable forest management acknowledged in intergovernmental forest-related fora and includes variables related to the extent, condition, uses and values of forest resources, as well as the policy, legal and institutional framework related to forests. More information on the FRA 2010 process and the results - including all the country reports - is available on the FRA Web site (www.fao.org/forestry/fra ). The Global Forest Resources Assessment process is coordinated by the Forestry Department at FAO headquarters in Rome. The contact person for matters related to FRA 2010 is: Mette Løyche Wilkie Senior Forestry Officer FAO Forestry Department Viale delle Terme di Caracalla Rome 00153, Italy E-mail: [email protected] Readers can also use the following e-mail address: [email protected]
DISCLAIMER The designations employed and the presentation of material in this information product do not imply the expression of any opinion whatsoever on the part of the Food and Agriculture Organization of the United Nations concerning the legal status of any country, territory, city or area or of its authorities, or concerning the delimitation of its frontiers or boundaries. The Global Forest Resources Assessment Country Report Series is designed to document and make available the information forming the basis for the FRA reports. The Country Reports have been compiled by officially nominated country correspondents in collaboration with FAO staff. Prior to finalisation, these reports were subject to validation by forestry authorities in the respective countries.

FRA 2010 – Country Report, Myanmar
3
Contents
1 TABLE T1 – EXTENT OF FOREST AND OTHER WOODED LAND..................................................... 5
2 TABLE T2 – FOREST OWNERSHIP AND MANAGEMENT RIGHTS ................................................... 9
3 TABLE T3 – FOREST DESIGNATION AND MANAGEMENT .............................................................. 13
4 TABLE T4 – FOREST CHARACTERISTICS ........................................................................................... 20
5 TABLE T5 – FOREST ESTABLISHMENT AND REFORESTATIONERROR! BOOKMARK NOT DEFINED.
6 TABLE T6 – GROWING STOCK................................................................................................................ 27
7 TABLE T7 – BIOMASS STOCK................................................................................................................. 31
8 TABLE T8 – CARBON STOCK .................................................................................................................. 33
9 TABLE T9 – FOREST FIRES...................................................................................................................... 35
10 TABLE T10 – OTHER DISTURBANCES AFFECTING FOREST HEALTH AND VITALITY ........... 37
11 TABLE T11 – WOOD REMOVALS AND VALUE OF REMOVALS ..................................................... 38
12 TABLE T12 – NON-WOOD FOREST PRODUCTS REMOVALS AND VALUE OF REMOVALS... 41
13 TABLE T13 – EMPLOYMENT .................................................................................................................... 42
14 TABLE T14 – POLICY AND LEGAL FRAMEWORK ............................................................................. 44
15 TABLE T15 – INSTITUTIONAL FRAMEWORK ...................................................................................... 46
16 TABLE T16 – EDUCATION AND RESEARCH .........................ERROR! BOOKMARK NOT DEFINED.
17 TABLE T17 – PUBLIC REVENUE COLLECTION AND EXPENDITUREERROR! BOOKMARK NOT DEFINED.

FRA 2010 – Country Report, Myanmar
4
Report preparation and contact persons
The present report was prepared by the following person(s):
Name
(FAMILY NAME,
First name)
Institution /
address E-mail Fax Tables
Myint Oo Deputy Director
Planning and
Statistic Division
(Government of
Myanmar)
Maung Maung
Than, Deputy
Director
Forest
Department
(Government of
Myanmar)

FRA 2010 – Country Report, Myanmar
5
1 Table T1 – Extent of Forest and Other wooded land
1.1 FRA 2010 Categories and definitions
Category Definition
Forest Land spanning more than 0.5 hectares with trees higher than 5 meters and
a canopy cover of more than 10 percent, or trees able to reach these
thresholds in situ. It does not include land that is predominantly under
agricultural or urban land use.
Other wooded land Land not classified as “Forest”, spanning more than 0.5 hectares; with trees
higher than 5 meters and a canopy cover of 5-10 percent, or trees able to
reach these thresholds in situ; or with a combined cover of shrubs, bushes
and trees above 10 percent. It does not include land that is predominantly
under agricultural or urban land use.
Other land All land that is not classified as “Forest” or “Other wooded land”.
Other land with tree cover
(Subordinated to “Other
land”)
Land classified as “Other land”, spanning more than 0.5 hectares with a
canopy cover of more than 10 percent of trees able to reach a height of 5
meters at maturity.
Inland water bodies Inland water bodies generally include major rivers, lakes and water
reservoirs.
1.2 National data
1.2.1 Data sources
References to sources of
information
Quality
(H/M/L)
Variable(s) Year(s) Additional comments
GOM. 1991. Forest Cover
of Myanmar, the 1989
Appraisal. Kyaw Tint and
Tun Hla, Yangon January
1991.
H Extent 1975
&1989
GOM. 1997. ISDP
(Information System
Development Project for
the Management of
Tropical Forest), Rakhine,
Yangon, Bago, Magwe,
Chin, Mandalay, Kayah,
Sagaing, Ayeyarwady
State and Divisons
H Extent 1997
GOM. 1997. Land Use
and Land Cover Mapping
for Mon State
H Extent 1997
GOM. 1998. Anti-narcotic
sampling frame mapping,
Landuse Map of Shan
States using 2001 Landsat
7 ETM data.
H Extent 1998
GOM. 2000a. Tanintharyi
Division, Study on forest
resources and landuse
changes in the southern
H Extent 2000
FRA 2010 – Country Report, Myanmar
6
part of Myanmar.
FAO,FD
GOM. 2000b. Kachin
State Land Cover
Mapping, Inter
Departmental Project,
Forest Department
H Extent 2000
GOM. 2000c. Karen State
Land Cover Mapping,
Inter Departmental Project
H Extent 2000
Remote sensing
interpretation
H Extent 2006 Most of the country areas have been
classified by using 2006 Landsat 7
ETM, some areas have been used
2007 and 2008 Landsat 7 ETM and
only Shan State have been used
2005 Landsat 5 TM data. That is
why Land cover can be said 2006
data because of mostly using 2006
Landsat 7 ETM and field checked
had been thoroughly done during
2006.
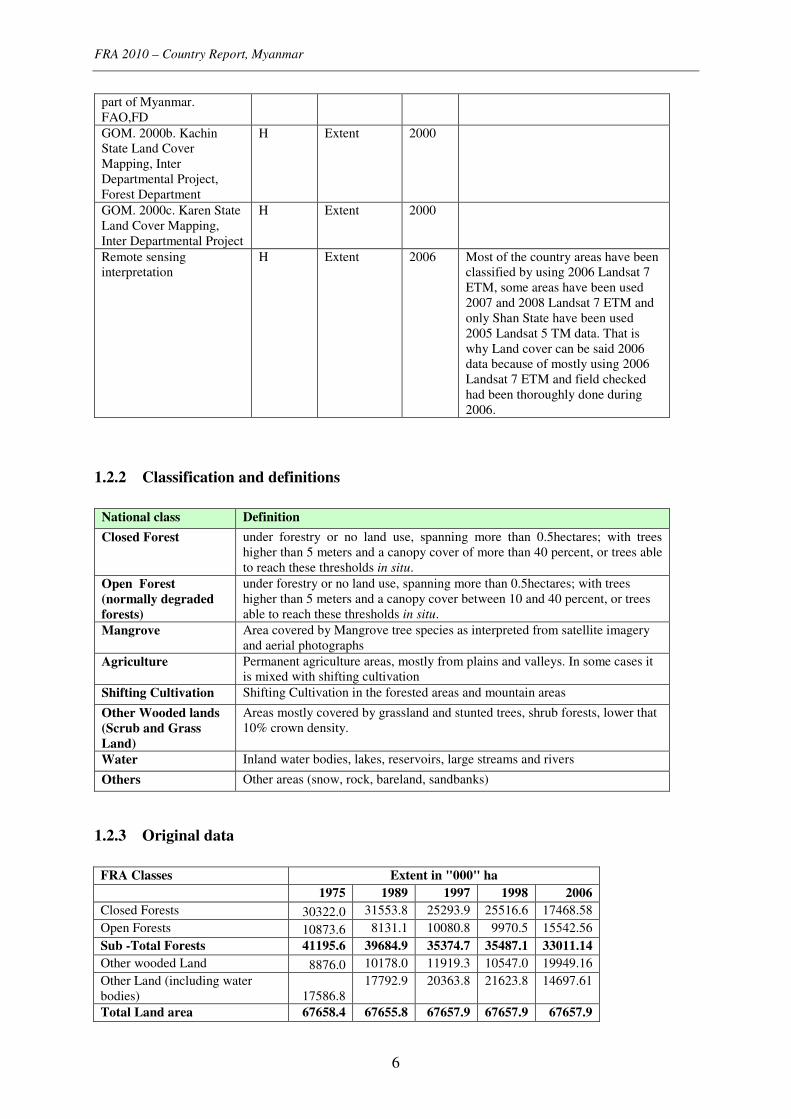
1.2.2 Classification and definitions
National class Definition
Closed Forest under forestry or no land use, spanning more than 0.5hectares; with trees
higher than 5 meters and a canopy cover of more than 40 percent, or trees able
to reach these thresholds in situ.
Open Forest
(normally degraded
forests)
under forestry or no land use, spanning more than 0.5hectares; with trees
higher than 5 meters and a canopy cover between 10 and 40 percent, or trees
able to reach these thresholds in situ.
Mangrove Area covered by Mangrove tree species as interpreted from satellite imagery
and aerial photographs
Agriculture Permanent agriculture areas, mostly from plains and valleys. In some cases it
is mixed with shifting cultivation
Shifting Cultivation Shifting Cultivation in the forested areas and mountain areas
Other Wooded lands
(Scrub and Grass
Land)
Areas mostly covered by grassland and stunted trees, shrub forests, lower that
10% crown density.
Water Inland water bodies, lakes, reservoirs, large streams and rivers
Others Other areas (snow, rock, bareland, sandbanks)
1.2.3 Original data
FRA Classes Extent in "000" ha
1975 1989 1997 1998 2006
Closed Forests 30322.0 31553.8 25293.9 25516.6 17468.58
Open Forests 10873.6 8131.1 10080.8 9970.5 15542.56
Sub -Total Forests 41195.6 39684.9 35374.7 35487.1 33011.14
Other wooded Land 8876.0 10178.0 11919.3 10547.0 19949.16
Other Land (including water
bodies) 17586.8
17792.9 20363.8 21623.8 14697.61
Total Land area 67658.4 67655.8 67657.9 67657.9 67657.9
FRA 2010 – Country Report, Myanmar
7
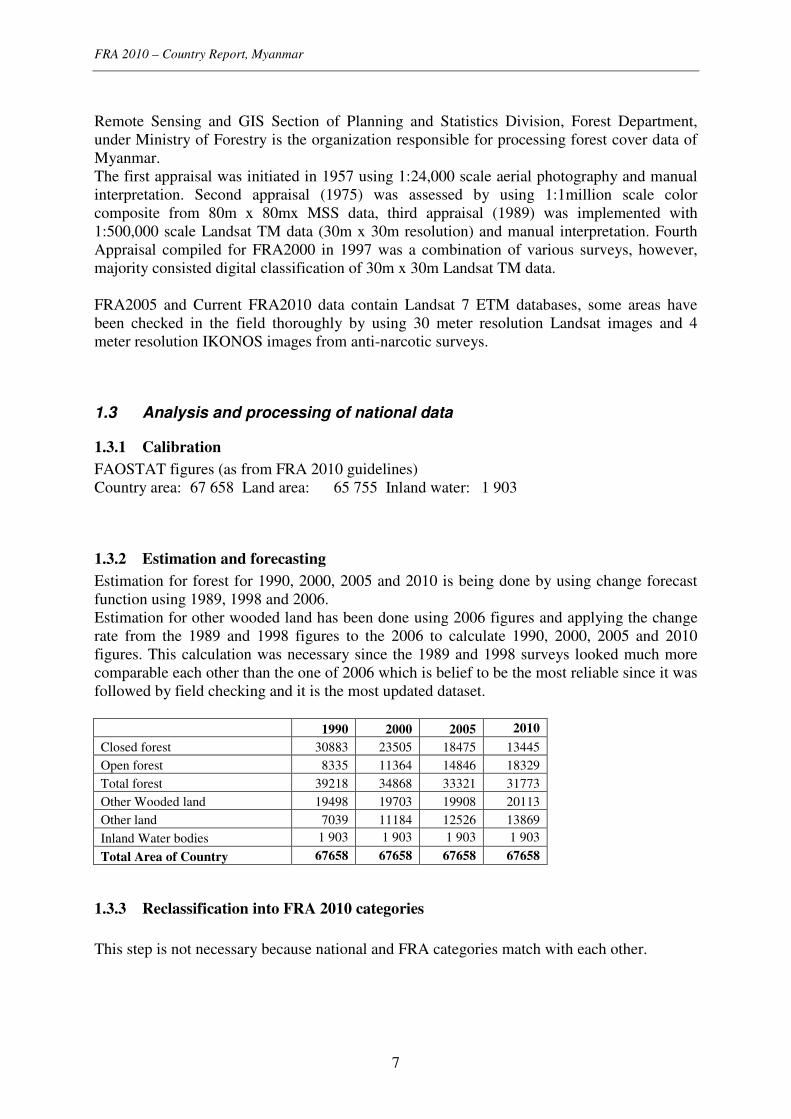
Remote Sensing and GIS Section of Planning and Statistics Division, Forest Department,
under Ministry of Forestry is the organization responsible for processing forest cover data of
Myanmar.
The first appraisal was initiated in 1957 using 1:24,000 scale aerial photography and manual
interpretation. Second appraisal (1975) was assessed by using 1:1million scale color
composite from 80m x 80mx MSS data, third appraisal (1989) was implemented with
1:500,000 scale Landsat TM data (30m x 30m resolution) and manual interpretation. Fourth
Appraisal compiled for FRA2000 in 1997 was a combination of various surveys, however,
majority consisted digital classification of 30m x 30m Landsat TM data.
FRA2005 and Current FRA2010 data contain Landsat 7 ETM databases, some areas have
been checked in the field thoroughly by using 30 meter resolution Landsat images and 4
meter resolution IKONOS images from anti-narcotic surveys.
1.3 Analysis and processing of national data
1.3.1 Calibration
FAOSTAT figures (as from FRA 2010 guidelines)
Country area: 67 658 Land area: 65 755 Inland water: 1 903
1.3.2 Estimation and forecasting
Estimation for forest for 1990, 2000, 2005 and 2010 is being done by using change forecast
function using 1989, 1998 and 2006.
Estimation for other wooded land has been done using 2006 figures and applying the change
rate from the 1989 and 1998 figures to the 2006 to calculate 1990, 2000, 2005 and 2010
figures. This calculation was necessary since the 1989 and 1998 surveys looked much more
comparable each other than the one of 2006 which is belief to be the most reliable since it was
followed by field checking and it is the most updated dataset.
1990 2000 2005 2010
Closed forest 30883 23505 18475 13445
Open forest 8335 11364 14846 18329
Total forest 39218 34868 33321 31773
Other Wooded land 19498 19703 19908 20113
Other land 7039 11184 12526 13869
Inland Water bodies 1 903 1 903 1 903 1 903
Total Area of Country 67658 67658 67658 67658
1.3.3 Reclassification into FRA 2010 categories
This step is not necessary because national and FRA categories match with each other.

FRA 2010 – Country Report, Myanmar
8
1.4 Data for Table T1
Area (1000 hectares) FRA 2010 categories
1990 2000 2005 2010
Forest 39218 34868 33321 31773
Other wooded land 19498 19703 19908 20113
Other land 7039 11184 12526 13869
...of which with tree cover
Inland water bodies 1 903 1 903 1 903 1 903
Total for country 67658 67658 67658 67658
1.5 Comments to Table T1
Variable / category Comments related to data,
definitions, etc.
Comments on the reported trend
Forest
Other wooded land
Other land
Other land with tree cover There is no national information on
“other land that has a tree cover”.
Inland water bodies
Other general comments to the table
Remote Sensing and GIS Section of Planning and Statistics Division, Forest Department, under Ministry of
Forestry is the organization responsible for processing forest cover data of Myanmar. The first forest resource
appraisal in the country was initiated in 1957 using 1:24,000 scale aerial photography and manual
interpretation. The second appraisal (1975) was assessed by using 1:1million scale colour composite from 80m
x 80mx MSS data. The third appraisal (1989) was implemented with 1:500,000 scale Landsat TM data (30m x
30m resolution) and manual interpretation. The fourth appraisal compiled for FRA2000 in 1997 was a
combination of various surveys, however, majority consisted digital classification of 30m x 30m Landsat TM
data. The latest appraisal has data from Landsat 7 ETM databases, some of the areas have been checked in the
field thoroughly by using 1 meter resolution IKONOS images from anti-narcotic surveys.
Four separate survey data are used as baseline data. 67% of the data is from the Information System
Development Project for the Management of Tropical Forest. The data for Shan State and Kachin State are only
estimation in FRA2000 as these areas are partially covered with 1997 surveys. Now a landcover map for these
two states is being developed. Data for Taninthary Division is produced from 1997 (average image year) using
manual interpretation of 1:250,000 scale print outs of Landsat 5 TM. The latest data is digitally interpreted data
of Landsat7 ETM. Moreover, year 2000 data for Karen State is amended by RS & GIS Section. As all different
surveys are controlled and driven by the user needs, so that priority classifications are different. All National
Data are grouped into following classification.
Expected year for completion of ongoing/planned national forest inventory and/or RS survey / mapping
Field inventory
Remote sensing survey / mapping

FRA 2010 – Country Report, Myanmar
9
2 Table T2 – Forest ownership and management rights
2.1 FRA 2010 Categories and definitions
Category Definition
Public ownership Forest owned by the State; or administrative units of the public
administration; or by institutions or corporations owned by the public
administration.
Private ownership Forest owned by individuals, families, communities, private co-operatives,
corporations and other business entities, private religious and educational
institutions, pension or investment funds, NGOs, nature conservation
associations and other private institutions.
Individuals
(sub-category of Private
ownership)
Forest owned by individuals and families.
Private business entities and
institutions
(sub-category of Private
ownership)
Forest owned by private corporations, co-operatives, companies and other
business entities, as well as private non-profit organizations such as NGOs,
nature conservation associations, and private religious and educational
institutions, etc.
Local communities
(sub-category of Private
ownership)
Forest owned by a group of individuals belonging to the same community
residing within or in the vicinity of a forest area. The community members
are co-owners that share exclusive rights and duties, and benefits contribute
to the community development.
Indigenous / tribal
communities
(sub-category of Private
ownership)
Forest owned by communities of indigenous or tribal people.
Other types of ownership Other kind of ownership arrangements not covered by the categories above.
Also includes areas where ownership is unclear or disputed.
Categories related to the holder of management rights of public forest resources
Public Administration
The Public Administration (or institutions or corporations owned by the
Public Administration) retains management rights and responsibilities
within the limits specified by the legislation.
Individuals/households Forest management rights and responsibilities are transferred from the
Public Administration to individuals or households through long-term
leases or management agreements.
Private institutions
Forest management rights and responsibilities are transferred from the
Public Administration to corporations, other business entities, private co-
operatives, private non-profit institutions and associations, etc., through
long-term leases or management agreements.
Communities
Forest management rights and responsibilities are transferred from the
Public Administration to local communities (including indigenous and
tribal communities) through long-term leases or management agreements.
Other form of management
rights Forests for which the transfer of management rights does not belong to any
of the categories mentioned above.

FRA 2010 – Country Report, Myanmar
10
2.2 National data
2.2.1 Data sources
References to sources of
information
Quality
(H/M/L)
Variable(s) Year(s) Additional comments
GOM. 1989. Forest
Department, Planning and
Statistics Div.
M Ownership 1985-
1989
GOM. 2001 Statistical
Year Book 2001
M Ownership 1990-
1996
GOM. 2002. Statistical
Year Book 2002
M Ownership 1997-
2001
GOM. 2003. Forest
Department, Planning and
Statistics Div.
M Ownership 2002-
2003
GOM. 2004. Forest
Department, Planning and
Statistics Div.
M Ownership 2003-
2004
GOM. 2005. Forest
Department, Planning and
Statistics Div.
M Ownership 2004-
2005
2.2.2 Classification and definitions
National class Definition
Reserved Forest means land constituted as "reserved forest" under Forest Law (1992) which is
property of Government.
Protected Public Forest means land constituted as "protected public forest" under Forest Rules (1992)
which is property of Government.
Un-classed Forests Any forest land or waste land or any other land "recorded" in land records as
forest land but not notified in government gazette as "reserved" or "protected
public forest" under Forest Law (1992) and Forest Rules (1995).
2.2.3 Original data
In Myanmar Reserved Forests, Protected Public Forests, and un-classed forests are three
major legal classes. A legal notification in the government gazette under Myanmar Forest Act
(1992) creates or defines the boundaries of Reserved Forests and Protected Public Forests.
All the three categories of forests are owned by the “State”.
All forest area, whether notified as reserved and protected under forest act or not notified and
categorised as un-classed forests belong to the “State”. However, there are some forest areas
(34000 ha in 2003 and 35000 ha in 2004 and 41000 ha in 2005) that are not under “state
ownership”. These are the area brought under community forests owned by the local people
with long-term lease permission of the government.

FRA 2010 – Country Report, Myanmar
11
2.3 Analysis and processing of national data
2.3.1 Reclassification into FRA 2010 categories
All the forests have been considered as publicly owned in 1990 and 2000.In 2005 the 41 000
ha under community forest have been reclassified as private ownership of which by local
communities.
2.4 Data for Table T2
Table 2a - Forest ownership
Forest area (1000 hectares) FRA 2010 Categories
1990 2000 2005
Public ownership 39 218 34 868 33 280
Private ownership 0 0 41
...of which owned by individuals 0 0 0
...of which owned by private business entities and institutions 0 0 0
...of which owned by local communities 0 0 41
...of which owned by indigenous / tribal communities 0 0 0
Other types of ownership 0 0 0
TOTAL 39 218 34 868 33 321
Note: If other types of ownership is reported, please specify details in comment to the table.
Yes Does ownership of trees coincide with ownership of the
land on which they are situated? No
If No above, please describe below how the two differ:
There is no land ownership. All the land are owned by State and individual citizen
only have the right use the land. Tree tenure is granted on usufruct basis.
Table 2b - Holder of management rights of public forests
Forest area (1000 hectares) FRA 2010 Categories
1990 2000 2005
Public Administration n.a. n.a. n.a. Individuals n.a. n.a. n.a. Private corporations and institutions n.a. n.a. n.a. Communities n.a. n.a. n.a. Other n.a. n.a. n.a.
TOTAL n.a. n.a. n.a.

FRA 2010 – Country Report, Myanmar
12
2.5 Comments to Table T2
Variable /
category
Comments related to data, definitions,
etc.
Comments on the reported trend
Public ownership
Private
ownership
Other types of
ownership
Management
rights
Other general comments to the table

FRA 2010 – Country Report, Myanmar
13
3 Table T3 – Forest designation and management
3.1 FRA 2010 Categories and definitions
Term Definition
Primary designated function The primary function or management objective assigned to a management unit
either by legal prescription, documented decision of the landowner/manager, or
evidence provided by documented studies of forest management practices and
customary use.
Protected areas Areas especially dedicated to the protection and maintenance of biological
diversity, and of natural and associated cultural resources, and managed through
legal or other effective means.
Categories of primary designated functions
Production Forest area designated primarily for production of wood, fibre, bio-energy
and/or non-wood forest products.
Protection of soil and water Forest area designated primarily for protection of soil and water.
Conservation of
biodiversity
Forest area designated primarily for conservation of biological diversity.
Includes but is not limited to areas designated for biodiversity conservation
within the protected areas.
Social services Forest area designated primarily for social services.
Multiple use Forest area designated primarily for more than one purpose and where none of
these alone is considered as the predominant designated function.
Other Forest areas designated primarily for a function other than production,
protection, conservation, social services or multiple use.
No / unknown No or unknown designation.
Special designation and management categories
Area of permanent forest
estate (PFE)
Forest area that is designated to be retained as forest and may not be converted
to other land use.
Forest area within
protected areas Forest area within formally established protected areas independently of the
purpose for which the protected areas were established.
Forest area under sustain-
able forest management
To be defined and documented by the country.
Forest area with
management plan
Forest area that has a long-term (ten years or more) documented management
plan, aiming at defined management goals, which is periodically revised.
3.2 National data
3.2.1 Data sources
References to sources of information Quality
(H/M/L)
Variable(s) Year(s) Additional
comments
GOM. 2000. Thirty Year Plan for
Forestry Sector of Myanmar. Forest
Department, Planning and Statistics
Div
M Designation
GOM. 1995. Forest Working plan
(1995-2005). Forest Department,
Planning and Statistics Div
M Designation
Thirty Years Plans for Forestry Sector of Myanmar (2006-2016)
M Designation

FRA 2010 – Country Report, Myanmar
14
3.2.2 Classification and definitions
Forest Management Plans (1995-2005) classifies the forest area of the country into 7
categories of management purposes (known as working circle). These categories may be
treated as description of the classification based on designation of the forests.
National class Definition
Non Wood Forest Products working circle for meeting NWFP products
Production Working Circle for meeting timber requirements
Plantations Working Circle for meeting timber requirements through artificial
regeneration
Local Supply/Community Forestry W.C for meeting fuelwood and other minor forest products for
local community
Watershed Forests W.C For meeting conservation of soil and water resources
Mangrove Forests For utilising, and also conservation of coastal mangrove
forests
Protected Areas System W.C National Parks and Sanctuaries
The following table from old working plans (expired in 1970 but no updated till 1995)
provides the description of the designation of the Forests for year 1990.
National class Definition
Type of Working Circles Description
1 Teak Selection Working Circle for meeting teak timber requirements, it includes hardwood
supply working circle
2 Teak Eradication Working Circle for eradication of teak in unfavourable non forest areas (rice
fields etc.)
3 Hardwood supply working circle for meeting hardwood requirements, it is part of teak selection
working circle
4 Public Forest Working Circle for meeting timber needs from public forests (not forest
reserved areas)
5 Local Supply Working Circle for meeting fuelwood and other minor forest products for
local community
6 Cutch Working Circle for special manufacturing of cutch (acacia catechu)
7 Fuelwood Working Circle for meeting fuelwood products for local community
8 Tidal Forest Working Circle for meeting mangrove timber, fuelwood and charcoal
products
9 Special Working Circles for meeting special needs
3.2.3 Original data
The present data is extracted from Thirty Years Plans for Forestry Sector of Myanmar where
61 FMU (Forest management Units) data has been compiled.
This data is also available only for current working plan period (2006-2016).
A. Data for 1990
Working Circle Area of 36 Forest Divisions (expired at 1970 but not updated till 1995)

FRA 2010 – Country Report, Myanmar
15
Type of Working Circles Area in 000 hectares
1 Teak Selection Working Circle 2854
2 Teak Eradication Working Circle 239
3 Hardwood supply working circle 1178
4 Public Forest Working Circle 290
5 Local Supply Working Circle 101
6 Cutch Working Circle 87
7 Fuelwood Working Circle 50
8 Tidal Forest Working Circle 46
9 Special Working Circles 312
Total 5157
(Note: Teak Selection Working Circle area contains Hardwood supply working circles)
This information has been updated for 1990 as under with information on “Protected Areas
System”.
Type of Working Circles Area in 000 hectares
Teak Selection Working Circle 2854
Teak Eradication Working Circle 239
Hardwood supply working circle 1178
Public Forest Working Circle 290
Local Supply Working Circle 101
Cutch Working Circle 87
Fuelwood Working Circle 50
Tidal Forest Working Circle 46
Special Working Circles 312
Protected Areas Systems Area 720
Total Under management plans 5877
Forest area not under management plans 33625
B. Data for 2000 and 2005 and 2010
Working Circle Area of 61 Forest Management Units (1995-2005)
Type of Working Circles Area in 000 hectares
(2000)
1 Non Wood Forest Products W.C 5182
2 Production Working Circle 12017
3 Plantations Working Circle 651
4 Local Supply/ Community Forestry W.C 6749
5 Watershed Forests W.C 1499
6 Mangrove W.C 76
7 Protected Areas System W.C 964
The above data updated with data of Protected Area System for 2000 and actual area under
plantations in 2000.
Type of Working Circles
Area in 000 hectares
(2000)

FRA 2010 – Country Report, Myanmar
16
Non Wood Forest Products W.C 5182
Production Working Circle 12017
Plantations Working Circle 696
Local Supply/ Community Forestry W.C 6749
Watershed Forests W.C 1499
Mangrove W.C 76
Protected Areas System WC 1220
Total Area under management plans 27439
Forest area not under management plan 7683
Similarly information updated for 2005 with the help of Protection Area System for 2004 and
plantation area in 2005 (planned).
Type of Working Circles
Area in 000 hectares
(2005)
Non Wood Forest Products W.C 5182
Production Working Circle 12017
Plantations Working Circle 849
Local Supply/ Community Forestry W.C 6749
Watershed Forests W.C 1499
Mangrove W.C 76
Protected Areas System WC 4901
Total Area under management plans 31273
Forest area not under management plan 2936
Year 2010 Working Circle 000 hectares
1 Non Wood Forest Products W.C 942
2 Production Working Circle 11075
3 Plantations Working Circle 545
4 Local Supply/ Community Forestry W.C 7071
5 Watershed Forests W.C 1352
6 Mangrove W.C 50
7 Protected Areas System W.C* 2081
8 Forest area not included in WCs 8772
* Updated with actual PAS area on working plan
3.3 Analysis and processing of national data
3.3.1 Estimation and forecasting
For 1990, 2000, 2005 and 2010 figures for Protection, production and conservation forest
have been taken from previous tables. The rest of the forest area has been considered as
multiple forest to make the total match with table 1.
3.3.2 Reclassification into FRA 2010 categories
For 1990

FRA 2010 – Country Report, Myanmar
17
Percentage of a National Class into a FRA 2005 classes National Category
Prod
F/OWL
Prot
F/OWL
Conservation of
Biodiversity
Social
function
Multiple
function
Unknown
function
Forests
Teak Selection WC 100
Teak Eradication WC 100
Hardwood supply WC 100
Public Forest WC 100
Local Supply WC 100
Cutch Working Circle 100
Fuelwood Working Circle 100
Tidal Forest Working Circle 100
Special Working Circles 100
Protected Areas Systems WC 100
Forest area not under
management plans 100
For 2000 2005 and 2010
Percentage of a National Class into a FRA 2005 classes -Primary
Function National Category
Production Protection CBD Social Multiple Unknown
Forest
Non Wood Forest Product WC 100
Production Working Circle 100
Plantations Working Circle 100
Local Supply/ Community Forestry W.C 100
Watershed Forests W.C 100
Mangrove W.C 100
Protected Areas System W.C 100
Forest area not under management plans 100
3.4 Data for Table T3
Table 3a – Primary designated function
Forest area (1000 hectares) FRA 2010 Categories
1990 2000 2005 2010
Production 4 422 24 644 24 797 19 633
Protection of soil and water 312 1 499 1 499 1 352
Conservation of biodiversity 720 1220 4 901 2 081
Social services 0 0 0 0
Multiple use 33 764 7 505 2 124 8 707
Other (please specify in comments below the table) 0 0 0 0
No / unknown 0 0 0 0
TOTAL 39 218 34 868 33 321 31 773
FRA 2010 – Country Report, Myanmar
18
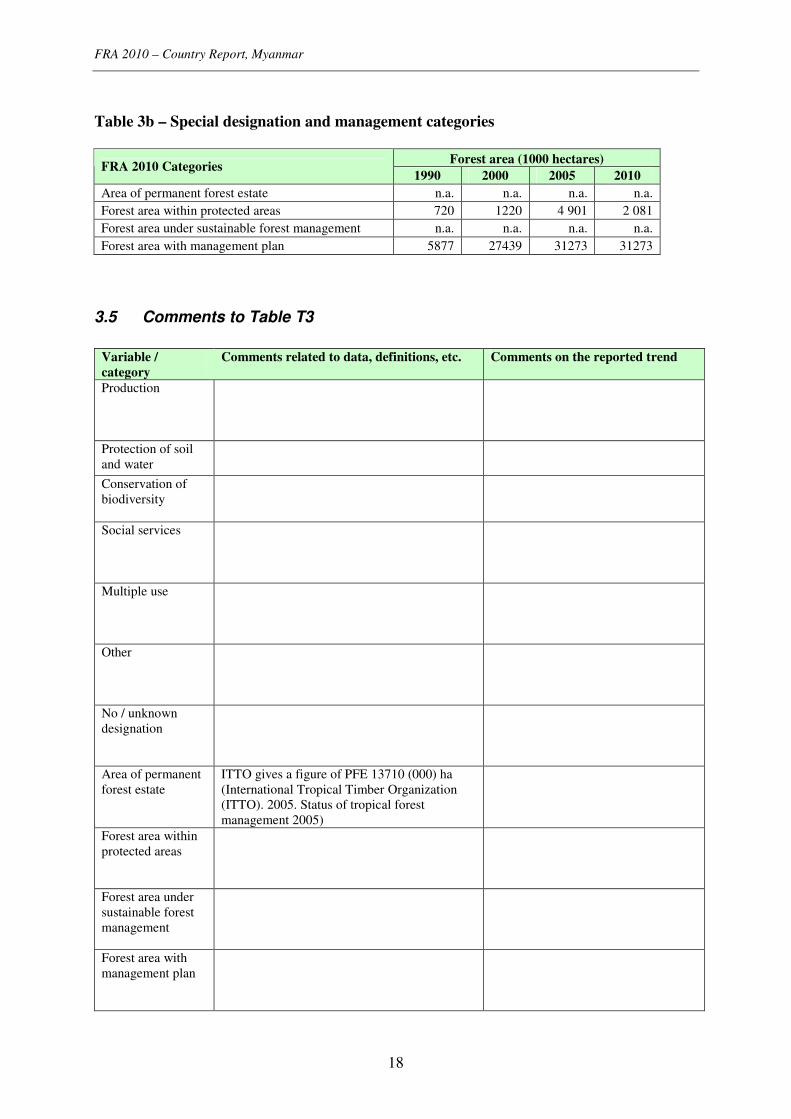
Table 3b – Special designation and management categories
Forest area (1000 hectares) FRA 2010 Categories
1990 2000 2005 2010
Area of permanent forest estate n.a. n.a. n.a. n.a. Forest area within protected areas 720 1220 4 901 2 081
Forest area under sustainable forest management n.a. n.a. n.a. n.a. Forest area with management plan 5877 27439 31273 31273
3.5 Comments to Table T3
Variable /
category
Comments related to data, definitions, etc. Comments on the reported trend
Production
Protection of soil
and water
Conservation of
biodiversity
Social services
Multiple use
Other
No / unknown
designation
Area of permanent
forest estate
ITTO gives a figure of PFE 13710 (000) ha
(International Tropical Timber Organization
(ITTO). 2005. Status of tropical forest
management 2005)
Forest area within
protected areas
Forest area under
sustainable forest
management
Forest area with
management plan
FRA 2010 – Country Report, Myanmar
19
Other general comments to the table
Forest Management Plans of Myanmar Forest Department classifies the forest area of the country into 7
categories for management purposes (known as working circles). Some other wooded lands may be included in
these working circle areas. Working circle can also overlap (NWFP with production working circle) each other.
The following data is extracted from Thirty Years Plans for Forestry Sector of Myanmar where 61 FMU
(Forest management Units) data has been compiled. This data is also available only for current working plan
period (1995-2005). The old working plans that expired in 1970but not updated till 1995 provide similar
classification for 1990.

FRA 2010 – Country Report, Myanmar
20
4 Table T4 – Forest characteristics
4.1 FRA 2010 Categories and definitions
Term / category Definition
Naturally regenerated forest Forest predominantly composed of trees established through natural
regeneration.
Introduced species A species, subspecies or lower taxon, occurring outside its natural range
(past or present) and dispersal potential (i.e. outside the range it occupies
naturally or could occupy without direct or indirect introduction or care
by humans).
Characteristics categories
Primary forest Naturally regenerated forest of native species, where there are no clearly
visible indications of human activities and the ecological processes are
not significantly disturbed.
Other naturally regenerated forest Naturally regenerated forest where there are clearly visible indications of
human activities.
Other naturally regenerated forest
of introduced species
(sub-category)
Other naturally regenerated forest where the trees are predominantly of
introduced species.
Planted forest Forest predominantly composed of trees established through planting
and/or deliberate seeding.
Planted forest of introduced species
(sub-category)
Planted forest, where the planted/seeded trees are predominantly of
introduced species.
Special categories
Rubber plantations Forest area with rubber tree plantations.
Mangroves Area of forest and other wooded land with mangrove vegetation.
Bamboo Area of forest and other wooded land with predominant bamboo
vegetation.
4.2 National data
4.2.1 Data sources
References to sources of
information
Quality
(H/M/L)
Variable(s) Year(s) Additional comments
GOM. 2004. Plantation database
(unpublished). Forest Department,
Planning and Statistics Div
M Plantation area Till 2004
FAO.2007. Mangroves of Asia,
working paper 137 Mangroves Secondary source
FAO.2007. World Bamboo
resources, FRA 2005 thematic study
working paper 126
Bamboo Secondary source
4.2.2 Classification and definitions
National class Definition
No relevant national classification and definitions are available for this table.

FRA 2010 – Country Report, Myanmar
21
4.2.3 Original data
Following table presents forest area under plantation from plantation database of Forest
Department. The figures for 1990, 2000, 2003 data are actual figures and that for 2005 data is
based on target set for 2005 by the Forest Department.
Year
Forest Area under Plantations
(000 hectares)
1990 394
2000 696
2003 788
2005 849
Following table is plantation database of Forest Department. 1990, 2000, 2003,2005-2009 data are actual figures and 2010 data is the figure of target set for 2010 by the Forest Department.
Year 000 hectares
2006 857.208
2007 892.640
2008 924.855
2009 957.471
2010 988.533
There are no national figures on primary forest. WCMC reports a total protected areas of
3.192 million hectares and it is assumed that this area can be a quite reliable proxy to estimate
primary forest.
The difference between total forest as from table 1 and the planted forest and primary forest
has been considered as other naturally regenerated forest.
The FAO study on Mangroves reports the following figures for mangroves for 1972:
Mangroves area ha 1972
Area ha 571 071
Original source 1972:
Hthay, U. T. and U.S. Han. 1984.Mangrove forests of Burma. In:proceedings of the Asian
Symposium on Mangrove
Environment Research and Management, Kuala Lumpur, August 25-29, 1980. p. 82-85 Edited
by E. Soepadmo, A.N. Rao and D.J. MacIntosh. 1984
Other data on mangrove comes from the following sources:
Sr.
No. State /Division Year Hectares Source
1 Rakhine State 1996 157992 Japan Forest Technical Association
(JAFTA) Data
2 Ayeyarwady
Division
2003 90387 Japan International Cooperation
Agency (JICA)
3 Tanintharyi
Division
2000 237866 Technical paper, FD FAO
Total 486 245
FRA 2010 – Country Report, Myanmar
22
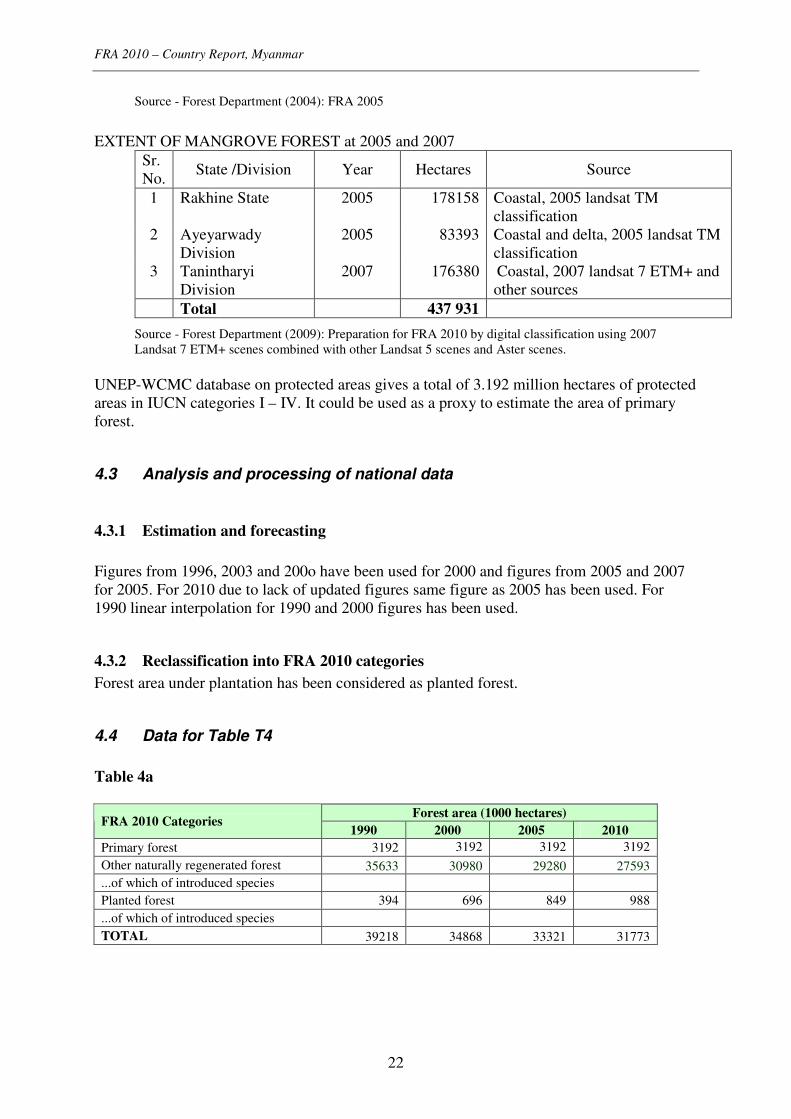
Source - Forest Department (2004): FRA 2005
EXTENT OF MANGROVE FOREST at 2005 and 2007
Sr.
No. State /Division Year Hectares Source
1 Rakhine State 2005 178158 Coastal, 2005 landsat TM
classification
2 Ayeyarwady
Division
2005 83393 Coastal and delta, 2005 landsat TM
classification
3 Tanintharyi
Division
2007 176380 Coastal, 2007 landsat 7 ETM+ and
other sources
Total 437 931
Source - Forest Department (2009): Preparation for FRA 2010 by digital classification using 2007
Landsat 7 ETM+ scenes combined with other Landsat 5 scenes and Aster scenes.
UNEP-WCMC database on protected areas gives a total of 3.192 million hectares of protected
areas in IUCN categories I – IV. It could be used as a proxy to estimate the area of primary
forest.
4.3 Analysis and processing of national data
4.3.1 Estimation and forecasting
Figures from 1996, 2003 and 200o have been used for 2000 and figures from 2005 and 2007
for 2005. For 2010 due to lack of updated figures same figure as 2005 has been used. For
1990 linear interpolation for 1990 and 2000 figures has been used.
4.3.2 Reclassification into FRA 2010 categories
Forest area under plantation has been considered as planted forest.
4.4 Data for Table T4
Table 4a
Forest area (1000 hectares)
FRA 2010 Categories 1990 2000 2005 2010
Primary forest 3192 3192 3192 3192
Other naturally regenerated forest 35633 30980 29280 27593
...of which of introduced species
Planted forest 394 696 849 988
...of which of introduced species
TOTAL 39218 34868 33321 31773
FRA 2010 – Country Report, Myanmar
23
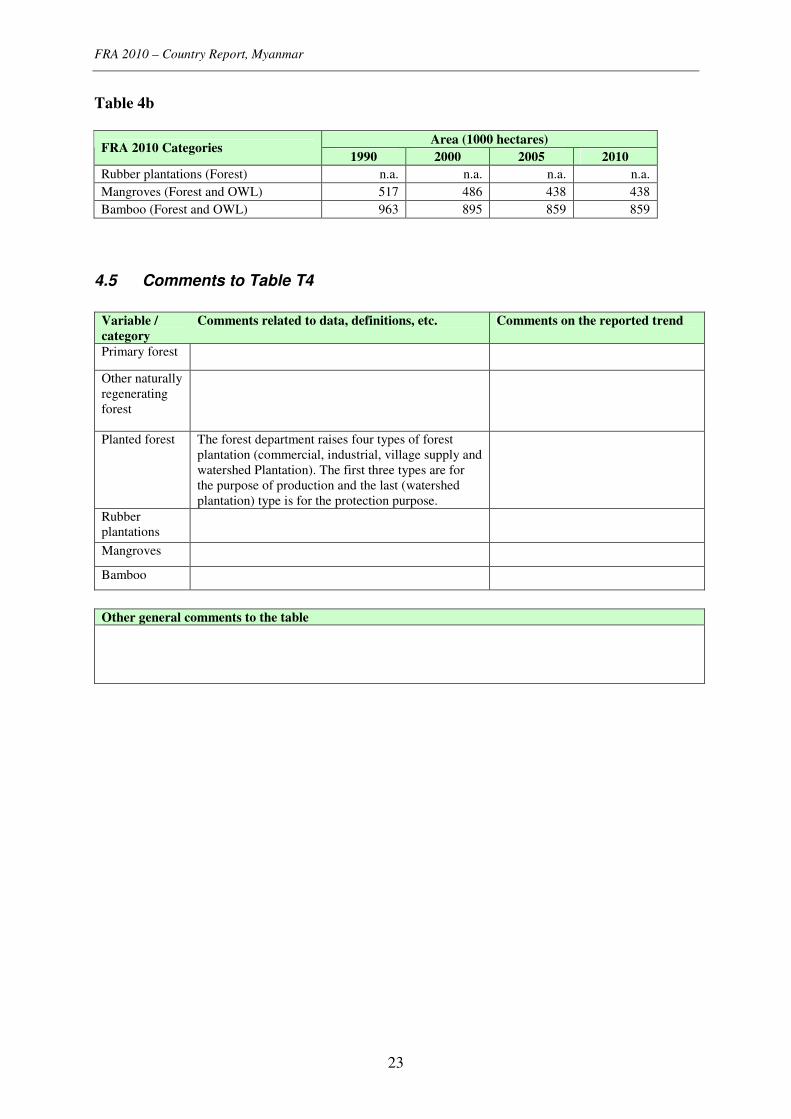
Table 4b
Area (1000 hectares)
FRA 2010 Categories 1990 2000 2005 2010
Rubber plantations (Forest) n.a. n.a. n.a. n.a. Mangroves (Forest and OWL) 517 486 438 438
Bamboo (Forest and OWL) 963 895 859 859
4.5 Comments to Table T4
Variable /
category
Comments related to data, definitions, etc. Comments on the reported trend
Primary forest
Other naturally
regenerating
forest
Planted forest The forest department raises four types of forest
plantation (commercial, industrial, village supply and
watershed Plantation). The first three types are for
the purpose of production and the last (watershed
plantation) type is for the protection purpose.
Rubber
plantations
Mangroves
Bamboo
Other general comments to the table

FRA 2010 – Country Report, Myanmar
24
5 Table T5 – Forest establishment and reforestation
5.1 FRA 2010 Categories and definitions
Term Definition
Afforestation Establishment of forest through planting and/or deliberate seeding on
land that, until then, was not classified as forest.
Reforestation Re-establishment of forest through planting and/or deliberate seeding on
land classified as forest.
Natural expansion of forest Expansion of forests through natural succession on land that, until then,
was under another land use (e.g. forest succession on land previously
used for agriculture).
5.2 National data
5.2.1 Data sources
References to sources of
information
Quality
(H/M/L)
Variable(s) Year(s) Additional comments
Source: Planning &
Statistics Division, Forest
Department
Forest
plantations
up to
2007
5.2.2 Classification and definitions
National class Definition
Not available
5.2.3 Original data
Year Type of Plantation Total
Commercial Village Supply Industrial Watershed
1 2 3 4 5 6
1896-1941 38262 8907 0 0 47169
1948-1962 1230 692 0 0 1922
1963 444 297 0 0 741
1964 808 790 35 0 1633
1965 1749 944 23 0 2716
1966 1651 796 6 0 2453
1967 2557 876 45 0 3478
1968 3035 711 40 0 3786
1969 2112 716 51 0 2879
1970 1930 1234 45 0 3209

FRA 2010 – Country Report, Myanmar
25
1971 1634 1103 35 0 2772
1972 1053 2055 42 0 3150
1973 1506 1185 32 0 2723
1974 921 1612 33 0 2566
1975 1180 1870 24 0 3074
1976 1510 1591 24 0 3125
1977 2047 1534 40 0 3621
1978 2251 2033 20 0 4304
1979 3208 3252 210 61 6731
1980 8405 4409 228 453 13495
1981 11493 3654 283 1817 17247
1982 14666 3491 526 3553 22236
1983 16304 6235 769 4304 27612
1984 18517 6907 1433 3960 30817
1985 18627 10711 2776 4228 36342
1986 18918 7968 3446 2615 32947
1987 17323 6730 5540 2716 32309
1988 16382 5799 4958 2777 29916
1989 13812 1303 2448 1165 18728
1990 18313 6006 4573 1807 30699
1991 18255 7268 3905 1607 31035
1992 17335 7892 4128 2232 31587
1993 13406 11198 3244 3164 31012
1994 6309 12742 890 2641 22582
1995 11791 13470 2750 4089 32100
1996 13409 13729 2226 3399 32763
1997 13871 6803 2246 7264 30184
1998 16780 5981 2084 3905 28750
1999 17265 5247 1093 7111 30716
2000 16848 4335 2086 7451 30720
2001 15571 4543 3703 6941 30758
2002 15358 4695 3513 7831 31397
2003 15344 4413 3319 7366 30442
2004 16279 3656 3905 8134 31974
2005 17085 4219 2995 8903 33202
2006 17094 2600 1922 6712 28328
2007 12889 2125 1926 6961 23901
Total 496737 210327 73620 125167 905 851
5.3 Analysis and processing of national data
5.3.1 Calibration

FRA 2010 – Country Report, Myanmar
26
5.3.2 Estimation and forecasting
The average of the 5 years period 1988-1992, 1998-2002 and 2003-2007 have been used to
estimate annual forest respectively for 1990, 2000 and 2005.
5.3.3 Reclassification into FRA 2010 categories
The annual planting has been considered as belonging to the reforestation categories since no
breakdown between afforestation and reforestation plantings was possible.
5.4 Data for Table T5
Annual forest establishment
(hectares/year)
...of which of introduced species 1)
(hectares/year) FRA 2010 Categories
1990 2000 2005 1990 2000 2005
Afforestation n.a. n.a. n.a. n.a. n.a. n.a.
Reforestation 28393 30468 29569 n.a. n.a. n.a.
...of which on areas previously planted n.a. n.a. n.a. n.a. n.a. n.a.
Natural expansion of forest n.a. n.a. n.a. n.a. n.a. n.a.
Note: The figures for the reporting years refer to the averages for the 5-year periods 1988-1992, 1998-2002
and 2003-2007 respectively.
5.5 Comments to Table T5
Variable /
category
Comments related to data, definitions,
etc.
Comments on the reported trend
Afforestation
Reforestation Figures for reforestation may include also
some afforestation activities, since no
separated figures were available.
Natural expansion
of forest
Other general comments to the table

FRA 2010 – Country Report, Myanmar
27
6 Table T6 – Growing stock
6.1 FRA 2010 Categories and definitions
Category Definition
Growing stock Volume over bark of all living trees more than X cm in diameter at breast
height (or above buttress if these are higher). Includes the stem from ground
level or stump height up to a top diameter of Y cm, and may also include
branches to a minimum diameter of W cm.
Growing stock of commercial
species
Growing stock (see def. above) of commercial species.
6.2 National data
6.2.1 Data sources
References to
sources of
information
Quality
(H/M/L)
Variable(s) Year(s) Additional comments
Inventory
Section,
Planning and
Statistics
Division, Forest
Department,
Ministry of
Forestry
Growing
stock
Ministry of Forestry is responsible for the
assessment of forest growing stock data in
Myanmar.
Growing
stock
composition
The records of the Planning and Statistics
Division of Forest Department, which has
been conducting NFI (National Forest
Inventory) since 1982.
6.2.2 Classification and definitions
The following table describes national classification of growing stock and commercial
growing stock used.
National class Definition
Growing Stock The sum-total of all trees, by number or volume or biomass, growing within a
particular area of interest.
[Myanmar Forest Department measures all living trees over 20cm diameter at
breast height (1.3m) in a sampling survey. Volume equations are constructed
in the manner of forest inventory surveys during 1980s and used to calculate
tree volume. For Volume equation, sample trees are measured from 30cm
above ground to the crown point is taken as length and calculated. Branches
etc. are not measured. This means growing stock given is the commercial
(marketable part as timber) above stump.]
Commercial growing
stock (meaning
growing stock of
commercial tree
species)
Growing stock of tree species and groups prescribed by the Forest Department
and Myanma Timber Enterprise are commercial. Teak is in its own class,
others are Group 1, 2, 3, 4, 5 and others. Group 1 includes hard woods such as
Xylia xylocarpa, Paduak (Pterocarpus macroparus). Durability and values are
highest in Group 1 and decrease follow with the group number.

FRA 2010 – Country Report, Myanmar
28
6.2.3 Original data
State/ Inventory Inventory Volume Forest Cover Area Total
Sr. Division Covered Volume
per hactare Closed Open Volume
ha cu m3 cu m
3 (, 000) ha (, 000) ha cu m
3
1 Kachin 285,950 12,456,794 44 4,819.2 1,306.5 266,853
2 Kayah 460,640 15,173,532 33 130.4 306.1 14,380
3 Karen 460,640 15,173,532 33 1,151.4 892.4 67,322
4 Chin 889,550 27,040,496 30 1,472.0 857.1 70,800
5 Sagaing 802,270 36,547,706 46 3,230.8 1,818.7 230,035
6 Tannintharyi 120,400 7,877,689 65 2,480.2 930.5 223,156
7 Bago 712,610 35,545,961 50 380.6 726.2 55,207
8 Magway 789,780 30,503,688 39 546.2 159.3 27,250
9 Mandalay 703,550 17,795,022 25 124.5 788.3 23,088
10 Mon 120,400 7,877,689 65 226.8 268.1 32,380
11 Rakhine 399,980 16,038,123 40 831.4 1,645.4 99,312
12 Yangon 56,190 1,958,288 35 15.6 92.0 3,753
13 Shan 866,970 43,069,905 50 1,939.8 5,470.9 368,153
14 Ayeyarwady 146,980 7,205,968 49 120.0 281.2 19,670
6,815,910 274,264,393 17,468.9 15,542.9 1,501,360
Kayah and Kayin inventory volume data is estimated from Southern Shan State Inventory
data. Mon inventory volume data is estimated from Tanintharyi Inventory data. Common
name
Scientific name Growing
stock
Kanyin Dipterocarpus spp. 147,306
In
Dipterocarpus
tuberculatus 99,938
Kyun Tectona grandis 90,918
Thabye Eugenia spp. 82,985
Ingyin Pentacme siamensis 76,711
Taukkyan Terminalia tomentosa 50,424
Pyinkado Xylia dolabriformis 47,550
Thitya Shorea oblongifolia 41,861
Gangaw Mesua ferrea 34,526
Taung-
thayet Swintonia floribunda 29,165
Sub Total 701,385
remaining species 799,975
Total 1501360

FRA 2010 – Country Report, Myanmar
29
6.3 Analysis and processing of national data
6.3.1 Estimation and forecasting
The growing stock per ha of 45m3/ha as coming from the previous table has been applied to
the total forest area from T1.
For the commercial growing stock the ratio commercial/total of 27.85% as calculated from
previous forest inventories has been applied to the total growing stock.
For the growing stock composition, same percentage as presented in the previous table has
been applied to the total growing stock previously calculated.
6.4 Data for Table T6
Table 6a – Growing stock
Volume (million cubic meters over bark)
Forest Other wooded land FRA 2010 category
1990 2000 2005 2010 1990 2000 2005 2010
Total growing stock 1765 1569 1499 1430 n.a. n.a. n.a. n.a. ... of which coniferous n.a. n.a. n.a. n.a. n.a. n.a. n.a. n.a. ... of which broadleaved n.a. n.a. n.a. n.a. n.a. n.a. n.a. n.a. Growing stock of
commercial species 491 437 418 398 n.a. n.a. n.a. n.a.
Table 6b – Growing stock of the 10 most common species
FRA 2010 category / Species name
Growing stock in forest
(million cubic meters)
Rank Scientific name Common name 1990 2000 2005
1st Dipterocarpus spp. Kanyin 173 154 147
2nd
Dipterocarpus tuberculatus In 117 104 100
3rd
Tectona grandis Kyun 107 95 91
4th
Eugenia spp. Thabye 98 87 83
5th
Pentacme siamensis Ingyin 90 80 77
6th
Terminalia tomentosa Taukkyan 59 53 50
7th
Xylia dolabriformis Pyinkado 56 50 47
8th
Shorea oblongifolia Thitya 49 44 42
9th
Mesua ferrea Gangaw 41 36 34
10th
Swintonia floribunda Taung-thayet 34 30 29
Remaining Rest of spp. Rest of spp. 941 836 799
Total TOTAL TOTAL 1765 1569 1499
Note: Rank refers to the order of importance in terms of growing stock, i.e. 1
st is the species with the highest
growing stock. Year 2000 is the reference year for defining the species list and the order of the species.
Table 6c – Specification of threshold values

FRA 2010 – Country Report, Myanmar
30
Item Value Complementary information
Minimum diameter (cm) at breast height1 of
trees included in growing stock (X) 20 cm
Minimum diameter (cm) at the top end of
stem for calculation of growing stock (Y) 10 cm
Minimum diameter (cm) of branches included
in growing stock (W) n.a.
Volume refers to “above ground” (AG) or
“above stump” (AS) AS
6.5 Comments to Table T6
Variable / category Comments related to data,
definitions, etc.
Comments on the reported trend
Total growing stock
Growing stock of
broadleaved / coniferous
Growing stock of
commercial species
Other general comments to the table
The working Plan Division of Forest Department has been implementing all kinds of forest surveys since 1850.
Up to 1980s Forest Department has relied on cent percent surveys of teak and hardwoods from enumeration
process during teak girdling operation and Selection Marking operation of Hardwood for felling. Modern
sampling techniques have been given priority over convention methods since 1990. With the aid of remote
sensing, GIS and computer databases, national forest inventory is being carried out each year with prescribed
planning of 5 years intervals.
During sampling survey (inventory) all living trees over 20cm diameter at breast height (1.3m) are measured in
a sampling survey. For Volume equation, sample trees are measured from 30cm above ground to the crown
point and it is taken as stem length and volume is calculated. The branches etc. are not measured and their
volume is not included in the growing stock. This means growing stock given is the marketable part (as timber)
above the stump.
The valuable species composition has comparatively decreased within 10 years.
1 Diameter at breast height (DBH) refers to diameter over bark measured at a height of 1.30 m above ground
level or 30 cm above buttresses if these are higher than 1 m.

FRA 2010 – Country Report, Myanmar
31
7 Table T7 – Biomass stock
7.1 FRA 2010 Categories and definitions
Category Definition
Above-ground biomass All living biomass above the soil including stem, stump, branches, bark, seeds,
and foliage.
Below-ground biomass All biomass of live roots. Fine roots of less than 2mm diameter are excluded
because these often cannot be distinguished empirically from soil organic matter or
litter.
Dead wood All non-living woody biomass not contained in the litter, either standing, lying on
the ground, or in the soil. Dead wood includes wood lying on the surface, dead
roots, and stumps larger than or equal to 10 cm in diameter or any other diameter
used by the country.
7.2 National data
7.2.1 Data sources
References to sources of
information
Quality
(H/M/L)
Variable(s) Year(s) Additional comments
FAO. 2008. Guidelines
for Country Reporting to
FRA 2005. Global Forest
Resources Assessment
2010
Biomass conversion and expansion
factor (BCEF) and root-shoot ratio
from Appendix 5 FRA guidelines
7.2.2 Classification and definitions
National class Definition
Not available
7.2.3 Original data
There is no data on biomass. This table uses data from Table 6.
7.3 Analysis and processing of national data
7.3.1 Estimation and forecasting
Above ground biomass:
Following recommendations from FRA guidelines the following assumptions and calculations
have been made:

FRA 2010 – Country Report, Myanmar
32
From appendix 5, table 5.4 pag 6 of the FRA guidelines and considering a humid tropical
ecological zone and a growing stock is in the range 41-60m3/ha the biomass conversion and
expansion factor (BCEF) of 2.05 has been applied to the growing stock:
Below ground biomass :
From appendix 5, table 5.3 pag 5 of the FRA guidelines, considering an above ground
biomass<125t/ha and tropical forest biome (no estimates available for the subtropical
mountain system), the root-shoot ratio of 0.20 has been chosen.
1990 2000 2005 2010
Growing stock (million m3) 1765 1569 1499 1430
BCEF 2.05 2.05 2.05 2.05
Aboveground biomass
(million tonnes) 3618 3217 3074 2931
Root-shoot ratio 0.20 0.20 0.20 0.20
Belowground biomass 724 643 615 586
7.4 Data for Table T7
Biomass (million metric tonnes oven-dry weight)
Forest Other wooded land FRA 2010 category
1990 2000 2005 2010 1990 2000 2005 2010
Above-ground biomass 3618 3217 3074 2931 n.a. n.a. n.a. n.a. Below-ground biomass 724 643 615 586 n.a. n.a. n.a. n.a. Dead wood n.a. n.a. n.a. n.a. n.a. n.a. n.a. n.a. TOTAL n.a. n.a. n.a. n.a. n.a. n.a. n.a. n.a.
7.5 Comments to Table T7
Variable /
category
Comments related to data, definitions,
etc.
Comments on the reported trend
Above-ground
biomass
Below-ground
biomass
Dead wood
Other general comments to the table
FRA 2010 – Country Report, Myanmar
33
8 Table T8 – Carbon stock
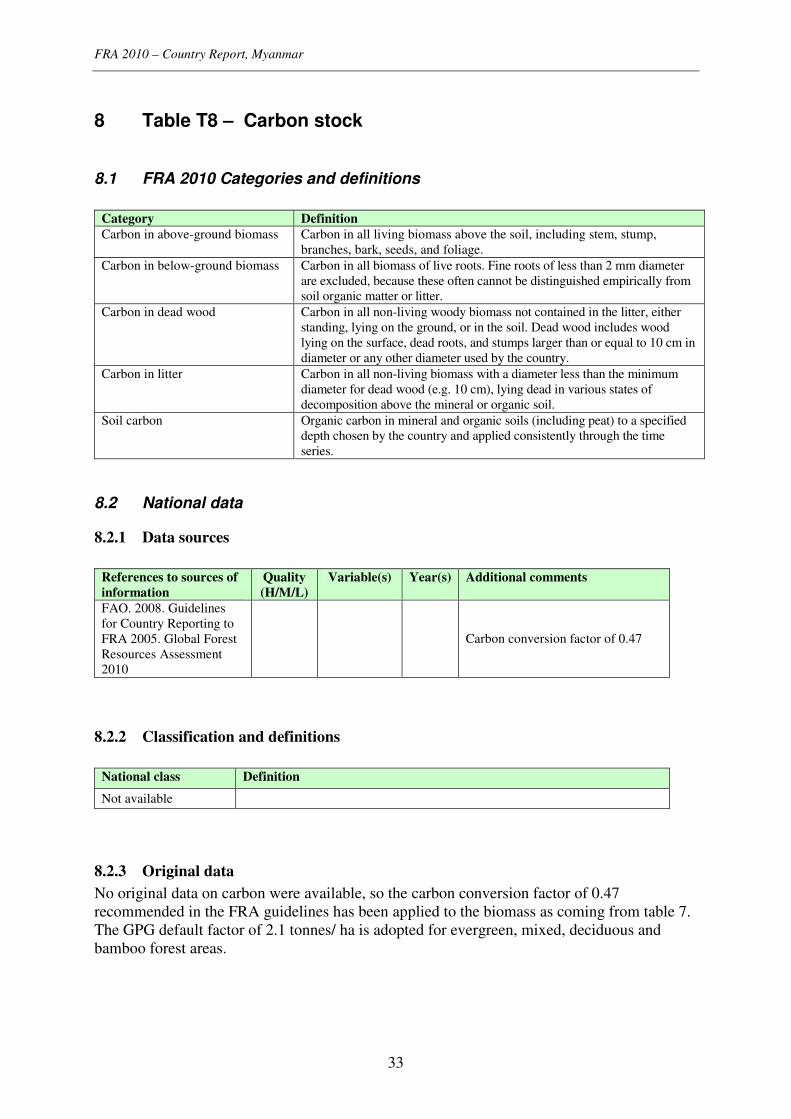
8.1 FRA 2010 Categories and definitions
Category Definition
Carbon in above-ground biomass Carbon in all living biomass above the soil, including stem, stump,
branches, bark, seeds, and foliage.
Carbon in below-ground biomass Carbon in all biomass of live roots. Fine roots of less than 2 mm diameter
are excluded, because these often cannot be distinguished empirically from
soil organic matter or litter.
Carbon in dead wood Carbon in all non-living woody biomass not contained in the litter, either
standing, lying on the ground, or in the soil. Dead wood includes wood
lying on the surface, dead roots, and stumps larger than or equal to 10 cm in
diameter or any other diameter used by the country.
Carbon in litter Carbon in all non-living biomass with a diameter less than the minimum
diameter for dead wood (e.g. 10 cm), lying dead in various states of
decomposition above the mineral or organic soil.
Soil carbon Organic carbon in mineral and organic soils (including peat) to a specified
depth chosen by the country and applied consistently through the time
series.
8.2 National data
8.2.1 Data sources
References to sources of
information
Quality
(H/M/L)
Variable(s) Year(s) Additional comments
FAO. 2008. Guidelines
for Country Reporting to
FRA 2005. Global Forest
Resources Assessment
2010
Carbon conversion factor of 0.47
8.2.2 Classification and definitions
National class Definition
Not available
8.2.3 Original data
No original data on carbon were available, so the carbon conversion factor of 0.47
recommended in the FRA guidelines has been applied to the biomass as coming from table 7.
The GPG default factor of 2.1 tonnes/ ha is adopted for evergreen, mixed, deciduous and
bamboo forest areas.

FRA 2010 – Country Report, Myanmar
34
8.3 Data for Table T8
Carbon (Million metric tonnes)
Forest Other wooded land FRA 2010
Category 1990 2000 2005 2010 1990 2000 2005 2010
Carbon in above-
ground biomass 1700 1512 1445 1378 n.a. n.a. n.a. n.a.
Carbon in below-
ground biomass 340 302 289 276 n.a. n.a. n.a. n.a.
Sub-total: Living
biomass 2040 1814 1734 1653 n.a. n.a. n.a. n.a.
Carbon in dead
wood n.a. n.a. n.a. n.a. n.a. n.a. n.a. n.a.
Carbon in litter 82 73 70 67
n.a. n.a. n.a. n.a.
Sub-total: Dead
wood and litter n.a. n.a. n.a. n.a. n.a. n.a. n.a. n.a.
Soil carbon n.a. n.a. n.a. n.a. n.a. n.a. n.a. n.a.
TOTAL n.a. n.a. n.a. n.a. n.a. n.a. n.a. n.a.
Soil depth (cm) used for soil carbon estimates
8.4 Comments to Table T8
Variable /
category
Comments related to data, definitions,
etc.
Comments on the reported trend
Carbon in
above-ground
biomass
Carbon in
below-ground
biomass
Carbon in dead
wood
Carbon in litter
Soil carbon
Other general comments to the table

FRA 2010 – Country Report, Myanmar
35
9 Table T9 – Forest fires
9.1 FRA 2010 Categories and definitions
Category Definition
Number of fires Average number of vegetation fires per year in the country.
Area affected by fire Average area affected by vegetation fires per year in the country.
Vegetation fire
(supplementary term)
Any vegetation fire regardless of ignition source, damage or benefit.
Wildfire Any unplanned and/or uncontrolled vegetation fire.
Planned fire A vegetation fire regardless of ignition source that burns according to
management objectives and requires limited or no suppression action.
9.2 National data
9.2.1 Data sources
References to sources of information
Quality (H/M/L)
Variable(s) Year(s) Additional comments
Satellite images H
9.2.2 Classification and definitions
Category Definition
Not available
9.2.3 Original data
Year All Affected Area Within reserved forest (Ha.)
Y 1990 4,248,247.55 76,442.81
Y 2000 2,452,839.79 63,844.42
Y 2005 1,091,083.90 217,756.23
Y 2008 1,001,663.92 178,755.03
Y 2010 434,687.07 206,059.85
9.3 Analysis and processing of national data
9.3.1 Calibration
9.3.2 Estimation and forecasting
9.3.3 Reclassification into FRA 2010 categories
FRA 2010 – Country Report, Myanmar
36
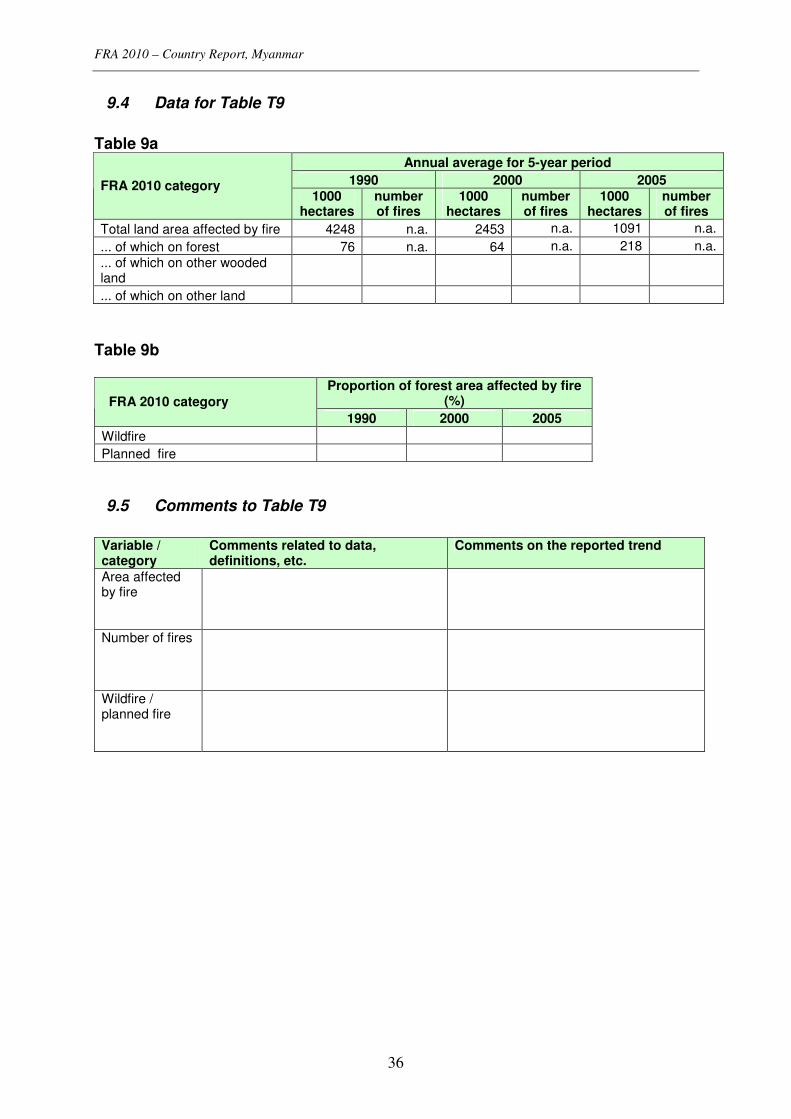
9.4 Data for Table T9
Table 9a
Annual average for 5-year period
1990 2000 2005 FRA 2010 category 1000
hectares number of fires
1000 hectares
number of fires
1000 hectares
number of fires
Total land area affected by fire 4248 n.a. 2453 n.a. 1091 n.a.
... of which on forest 76 n.a. 64 n.a. 218 n.a.
... of which on other wooded land
... of which on other land
Table 9b
Proportion of forest area affected by fire (%) FRA 2010 category
1990 2000 2005
Wildfire
Planned fire
9.5 Comments to Table T9
Variable / category
Comments related to data, definitions, etc.
Comments on the reported trend
Area affected by fire
Number of fires
Wildfire / planned fire

FRA 2010 – Country Report, Myanmar
37
10 Table T10 – Other disturbances affecting forest health and vitality
No data available.

FRA 2010 – Country Report, Myanmar
38
11 Table T11 – Wood removals and value of removals
11.1 FRA 2010 Categories and definitions
Category Definition
Industrial roundwood
removals
The wood removed (volume of roundwood over bark) for production of goods and
services other than energy production (woodfuel).
Woodfuel removals
The wood removed for energy production purposes, regardless whether for
industrial, commercial or domestic use.
11.2 National data
11.2.1 Data sources
References to sources of
information
Quality
(H/M/L)
Variable(s) Year(s) Additional comments
GOM. 2003. Annual
Reports (1992-93 to 2003-
04) of Myanmar Timber
Enterprise. Myanmar.
M Wood
Removal
1990 to
2003
GOM. 2004.
Departmental Database of
Planning and Statistics
Division. Forest
Department. Myanmar.
M Wood fuel
Removal
1990 to
2003
11.2.2 Classification and definitions
National class Definition
Not available
11.2.3 Original data
Main Source for round wood removal data is extracted from annual report (1992-93 to 2003-
04) of Myanmar Timber Enterprise. Woodfuel removal data is compiled from the
departmental data base of planning and Statistics Forest Department Division. No data exists
for other land with trees.
Round Wood
Removal
1990-
91
1991-
02
1992-
93
1993-
94
1994-
95
1995-
96
1996-
97
1997-
98
1998-
99
1999-
00
2000-
01
2001-
02
2002-
03
2003-
04
Industrial Round
Wood 3.57 3.44 3.18 3.19 2.62 2.65 2.81 3.18
3.
28 3.35 3.57 3.94 3.88 3.88
Fuelwood 32.27 32.22 32.38 32.40 32.48 31.46 31.96 31.14 31.75 33.14 33.49 34.20 34.94 35.66
Total 35.84 35.66 35.56 35.59 35.10 34.10 34.78 34.31 35.03 36.49 37.06 38.13 38.81 39.55
For value of removals no documented source is available. The value of wood and fuelwood is
calculated based on annual prevailing prices.
FRA 2010 – Country Report, Myanmar
39
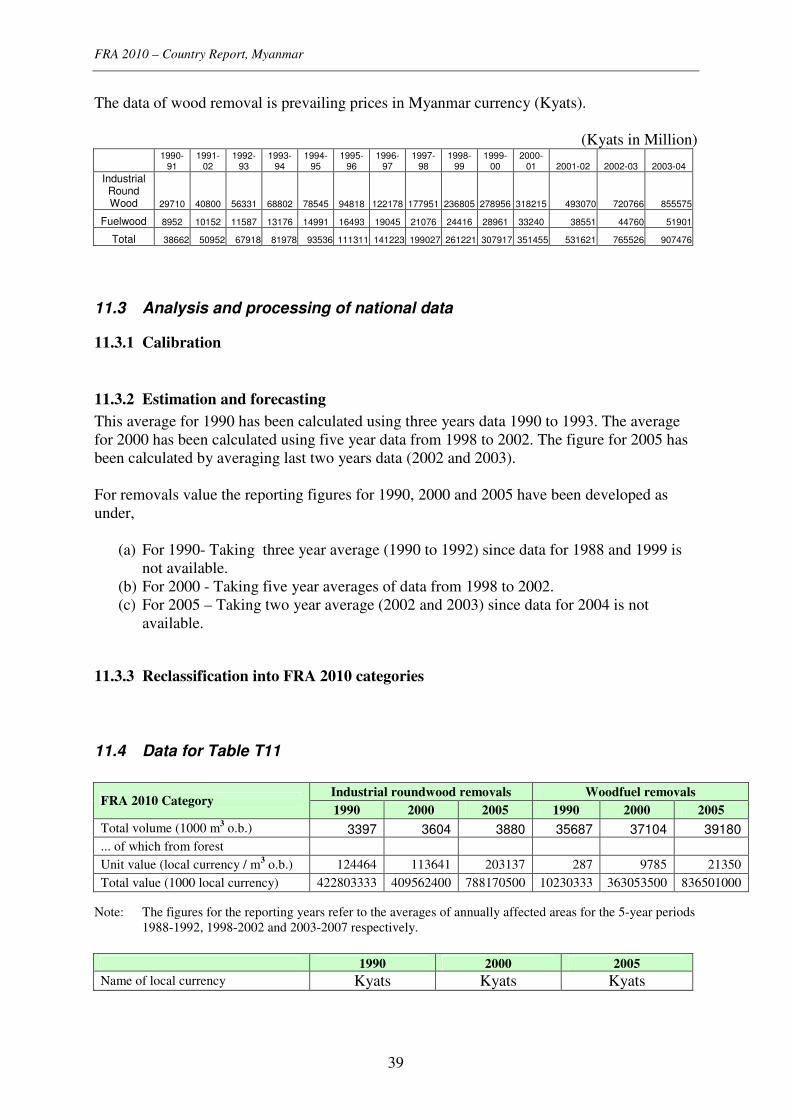
The data of wood removal is prevailing prices in Myanmar currency (Kyats).
(Kyats in Million)
1990-
91 1991-
02 1992-
93 1993-
94 1994-
95 1995-
96 1996-
97 1997-
98 1998-
99 1999-
00 2000-
01 2001-02 2002-03 2003-04
Industrial Round Wood 29710 40800 56331 68802 78545 94818 122178 177951 236805 278956 318215 493070 720766 855575
Fuelwood 8952 10152 11587 13176 14991 16493 19045 21076 24416 28961 33240 38551 44760 51901
Total 38662 50952 67918 81978 93536 111311 141223 199027 261221 307917 351455 531621 765526 907476
11.3 Analysis and processing of national data
11.3.1 Calibration
11.3.2 Estimation and forecasting
This average for 1990 has been calculated using three years data 1990 to 1993. The average
for 2000 has been calculated using five year data from 1998 to 2002. The figure for 2005 has
been calculated by averaging last two years data (2002 and 2003).
For removals value the reporting figures for 1990, 2000 and 2005 have been developed as
under,
(a) For 1990- Taking three year average (1990 to 1992) since data for 1988 and 1999 is
not available.
(b) For 2000 - Taking five year averages of data from 1998 to 2002.
(c) For 2005 – Taking two year average (2002 and 2003) since data for 2004 is not
available.
11.3.3 Reclassification into FRA 2010 categories
11.4 Data for Table T11
Industrial roundwood removals Woodfuel removals
FRA 2010 Category 1990 2000 2005 1990 2000 2005
Total volume (1000 m3 o.b.) 3397 3604 3880 35687 37104 39180
... of which from forest
Unit value (local currency / m3 o.b.) 124464 113641 203137 287 9785 21350
Total value (1000 local currency) 422803333 409562400 788170500 10230333 363053500 836501000
Note: The figures for the reporting years refer to the averages of annually affected areas for the 5-year periods
1988-1992, 1998-2002 and 2003-2007 respectively.
1990 2000 2005
Name of local currency Kyats Kyats Kyats
FRA 2010 – Country Report, Myanmar
40
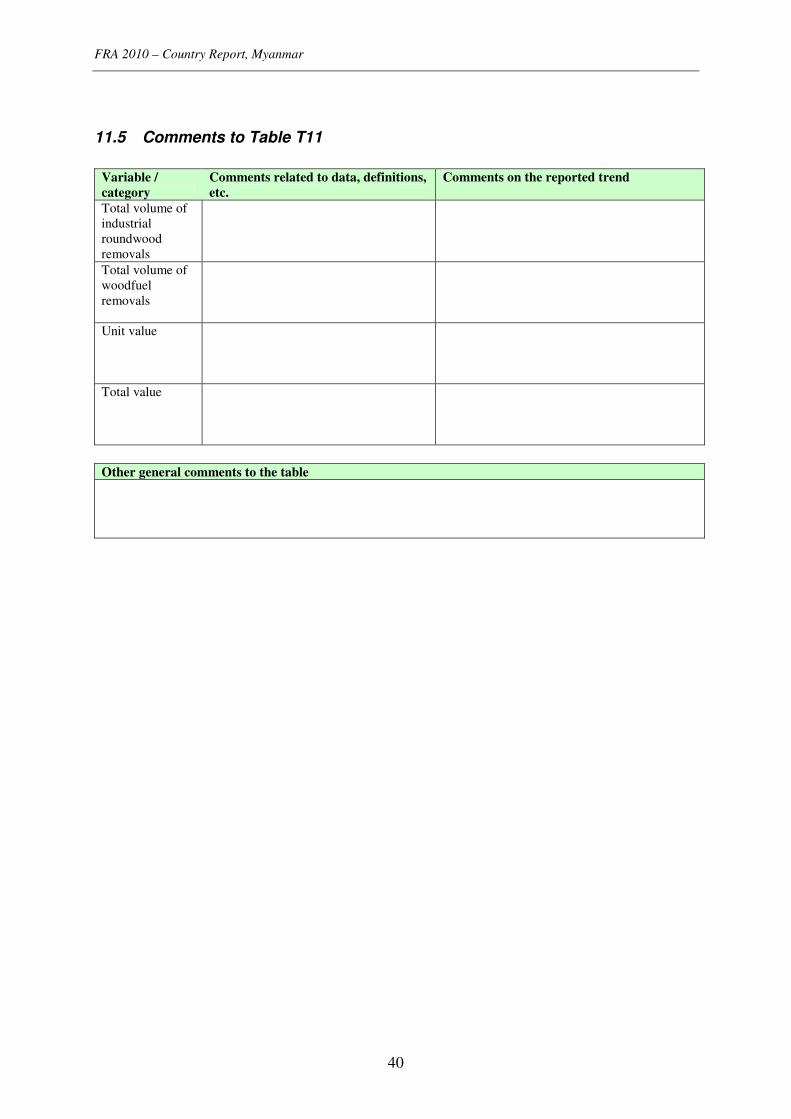
11.5 Comments to Table T11
Variable /
category
Comments related to data, definitions,
etc.
Comments on the reported trend
Total volume of
industrial
roundwood
removals
Total volume of
woodfuel
removals
Unit value
Total value
Other general comments to the table

FRA 2010 – Country Report, Myanmar
41
12 Table T12 – Non-wood forest products removals and value of removals
No data are available for this reporting table.

FRA 2010 – Country Report, Myanmar
42
13 Table T13 – Employment
13.1 FRA 2010 Categories and definitions
Category Definition
Full-time equivalents
(FTE)
A measurement equal to one person working full-time during a specified
reference period.
Employment Includes all persons in paid employment or self-employment.
Paid employment Persons who during a specified reference period performed some work for
wage or salary in cash or in kind.
Self-employment Persons who during a specified reference period performed some work for
profit or family gain in cash or in kind (e.g. employers, own-account workers,
members of producers' cooperatives, contributing family workers).
13.2 National data
13.2.1 Data sources
References to sources of
information
Quality
(H/M/L)
Variable(s) Year(s) Additional comments
The forestry activities within the
forest area is controlled by the
Forest Department and data relating
to the forest operations is available,
however employees concerning with
wood fuel removal and NWFP
removal are not available and
recorded.
13.2.2 Original data
A. Forest Department
Employee involvement for 1990 and , 2000 Number of employees 1990 2000
Field Staff 8985 8622
Labour 79252 71855
Total 88237 80477
B Myanmar Timber Enterprise
Operation 1990 2000
Loggers 8000 7253
Skidders 8144 7384
Mechanical Operator 6352 5759
Total 22496 20396

FRA 2010 – Country Report, Myanmar
43
13.3 Analysis and processing of national data
13.3.1 Reclassification into FRA 2010 categories
Except for field staff of forest department all other employment is allocated to production.
The regular staff is apportioned between production and services based on the ratio of the area
under protected area system and the rest from Table 3.
Variable 1990 2000
Percent of Forest Area under PAS 2 3
Percent of the rest of Forest Area 98 97
13.4 Data for Table T13
Full Time Employment (1000 person-years)
FRA Category 1990 2000 2005
Employment in primary production of goods
...of which paid employment 110.6 100.6 n.a.
... of which self-employment
Employment in management of protected areas 0.2 0.3 n.a.
13.5 Comments to Table T13
Variable / category Comments related to data,
definitions, etc.
Comments on the reported trend
Employment in primary
production of goods
Paid employment / self-
employment
Employment in
management of protected
areas
Other general comments to the table

FRA 2010 – Country Report, Myanmar
44
14 Table T14 – Policy and legal framework
14.1 FRA 2010 Categories and definitions
Term Definition
Forest policy A set of orientations and principles of actions adopted by public authorities in
harmony with national socio-economic and environmental policies in a given
country to guide future decisions in relation to the management, use and
conservation of forest and tree resources for the benefit of society.
Forest policy
statement
A document that describes the objectives, priorities and means for implementation
of the forest policy.
National forest
programme (nfp)
A generic expression that refers to a wide range of approaches towards forest policy
formulation, planning and implementation at national and sub-national levels. The
national forest programme provides a framework and guidance for country-driven
forest sector development with participation of all stakeholders and in consistence
with policies of other sectors and international policies.
Law (Act or Code)
on forest
A set of rules enacted by the legislative authority of a country regulating the access,
management, conservation and use of forest resources.
14.2 Data for Table T14
Indicate the existence of the following (2008)
X Yes Forest policy statement with national scope
No
Year of endorsement If Yes above, provide:
Reference to document
X Yes National forest programme (nfp)
No
Name of nfp in country National Forest Programme (30 yrs plan)
Starting year 2001-2002
In formulation
X In implementation
Under revision Current status
Process temporarily suspended
If Yes above, provide:
Reference to document or web
site the Forest Law, 1992 http://www.nfp-facility.org/media/14331/0/40/
X Yes, specific forest law exists
Yes, but rules on forests are incorpo-
rated in other (broader) legislation Law (Act or Code) on forest with national scope
No, forest issues are not regulated by
national legislation
Year of enactment 1902
Year of latest amendment 1992 If Yes above, provide:
Reference to document Burma Forest act 1902
http://faolex.fao.org/docs/texts/mya3290.doc

FRA 2010 – Country Report, Myanmar
45
In case the responsibility for forest policy- and/or forest law-making is decentralized, please indicate
the existence of the following and explain in the comments below the table how the responsibility for
forest policy- and law-making is organized in your country.
Yes Sub-national forest policy statements
No
If Yes above, indicate the number of regions/states/provinces with forest
policy statements
Yes Sub-national Laws (Acts or Codes) on forest
No
If Yes above, indicate the number of regions/states/provinces with Laws
on forests
14.3 Comments to Table T14
Variable / category Comments related to data, definitions, etc.
Forest policy statement
with national scope
National forest programme
(nfp)
Need evaluation and revision in accordance with current situration and trend.
Law (Act or Code) on
forest with national scope
Necessary amendment should be made periodically to cope with the changes in
practice.
Sub-national forest policy
statements
Sub-national Laws (Acts or
Codes) on forest
Other general comments to the table

FRA 2010 – Country Report, Myanmar
46
15 hTable T15 – Institutional framework
15.1 FRA 2010 Categories and definitions
Term Definition
Minister responsible for
forest policy-making
Minister holding the main responsibility for forest issues and the formulation of
the forest policy.
Head of Forestry The Head of Forestry is the Government Officer responsible for implementing
the mandate of the public administration related to forests.
Level of subordination Number of administrative levels between the Head of Forestry and the Minister.
University degree Qualification provided by University after a minimum of 3 years of post
secondary education.
15.2 Data for Table T15
Table 15a – Institutions
FRA 2010 Category 2008
Minister responsible for forest policy formulation :
please provide full title
Ministry of Forestry
X 1st level subordination to Minister
2nd
level subordination to Minister
3rd
level subordination to Minister
Level of subordination of Head of Forestry within
the Ministry
4th
or lower level subordination to Minister
Other public forest agencies at national level
Institution(s) responsible for forest law enforcement
Table 15b – Human resources
Human resources within public forest institutions
2000 2005 2008 FRA 2010 Category
Number %Female Number %Female Number %Female
Total staff
na na na na 64,858 na
...of which with university
degree or equivalent
na na na na na na
Notes:
1. Includes human resources within public forest institutions at sub-national level
2. Excludes people employed in State-owned enterprises, education and research, as well as temporary /
seasonal workers.

FRA 2010 – Country Report, Myanmar
47
15.3 Comments to Table T15
Variable / category Comments related to data, definitions, etc. Comments on the
reported trend
Minister responsible for
forest policy formulation
Level of subordination of
Head of Forestry within the
Ministry
Other public forest
agencies at national level
Institution(s) responsible
for forest law enforcement
Human resources within
public forest institutions
Other general comments to the table
FRA 2010 – Country Report, Myanmar
48
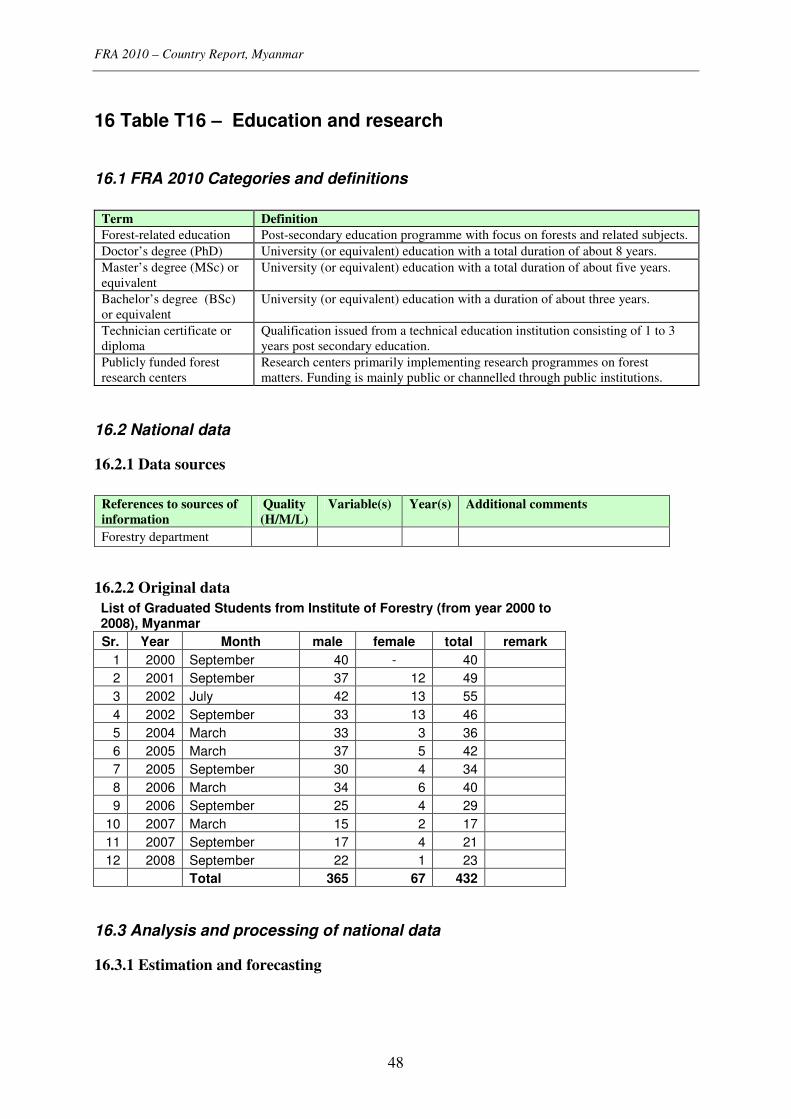
16 Table T16 – Education and research
16.1 FRA 2010 Categories and definitions
Term Definition
Forest-related education Post-secondary education programme with focus on forests and related subjects.
Doctor’s degree (PhD) University (or equivalent) education with a total duration of about 8 years.
Master’s degree (MSc) or
equivalent
University (or equivalent) education with a total duration of about five years.
Bachelor’s degree (BSc)
or equivalent
University (or equivalent) education with a duration of about three years.
Technician certificate or
diploma
Qualification issued from a technical education institution consisting of 1 to 3
years post secondary education.
Publicly funded forest
research centers
Research centers primarily implementing research programmes on forest
matters. Funding is mainly public or channelled through public institutions.
16.2 National data
16.2.1 Data sources
References to sources of
information
Quality
(H/M/L)
Variable(s) Year(s) Additional comments
Forestry department
16.2.2 Original data
List of Graduated Students from Institute of Forestry (from year 2000 to 2008), Myanmar
Sr. Year Month male female total remark
1 2000 September 40 - 40
2 2001 September 37 12 49
3 2002 July 42 13 55
4 2002 September 33 13 46
5 2004 March 33 3 36
6 2005 March 37 5 42
7 2005 September 30 4 34
8 2006 March 34 6 40
9 2006 September 25 4 29
10 2007 March 15 2 17
11 2007 September 17 4 21
12 2008 September 22 1 23
Total 365 67 432
16.3 Analysis and processing of national data
16.3.1 Estimation and forecasting
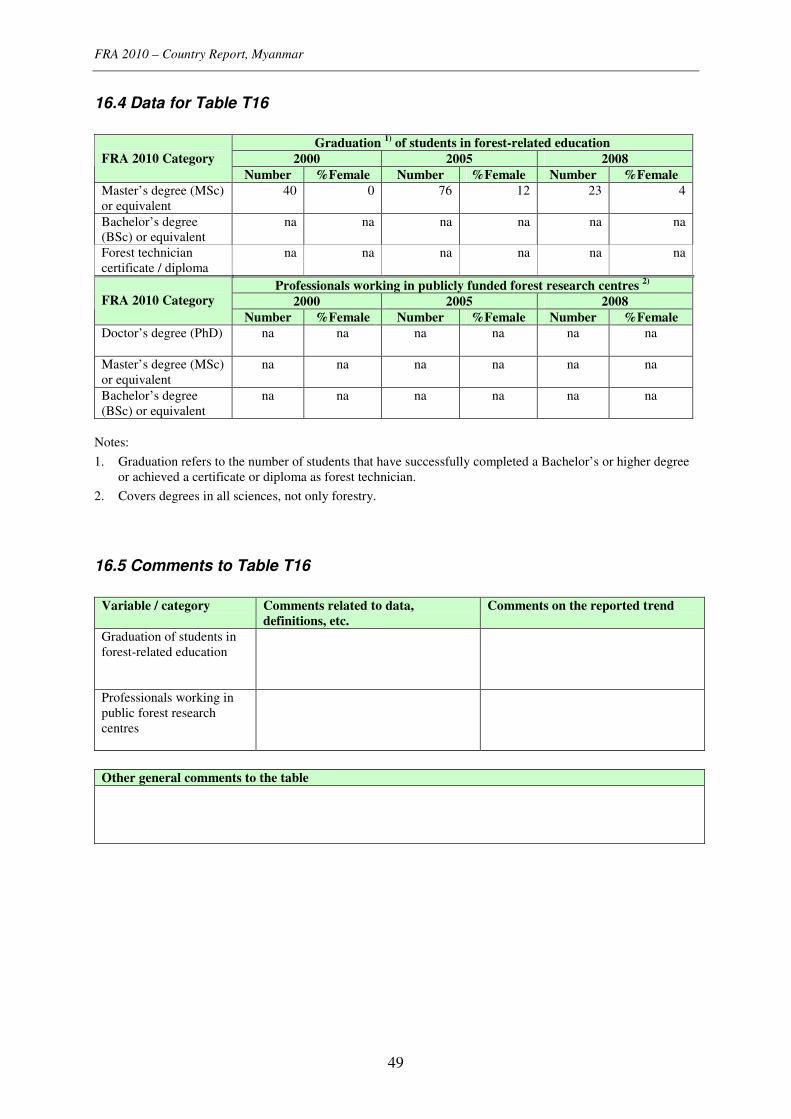
FRA 2010 – Country Report, Myanmar
49
16.4 Data for Table T16
Graduation
1) of students in forest-related education
2000 2005 2008 FRA 2010 Category
Number %Female Number %Female Number %Female
Master’s degree (MSc)
or equivalent
40 0 76 12 23 4
Bachelor’s degree
(BSc) or equivalent
na na na na na na
Forest technician
certificate / diploma
na na na na na na
Professionals working in publicly funded forest research centres 2)
2000 2005 2008 FRA 2010 Category
Number %Female Number %Female Number %Female
Doctor’s degree (PhD)
na na na na na na
Master’s degree (MSc)
or equivalent
na na na na na na
Bachelor’s degree
(BSc) or equivalent
na na na na na na
Notes:
1. Graduation refers to the number of students that have successfully completed a Bachelor’s or higher degree
or achieved a certificate or diploma as forest technician.
2. Covers degrees in all sciences, not only forestry.
16.5 Comments to Table T16
Variable / category Comments related to data,
definitions, etc.
Comments on the reported trend
Graduation of students in
forest-related education
Professionals working in
public forest research
centres
Other general comments to the table

FRA 2010 – Country Report, Myanmar
50
Table T17 – Public revenue collection and expenditure
17.1 FRA 2010 Categories and definitions
Category Definition
Forest revenue All government revenue collected from the domestic production and trade of
forest products and services. For this purpose, forest products include:
roundwood; sawnwood; wood-based panels; pulp and paper; and non-wood forest
products. As far as possible, this should include revenue collected by all levels of
government (i.e. central, regional/provincial and municipal level), but it should
exclude the income of publicly owned business entities.
Public expenditure All government expenditure on forest related activities (further defined below).
Operational expenditure
(sub-category to Public
expenditure)
All government expenditure on public institutions solely engaged in the forest
sector. Where the forest administration is part of a larger public agency (e.g.
department or ministry), this should only include the forest sector component of
the agency’s total expenditure. As far as possible, this should also include other
institutions (e.g. in research, training and marketing) solely engaged in the forest
sector, but it should exclude the expenditure of publicly owned business entities.
Transfer payments
(sub-category to Public
expenditure)
All government expenditure on direct financial incentives paid to non-
government and private-sector institutions, enterprises communities or
individuals operating in the forest sector to implement forest related activities.
Domestic funding
Public expenditure funded from domestic public financial resources, including:
retained forest revenue; forest-related funds; and allocations from the national
budget (i.e. from non-forest sector public revenue sources).
External funding
Public expenditure funded from grants and loans from donors, non-governmental
organisations, international lending agencies and international organisations,
where such funds are channelled through national public institutions.
17.2 National data
17.2.1 Data sources
References to sources of
information
Quality
(H/M/L)
Variable(s) Year(s) Additional comments
Budget Division, Forest
Department
Income,
expenditure
17.2.2 Classification and definitions
National class Definition
Not available

FRA 2010 – Country Report, Myanmar
51
17.2.3 Original data
Kyats in thousand Year Expenditure Income
Current Capital Total Revenue Current Total
Teak Hardwood Other Total Receive Income
1998-99 457723.7 388236.6 845960.3 193078.9 268787.7 232197.7 694064.3 388148.2 1082212.5
1999-00 574509.9 641858.9 1216368.8 320199.0 303653.7 254737.4 878590.1 429174.3 1307764.4
2000-01 1310003.2 618232.1 1928235.3 409320.5 348293.0 288361.3 1045974.8 539030.8 1585005.6
2001-02 1433139.5 724858.1 2157997.6 377893.6 414332.0 321710.0 1113935.6 276616.1 1390551.7
2002-03 1496168.9 839253.3 2335422.2 454227.7 308874.7 616017.9 1379120.3 199199.0 1578319.3
2003-04 1834505.9 1102691.6 2937197.5 491539.1 475189.3 891225.7 1857954.1 225398.5 2083352.6
2004-05 2663158.6 1264233.1 3927391.7 546766.5 540001.0 845110.0 1931877.5 557551.1 2489428.6
2005-06 3262894.8 1373369.6 4636264.4 601717.5 730770.1 938807.7 2271295.3 689912.6 2961207.9
2006-07 6678468.2 1723824.6 8402292.8 717994.0 457525.8 3107797.9 4283317.7 908250.7 5191568.4
2007-08 8811935.5 2688281.1 11500216.6 925033.0 739684.5 3981031.2 5645748.7 381031.2 7095577.8
Source: Budget Division, Forest Department
17.3 Analysis and processing of national data
17.3.1 Calibration
17.3.2 Estimation and forecasting
Revenues and expenditures are calculated as an average of the two periods 1999-2000 and
2000-2001 for 2000 and for the 2004-2005 2005-2006 for 2005.
Local currency is Kyats.
17.3.3 Reclassification into FRA 2010 categories
17.4 Data for Table T17
Table 17a - Forest revenues
Revenues
(1000 local currency) FRA 2010 Categories
2000 2005
Forest revenue 962 283 2 101 586

FRA 2010 – Country Report, Myanmar
52
Table 17b - Public expenditure in forest sector by funding source
Domestic funding
(1000 local currency)
External funding
(1000 local currency)
Total
(1000 local currency) FRA 2010 Categories
2000 2005 2000 2005 2000 2005
Operational expenditure
Transfer payments
Total public expenditure 2 043 116 4 281 828
Reforestation
Afforestation
Forest inventory and/or planning
Conservation of forest biodiversity
Protection of soil and water
Forest stand improvement
Establishment or maintenance of protected areas
If transfer payments are made for forest
management and conservation, indicate for what
specific objective(s) - Please tick all that apply.
Other, specify below
17.5 Comments to Table T17
Variable / category Comments related to data,
definitions, etc.
Comments on the reported trend
Forest revenue
Operational expenditure
Transfer payments
Other general comments to the table