Multi-Feature Based Multiple Landmine Detection … · 644 S. PARK, K. KIM, K. H. KO, MULTI-FEATURE...
10
642 S. PARK, K. KIM, K. H. KO, MULTI-FEATURE BASED MULTIPLE LANDMINE DETECTION USING GROUND PENETRATION RADAR Multi-Feature Based Multiple Landmine Detection Using Ground Penetration Radar Suncheol PARK, Kangwook KIM, Kwang Hee KO School of Mechatronics, Gwangju Inst. of Science and Technology, 261 Cheomdangwagiro, Bukgu, Gwangju, Republic of Korea [email protected], [email protected], [email protected] Abstract. This paper presents a novel method for detection of multiple landmines using a ground penetrating radar (GPR). Conventional algorithms mainly focus on detection of a single landmine, which cannot linearly extend to the multiple landmine case. The proposed algorithm is com- posed of four steps; estimation of the number of multiple objects buried in the ground, isolation of each object, fea- ture extraction and detection of landmines. The number of objects in the GPR signal is estimated by using the energy projection method. Then signals for the objects are ex- tracted by using the symmetry filtering method. Each sig- nal is then processed for features, which are given as input to the support vector machine (SVM) for landmine detec- tion. Three landmines buried in various ground conditions are considered for the test of the proposed method. They demonstrate that the proposed method can successfully detect multiple landmines. Keywords Ground Penetrating Radar, landmine detection, Support Vector Machine, PCA, geometric feature, multiple landmine. 1. Introduction Safe landmine removal is an urgent but difficult job faced by many countries. The removal process requires detection of a landmine buried in the ground. Once it is detected, the landmine can be eliminated in various ways. Therefore, robust landmine detection is a key step in land- mine removal. Many efforts have been made for developing methods for detecting landmines. Among them, detection using a ground penetrating radar (GPR) has attracted many re- searchers’ attention due to its various advantages over other devices; it can be used to detect landmines of metal and nonmetal materials [1] without changing its configura- tion. Moreover, it can be made small and portable such that it is used in various forms such as a stand-alone handheld sensor [2]-[6], a complementary sensor or a vehicle-moun- ted system in the form of an array of multiple antenna ele- ments [7]-[9]. Detection of a landmine from a GPR signal requires extracting features of a landmine from the signal. There are various ways for computing features from the GPR signal for landmine detection such as geometrical feature of a landmine signal [10], hidden Markov models (HMMs) [6], Spatial Features analysis [11], polynomial fitting [12], texture-feature coding method (TFCM) [13], time-fre- quency features [14], [15], and principal component analy- sis (PCA) [16]-[18]. In [14], [17] and [18], multiple fea- tures for a landmine such as PCA and Fourier coefficients are used for robust detection and identification. Those methods are designed to detect a single landmine from the GPR signal with some clutters. However, they are not intended to handle the case that multiple landmines are captured in one signal set. More than one landmine may be buried in the ground, yielding a GPR signal containing multiple landmines. In this situation, the methods for single landmine detection are not able to operate properly if the signal is provided as input without a priori knowledge on the number of landmines in the signal. It might happen that only one landmine might be detected, and the others would be ignored as obstacles when the number of landmines in the signal is not known. Although the implication of this problem is profound, little research on this problem has been presented in the literature. In this work, the problem of multiple landmine detec- tion using the GPR is addressed, and a novel method is proposed, which detects multiple landmines from a GPR signal. The GPR scans a ground, to generate a signal. Next, the number of objects in the signal that are determined to be possible landmines is estimated. Once the number is computed, regions corresponding to each object are ex- tracted, each of which is then processed to obtain features. The features are then used to decide if the objects are land- mines or not. The decision is made using a support vector machine scheme (SVM). If a landmine is detected, its type (anti-personal and anti-tanks) is retrieved. This paper contains two contributions. The first one is the segmentation procedure of each landmine from an input signal that may contain multiple landmines. Most of the
Transcript of Multi-Feature Based Multiple Landmine Detection … · 644 S. PARK, K. KIM, K. H. KO, MULTI-FEATURE...

642 S. PARK, K. KIM, K. H. KO, MULTI-FEATURE BASED MULTIPLE LANDMINE DETECTION USING GROUND PENETRATION RADAR
Multi-Feature Based Multiple Landmine Detection Using Ground Penetration Radar
Suncheol PARK, Kangwook KIM, Kwang Hee KO
School of Mechatronics, Gwangju Inst. of Science and Technology, 261 Cheomdangwagiro, Bukgu, Gwangju, Republic of Korea
[email protected], [email protected], [email protected]
Abstract. This paper presents a novel method for detection of multiple landmines using a ground penetrating radar (GPR). Conventional algorithms mainly focus on detection of a single landmine, which cannot linearly extend to the multiple landmine case. The proposed algorithm is com-posed of four steps; estimation of the number of multiple objects buried in the ground, isolation of each object, fea-ture extraction and detection of landmines. The number of objects in the GPR signal is estimated by using the energy projection method. Then signals for the objects are ex-tracted by using the symmetry filtering method. Each sig-nal is then processed for features, which are given as input to the support vector machine (SVM) for landmine detec-tion. Three landmines buried in various ground conditions are considered for the test of the proposed method. They demonstrate that the proposed method can successfully detect multiple landmines.
Keywords Ground Penetrating Radar, landmine detection, Support Vector Machine, PCA, geometric feature, multiple landmine.
1. Introduction Safe landmine removal is an urgent but difficult job
faced by many countries. The removal process requires detection of a landmine buried in the ground. Once it is detected, the landmine can be eliminated in various ways. Therefore, robust landmine detection is a key step in land-mine removal.
Many efforts have been made for developing methods for detecting landmines. Among them, detection using a ground penetrating radar (GPR) has attracted many re-searchers’ attention due to its various advantages over other devices; it can be used to detect landmines of metal and nonmetal materials [1] without changing its configura-tion. Moreover, it can be made small and portable such that it is used in various forms such as a stand-alone handheld sensor [2]-[6], a complementary sensor or a vehicle-moun-
ted system in the form of an array of multiple antenna ele-ments [7]-[9].
Detection of a landmine from a GPR signal requires extracting features of a landmine from the signal. There are various ways for computing features from the GPR signal for landmine detection such as geometrical feature of a landmine signal [10], hidden Markov models (HMMs) [6], Spatial Features analysis [11], polynomial fitting [12], texture-feature coding method (TFCM) [13], time-fre-quency features [14], [15], and principal component analy-sis (PCA) [16]-[18]. In [14], [17] and [18], multiple fea-tures for a landmine such as PCA and Fourier coefficients are used for robust detection and identification. Those methods are designed to detect a single landmine from the GPR signal with some clutters. However, they are not intended to handle the case that multiple landmines are captured in one signal set. More than one landmine may be buried in the ground, yielding a GPR signal containing multiple landmines. In this situation, the methods for single landmine detection are not able to operate properly if the signal is provided as input without a priori knowledge on the number of landmines in the signal. It might happen that only one landmine might be detected, and the others would be ignored as obstacles when the number of landmines in the signal is not known. Although the implication of this problem is profound, little research on this problem has been presented in the literature.
In this work, the problem of multiple landmine detec-tion using the GPR is addressed, and a novel method is proposed, which detects multiple landmines from a GPR signal. The GPR scans a ground, to generate a signal. Next, the number of objects in the signal that are determined to be possible landmines is estimated. Once the number is computed, regions corresponding to each object are ex-tracted, each of which is then processed to obtain features. The features are then used to decide if the objects are land-mines or not. The decision is made using a support vector machine scheme (SVM). If a landmine is detected, its type (anti-personal and anti-tanks) is retrieved.
This paper contains two contributions. The first one is the segmentation procedure of each landmine from an input signal that may contain multiple landmines. Most of the

RADIOENGINEERING, VOL. 23, NO. 2, JUNE 2014 643
landmine detection algorithms in the literature present methods for detection of a landmine from an input signal, which is usually assumed to contain at most one landmine. Therefore, without knowing the number of landmines in the signal, there is a high chance that landmines can be left undetected when the number of landmines in the signal is more than two. This problem can be handled after the num-ber of landmines is computed. Here, the number can be estimated through segmentation, which has not been actively discussed in the literature so far. In this paper, our emphasis was laid on the segmentation of landmine signals and estimation of the number of landmines in the signal. Once the number of landmines is computed, then, identifi-cation of each landmine is performed. As a second contri-bution, the landmine identification method has been im-proved compared with our previous work [17] and [18]. In particular, SVM was employed for identification, which provided better results than the authors’ previous method.
The paper is structured as follows. In Section 2, the overall procedure of multiple landmine detection is pro-posed to provide a workflow of the method. In Section 3, each step of the procedure is presented in detail. Examples are presented in Section 4 to demonstrate the potential of the proposed method. Section 5 concludes this paper with future work.
2. Overall Procedure The overall procedure of multiple landmine detection
is proposed as shown in Fig. 1. It consists of two major processes: segmentation and identification. The segmenta-tion, which is indicated in a dotted rectangle in Fig. 1, estimates the number of possible landmines in GPR data. This step is important in the multiple landmine detection because it defines how many times the identification should be performed. Once the number of possible land-mines is estimated, each segmented signal is processed for extracting features for identification. The identification, which is indicated in a black rectangle in Fig. 1, contains processes of signal extraction, post-processing of signal and feature extraction. Once the features of each signal are computed, identification of the signal is performed.
The first step is to normalize a GPR signal in order to minimize the influence that might be caused by the differ-ence of the hardware and the individual experimental envi-ronments. Next, the number of objects in the signal is esti-mated using the energy projection method [17]. Once the number is estimated, signals for each individual object are extracted separately using the Symmetry Filtering Method [20]. The extracted object signals are processed using the envelope detector [21] and Gaussian filter to reduce noise and ground effects. Then features such as the principal components and geometric features (ratios and lengths of signatures in the signal) are computed for each signal, and then provided as input to the identification module. The identification of the input signal is made using the support vector machine (SVM) based on the features.
Fig. 1. The overall procedure of the proposed method.
3. Multiple Landmine Detection Algorithm
3.1 Pre-processing of GPR Signal
A GPR signal is given as a set of intensity values at x and y positions as shown in Fig. 2. Here, the x axis indi-cates the integer index of each sampling position (denoted as Column No.) for the width of the scanning area. The sampling interval of the two adjacent scanning positions is 15 mm. The y axis is the depth and the z axis is the strength of the signal. The strength of the GPR signal reflects the size and material type of a landmine in the ground. There-fore, it could be considered as a feature of a landmine. However, the strength can also be influenced by other factors such as the power of the GPR, the installation height of the radar and the properties of the ground. There-fore, the power intensities of B-scan signal are normalized for the strength in order to minimize such effects. The normalization is performed in a linear manner so that the strength of each signal is scaled to the range from zero to one.
Fig. 2. An example of a GPR signal in 3D space.

644 S. PARK, K. KIM, K. H. KO, MULTI-FEATURE BASED MULTIPLE LANDMINE DETECTION USING GROUND PENETRATION RADAR
3.2 Estimation of the Number of Objects
Estimation of the number of objects in the GPR signal mainly consists of three steps: removal of clutters, noise reduction and estimation of the number of objects. Assume that I is a GPR signal given as an image as shown in Fig. 3, where the strength of the signal is given as intensity values in the x-y (Column No. and Depth) plane.
Fig. 3. An example of an input signal given as an image in
gray scale. The clutter due to the ground is clearly indicated.
Clutters in the signal are removed from I using the average subtraction method [22], to yield Ic. The method is effec-tive in removing the reflection from the ground, which is nearly constant in strength. It works as follows. I(x,y) is an intensity of the signal at x and y. Then, the new Ic (x,y), which is obtained by using the average subtraction method, is )],([),(),( yxIEyxIyxI
xForc
. (1)
Here, Ex[] indicates the operator computing the average for all x at yi. This equation is applied at each yi. Fig. 4(a) shows an example of the signal Ic. It clearly shows that most of the ground reflection has been removed. Then, a 3 by 3 Gaussian mean filter with the sigma of 0.5
2
22
222
1),(
yx
eyxf
(2)
is applied to the signal Ic for noise reduction, yielding the signal Ics of Fig. 4. Next, the Sobel edge detector [23] is applied to the signal Ics in order to extract signatures. The detector is an algorithm to extract edges in an image using the gradient of the intensity distribution. Given the input intensity I = I(x,y), the magnitude of the gradient is
22
)(
y
I
x
IImagIM
. (3)
If it is larger than or equal to a threshold, the intensity is set to one. Otherwise, it is set to zero. The threshold needs to be determined through various experiments. An example of
the extracted edges is given in Fig. 4(c). The edges are then projected onto the y-z and x-z planes, respectively. During the projection, the intensity values at the same projected positions are accumulated to produce the accumulated projected signatures in the y-z and x-z planes. As demon-strated in Fig. 4(d), the projected values form distinct groups. Then, the numbers of groups whose peaks are larger than a tolerance T2 in each of the y-z and x-z planes are counted to be ny2 and nx2. Next, among ny2 and nx2, the numbers of groups, which have ranges (widths) wider than a tolerance T1, are computed to be ny1 and nx1. The largest one between ny1 and nx1 is selected to be the number of objects in the signal, which is denoted by nobj. This estima-tion procedure is called Energy projection method [19]. Figure 4(d) shows that two objects are detected.
Fig. 4. The results of the steps of the energy projection
method. (a) The result of removing the constant clutter. (b) The result of applying the Gaussian filter. (c) The result of applying the Sobel edge detector. (d) The re-sult of projecting GPR data to y-z (depth and intensity) plane.
T1 is the minimum width of the signal range in the projection planes. T2 is the minimum intensity in the GPR data. Signals either with narrower width than T1 or with intensity smaller than T2 are ignored as noise. Basically, these values need to be chosen empirically with various landmines and objects. However, a guideline for the choice is that they should be so selected that the estimated number of objects in the signal becomes more than the actual num-ber of landmines. In this case objects other than landmines can be discarded in the decision step. This way, the possi-bility that a landmine is missed, a dangerous case than the false alarm, can be minimized.
3.3 Extracting Individual Objects
When an object buried in the ground is scanned by a GPR, a symmetric parabolic shape is obtained as shown in Fig. 4(a).
Therefore, using a filter, which extracts a symmetric shape, a signal corresponding to the object in the ground
RADIOENGINEERING, VOL. 23, NO. 2, JUNE 2014 645
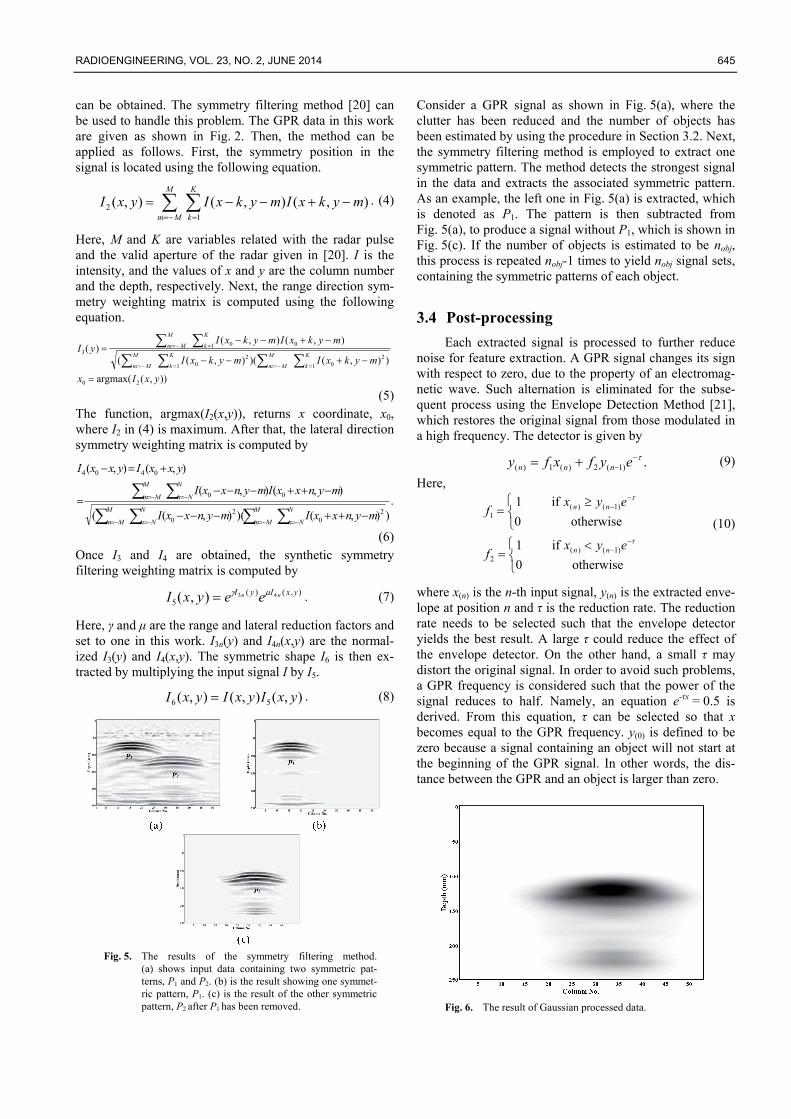
can be obtained. The symmetry filtering method [20] can be used to handle this problem. The GPR data in this work are given as shown in Fig. 2. Then, the method can be applied as follows. First, the symmetry position in the signal is located using the following equation.
),(),(),(1
2 mykxImykxIyxIK
k
M
Mm
. (4)
Here, M and K are variables related with the radar pulse and the valid aperture of the radar given in [20]. I is the intensity, and the values of x and y are the column number and the depth, respectively. Next, the range direction sym-metry weighting matrix is computed using the following equation.
)),(argmax(
)),()(),((
),(),()(
20
1
201
20
1 003
yxIx
mykxImykxI
mykxImykxIyI
K
k
M
Mm
K
k
M
Mm
K
k
M
Mm
(5) The function, argmax(I2(x,y)), returns x coordinate, x0, where I2 in (4) is maximum. After that, the lateral direction symmetry weighting matrix is computed by
.)),()(),((
),(),(
),(),(
20
20
00
0404
N
Nn
M
Mm
N
Nn
M
Mm
N
Nn
M
Mm
mynxxImynxxI
mynxxImynxxI
yxxIyxxI
(6) Once I3 and I4 are obtained, the synthetic symmetry filtering weighting matrix is computed by
),()(5
43),( yxIyI nn eeyxI . (7)
Here, γ and μ are the range and lateral reduction factors and set to one in this work. I3n(y) and I4n(x,y) are the normal-ized I3(y) and I4(x,y). The symmetric shape I6 is then ex-tracted by multiplying the input signal I by I5.
),(),(),( 56 yxIyxIyxI . (8)
Fig. 5. The results of the symmetry filtering method.
(a) shows input data containing two symmetric pat-terns, P1 and P2. (b) is the result showing one symmet-ric pattern, P1. (c) is the result of the other symmetric pattern, P2 after P1 has been removed.
Consider a GPR signal as shown in Fig. 5(a), where the clutter has been reduced and the number of objects has been estimated by using the procedure in Section 3.2. Next, the symmetry filtering method is employed to extract one symmetric pattern. The method detects the strongest signal in the data and extracts the associated symmetric pattern. As an example, the left one in Fig. 5(a) is extracted, which is denoted as P1. The pattern is then subtracted from Fig. 5(a), to produce a signal without P1, which is shown in Fig. 5(c). If the number of objects is estimated to be nobj, this process is repeated nobj-1 times to yield nobj signal sets, containing the symmetric patterns of each object.
3.4 Post-processing
Each extracted signal is processed to further reduce noise for feature extraction. A GPR signal changes its sign with respect to zero, due to the property of an electromag-netic wave. Such alternation is eliminated for the subse-quent process using the Envelope Detection Method [21], which restores the original signal from those modulated in a high frequency. The detector is given by
.)1(2)(1)(
eyfxfy nnn (9)
Here,
otherwise0
if1
otherwise0
if1
)1()(2
)1()(1
eyxf
eyxf
nn
nn
(10)
where x(n) is the n-th input signal, y(n) is the extracted enve-lope at position n and τ is the reduction rate. The reduction rate needs to be selected such that the envelope detector yields the best result. A large τ could reduce the effect of the envelope detector. On the other hand, a small τ may distort the original signal. In order to avoid such problems, a GPR frequency is considered such that the power of the signal reduces to half. Namely, an equation e-τx = 0.5 is derived. From this equation, τ can be selected so that x becomes equal to the GPR frequency. y(0) is defined to be zero because a signal containing an object will not start at the beginning of the GPR signal. In other words, the dis-tance between the GPR and an object is larger than zero.
Fig. 6. The result of Gaussian processed data.

646 S. PARK, K. KIM, K. H. KO, MULTI-FEATURE BASED MULTIPLE LANDMINE DETECTION USING GROUND PENETRATION RADAR
Next, a Gaussian filter is applied in order to reduce high frequency noise in the signal. For this work, a Gaussian filter with a 3 by 3 window and the sigma of 0.5 is used. The result of the filtered signal is shown in Fig. 6. Next, for better feature extraction, the filtered signal is processed such that the intensity values, which are less than 50% of the maximum intensity in the signal, are set to zero. The result of this step is given in Fig. 7.
Fig. 7. The result of applying the threshold.
3.5 Extracting Features of an Object
The post-processed signal is used to extract features of a landmine for identification. First, normalization of the signal is performed to consider the difference of the re-flected power along the burial depth. The maximum and the minimum intensity values of the signal are scaled line-arly to the range of 0 to 1, to adjust the power difference due to the different depths.
Two geometric features and one statistical feature are considered. The two geometric features are the geometric dimensions of the signal intensity distribution as shown in Fig. 7. In the x-y (Column No. and Depth) plane, intensity values larger than 50% of the maximum of the intensity usually leave an elliptic shape as shown in Fig. 7, which is obtained in the post-processing step given in Section 3.4. The shape can be characterized with the horizontal size and the vertical length. As a first feature the size, l1 is measured along the horizontal axis as shown in Fig. 7. It is related with the size of an object reflected in the signal. The bigger an object is, the larger l1 becomes. This feature can differ-entiate objects with respect to their size. This value is measured as the number of columns that the horizontal size of the region covers. The second feature is the length, l2, which is measured along the depth (y axis) in the figure. It is mainly dependent on permittivity and permeability of materials of an object. The radio wave transmittance is different according to the object materials. It is observed that the length l2 of a plastic object is longer than that of a metallic one. Therefore, this feature can separate a steel object from a plastic one. This feature is measured in mm.
As a third feature, a principal component by the prin-cipal component analysis (PCA) method is used. PCA method analyzes discrete data points in n-dimensional
space, producing n principal components in n principal directions, forming n pairs of the component value and its corresponding direction. Each component represents a pat-tern of the data in that direction. The PCA has been fre-quently used in the context of detection, and its applicabil-ity can be extended to clutter reduction [24].
Consider m sets of data, i = (x1i, x2i,…, xni), i = 1,…,m in n-dimensional space. The average data of the m data sets are obtained by
m
iim 1
1 . (11)
The difference of i with is computed by i = i - . Then the covariance of the data sets is then
m
i
Tiim 1)1(
1 C . (12)
The eigenvectors and eigenvalues of the covariance matrix are the principal components, which are computed by solving the following equation.
uuC . (13)
Here, u and are a vector and a scalar value, respectively. u and satisfying (13) are the eigenvectors and their eigenvalues of the covariance matrix, serving as the princi-pal components of the data.
A GPR signal is given in 3D space as shown in Fig. 2. The intensity distribution can be obtained by projecting the signal in the x-z and y-z planes. Among them, the intensity distribution of the signal projected onto the x-z (column no. vs. intensity) plane is selected because it shows clearer features of each landmine. An example of this projection is given in Fig. 8. Then, PCA is applied to the projected sig-nal to obtain two principal components and their corre-sponding direction vectors as depicted in Fig. 8.
Fig. 8. The result of the projected GPR signal onto x-z plane
used in the projection step.
In this work, the direction close to the x axis happens to correspond to the largest covariance value because most of the signal values are clustered near the x axis in the x-z plane when the signal is projected on the plane. The eigen-vectors are not suitable for features of an object because

RADIOENGINEERING, VOL. 23, NO. 2, JUNE 2014 647
the signal patterns are almost symmetric so that they do not show any difference. The eigenvalue of Eigenvector 1 is not appropriate as a feature because most of the signal strengths are clustered near the x axis, making the eigen-vector directed in the same axis. The eigenvalue of Eigen-vector 2, however, captures the reflection patterns of an object, which depend on materials and the size of the object.
3.6 Landmine Identification
Landmine identification is performed by comparing features computed in Section 3.5 with those in a database that contains features of various landmines buried in differ-ent ground conditions. If a match is found in the database, then the input landmine is identified. There are a lot of algorithms for identification such as the hidden Markov models [6], Mahalanobis distance based method [14], the decision tree [25], Bayesian learning [25] and Supporting Vector Machine (SVM) [25]. Among them, SVM is chosen in this work. It is a machine-learning algorithm used for data identification. A database is constructed, which con-tains features extracted from existing data sets. The fea-tures are classified into several groups, the outer most boundary elements of which are used to create optimal hyper planes differentiating each group. Algorithms for computing such hyper planes and robust decision are the main components of SVM. Once such a database is avail-able, decision can be made that a group is determined where the features of input data belong. Various SVMs’ are introduced in the related literature. In this work, a method using the radial basic function (RBF) is employed [26].
The basic concept of SVM is presented as follows. Suppose that there exist various data groups, which can be distinguished from each other. SVM is an algorithm to determine the optimal boundaries of the data groups for the group classification. Consider there are two groups of data, A and B. Here, the circles are the data in Group A, and the triangles are the data in Group B.
Fig. 9. An example of SVM. (a) shows two data groups with
various separating boundaries. (b) shows an optimal hyper plane separating the two groups. Here, lm is the maximum margin.
As shown in Fig. 9(a), an infinite number of bounda-ries can be introduced to separate the two groups. SVM selects one boundary that can optimally represent the boundaries of each group as illustrated in Fig. 9(b). In
Fig. 9(b), the dotted line is the optimal separating line, called the optimal hyper plane, which is determined in such a way that the distance between the two data groups be-comes maximal, or the maximum margin, lm, becomes maximal. In general, SVM can be formulated as follows.
Consider that there exist data Ds in p dimensions.
pip
iiis niyy ,,1},1,1{,|),( RxxD . (14)
Here, xi is a vector in Rp, np is the number of data, and yi is the vector class. The hyper plane of this data set is obtained by solving the optimization problem:
l. , ,i,-b)(y
:
C
iii
l
ii
w
11
tosubject
2
1min
1,
wx
wx
(15)
Here, wT is the normal vector of a hyper plane, x is the input data set, ξ is a slack variable and C is a constant for providing a constraint to Lagrange multipliers. Given the sign function,
0,1
0,0
0,1
)sgn(
s
s
s
s (16)
a decision function using the hyper plane for determination of a data class is given as:
)sgn()( bf wxx . (17)
In this work, three features are considered as dis-cussed in Section 3.5. Each feature corresponds to one axis, forming 3D feature space. Therefore, one object is represented as one point in the feature space as shown in Fig. 10. As illustrated in the figure, a landmine buried in the ground of different conditions and at various depths forms a cluster in the space. These data are provided as input to SVM for constructing a database. Later, given a point in the space, detection of the point is performed using the database. In order to determine if an object is a landmine or not, the three feature values for objects other
Fig. 10. A plot of features of three landmines buried in dry
sand.

648 S. PARK, K. KIM, K. H. KO, MULTI-FEATURE BASED MULTIPLE LANDMINE DETECTION USING GROUND PENETRATION RADAR
than landmines, so called clutters, are added to the database to form groups for non-landmines. Various rocks different in size or plastic and metal cans can be processed for this purpose. The database needs to be updated to contain fea-tures of various objects, which would increase the identifi-cation rate for landmines.
3.7 Implementation
The proposed method was implemented using a PC of 2.7 GHz CPU and 8 Gbyte RAM. The operating system of the computer was Windows 7, and Visual C++ and Matlab were used for implementation.
Conceptually the proposed method consists of six pri-mary modules, modules for pre-processing, estimating the number of objects, extracting objects’ signals, post-pro-cessing, extracting features and identification. Each pri-mary module consists of one or more functions. The pre-processing module contains a function for normalization. The module for estimation of the number of objects con-tains a function of the energy projection method. The mod-ule for signal extraction provides a function of the symme-try filtering method. The post-processing module is com-posed of two functions: envelope detection and Gaussian filter. The feature extraction module consists of three func-tions of computing PCA and geometric lengths. The theo-retical basis of these functions is given in Section 3.5. The identification module contains a function of SVM for iden-tification as given in Section 3.6. The actual implementa-tion of the method is structured as shown in Fig. 11. There exists a function for file I/O and data handling. This is a core part of the implementation, based on which the func-tions for processing GPR signals and identification are implemented. The functions have interfaces with the file I/O and data handling for input and output. The sequence of execution of the functions is managed by the file I/O and data handling function.
Fig. 11. A schematic diagram of the implemented program.
4. Experiments In this work, three landmines are considered as shown
in Fig. 12; KM16, which is made of steel, is an anti-per-sonnel landmine. KM15 and KM19 are anti-tank land-mines, each of which is made of steel and plastic, respec-tively. Three different ground materials (sand, soil, and gravel) are considered with three moisture levels (dry, medium, and wet).
Fig. 12. The landmines used in the experiments. (a) KM15,
(b) KM16, (c) KM19.
Fig. 13. The setup for the experiments.
For the experiments, a GPR system of Minehound VMR2 from COBHAM is used. The GPR is attached to an arm, which moves horizontally. A landmine is buried in a wooden box of 1 m × 2 m × 1 m, which is filled with sand, soil or gravel of three moisture levels. The configura-tion for the experiments is shown in Fig. 13.
The method for estimation of the number of buried objects is tested with the three landmines. For this test, three test cases are considered: (1) Case 1: KM16 and KM19 buried at 10 cm and 30 cm in the dry sand, (2) Case 2: KM15, KM19 and KM16 buried at 10 cm, 30 cm and 20 cm in the dry sand, (3) Case 3: KM16 and KM15 buried at 10 cm and 30 cm in the dry sand. The three cases, Cases 1, 2, and 3, are depicted in Fig. 14. The threshold values T1 and T2 are selected to be 13 mm and 5% of the largest power in the signal for the estimation.
The projection images of Case1 to y-z and x-z planes are shown in Fig. 15. Here, the projection data in y-z plane show three signal groups. The first one from the left corre-sponds to the surface reflection, which is to be removed. On the other hand, the data in x-z plane show one distribu-tion pattern. Therefore, in this case, the projection data in y-z plane are selected for the estimation of the number of objects. Here, two islands are observed in the data of y-z plane, which has been successfully estimated by the energy projection method. The correct numbers of objects were also obtained for Cases 2 and 3 using the proposed method.

RADIOENGINEERING, VOL. 23, NO. 2, JUNE 2014 649
Fig. 14. Input signals for the test cases.
Fig. 15. The projection images of Case 1 to y-z and x-z planes.
Next, the identification process is demonstrated with various examples. A database is created using the three landmines buried in different conditions as summarized in Tab. 1. In total, 162 cases are considered. Each case is produced by averaging measurements of three separate scans of the case. For each case three features are com-puted and stored in the database with their corresponding landmine information.
Landmine types KM15, KM16, KM19 Ground conditions dry, medium, wet
Ground types sand, gravel, soil Burial depths (cm) 5, 10, 15, 20, 25, 30
Tab. 1. Types of landmines and burial conditions for construc-tion of the database.
In order to simulate real signals, input signals are pre-pared adding various levels of Gaussian noise. The noise model used in these experiments employs a random func-tion with normal distribution, whose probability distribu-tion function is
2
2
2
22
1)(
x
expdf
. (18)
with σ = 0.5. The noise created by this model is added after scaling its magnitude to be from 0 to 50% to the original signal. An example of an input signal is shown in Fig. 16(a). Here, the case of KM16 buried at 10 cm in dry
sand is taken. The image in Fig. 16(a) is the original one, and the rest images Figs. 16(b), (c) and (d) show those with 10%, 30% and 50% noise added, respectively. It is obvious that as the noise level grows, the pattern of the signal becomes less clear.
Fig. 16. Example data with various levels of Gaussian noise
added. (a) no noise, (b) 10%, (c) 30% and (d) 50%.
The input cases for experiments are prepared as fol-lows. Three ground types, three moisture levels, six burial depths, and three landmines are considered. Moreover, the number of noise levels is five. Therefore, the total number of combinations becomes 810.
Fig. 17 is a graph showing the changes of identifica-tion rates of the input cases with respect to the levels of noise added to the signal, the ground conditions and differ-ent burial depths. In order to show the changing patterns of the identification rates, the results of the identification of each case are arranged with respect to the five noise levels, the three ground types and the three moisture levels. The identification rates of the three landmines and six burial depths are averaged. For example, consider ‘saw1’ case. It indicates the dry sand ground condition. The average iden-tification rates for three landmines buried at six burial depths are computed for each noise level, which are plotted with respect to the noise level. The other eight cases are similarly processed to produce graphs as shown in Fig. 17. The plot does not show the difference of identification rate of each landmine for different burial depths. However, it can show how the identification rates change with respect to the noise level depending on the ground conditions.
The highest identification rates are obtained with 10% of noise, which gradually decrease as the level of noise increases. For sand (saw1, saw2, and saw3), the detection rate is more than 98% irrespective of the moisture level. For soil (sow1, sow2, and sow3), the rate is decreased. However, it still shows more than 90%. For the gravel ground (grw1, grw2, and grw3), the detection rate is more than 95%, but it decreases as the moisture level is in-creased.

650 S. PARK, K. KIM, K. H. KO, MULTI-FEATURE BASED MULTIPLE LANDMINE DETECTION USING GROUND PENETRATION RADAR
Fig. 17. The changes of the detection rate with respect to the
noise level. ‘sa’, ‘so’ and ‘gr’ indicate sand, soil and gravel. ‘w1’, ‘w2’, and ‘w3’ are the moisture levels of dry, medium and wet. The horizontal and vertical axes are the noise and the detection rates, respectively.
5. Conclusions This paper proposes a novel method for detecting
multiple landmines buried in the ground of various condi-tions using a GPR. The method consists of clutter reduc-tion, estimation of the number of objects in the GPR data, isolation of object signals, feature extraction and detection. The tests show that the proposed method can mostly detect multiple landmines in various conditions.
The proposed method has two limitations: choice of tolerances and database construction. The method requires a couple of user-defined values: threshold values for the estimation of the number of objects and a parametric value used by the symmetry filtering method. These values main-ly depend on the properties of the GPR hardware used in the system and are critical in the process. The other limi-tation is that a database for landmines and various other foreign objects should be constructed for robust detection. The database for non-landmines could be limited in that it cannot consider all possible clutters different in size, shape and material. It means that there might be a false-alarm case that a non-landmine object is determined as a land-mine due to the limited amount of data in the database. These two limitations can be overcome through extensive experiments with objects and landmines.
The overall procedure of the method is designed for general environments. However, the tests in the paper were performed in controlled conditions, and the tolerances were chosen and the database was constructed for those condi-tions. Therefore, it is necessary to refine the tolerances and to improve the database by considering more realistic situa-tions. A thorough evaluation of the method for selection of tolerances and enhancing the database using real field data is recommended for future work.
Acknowledgements This work was supported in part by the Korea
Evaluation Institute of Industrial Technology (10041950).
References
[1] MACDONALD, J., LOCKWOOD, J. R., MCFEE, J., ALTSHU-LER, T., BROACH, T., CARIN, L., HARMON, R., RAPPAPORT, C., SCOTT, W., WEAVER, R. Alternatives for Landmine Detec-tion. Rand Corporation, 2003.
[2] AMAZEEN, C. A., LOCKE, M. C. Developmental status of the U.S. Army's new handheld standoff mine detection system (HSTAMIDS). In Second International Conference on Detection of Abandoned Land Mines, 1998. (Conf. Publ. No. 458). Edinburgh (England), 1998, p. 193-197.
[3] HO, K. C., GADER, P. D. A linear prediction land mine detection algorithm for hand held ground penetrating radar. IEEE Transactions on Geoscience and Remote Sensing, 2002, vol. 40, no. 6, p. 1374-1384.
[4] VAN DER MERWE, A., GUPTA, J. A novel signal processing technique for clutter reduction in GPR measurements of small, shallow land mines. IEEE Transactions on Geoscience and Remote Sensing, 2000, vol. 38, no. 6, p. 2627-2637.
[5] NISHIMOTO, M., UENO, S., KIMURA, Y. Feature extraction from GPR data for identification of landmine-like objects under rough ground surface. Journal of Electromagnetic Waves and Applications, 2006, vol. 20, no. 12, p. 1577-1586.
[6] GADER, P. D., MYSTKOWSKY, M., ZHAO, Y. Landmine detection with ground penetration radar using hidden Markov models. IEEE Transactions on Geoscience and Remote Sensing, 2011, vol. 39, no. 6, p. 1231-1244.
[7] SATO, M., KOBAYASHI, T., TAKAHASHI, K., FUJIWARA, J., FENG, X. Vehicle mounted SAR-GPR and its evaluation. In Proceedings of SPIE. Orlando (U.S.A.), 2006, vol. 6217.
[8] HARMON, R. S., HOLLOWAY, J. H., BROACH, J. T. Pro-cessing of GPR data from NIITEK landmine detection system. In Proceedings of SPIE. Maryland (U.S.A.), 2003, vol. 5089.
[9] YAROVOY, A., SAVELYEV, T., ZHUGE, X., AUBRY, P., LIGTHART, L., SCHAVEMAKER, J., TETTELAAR, P., DEN BREEJEN, E. Performance of UWB array-based radar sensor in a multi-sensor vehicle-based suit for landmine detection. In Radar Conference EuRAD 2008. Amsterdam (The Netherlands), 2008, p. 288-291.
[10] NATH, B., BHUIYAN, A. A geometrical feature based sensor fusion model of GPR and IR for detection and classification of anti-personnel mines. In Proc. of the 7th Internat. Conf. on Intelli-gent Systems Design and Applications ISDA '07. 2007, p. 849-856.
[11] HUANG, X., ZHANG, L., LI, P. Classification and extraction of spatial features in urban areas using high-resolution multispectral imagery. IEEE Geoscience and Remote Sensing Letters, 2007, vol. 4, no. 2, p. 260-264.
[12] ZHU, Q., COLLINS, L. M. Application of feature extraction methods for landmine detection using the Wichmann/Niitek ground-penetrating radar. IEEE Transactions on Geoscience and Remote Sensing, 2005, vol. 43, no. 1, p. 81-85.
[13] TORRIONE, P., COLLINS, L. M. Texture features for antitank landmine detection using ground penetrating radar. IEEE Transactions on Geoscience and Remote Sensing, 2007, vol. 45, no. 2, p. 2374-2382.
[14] SAVELYEV, T. G., VAN KEMPEN, L., SAHLI, H., SACHS, J., SATO, M. Investigation of time-frequency features for GPR landmine discrimination. IEEE Transactions on Geoscience and Remote Sensing, 2007, vol. 45, no. 1, p. 118-129.
[15] SUN, Y., LI, J. Time-frequency analysis for plastic landmine detection via forward-looking ground penetrating radar. In IEE Proceedings, Radar, Sonar and Navigation, 2003, vol. 150, no. 4, p. 253-261.

RADIOENGINEERING, VOL. 23, NO. 2, JUNE 2014 651
[16] HUANG, C. W., LEE, K. C. Application of ICA technique to PCA based radar target recognition. Progress in Electromagnetics Research, 2010, vol. 105, p. 157-1870.
[17] KO, K. H., JANG, G., PARK, K., KIM, K. GPR-based landmine detection and identification using multiple features. International Journal of Antennas and Propagation, 2012, vol. 2012, p. 1-7.
[18] PARK, K., PARK, S., KIM, K., KO, K. H. Multi-feature based detection of landmines using ground penetrating radar. Progress in Electromagnetics Research, 2013, vol. 134, p. 455-474.
[19] PARK, S., KIM, K., KO, K. H. Multiple landmine detection algorithm using ground penetrating radar. In International Geoscience and Remote Sensing Symposium (IGARSS 2012). Munich (Germany), 2012, p. 3190-3193.
[20] LI, T., KONG, L., ZHOU, Z. Symmetry filtering method for GPR clutter reduction. In International Conference on Microwave and Millimeter Wave Technology (ICMMT 2008). 2008, p. 1515-1517.
[21] FRITSCH, C., IBANEZ, A., PARRILLA, M. A digital envelope detection filter for real-time operation. IEEE Trans. on Instru-mentation and Measurement, 1999, vol. 48, no. 6, p. 1287 to 1293.
[22] ABUJARAD, F., JOSTINGMEIER, A., OMAR, A. A. Clutter removal for landmine using different signal processing techniques. In Proceedings of the Tenth International Conference Ground Penetrating Radar. Delft (The Netherlands), 2004, p. 697-700.
[23] GONZALEZ, R. C., WOODS, R. E. Digital Image Processing 2/E. Upper Saddle River, NJ: Prentice Hall, 2002.
[24] KABOUREK, V., CERNY, P., MAZANEK, M. Clutter reduction based on principal component analysis technique for hidden ob-jects detection. Radioengineering, 2012, vol. 21, no. 1, p. 464-470.
[25] MITCHELL, T. M. Machine Learning. Boston, MA: McGraw-Hill, 1997.
[26] CRISTIANINI, N., TAYLOR, J. S. An Introduction to Support Vector Machines and Other Kernel-based Learning Methods. Cambridge University Press, 2000.
About Authors ... Suncheol PARK was born in Seoul, Republic of Korea. He received a B.S. degree in Electrical Engineering from Ajou University, Korea, in 2011. He is currently an MS student at Gwangju Institute of Science and Technology,
Gwangju, Korea. His current research interest includes machine learning, signal processing and landmine detec-tion and identification.
Kangwook KIM was born in Mokpo, Republic of Korea. He received a B.S. degree in Electrical Engineering from Ajou University, Korea, in 1997, and M.S. and Ph.D. de-grees in Electrical and Computer Engineering from the Georgia Institute of Technology, GA, USA, in 2001 and 2003, respectively. His Ph.D. research was on the design, analysis, and measurement of pulse-radiating antennas. From 1999 to 2003, he participated in research on ultra-wideband, pulse-radiating antenna as a graduate research assistant, and from 2003 to 2005, he participated in multi-modal landmine detection system research at the Georgia Institute of Technology as a postdoctoral fellow. From 2005 to 2006, he was with the Samsung Advanced Institute of Technology. He joined the faculty of the Gwangju Insti-tute of Science and Technology in 2006 as an assistant professor. His current research interests include electrically small antennas, remote sensing of concealed objects, and ultra-wideband electromagnetics.
Kwang Hee KO was born in Seoul, Republic of Korea. He received a B.S degree in Naval Architecture and Ocean Engineering from Seoul National University in 1995, M.S. degrees in Mechanical and Ocean Engineering in 2001 and a Ph.D. degree in Ocean Engineering from the Massachu-setts Institute of Technology (MIT), Cambridge, MA, USA, in 2003. His research interests include feature matching, landmine detection, geometric modeling, CAD/CAM and computer graphics. He worked as a postdoctoral associate at MIT from 2003 to 2004 and as a research associate at the Design and Manufacturing Institute, Stevens Institute of Technology, Hoboken, NJ, from 2004 to 2005. He joined the School of Mechatronics, Gwangju Institute of Science and Technology, Gwangju, Korea, in 2006 and worked as an assistant professor until 2010. He is currently an associate professor at Gwangju Institute of Science and Technology, Gwangju, Korea.