Influence of soil inhomogeneity on GPR for landmine detection
19
Influence of soil inhomogeneity on GPR for landmine detection Kazunori Takahashi Jan Igel Holger Preetz Leibniz Institute for Applied Geophysics, Hannover, Germany
Transcript of Influence of soil inhomogeneity on GPR for landmine detection

Influence of soil inhomogeneity on GPRfor landmine detection
Kazunori TakahashiJan IgelHolger PreetzLeibniz Institute for Applied Geophysics, Hannover, Germany
XIII International Conference on Ground Penetrating Radar
Introduction
2
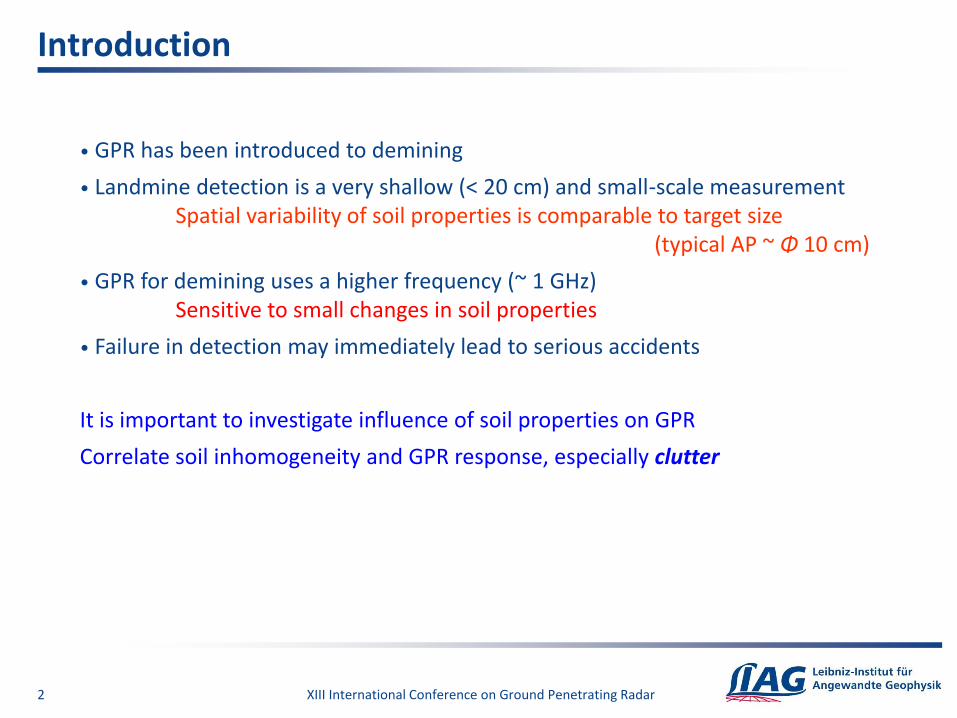
• GPR has been introduced to demining
• Landmine detection is a very shallow (< 20 cm) and small-scale measurementSpatial variability of soil properties is comparable to target size
(typical AP ~ Φ 10 cm)
• GPR for demining uses a higher frequency (~ 1 GHz)Sensitive to small changes in soil properties
• Failure in detection may immediately lead to serious accidents
It is important to investigate influence of soil properties on GPR
Correlate soil inhomogeneity and GPR response, especially clutter

XIII International Conference on Ground Penetrating Radar
Soil inhomogeneity and clutter
3
Clutter can disturb reflections from a target missing landminesDetection performance is often assessed by reflection-to-clutter ratio
Reflection-to-clutter ratio• Reflection
… Targets are known – can roughly be modelled• Clutter
… Depending on soil, surface roughness, vegetation etc.Inhomogeneity of soil may be the most influential factor
Soil inhomogeneity
Modelling of clutter, targets
Reflection-to-clutter ratio Assessment of performance
ClutterReflection

XIII International Conference on Ground Penetrating Radar
Irrigation test
Experimental setup
• Very dry humous soil (medium sand)
• AP mine surrogate (Type-72) at 10 cm depth
• GPR 1D scan every 2 min.
• TDR measurements every 30 sec.
• ~12 litters/min. for ~1 hour
• Totally ~720 litters/m2
GPR system
• VNA-based stepped-frequency
• Frequency range: 0.5-4.0 GHz
• Vivaldi antennas
• Data sampled every 2 cm
• Stand-off ~ 5-8 cm
Vivaldi antennas
TDR
Type-72at 10 cm
4
Type-72
78 mm
Before irrigation: εr = 4.0θv = 5.5 %
Irrigation stopped: εr = 20.8θv = 35.7 %
XIII International Conference on Ground Penetrating Radar
GPR profiles
5
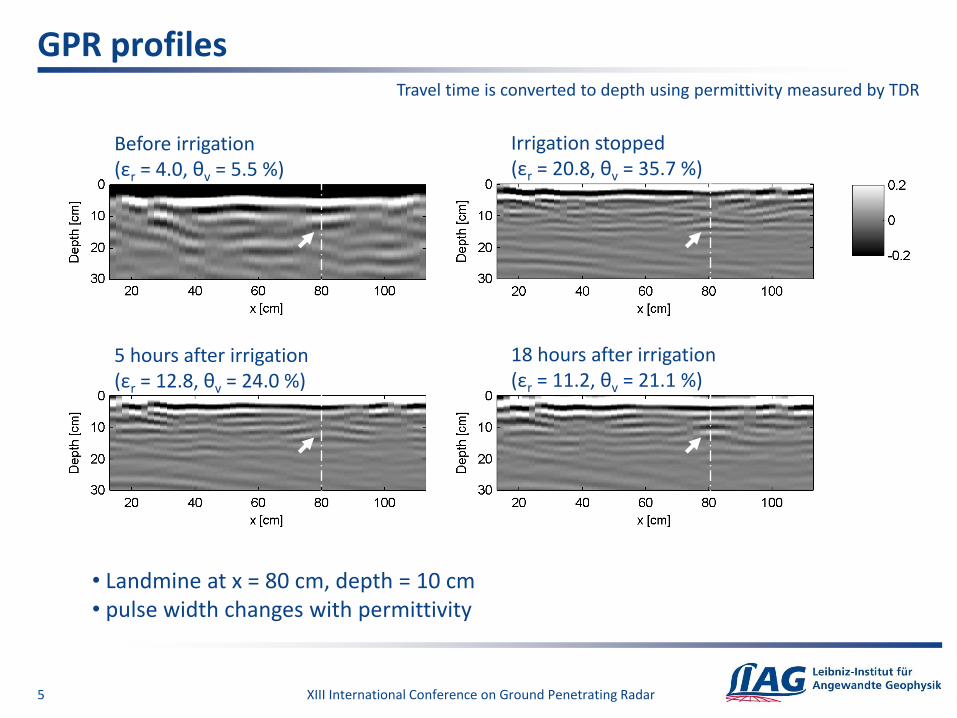
Before irrigation(εr = 4.0, θv = 5.5 %)
Irrigation stopped(εr = 20.8, θv = 35.7 %)
5 hours after irrigation(εr = 12.8, θv = 24.0 %)
18 hours after irrigation(εr = 11.2, θv = 21.1 %)
Travel time is converted to depth using permittivity measured by TDR
• Landmine at x = 80 cm, depth = 10 cm• pulse width changes with permittivity

XIII International Conference on Ground Penetrating Radar
Clutter
6
Area – depth of 10-15 cm and x < 70 cmClutter := maximum amplitude
Clutter amplitude …rapidly decreases (T < 1 hour)increases ( T = 1-6 hours)slowly decreases (T > 6 hours)
Mine
XIII International Conference on Ground Penetrating Radar
Soil inhomogeneity
7
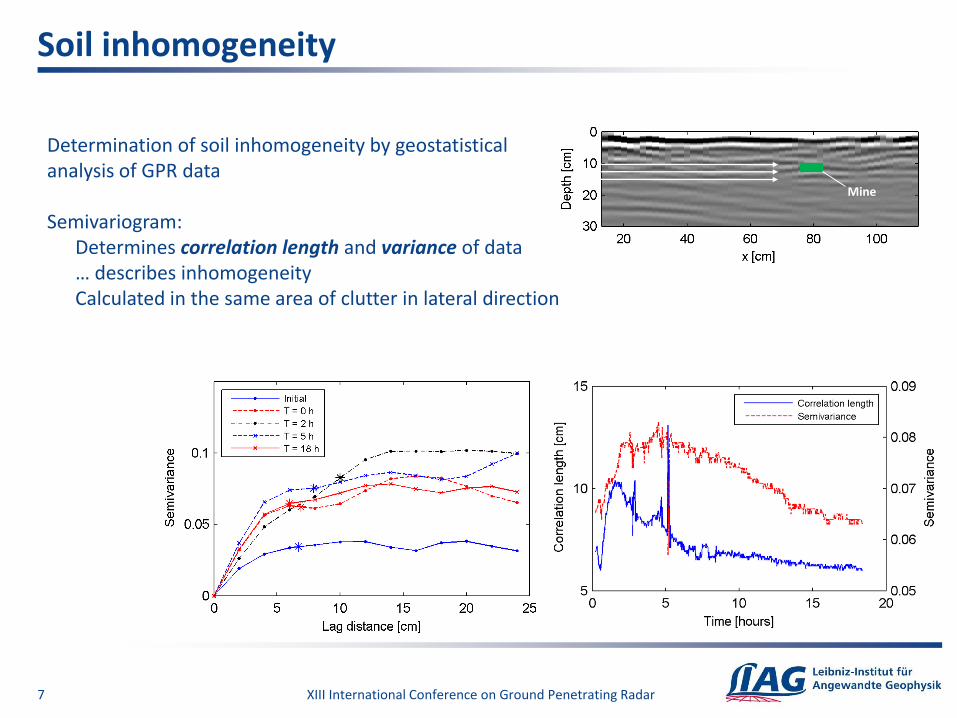
Determination of soil inhomogeneity by geostatisticalanalysis of GPR data
Semivariogram:Determines correlation length and variance of data… describes inhomogeneityCalculated in the same area of clutter in lateral direction
Mine

XIII International Conference on Ground Penetrating Radar
Clutter vs. soil inhomogeneity
8
A peak at a relative correlation length = 1.3Clutter and correlation length seem to be correlated
Clutter = f (correlation length, variance)

XIII International Conference on Ground Penetrating Radar
Modelling of clutter
9
d = a/π
ε1 ε2
Homogeneous surrounding:Permittivity = ε1 (from TDR data)
Dielectric sphere:Circumference = correlation length aPermittivity = ε2 = ε1+ Δε
Permittivity contrast:Δε (variance)1/2
Calculate radar cross-section (RCS)
Mie solution … the exact solution of Maxwell’s equations
Rayleigh approximation … an approximation of the Mie solution for a small sphere (ka << 1)

XIII International Conference on Ground Penetrating Radar
Mie and Rayleigh scattering
10
Metallic sphere in free space
Dielectric sphere (εr = 14.4)in soil (εr = 10)
Rayleighscattering
Mie scattering(resonance) Optical
Small sphere (Rayleigh region): RCS and sphere size have a simple relationshipLarge sphere (resonance region): RCS oscillates with the sphere size
XIII International Conference on Ground Penetrating Radar
RCS by Mie solution and Rayleigh approx.
11
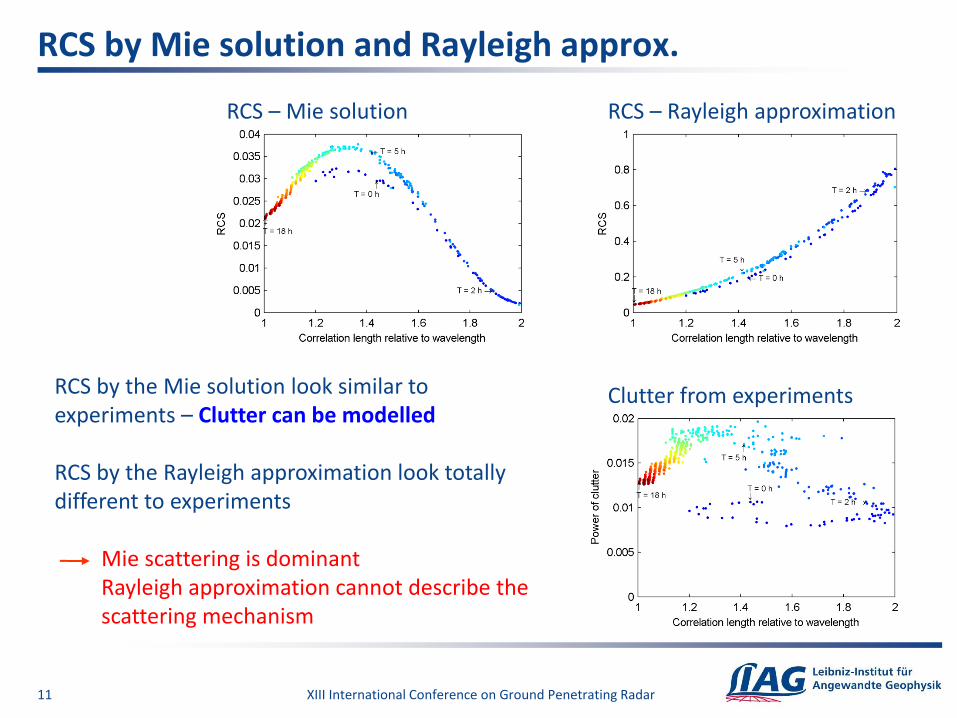
RCS – Mie solution RCS – Rayleigh approximation
Clutter from experimentsRCS by the Mie solution look similar to experiments – Clutter can be modelled
RCS by the Rayleigh approximation look totally different to experiments
Mie scattering is dominantRayleigh approximation cannot describe the scattering mechanism
XIII International Conference on Ground Penetrating Radar
Measured and modelled clutter (Mie solution)
12
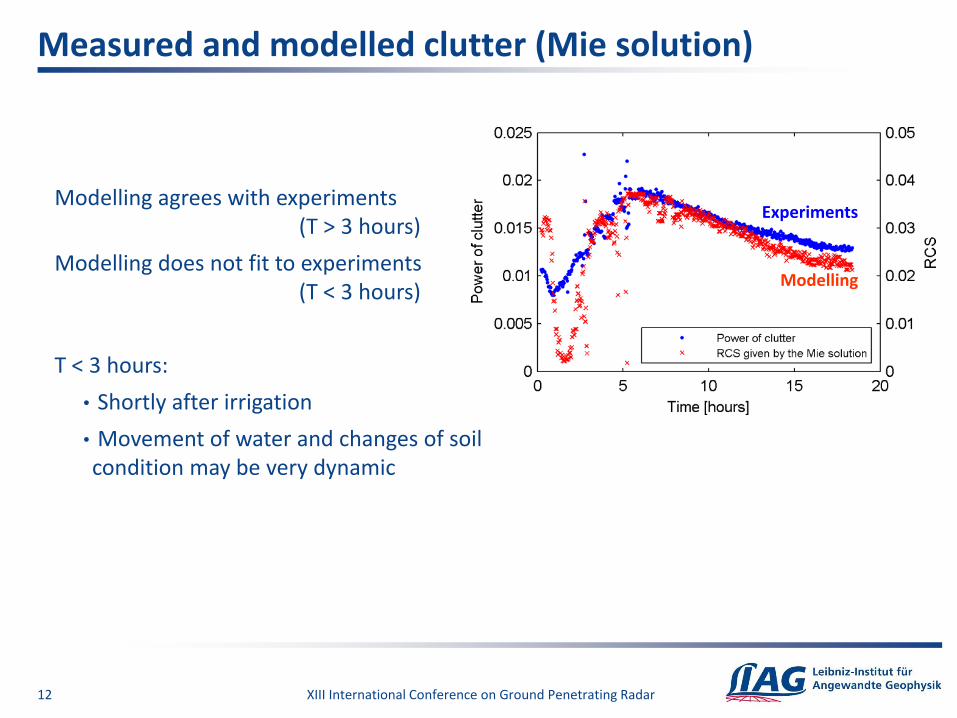
Modelling agrees with experiments(T > 3 hours)
Modelling does not fit to experiments(T < 3 hours)
T < 3 hours:
• Shortly after irrigation
• Movement of water and changes of soil condition may be very dynamic
Experiments
Modelling

XIII International Conference on Ground Penetrating Radar
Summary
13
GPR & TDRmeasurements
Determination of soil inhomogeneitySemivariogram(correlation length, semivariance)
Clutter modellingCalculation of RCSfrom determined parametersMie solution
Extraction of clutter
Good agreements
XIII International Conference on Ground Penetrating Radar
Conclusions
14
• Soil inhomogeneity in an irrigation test is determined from GPR data
• Clutter is modelled using determined inhomogeneity
A very simple model – a dielectric sphere in homogeneous spaceModelling with the Mie solution agrees with experiments
Landmine detection (higher frequency):Scattering by soil inhomogeneity is dominated by Mie scattering
Ordinary GPR measurements:Scattering by soil inhomogeneity often refers to Rayleigh scattering

XIII International Conference on Ground Penetrating Radar
Semivariogram
16
2
1
1
2
N
i i
i
h z x h z xN
ˆ 1 exp 3h C h a
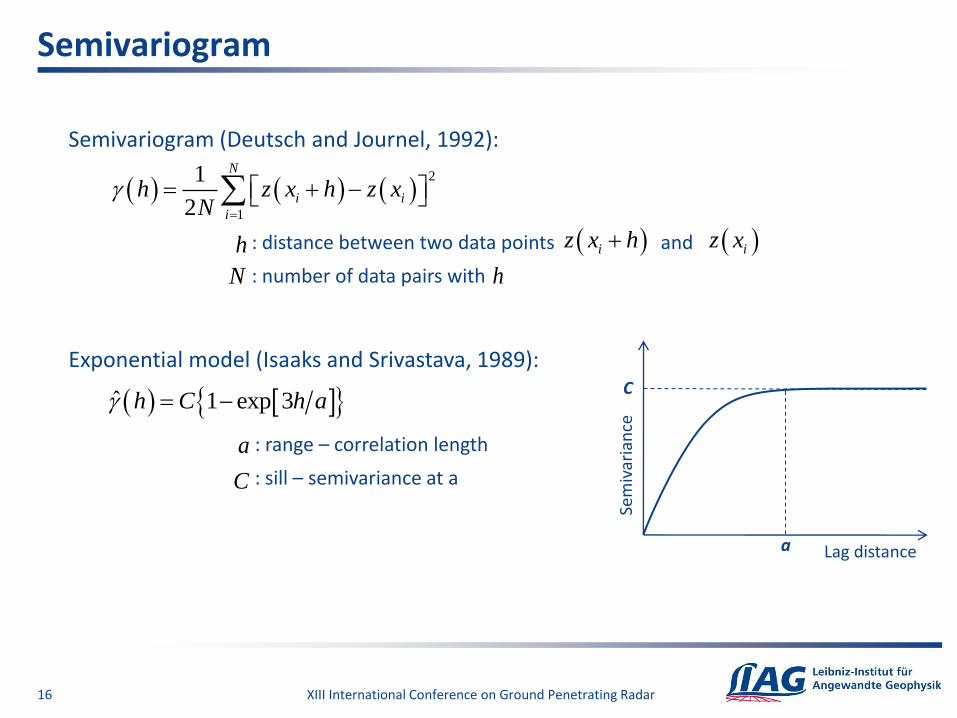
Semivariogram (Deutsch and Journel, 1992):
Exponential model (Isaaks and Srivastava, 1989):
h
N
: distance between two data points and
: number of data pairs with
i iz x h z x
h
: range – correlation length
: sill – semivariance at a
a
C
Sem
ivar
ian
ce
Lag distancea
C

XIII International Conference on Ground Penetrating Radar
Mie solution
17
2
2
2
12 1 1 ( 1,2, , )s n n
n
n a b nx
2
2 (1) (1)
n n n n
n
n n n n
m j mx xj x j x mxj mxa
m j mx xh x h x mxj mx
(1) (1)
n n n n
n
n n n n
j mx xj x j x mxj mxb
j mx xh x h x mxj mx
Mie solution (Bohren and Huffman, 1983):
Coefficients (no magnetic permeability contrast):
: wavenumber
: radius of sphere
x ka
k
a
(1)
( )
( )
n
n
m
j x
h x
: refractive index
: spherical Bessel function of first kind of order n
: spherical Hankel function of order n

XIII International Conference on Ground Penetrating Radar
Rayleigh approximation
18
22
4
2
14
2s
mx
m
Rayleigh approximation (Bohren and Huffman, 1983):
for a small dielectric sphere (x << 1)
RCS is proportional to the forth power of size of sphere
x ka
k
a
m
: wavenumber
: radius of sphere
: refractive index

XIII International Conference on Ground Penetrating Radar
Mie solution and Rayleigh approximation
19
Ambient homogeneous space: εr = 12Dielectric sphere: εr = 16.7
Refractive index = 1.18