Mudanças Climáticas e a Floresta Amazônica - Fapesp · Mudanças Climáticas e a Floresta...
47
Mudanças Climáticas e a Floresta Amazônica Climate Change and the Amazon Forest Philip M. Fearnside Instituto Nacional de Pesquisas da Amazônia – INPA http://philip.inpa.gov.br International Conference Getting Post 2010 Biodiversity Targets Right. Projeto Biota, 11 a 15 de dezembro, Bragança Paulista-SP.. 13 de dez de 2010
Transcript of Mudanças Climáticas e a Floresta Amazônica - Fapesp · Mudanças Climáticas e a Floresta...

Mudanças Climáticas e
a Floresta AmazônicaClimate Change and the Amazon Forest
Philip M. Fearnside
Instituto Nacional de Pesquisas da Amazônia – INPA
http://philip.inpa.gov.br
International Conference Getting Post 2010 Biodiversity Targets Right. Projeto
Biota, 11 a 15 de dezembro, Bragança Paulista-SP.. 13 de dez de 2010

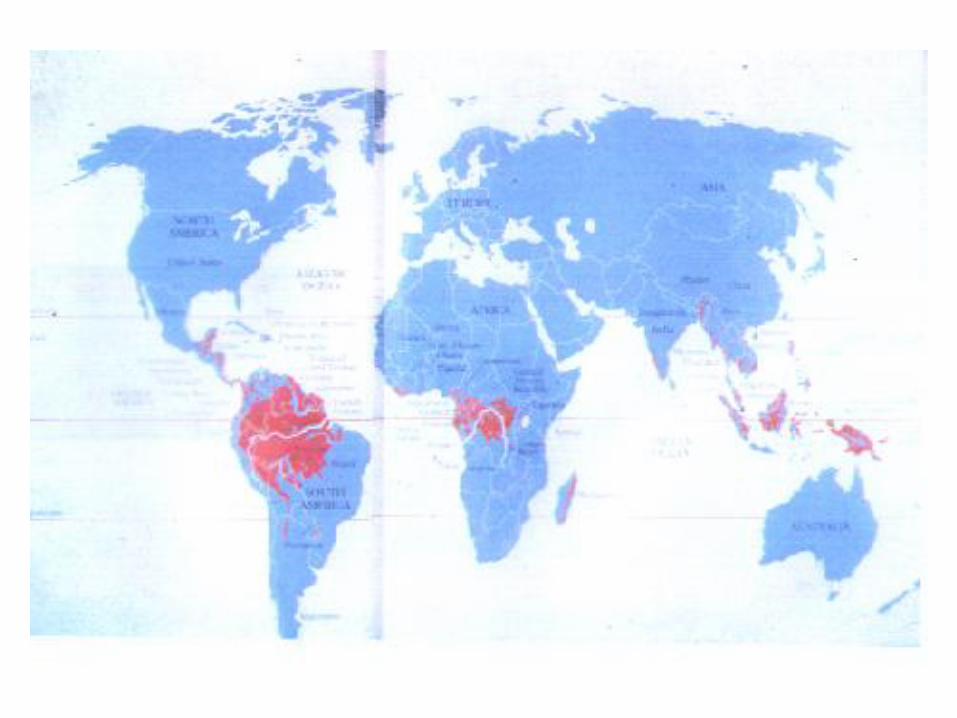
Nat Geogr. map

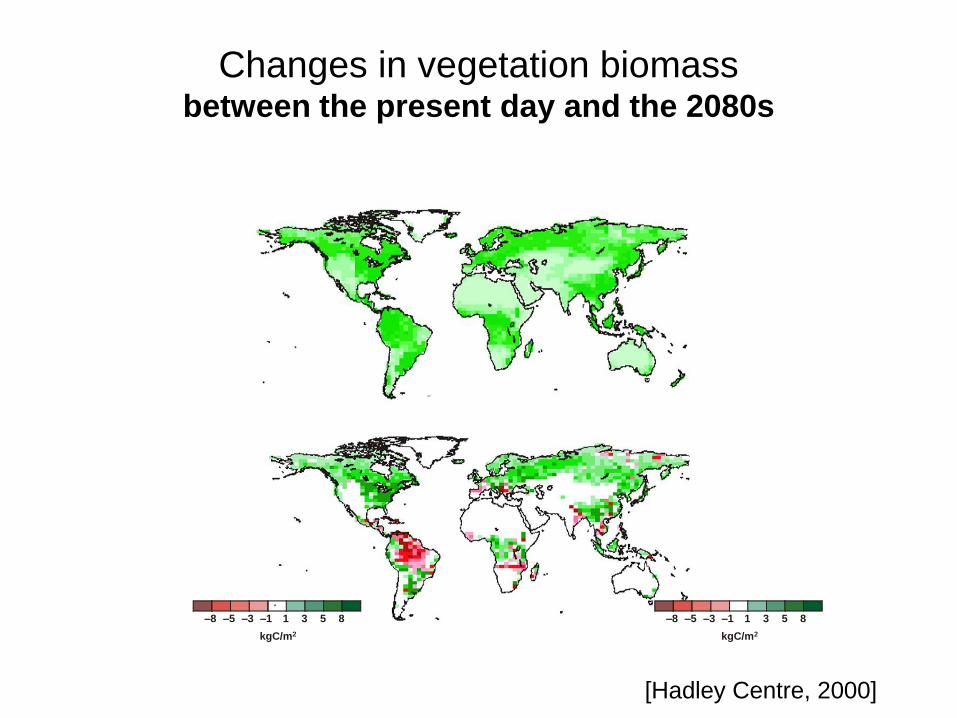
Changes in vegetation biomassbetween the present day and the 2080s
–8 –5 –3 –1 1 3 5 8
kgC/m2
–8 –5 –3 –1 1 3 5 8
kgC/m2
[Hadley Centre, 2000]
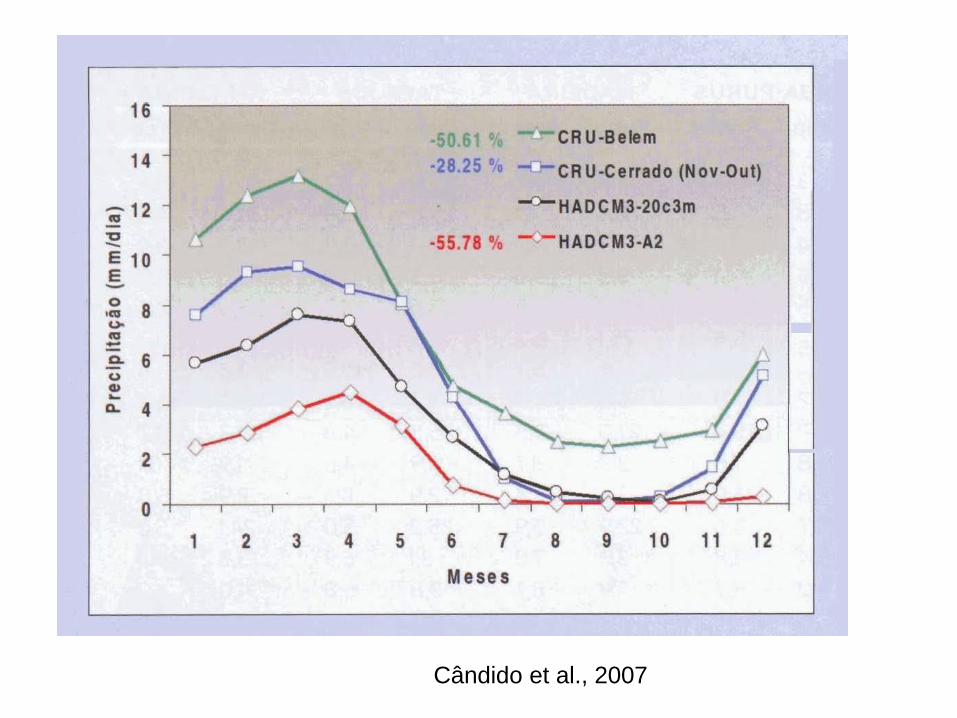
Cândido et al., 2007

IPCC AR4 WG2 2007. Chapter 3
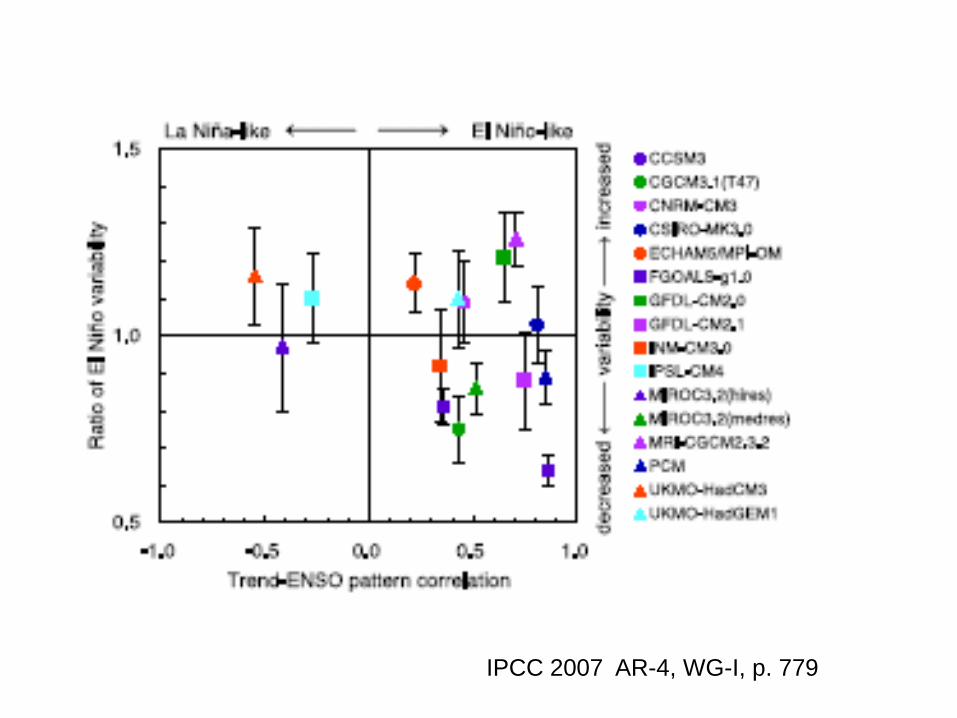
IPCC 2007 AR-4, WG-I, p. 779
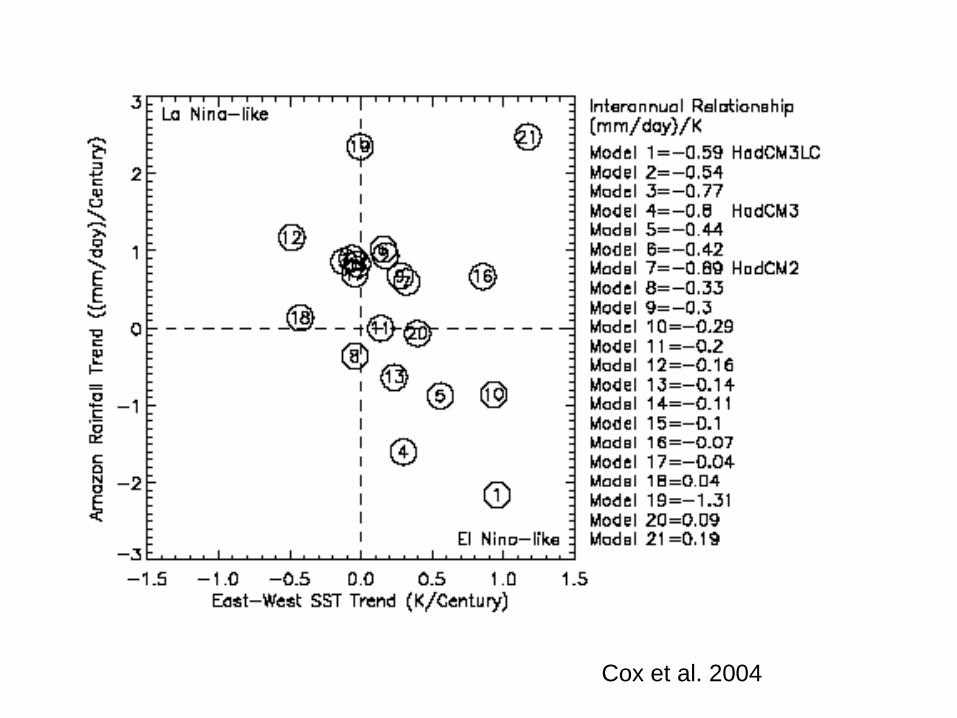
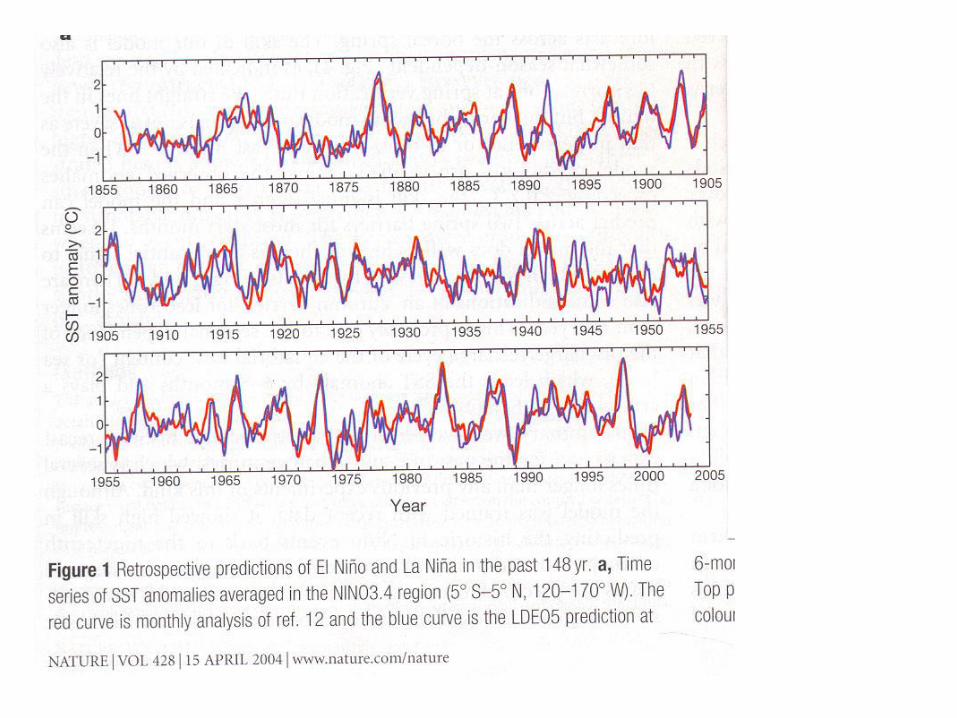
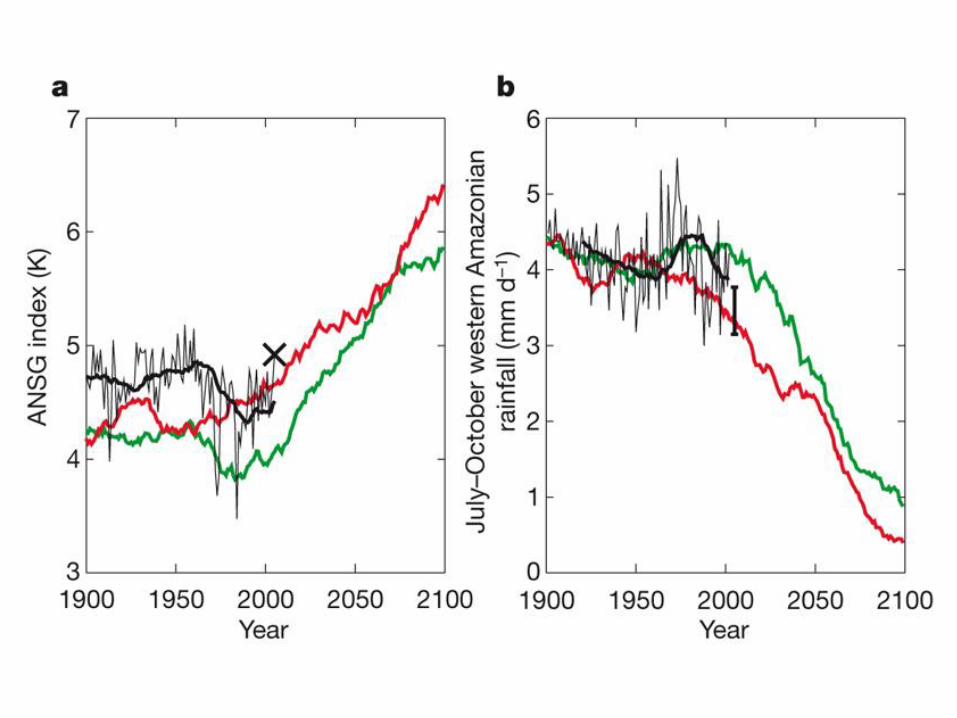
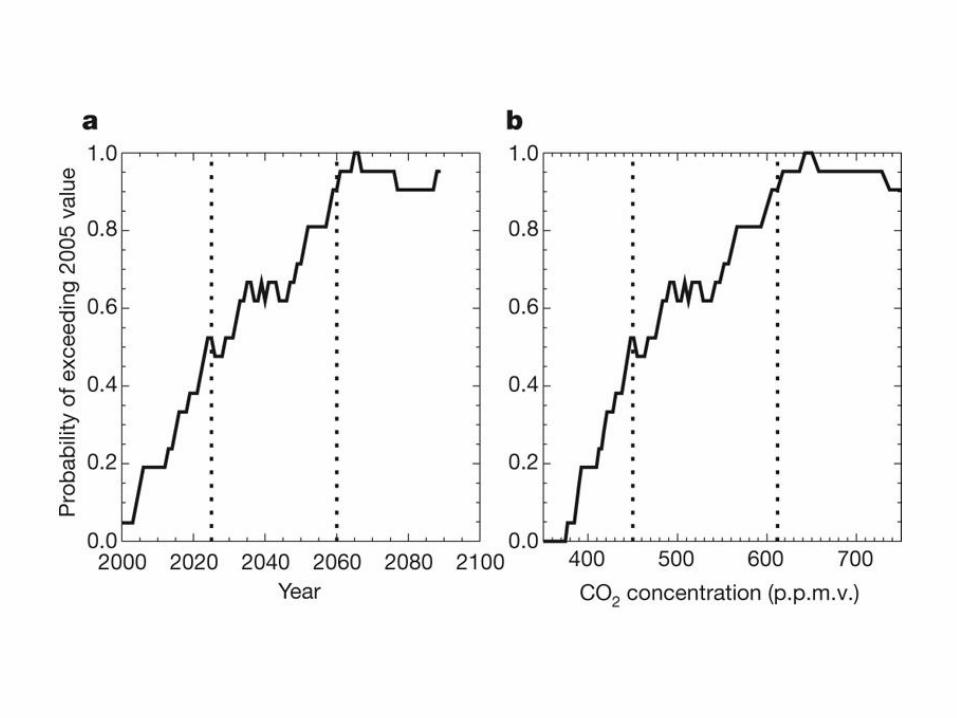
Cox et al. 2004

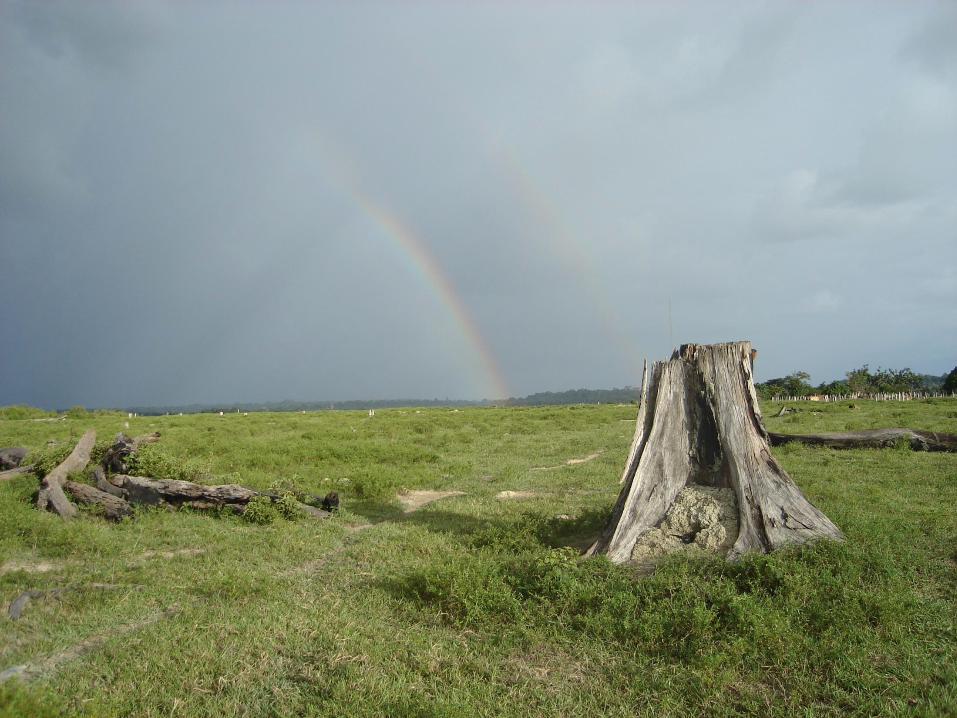
Photo by R.I. Barbosa

Cox et al. 2004

Stainforth,2005

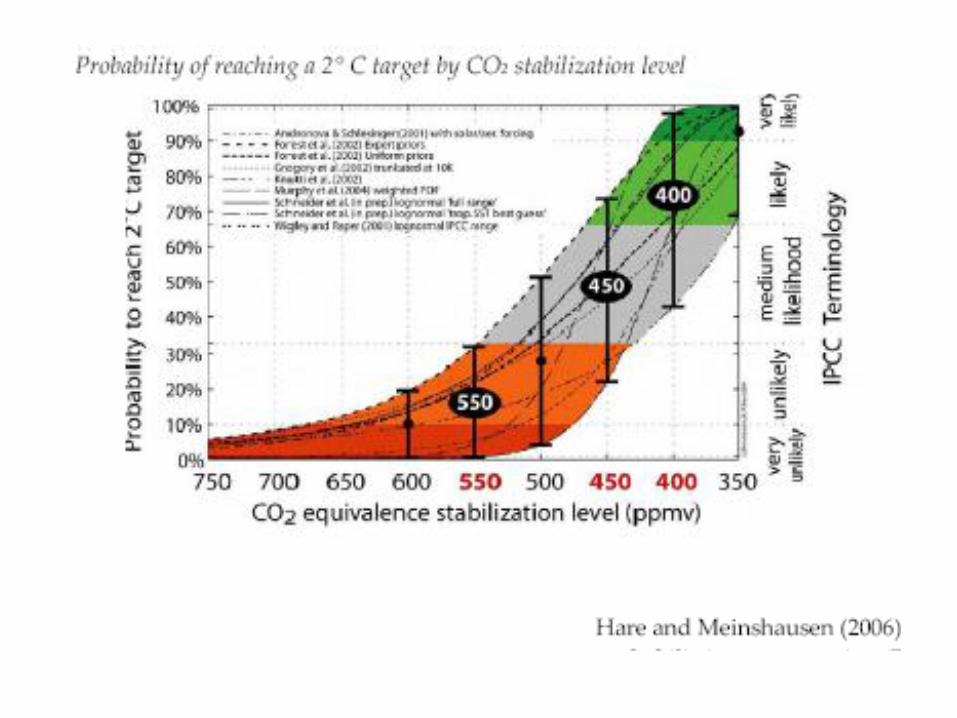
ADAPTED FROM HEGERL ET AL., NATURE (2006)
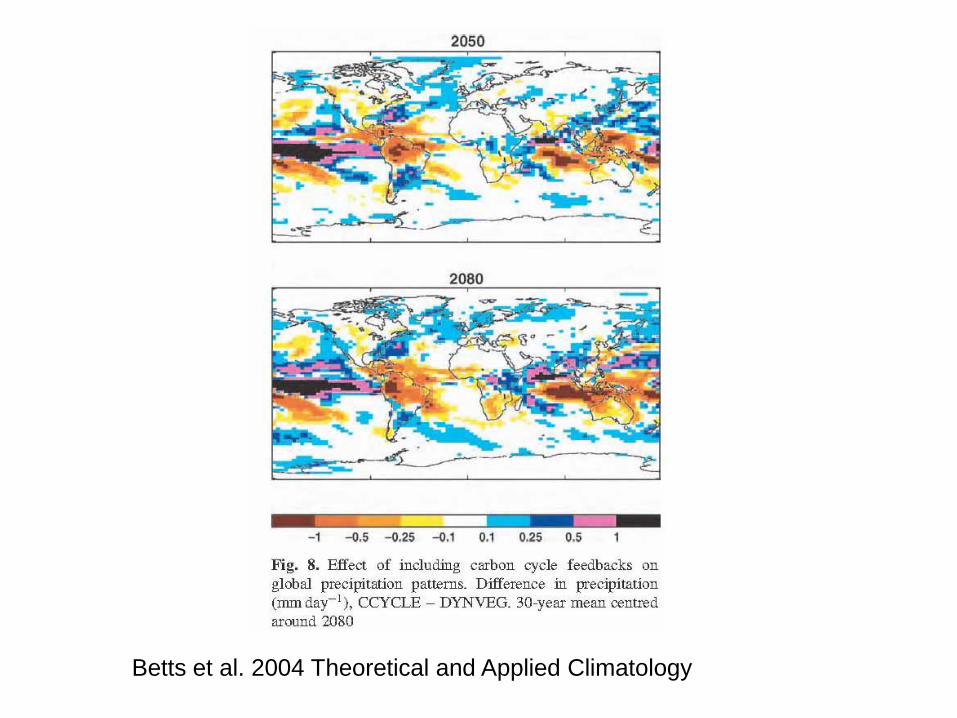
Betts et al. 2004 Theoretical and Applied Climatology

Huntingford et al. 2004 Theoretical and Applied Climatology
500
Kilometersi
Legend:
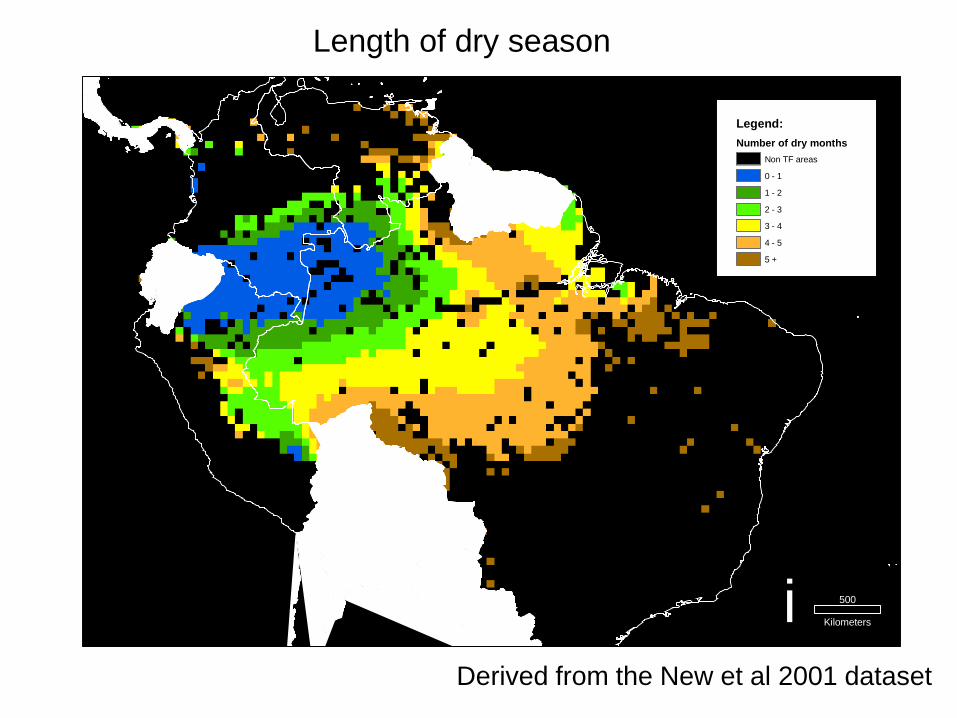
Number of dry months
Non TF areas
0 - 1
1 - 2
2 - 3
3 - 4
4 - 5
5 +
500
Kilometersi
Length of dry season
Derived from the New et al 2001 dataset
Legend:
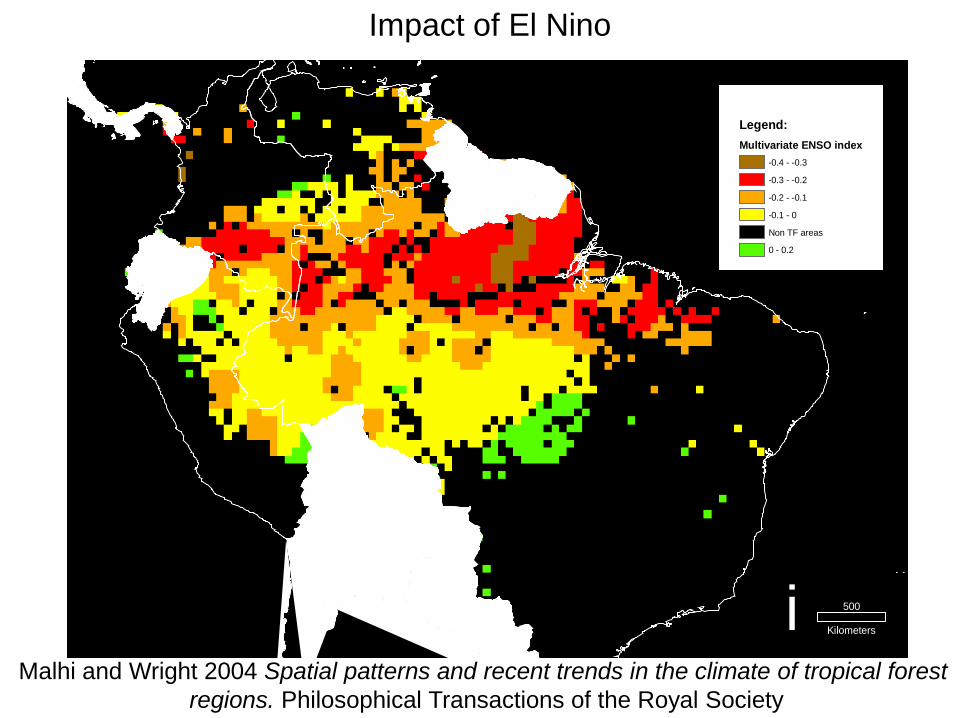
Multivariate ENSO index
-0.4 - -0.3
-0.3 - -0.2
-0.2 - -0.1
-0.1 - 0
Non TF areas
0 - 0.2
550
Kilometersi500
Kilometersi
Impact of El Nino
Malhi and Wright 2004 Spatial patterns and recent trends in the climate of tropical forest
regions. Philosophical Transactions of the Royal Society
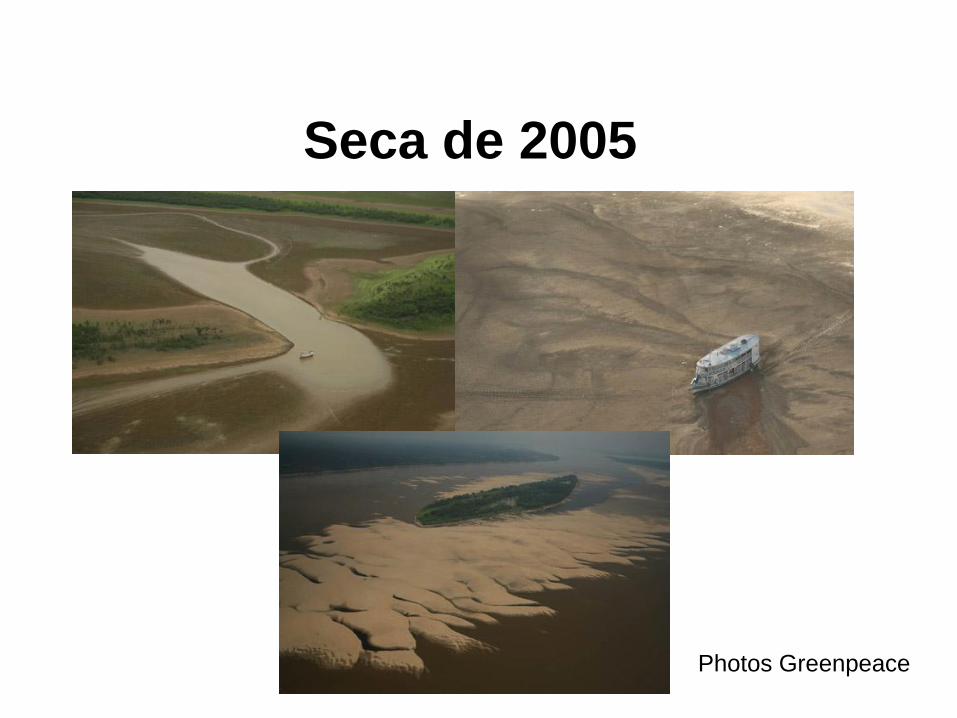
Seca de 2005
Photos Greenpeace


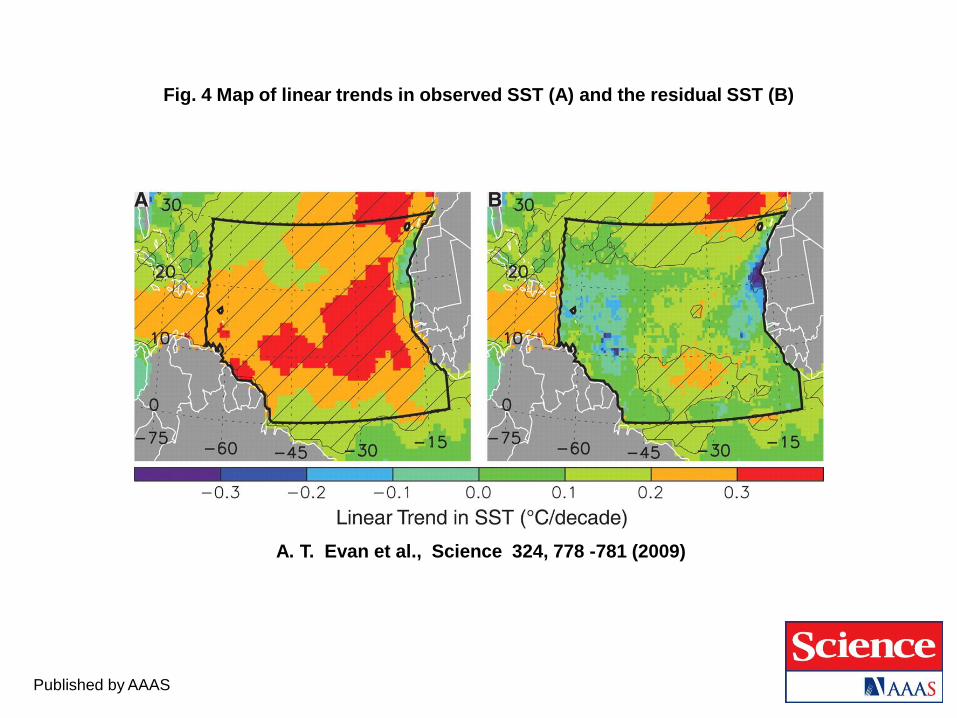
Published by AAAS
A. T. Evan et al., Science 324, 778 -781 (2009)
Fig. 4 Map of linear trends in observed SST (A) and the residual SST (B)

Published by AAAS
A. T. Evan et al., Science 324, 778 -781 (2009)
Fig. 2 Time series of mixed layer response to dust and stratospheric aerosol forcing (A) and observed SST anomalies (B)
This is especially critical because studies
have estimated a reduction in Atlantic dust
cover of 40 to 60% under a doubled carbon
dioxide climate (33), which, on the basis of
model runs with an equivalent reduction of
the mean dust forcing, could result in an
additional 0.3° to 0.4°C warming of the
northern tropical Atlantic. Evan et al. 2009, pp. 780-781
These calculations suggest that 69% of the
recent upward trend in northern tropical
Atlantic SST is due to changes in aerosols.
33=Mahowald, N. M., and C. Luo (2003), A less dusty future?, Geophys. Res. Lett., 30(17), 1903
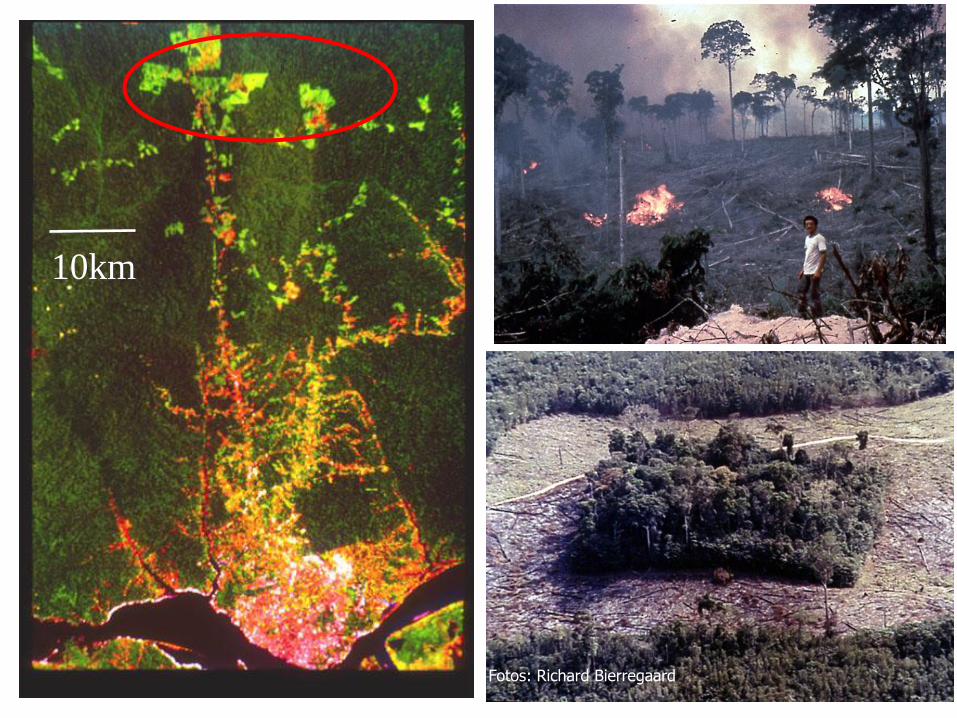
10km
Fotos: Richard Bierregaard

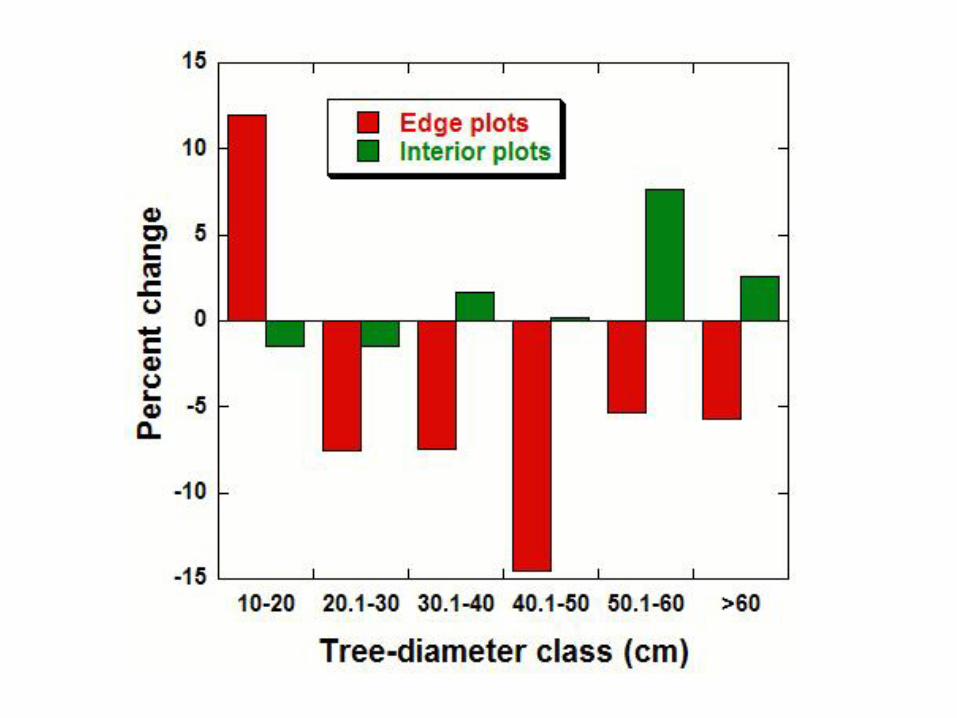
Damage and mortality of trees (%/yr)
0
0.5
1
1.5
2
2.5
3
3.5
4
< 300 m > 300 m
< 0.0013.1
1.6
Tax
a d
e d
an
os (
%/a
no
)
0.5
1
1.5
2
2.5
3
3.5
4
4.5
100 1000
Y = 3.64 - 0.75 log X
R=0.51, P=0.0002
Mo
rtality (
%/y
ear)
Distance to edge (m)
Nascimento and Laurance, 2004 Ecol. Appl.;

Painéis Suportes
CalhasDrenos
Redução de
50-60% da
precipitação
Experimentos de exclusão de chuvas – simulando el niños de longa
duração – Projetos LBA/ESECAFLOR e LBA/SECA FLORESTA
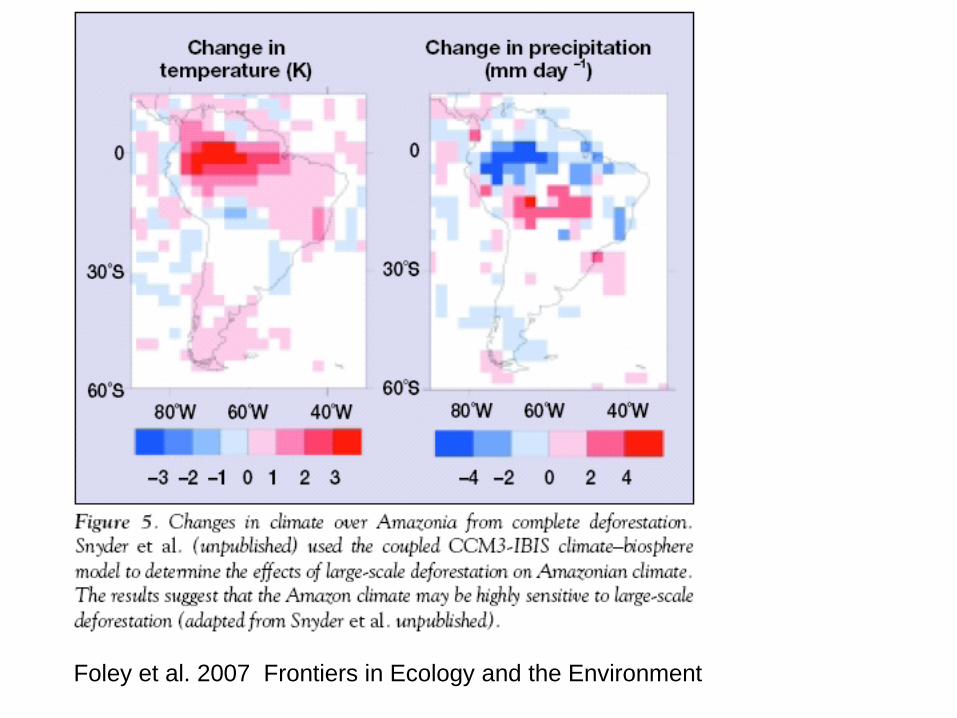
Foley et al. 2007 Frontiers in Ecology and the Environment


IPCC, 2007 AR4 WG1 Ch. 10 p. 775
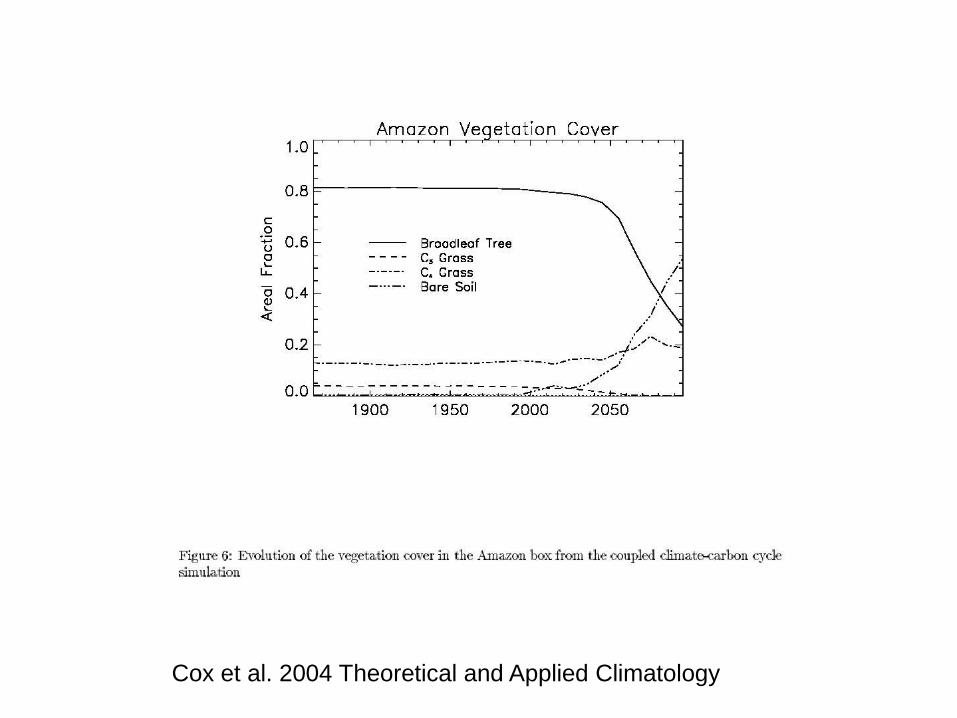
Cox et al. 2004 Theoretical and Applied Climatology

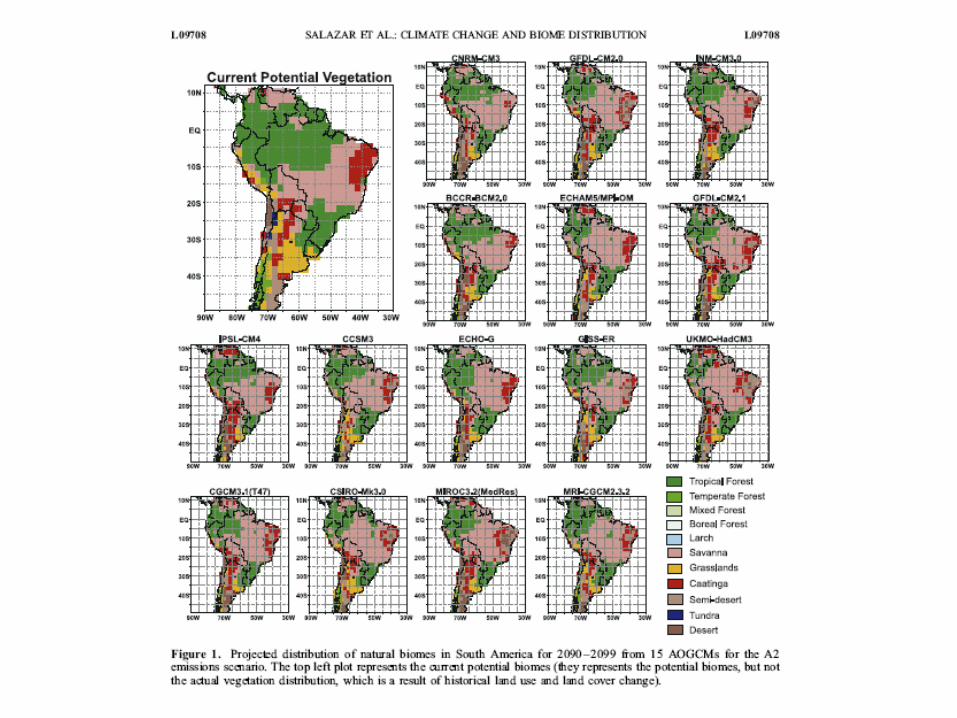
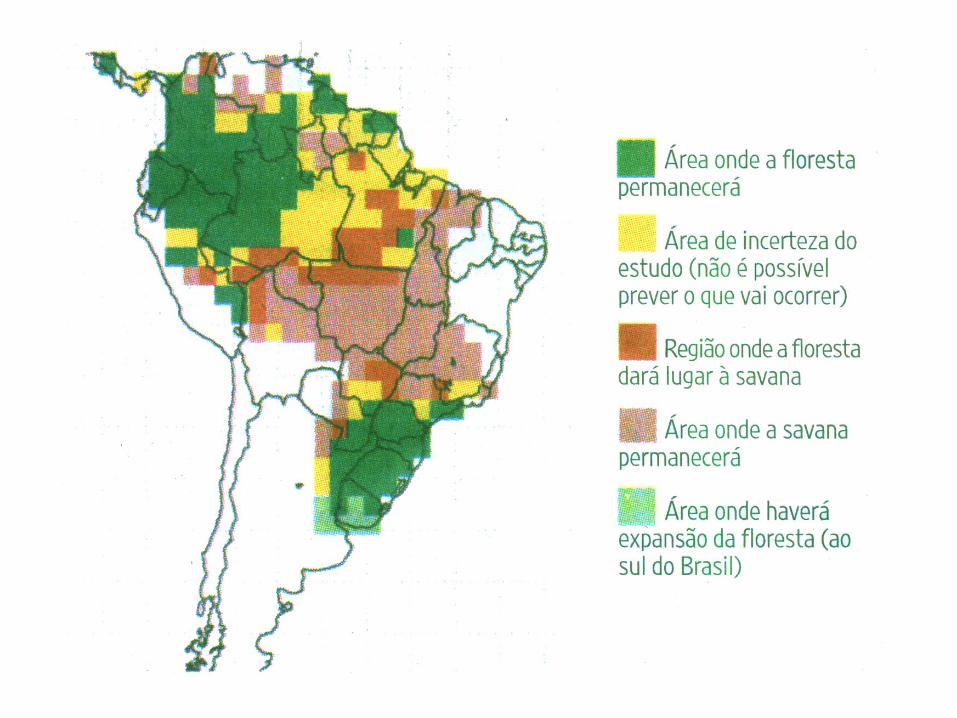

Miles et al., 2004. Global Ecology and Biogeography, 13: 553–565.
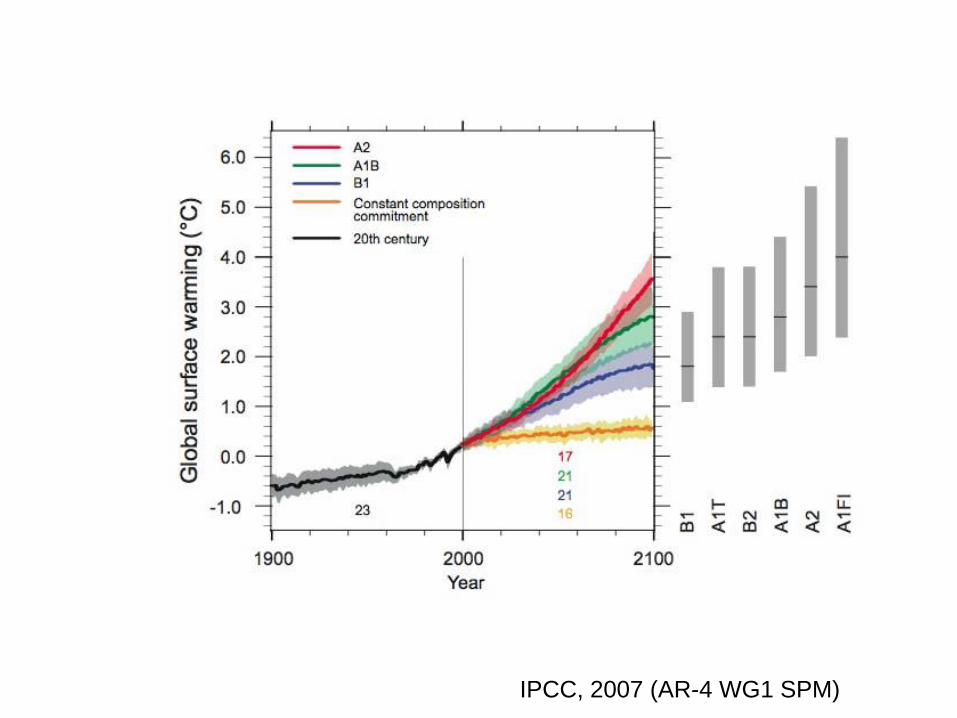
IPCC, 2007 (AR-4 WG1 SPM)