Motivation Growing literature on intergenerational earnings mobility for different countries Two...
24
-
date post
22-Dec-2015 -
Category
Documents
-
view
214 -
download
0
Transcript of Motivation Growing literature on intergenerational earnings mobility for different countries Two...
Motivation
• Growing literature on intergenerational earnings mobility for different countries
• Two shortcomings• Based on simple parent-child correlations
or elasticities. Little about mobility and persistence at different points of the distributions.
• Few are explicitly comparative in construction
Aims, contributions
• Look beyond correlations/elasticities• More general mobility measures, quintile group
mobility matrix → more informative and comprehensive picture
• Impose as much similarity as possible on data and analysis from six countries. Boot strap confidence intervals → new findings on international mobility differences
• In particular, place the notion of American exceptionalism in new light
Data
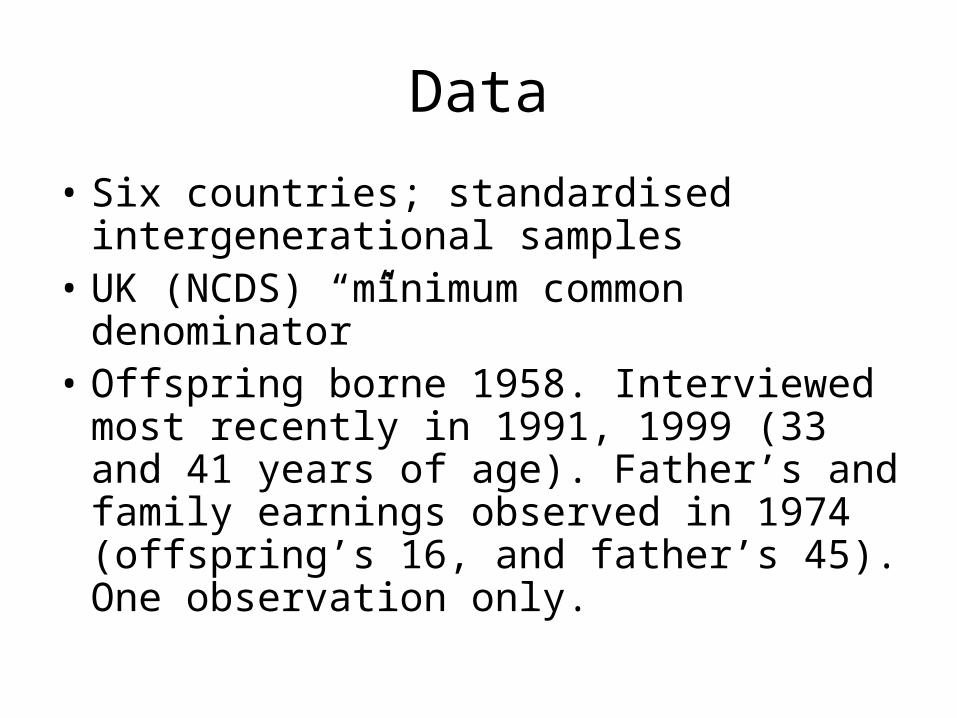
• Six countries; standardised intergenerational samples
• UK (NCDS) “minimum common denominator”
• Offspring borne 1958. Interviewed most recently in 1991, 1999 (33 and 41 years of age). Father’s and family earnings observed in 1974 (offspring’s 16, and father’s 45). One observation only.
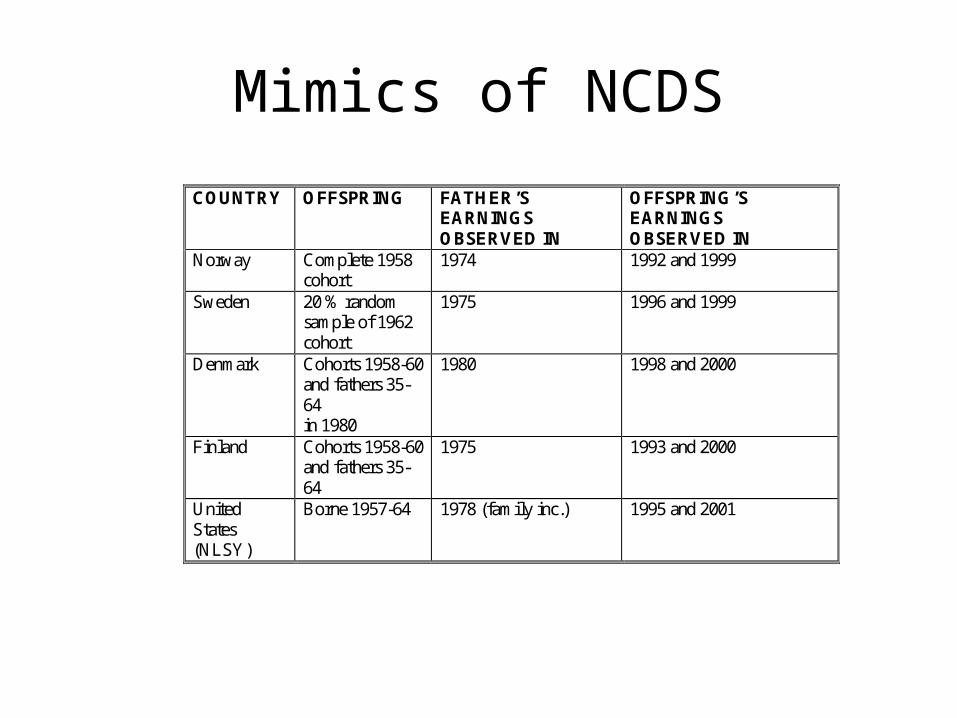
Mimics of NCDS
COUNTRY OFFSPRING FATHER’S EARNINGS OBSERVED IN
OFFSPRING’S EARNINGS OBSERVED IN
Norway Complete 1958 cohort
1974 1992 and 1999
Sweden 20 % random sample of 1962 cohort
1975 1996 and 1999
Denmark Cohorts 1958-60 and fathers 35-64 in 1980
1980 1998 and 2000
Finland Cohorts 1958-60 and fathers 35-64
1975 1993 and 2000
United States (NLSY)
Borne 1957-64 1978 (family inc.) 1995 and 2001
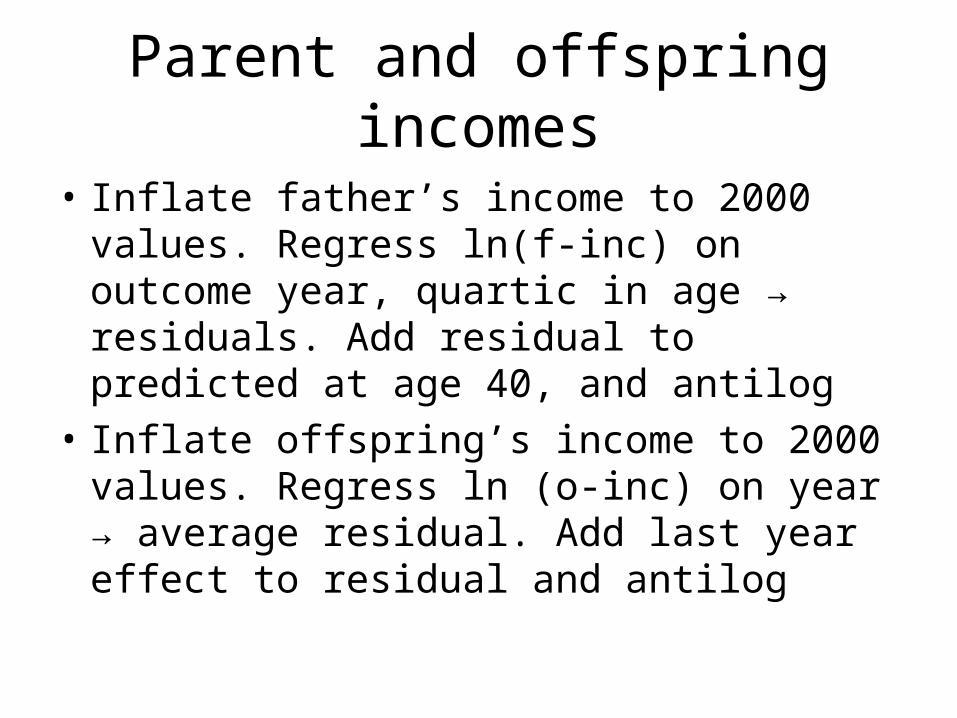
Parent and offspring incomes
• Inflate father’s income to 2000 values. Regress ln(f-inc) on outcome year, quartic in age → residuals. Add residual to predicted at age 40, and antilog
• Inflate offspring’s income to 2000 values. Regress ln (o-inc) on year → average residual. Add last year effect to residual and antilog
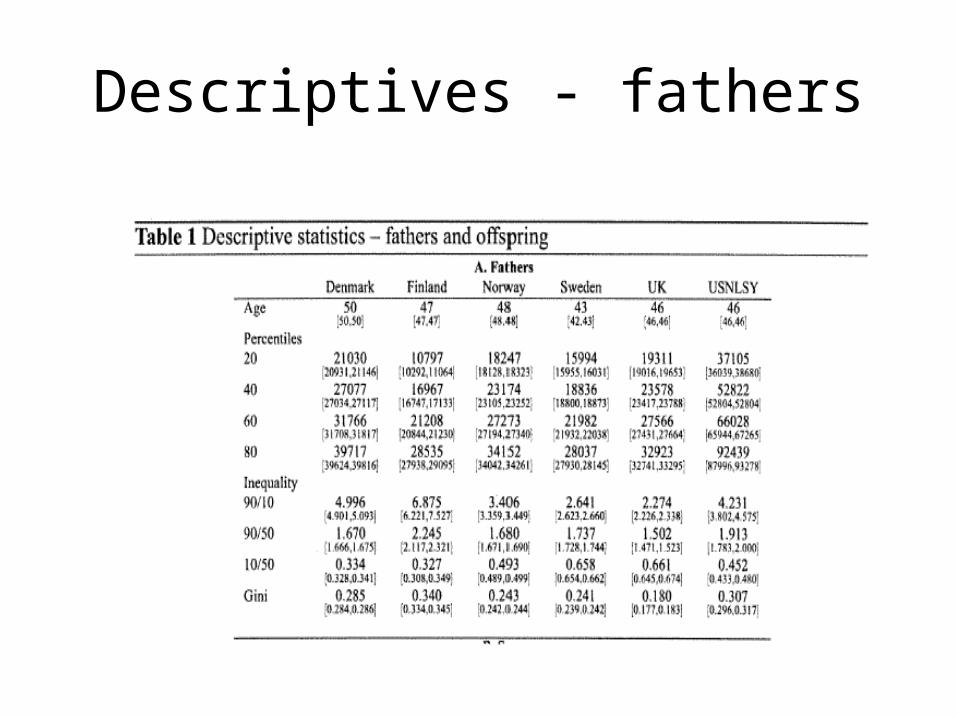
Descriptives - fathers
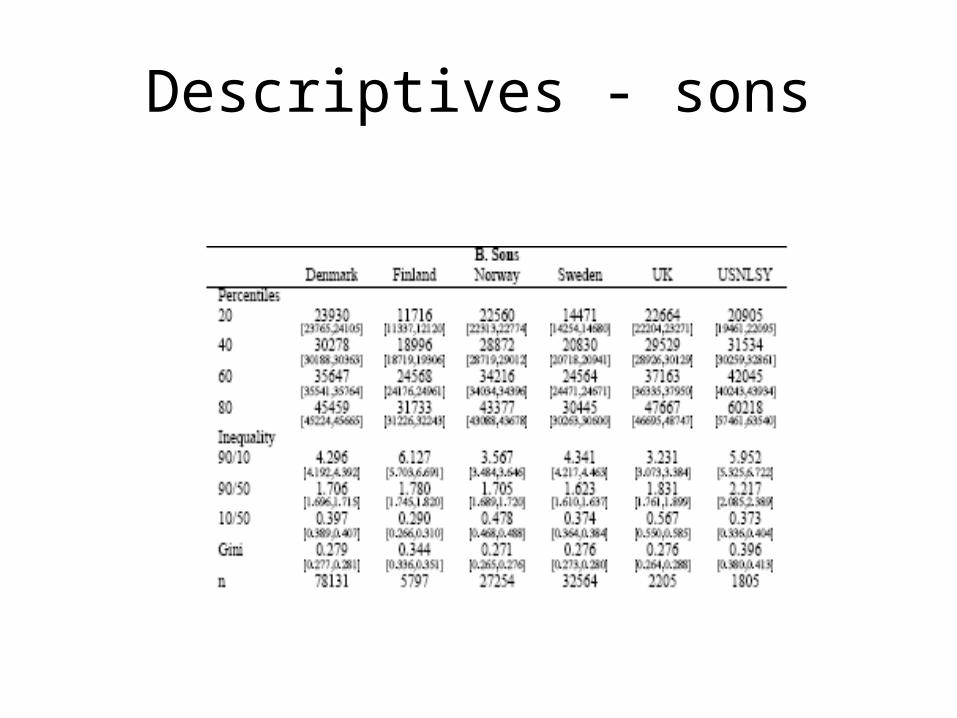
Descriptives - sons
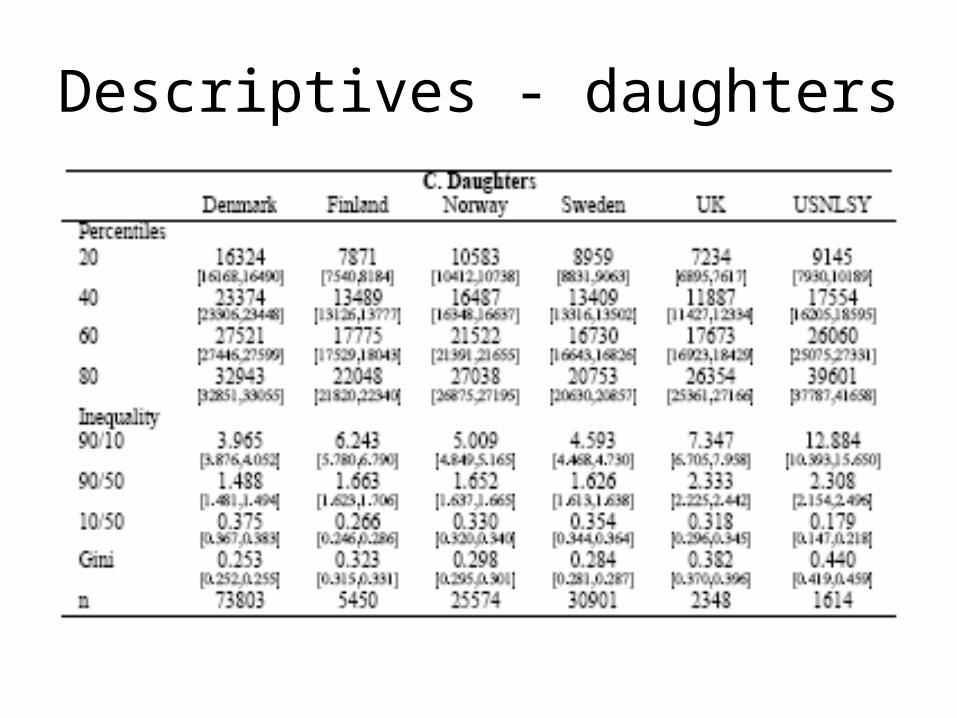
Descriptives - daughters

Measures of mobility and persistence
• Conventional: correlation and elasticity• Quintile group mobility matrix; advantage:
detects asymmetric patterns• Summary mobility indices• Confidence intervals; some measures lack well-
known sampling distributions → boot strap• Cannot pool the micro data → cannot test on
differences when confidence intervals overlap

Pairwise comparisons - elasticities
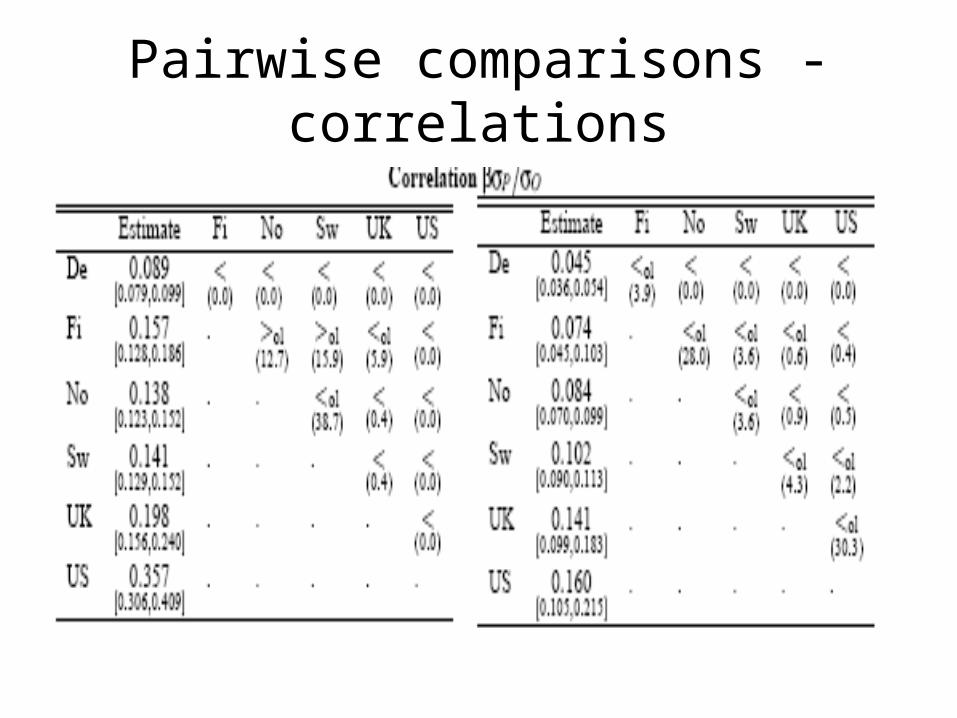
Pairwise comparisons - correlations
Summary of comparisons: elasticities and correlations
• Men: NC highest, US lowest mobility/persistence, UK in between
• Women: smaller differences. Order same, precision lower; no statistical difference UK-US
• Broadly in line with previous studies from the six countries
Summary of comparisons: mobility indices
• Men: US least mobility. Other countries small differences, order measure-dependent
• Women: US least mobile. No other clear pattern

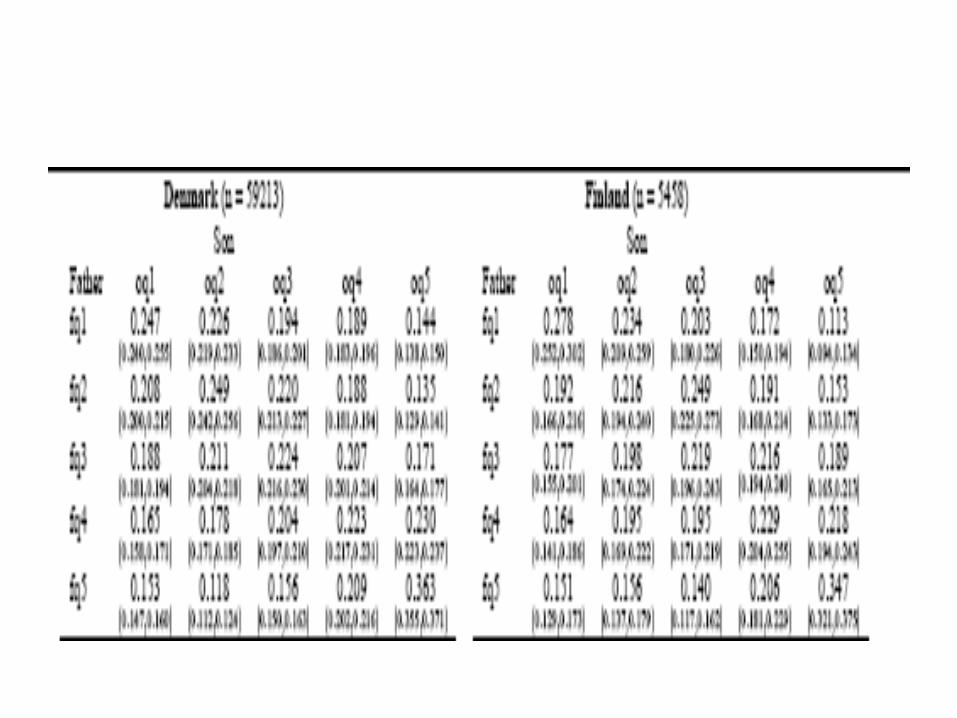
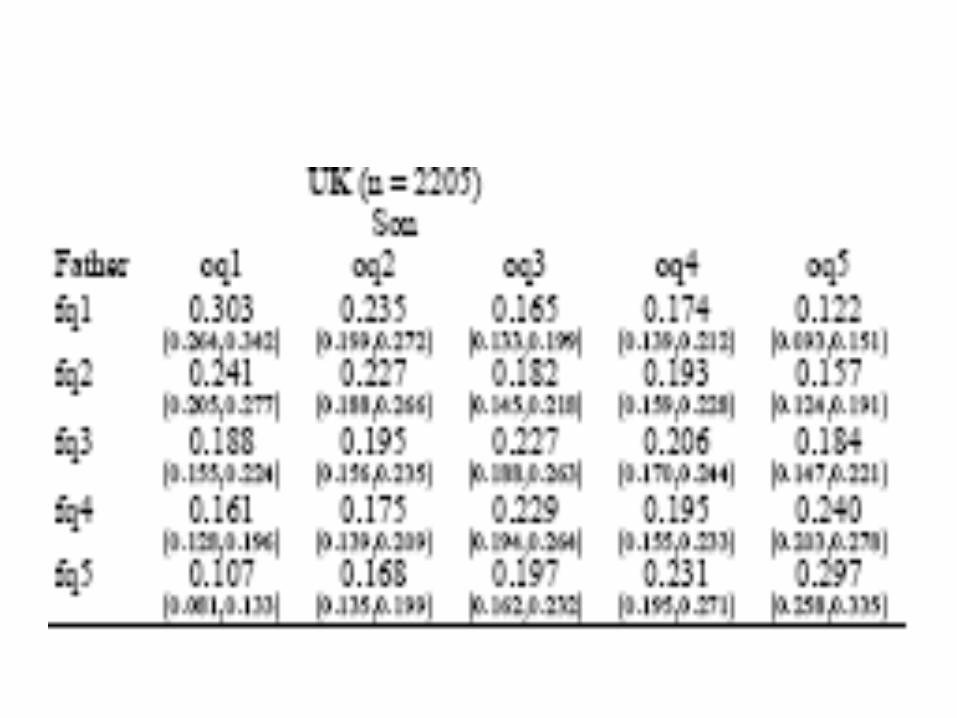
Summary of comparisons: mobility matrices (1)
• Sons: NC similar in all parts of distribution. 25 % in borne in poor family remain poor. 10-15 % from bottom to top. 35 % remain in top quintile
• “Corners”: rags-to-riches mobility clearly lower in US. Top-to-bottom mobility much lower; persistence of high earnings fairly similar across countries
• The central parts of bivariate distributions remarkably similar across the countries


Summary of comparisons: mobility matrices (2)
• Daughters: most cross-country differences insignificant. Exception: bottom-to-top mobility lower in US.
• Observation: for US, upward mobility from lowest quintile much higher for daughters than for sons
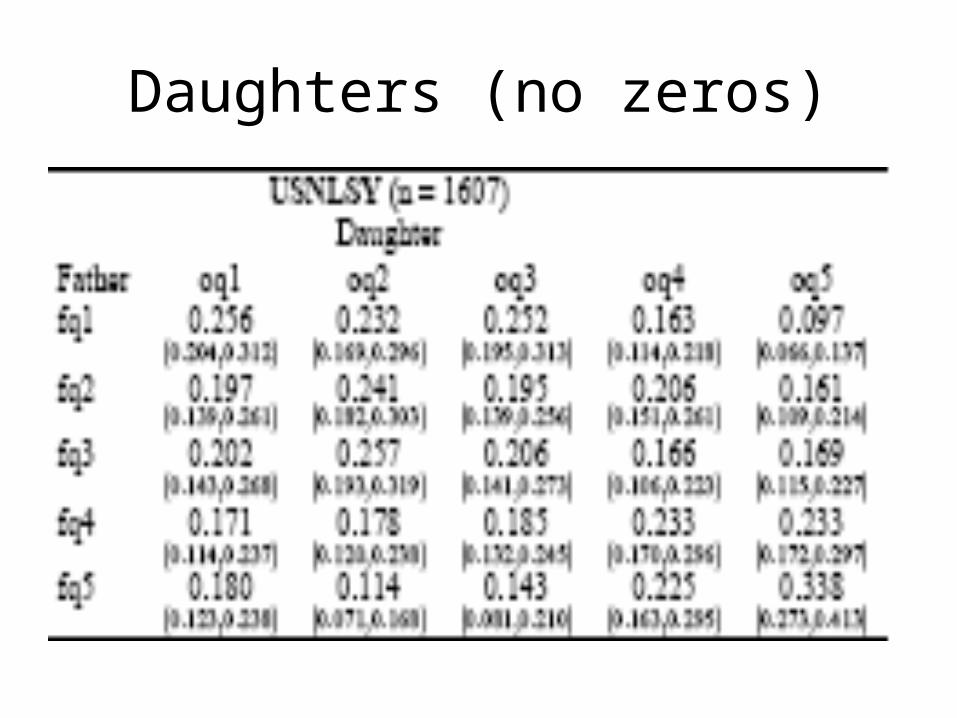
Daughters (no zeros)
Sensitivity checks
• Multi- (instead of single) year earnings for parents
• Family income (like in US) also for UK, and sum of parents’ earnings for NC
• UK weekly earnings; divide US earnings by weeks worked
• The “homogeneity” argument: exclude minority groups from US sample
• All sensitivity analyses support our central conclusions regarding differences, ordering and “corners”

American exceptionalism
• Solon and others: US exceptional: mobility is lower!
• Our study: (for males) in the other countries persistent is high in the top quintile; in the US persistence is highest in the lowest quintile. Mobility in central quintiles remarkably similar across countries.
• US middle class as mobile, but larger changes in living standards. Median voters believe in American exceptionalism, and do not ask for mobility increasing policies
Some lessons
• Summary measures like parent-offspring correlations or elasticities mask interesting differences
• Cross-country comparisons to shed light on mechanisms. Info about where persistence is high or low
• Companion paper shows summary measures give misleading picture of high mobility in Nordic countries