Minorities in Medicine - hrsa.gov€¦ · Guidelines for the United States, 2000-2020 (Janu-ary...
74
Minorities in Medicine: An Ethnic and Cultural Challenge for Physician Training An Update COUNCIL ON GRADUATE MEDICAL EDUCATION Seventeenth Report U.S. DEPARTMENT OF HEALTH AND HUMAN SERVICES Health Resources and Services Administration April 2005
Transcript of Minorities in Medicine - hrsa.gov€¦ · Guidelines for the United States, 2000-2020 (Janu-ary...

Minorities in Medicine: An Ethnic and Cultural Challenge
for Physician Training
An Update
COUNCIL ON GRADUATE MEDICAL EDUCATION
Seventeenth Report
U.S. DEPARTMENT OF HEALTH AND HUMAN SERVICESHealth Resources and Services Administration
April 2005


Minorities in Medicine: An Ethnic and Cultural Challenge
for Physician Training
An Update
COUNCIL ON GRADUATE MEDICAL EDUCATION
Seventeenth Report
April 2005
U.S. DEPARTMENT OF HEALTH AND HUMAN SERVICESHealth Resources and Services Administration
SEVENTEENTH REPORT OF COGME ii
The views expressed in this document are solely those of theCouncil on Graduate Medical Education and do not
necessarily represent the views of theHealth Resources and Services Administration
nor the U.S. Government.

SEVENTEENTH REPORT OF COGME iii
Table of Contents
The Council on Graduate Medical Education .............................................................................................. viiMembers of the Council on Graduate Medical Education ........................................................................... ix
Executive Summary ........................................................................................................................................... 1Introduction ................................................................................................................................................. 1Findings and Recommendations ................................................................................................................ 2
Introduction ........................................................................................................................................................ 7 Implications of Changing Demographics in the U.S. ................................................................................. 7Health Disparities ....................................................................................................................................... 9 Influences on Health Disparities ............................................................................................................... 10 Who Is a URM in Medicine? .................................................................................................................... 11 Trends in Minority Participation in Medicine .......................................................................................... 11 Barriers to the Educational Pipeline ......................................................................................................... 12Implications of Cultural Competence ....................................................................................................... 15 Assessment of COGME’s Twelfth Report ................................................................................................ 15
Strengthening the Pipeline to Medical School ............................................................................................... 17Pipeline Programs ..................................................................................................................................... 17
Findings .............................................................................................................................................. 171998 Recommendations To Be Attained ............................................................................................ 18Evaluation Considerations ................................................................................................................. 18
Overcoming Barriers to Increasing URM Medical School Applicants ................................................................................................................................................ 18
Findings .............................................................................................................................................. 181998 Recommendations To Be Attained ............................................................................................ 20Evaluation Considerations ................................................................................................................. 20
Social Marketing To Increase URMs in the Pipeline ............................................................................... 20Findings .............................................................................................................................................. 201998 Recommendations To Be Attained ............................................................................................ 21Evaluation Considerations ................................................................................................................. 21
Strengthening the Pipeline to Medical School: Recommendations .......................................................... 21
Strengthening Upstream Efforts in Medical Training .................................................................................. 23Admissions ............................................................................................................................................... 23
Findings .............................................................................................................................................. 231998 Recommendations To Be Attained ............................................................................................ 24Evaluation Considerations ................................................................................................................. 24
Medical School Debt and Financial Assistance ........................................................................................ 24Findings .............................................................................................................................................. 241998 Recommendations To Be Attained ............................................................................................ 27Evaluation Considerations ................................................................................................................. 27

SEVENTEENTH REPORT OF COGME iv
URMs in Specialties ................................................................................................................................. 27Findings .............................................................................................................................................. 271998 Recommendations To Be Attained ............................................................................................ 28Evaluation Considerations ................................................................................................................. 28
URM Faculty ............................................................................................................................................ 28Findings .............................................................................................................................................. 281998 Recommendations To Be Attained ............................................................................................ 30Evaluation Considerations ................................................................................................................. 30
Strengthening Upstream Efforts in Medical Training: Recommendations ............................................... 31
Ensuring Cultural Competence in Medicine ................................................................................................. 33Changing Demographics .......................................................................................................................... 33
Findings .............................................................................................................................................. 331998 Recommendations To Be Attained ............................................................................................ 35Evaluation Considerations ................................................................................................................ 36
Ensuring Cultural Competence in Medicine: Recommendations ............................................................. 37
Bibliography ..................................................................................................................................................... 39
Appendix: A Review of Educational Pipeline Programs and Collaborations ............................................ 49

SEVENTEENTH REPORT OF COGME v
List of Tables
Table 1. Population Estimates for Hispanic and Non-Hispanic Racial/Ethnic Groups and Percentages of Total U.S. Population, 2000 ..................................................8
Table 2. Population Projections for Hispanic and Non-Hispanic Racial/Ethnic Groups and Percentages of Total Population, by Decade ..............................................................8
Table 3. Percentages of Families Having Children Under Age 18 Living Below Poverty Level, by Race/Ethnicity and Family Type, 2002 ...........................................................10
Table 4. U.S. Census Estimates of U.S. Physicians, by Race/Ethnicity and Gender and Rates per 1,000 Population in Each Group, 2000 ...........................................................11
Table 5. Percentages of Racial/Ethnic Groups Enrolled in U.S. Medical Schools, 1998-99 Through 2002-2003 Academic Years .............................................................. 12
Table 6. Percentages of Racial/Ethnic Groups Enrolled in U.S. Osteopathic Medical Schools, 1998-1999 Through 2001-2002 Academic Years ............................. 13
Table 7. Percentage of 1992 High School Graduates, by Race Ethnicity, Family Income, and Parents’ Highest Education Level ...........................................................................14
Table 8. Debt for Allopathic Medical School Graduates, by Years in Medical School, 2001 ...................................................................................................................25
Table 9. Influence of Debt on Specialty Choice for Medical School Graduates, 2001 ..............................................................................................................25
Table 10. Average Debt by Practice Specialty Choice for Medical School Graduates Planning To Practice in an Underserved Area, 2001 .....................................................26
Table 11. Percentages of Undergraduates With Student Financial Aid, by Family Income and Type of Aid .................................................................................................27
Table 12. Specialty Plans of URM and Non-URM U.S. Medical School Graduates, 2001 ...............................................................................................................................27
Table 13. Number and Percentages of U.S. Medical School Faculty, by Race/Ethnicity, 2002 and 1998 and Percent Change .....................................................29
Table 14. U.S. Osteopathic Medical School Faculty, by Race/Ethnicity, 2001-2002 and 1998-1999 and Percent Change ..............................................................................30

SEVENTEENTH REPORT OF COGME vi

SEVENTEENTH REPORT OF COGME vii
The Council on Graduate Medical Education (COGME) was authorized by Congress in 1986 to provide an ongoing assessment of physician workforce trends, training issues, and financing policies and to recommend appropriate Fed-eral and private-sector efforts to address identified needs. The legislation calls for COGME to advise and make recom-mendations to the Secretary of the Department of Health and Human Services (DHHS); the Senate Committee on Health, Education, Labor, and Pensions; and the House of Represen-tatives Committee on Commerce. Section 219 of the Depart-ment of Labor, Health and Human Services, and Education and Related Agencies’ Appropriations Act, 2004, Public Law 102-394, 106 Stat. 1825, resulted in the Secretary of DHHS extending COGME through the end of the fiscal year.
The legislation specifies 17 members for the Council. Appointed individuals are to include representatives of prac-ticing primary care physicians, national and specialty physi-cian organizations, international medical graduates, medical student and house staff associations, schools of medicine and osteopathy, public and private teaching hospitals, health in-surers, business, and labor. Federal representation includes the Assistant Secretary for Health, DHHS; the Administrator of the Centers for Medicare and Medicaid Services, DHHS; and the Chief Medical Director of the Veterans Administra-tion.
CHARGE TO THE COUNCIL
The charge to COGME is broader than the name would imply. Title VII of the Public Health Service Act, as amended, requires COGME to provide advice and recommendations to the Secretary of DHHS and Congress on the following issues:
1. The supply and distribution of physicians in the United States;
2. Current and future shortages or excesses of physi-cians in medical and surgical specialties and subspe-cialties;
3. Issues relating to international medical school grad-uates;
4. Appropriate Federal policies with respect to the mat-ters specified in items 1-3, including policies con-cerning changes in the financing of undergraduate and graduate medical education (GME) programs and changes in the types of medical education train-ing in GME programs;
5. Appropriate efforts to be carried out by hospitals, schools of medicine, schools of osteopathy, and ac-crediting bodies with respect to the matters specified in items 1-3, including efforts for changes in under-graduate and GME programs; and
6. Deficiencies and needs for improvement in data-bases concerning the supply and distribution of, and postgraduate training programs for, physicians in the United States and steps that should be taken to eliminate those deficiencies.
In addition, the Council is to encourage entities provid-ing GME to conduct activities to achieve voluntarily the rec-ommendations of the Council specified in item 5.
COGME PUBLICATIONS
Reports
Since its establishment, COGME has submitted the fol-lowing reports to the Secretary of DHHS and Congress:
• First Report of the Council (1988);
• Second Report: The Financial Status of Teaching Hospitals and the Underrepresentation of Minorities in Medicine (1990);
• Third Report: Improving Access to Health Care Through Physician Workforce Reform: Directions for the 21st Century (1992);
• Fourth Report: Recommendations to Improve Ac-cess to Health Care Through Physician Workforce Reform (1994);
• Fifth Report: Women and Medicine (1995);
• Sixth Report: Managed Health Care: Implications for the Physician Workforce and Medical Education (1995);
• Seventh Report: Physician Workforce Funding Rec-ommendations for Department of Health and Hu-man Services’ Programs (1995);
• Eighth Report: Patient Care Physician Supply and Requirements: Testing COGME Recommendations (1996);
• Ninth Report: Graduate Medical Education Consor-tia: Changing the Governance of Graduate Medical
The Council on Graduate Medical Education

SEVENTEENTH REPORT OF COGME viii
Education to Achieve Physician Workforce Objec-tives (1997);
• Tenth Report: Physician Distribution and Health Care Challenges in Rural and Inner-City Areas (1998);
• Eleventh Report: International Medical Graduates, The Physician Workforce and GME Payment Re-form (1998);
• Twelfth Report: Minorities in Medicine (1998);
• Thirteenth Report: Physician Education for a Chang-ing Health Care Environment (1999);
• Fourteenth Report: COGME Physician Workforce Policies: Recent Developments and Remaining Challenges in Meeting National Goals (1999);
• Fifteenth Report: Financing Graduate Medical Ed-ucation in a Changing Health Care Environment (2000); and
• Sixteenth Report: Physician Workforce Policy Guidelines for the United States, 2000-2020 (Janu-ary 2005).
OTHER COGME PUBLICATIONS
• Scholar in Residence Report: Reform in Medical Education and Medical Education in the Ambula-tory Setting (1991);
• Process by which International Medical Graduates are Licensed to Practice in the United States (Sep-tember 1995);
• Proceeding of the GME Financing Stakeholders
Meeting (April 11, 2001) Bethesda, Maryland;
• Public Response to COGME’s Fifteenth Report (September 2001);
• Council on Graduate Medical Education & National Advisory Council on Nurse Education and Practice: Collaborative Education to Ensure Patient Safety (February 2001);
• Council on Graduate Medical Education: What is it? What has it done? Where is it going? 2nd Edition (2001); and
• 2002 Summary Report (2002).
COGME RESOURCE PAPERS
• Preparing Learners for Practice in a Managed Care Environment (1997);
• International Medical Graduates: Immigration Law and Policy and the U.S. Physician Workforce (1998);
• The Effects of the Balanced Budget Act of 1997 on Graduate Medical Education (2000);
• Update on the Physician Workforce (2000);
• Evaluation of Specialty Physician Workforce Meth-odologies (2000); and
• State and Managed Care Support for Graduate Medical Education: Innovations and Implications for Federal Policy (2004).
For more information on COGME, visit the Council’s Web site at:http://www.cogme.gov or contact:
Council on Graduate Medical Education5600 Fishers Lane, Room 9A-21Rockville, MD 20857Voice: (301) 443-6785Fax: (301) 443-8890

SEVENTEENTH REPORT OF COGME ix
Members
Chair
Carl J. Getto, M.D.Senior Vice President Medical Staff Affairs/Associate Dean Hospital AffairsUniversity of Wisconsin Hospital & ClinicsMadison, Wisconsin
Vice Chair
Robert L. Johnson, M.D., Professor of Pediatrics and Vice Chair, Department of PediatricsNew Jersey Medical SchoolDivision of Adolescent and Young Adult MedicineNewark, New Jersey
Ms. Laurinda L. CalongnePresidentRobert Rose ConsultingBaton Rouge, Louisiana
William Ching, Medical StudentNew York University School of MedicineNew York, New York
Allen Irwin Hyman, M.D., FCCMExecutive Vice President and Chief of StaffColumbia-Presbyterian Medical CenterNew York, New York
Rebecca M. Minter, M.D.VAMC Ann Arbor Healthcare SystemSurgery Service Ann Arbor, Michigan
Lucy Montalvo, M.D., M.P.H.San Diego, California
Angela D. Nossett, M.D.Executive Vice PresidentCommittee of Interns and Residents (CIR)Wilmington Family Health CenterWilmington, California
Earl J. Reisdorff, M.D.Director of Medical EducationIngham Regional Medical CenterDepartment of Medical EducationLansing, Michigan
Russell G. Robertson, M.D.Department of Family and Community MedicineMedical College of WisconsinMilwaukee, Wisconsin
Jerry Alan Royer, M.D., M.B.A.229 Cascade Falls DriveFolsom, California
Susan Schooley, M.D.Chair, Department of Family PracticeHenry Ford Health SystemDetroit, Michigan
Humphrey Taylor, ChairmanThe Harris Poll, Harris InteractiveNew York, New York
Douglas L. Wood, D.O., Ph.D., PresidentAmerican Association of Collegesof Osteopathic MedicineChevy Chase, Maryland
Statutory Members
Cristina Beato, M.D.Acting Assistant Secretary for Health and Surgeon GeneralWashington, D.C.
Mark B. McClellan, M.D., Ph.D.Administrator, Centers for Medicare and Medicaid ServicesDepartment of Health and Human ServicesWashington, D.C.
Robert H. Roswell, M.D.Undersecretary for HealthVeterans Health AdministrationDepartment of Veterans AffairsWashington, D.C.
Designee of the Acting Assistant Secretary for Health
Howard Zucker, M.D., Deputy AssistantSecretary for Health Department of Health and Human ServicesWashington, D.C.
Members of the Council on Graduate Medical Education

SEVENTEENTH REPORT OF COGME x
Designee of the Centers for Medicare and Medicaid Services
Tzvi M. Hefter, Director Division of Acute CareCenters for Medicare and Medicaid ServicesBaltimore, Maryland
Designee of the Department of Veterans Affairs
Stephanie H. Pincus, M.D., M.B.A.Chief Academic Affiliations OfficerDepartment of Veterans AffairsWashington, D.C.
Staff, Division of Medicine and Dentistry,Bureau of Health Professions, HRSADepartment of Health and Human ServicesRockville, Maryland
Tanya Pagán Raggio, M.D., M.P.H.Executive Secretary, COGME, andDirector, Division of Medicine and Dentistry (DMD)
O’Neal Walker, Ph.D.Chief, Dental and Special Projects Branch/DMD
Jerald M. KatzoffDeputy Executive Secretary
C. Howard Davis, Ph.D.Staff Liaison
Helen K. Lotsikas, M.A.Staff Liaison
Jaime Nguyen, M.D., M.P.H.Staff Liaison
Eva M. StoneProgram Analyst and Committee Management Specialist
Anne PattersonSecretary
Contractor for Report Preparation
Rhonda Ray, Ph.D.East Stroudsburg University

SEVENTEENTH REPORT OF COGME 1
INTRODUCTION
In 1998, the Council on Graduate Medical Education (COGME) published its Twelfth Report, entitled Minori-ties in Medicine. This report made 21 recommendations for achieving two goals: 1) increase the number and proportion of underrepresented minorities (URMs) in medicine and 2) strengthen cultural competency in physicians. “Underrep-resented minorities” refers to African Americans, Native Americans, Alaska Natives, Mexican Americans, and Main-land Puerto Ricans—minority groups represented in lower proportions in the health professions than in the United States (U.S.) population as a whole (1).1
This report reviews the literature regarding the ad-vancement of these goals since the 1998 COGME recom-mendations, assesses the progress made through 2003, and notes key findings. It also recommends ways to support the academic pipeline to facilitate minority entry into medical school, strengthen upstream (institutional and policy) efforts in medical training, and ensure cultural competence in medi-cine and medical education.
Increasing the number of URM students who success-fully advance through the elementary, secondary, and post-secondary academic pipeline is the first step to enlarge the potential number of these students eligible to enter medical school. The educational pipeline for URMs, beginning with emphasis on reading skills in the early elementary grades and continuing through enrollment in medical training, must be enhanced to increase the number of URMs in medicine. Bar-riers to the successful negotiation of that pipeline are being addressed, but additional efforts are needed to reduce these barriers further. For example, many obstacles to children’s educational achievement lie in their personal environment, including poverty (3). Further, African American, Hispanic, and low-income high school graduates are less likely to be academically well prepared for college than other groups (4). Overcoming barriers to high school graduation and facilitat-ing educational attainment for URMs must be priorities to in-crease their high school graduation rates, academic achieve-ment, college admission and graduation, and admission to and graduation from medical school.
Research indicates that the greatest barrier to URM ad-mission to medical school is the low applicant pool of URM college graduates resulting from high attrition rates in high school and low enrollments in college. Recently, the rate of
medical school applications for URM college graduates has been similar to or even higher than the application rate for non-URM college graduates (3). URM college graduates in 2000-2001 applied to medical school at a rate of 28 per 1,000 graduates compared to a rate of 25 per 1,000 white college graduates applying to medical school that year (5,6).2 To in-crease the pool of URM medical school applicants, the reten-tion of URM students must be addressed, at both the high school and undergraduate levels.
Increasing the number of URM physicians is an impor-tant step for improving health care for minority and under-served populations and, consequently, for decreasing health disparities, one of the Nation’s leading health priorities (7). Studies have shown that minority patients sometimes receive less health care and are less satisfied with their care when their physician is of a different race or ethnicity (8-14). Pa-tients who lack proficiency in the English language also have less satisfaction with their health care and more difficulty in obtaining care than those patients who have no language barriers (8,15-17). Studies also show that, compared to non-underrepresented physicians, URM physicians provide more care to minorities, the underserved, the uninsured, those insured by Medicaid, and low-income persons (18-20). A recent study has suggested that URM physicians may have more difficulty getting their patients admitted to hospitals and referring them to specialists or for testing (21). These studies indicate the need to train more well-qualified URM physicians and to address systemic and institutional barriers that URM physicians may face.
The need for additional well-trained physicians repre-senting URM groups is expected to be even more critical in the future, as URM populations are projected to grow more rapidly than non-URM populations (22). However, with the rapid expansion of minority populations and the lagging growth of minority physicians in the United States, non-URM physicians will continue to provide a large portion of health care to racial and ethnic groups different from their own. To ensure effective and equitable care for every person, all physicians, regardless of their ethnicity or race, should be trained to be aware of potential cultural barriers to quality health care. The need for increased cultural competence in physicians and practice settings has been widely recognized in published literature and has been incorporated into medi-cal education accreditation standards and in graduate medi-cal education outcomes (23-40). However, the best means for training physicians to be culturally competent continues to
Executive Summary
1 On June 26, 2003, the Executive Council of the Association of American Medical Colleges (AAMC) approved a new definition for “underrepresented minorities”: “those racial and ethnic populations that are underrepresented in the medical profession relative to their numbers in the general population.” Individual medical schools can use this definition to determine population groups underrepresented in their geographic areas (2).2 Rates were computed using the data sources indicated.
SEVENTEENTH REPORT OF COGME 2
be debated (25). More discussion and research are needed to determine the most effective methods of cultural competence training and the desired outcomes for that training.
Promoting diversity among the physician workforce has been the goal of numerous organizations. Among the leaders in this effort are the Health Resources and Services Admin-istration (HRSA), the Association of American Medical Col-leges (AAMC), the Institute of Medicine, the National Medi-cal Association, the National Hispanic Medical Association, and the Sullivan Commission on Diversity in the Healthcare Workforce. The efforts of these and other organizations have called attention to the urgency of diversifying the physician workforce and training physicians to be sensitive and effec-tive in serving persons of any race or ethnicity.
Medical training institutions have also sought to over-come barriers for URMs in medicine and have made strides in areas such as retention. Data for URM medical school ma-triculants beginning their training in 1996 show that 93 per-cent were either still enrolled or had graduated by their sixth year, compared to 92 percent of non-URMs who had gradu-ated within five years (41). Nevertheless, additional strate-gies and policies are needed to strengthen the enrollment and retention of URMs in medical training (42).
The June 2003 Supreme Court ruling determined that race/ethnicity as an admissions criterion can be justified as a compelling State interest, and approaches to admissions have been much discussed (42-52). Data show that, among URM applicants for 2001, 46.0 percent were accepted into medical school compared to 50.6 percent of non-URMs. African Americans had the lowest acceptance rate, 42.8 per-cent, compared to 53.4 percent for Mexican Americans, 60.4 percent for applicants from Mainland Puerto Rico, and 51.0 percent for Native Americans. African Americans also had lower Medical College Admission Test (MCAT) scores than other URM groups (53). Effective strategies for improving acceptance rates of URMs, especially for African American applicants, are needed.
The continued increase in URM populations without a comparable increase in the supply of URM physicians indi-cates three important strategies for ensuring that URM popu-lations have adequate health care: 1) increasing the number of URM students who successfully advance through the el-ementary, secondary, and post-secondary academic pipeline in preparation for entrance into medical school; 2) overcom-ing policy or systemic barriers at the level of medical training institutions, residency programs, licensing boards, specialty certification boards, and practice settings; and 3) providing effective cultural competence training for U.S. physicians to ensure quality health care to people of all cultures.
Summarized below are key findings regarding achieve-ment of the recommendations in COGME’s 1998 report Minorities in Medicine as well as recommendations for con-
tinued progress toward increasing the number of URM phy-sicians and strengthening cultural competence in U.S. physi-cians.
FINDINGS AND RECOMMENDATIONS
Strengthening the Pipeline to Medical School
Findings
1. Numerous K-12, post-secondary, and post-bac-calaureate programs exist to enhance the aca-demic preparation of URMs and to promote op-portunities for pursuing medical careers (54-79). Among these programs are collaborations among medical schools, undergraduate and secondary schools, and community organizations (80-106). Although some of these programs have been successful in helping to prepare URMs academi-cally for medical school, inconsistent evaluation of these programs makes it difficult to compare program outcomes.
2. Lack of persistence in completing high school and failure to enroll in and graduate from col-lege are the greatest barriers to URM entry into medicine. URMs compose 30 percent of the U.S. college-age population, but only 14 percent of U.S. college graduates (3).
3. Data from the National Center for Education Statistics indicate that “family income” is the most influential factor in determining whether a high school senior will be “very well qualified” for college, based on class rank, grade point av-erage (GPA), and scores on standardized tests (3,4,107).
4. Parents’ education and income levels affect aca-demic achievement of children (3,4,107). Dis-proportionate numbers of URM children live in single-parent and low-income households (108), factors contributing to lack of success in early education, which impacts achievement at all oth-er levels.
5. For low-income high school graduates who are academically well prepared, being from a low-in-come family has less impact on college enrollment than whether students take the college entrance examinations and apply to college (4).

SEVENTEENTH REPORT OF COGME 3
6. Although some programs promote children’s in-terest, academic achievement, and career choices in science and health (109-116), a need exists for appropriate organizations to partner with media, advertising and marketing firms, and video and audio production companies for developing and disseminating culturally appropriate messages targeted to minority and disadvantaged youth to encourage academic persistence and achieve-ment and interest in medical careers.
Recommendations
1. Further efforts are needed to increase the num-ber of URM college graduates to enlarge the pool of medical school applicants and URM physi-cians.
2. Intense efforts should focus on retention of URMs in the educational pipeline from elemen-tary school through secondary school, from entry in and graduation from undergraduate school, to entry in and graduation from medical school.
3. Research is needed to understand better the bar-riers to academic achievement for URMs at all educational levels. Such barriers include cul-tural, linguistic, societal, economic, and systemic. Effective interventions should be developed and implemented to address disproportionately high secondary school dropout rates among URMs to increase their enrollment in college.
4. Standards of achievement and outcome measures are needed to determine which K-12, post-sec-ondary, and post-baccalaureate programs should be considered as models for increasing academic achievement of URMs.
5. More resources are needed to facilitate high school guidance counselors to assist URMs in taking entrance exams and applying to college and to place URMs in college preparatory schools and programs.
6. Organizations interested and involved in medical training should partner with media, advertising and marketing firms, and video and audio pro-duction companies to develop and implement ef-fective communication campaigns targeting mi-nority and disadvantaged youth with messages that encourage academic achievement, persis-tence in school, and interest in medicine.
Strengthening Upstream Efforts in Medical Training
Findings
1. The AAMC, the U.S. Department of Education, the Institute of Medicine, and published litera-ture have recommended the use of factors other than test scores and GPAs in medical school ad-missions and residency placement decisions (42-52). However, a lack of evidence exists to indicate which non-quantitative factors are being used and to what extent such factors are being includ-ed in admissions/placement decisions.
2. Among URM medical school applicants for 2001, 46.0 percent were accepted into medical school compared to 50.6 percent of non-URMs. African Americans had the lowest acceptance rate, 42.8 percent, compared to 53.4 percent for Mexican Americans, 60.4 percent for Mainland Puerto Ricans, 51.0 percent for Native Americans, 51.7 percent for whites, 51.1 percent for Asians, and 49.7 percent for applicants from the Common-wealth of Puerto Rico (53).
3. Research suggests that some residency program directors use scores from Step 1 of the United States Medical Licensing Exam (USMLE) to de-termine which applicants to interview for selec-tion (117,118). African American applicants in one study were at least three times less likely to be interviewed (118). Data indicate that URMs usu-ally score lower than non-URMs on the USMLE and other tests (117,119). Use of USMLE scores to screen applicants can create barriers for entry into some residency programs.
4. Medical school debt has been increasing annu-ally, reaching an average of $103,855 for U.S. graduates of allopathic medical schools in 2002 (120).
5. Mean educational debt is generally higher for URMs than non-URMs in medical school, al-though mean debt is almost equal for URMs and non-URMs graduating from private medical schools (121,122).
6. Among new medical school matriculants in 2001, twice as many URMs as non-URMs (30 percent vs. 14 percent) indicated that scholarships would be used to finance their education. Non-URMs were more likely than URMs (17 percent versus 6

SEVENTEENTH REPORT OF COGME 4
percent) to report that family members or spous-es would contribute financially to their medical education (123).
7. Among 2001 medical school graduates, URMs were more likely to receive scholarship assistance and more scholarship dollars than non-URMs. Three quarters of URM medical school gradu-ates in 2001 received scholarship assistance com-pared to fewer than half of non-URMs. On av-erage, URM medical school graduates received $35,000 in scholarships compared to $25,780 for non-URMs (124).
8. Twenty-five percent of URM medical school stu-dents matriculate in medical school for more than 4 years, compared to 10 percent of non-URMs (125). The greater proportion of URMs than non-URMs who spend more years in medical school indicates the likelihood of higher mean debt for URMs.
9. More than two thirds of 2001 URM and non-URM graduates of allopathic medical schools indicated that debt had no influence on their specialty se-lection (126). Osteopathic medical students who were seniors in 2001-2002 also reported that debt level had only a “minor influence” on specialty choice (127).
10. AAMC Graduate Questionnaire data indicate that for 2001 allopathic medical school gradu-ates, higher proportions of URMs than non-URMs planned to enter generalist and surgical specialties, but higher proportions of non-URMs than URMs planned to enter medical specialties. About the same proportions of both groups an-ticipated entry into support specialties (128).
11. Nearly half of URM medical school graduates in 2001 compared to 19 percent of non-URM grad-uates planned to practice in underserved areas (128).
12. Recruiting and retaining minority faculty physi-
cians continue to be important goals, especially as evidence indicates that minority faculty are more dissatisfied with their careers than non-mi-nority faculty are (129).
13. Seven percent of allopathic medical school fac-ulties were reported as URMs for 2002, an in-crease of 33 percent since 1998. However, these
data are inconclusive because race/ethnicity for 4.1 percent of 2002 faculty and for 6.1 percent of 1998 faculty was reported as “Other/Unknown”3 (130,131).
14. In 2001, 3.5 percent of osteopathic medical school faculties were reported as URMs, compared to 3.0 percent in 1998. As for allopathic faculty, race was reported as “Other/Unknown” for large pro-portions of osteopathic medical school faculty: 4.6 percent for 2001-2002 and 5.4 percent for 1998-1999 (132).
15. Few programs have been reported that support minority medical school students interested in pursuing an academic career. One such program is the Fellowship Program in Academic Medi-cine, funded by Bristol-Meyers Squibb (133).
16. Six Centers of Excellence in Women’s Health offer support to help improve minority women faculty’s career advancement opportunities. The centers recommend evaluation of progress by establishing target indicators, institutional sup-port for advancement, retention strategies, and increased research of issues related to advance-ment of minority faculty (134).
Recommendations
1. Desirable outcome measures that include non-quantitative considerations for medical school students should be established and used in ad-missions decisions.
2. Residency program directors should also consid-er qualitative as well as quantitative factors when deciding which residency candidates to interview and select.
3. Qualitative criteria used in medical school admis-sions and residency placement decisions should be documented and assessed to determine which ones are most predictive of successful outcomes.
4. More research is needed to assess the impact of medical school debt on URMs’ decision to apply to, matriculate into, and graduate from medical school.
5. Assessment of whether increased scholarship as-sistance rather than loans might encourage more URMs to pursue medicine as a career would be helpful.
3 “Unknown” indicates that race/ethnicity was not reported.

SEVENTEENTH REPORT OF COGME 5
6. More research is needed to evaluate obstacles or motivations for minority entry into primary care or specialty residency programs. Medical schools should track medical students’ interest in specialties at entry into medical school, at the be-ginning of the clinical year, and at graduation to assess factors that influence choice of specialties for both URMs and non-URMs.
7. Medical schools should develop and implement plans for recruiting and retaining minority fac-ulty physicians, including assessing and enhanc-ing the institutional climate for URM faculty.
8. Minority medical students, residents, and phy-sicians who aspire to serve as faculty should be identified and mentored early in their careers.
9. Interventions should be developed that encour-age physicians to practice in underserved areas for periods that extend beyond the time commit-ment of programs requiring service in exchange for funding opportunities.
10. Research is needed to determine optimal condi-tions and exposure time required for medical students to develop and maintain an interest in serving in underserved communities.
11. Strategies are needed to assess and reinforce the commitment of academic medical centers to providing care to underserved populations. This commitment should be integral to the academic environment and mission and should be fostered by means other than funding incentives.
Ensuring Cultural Competence in Medicine
Findings
1. The need for cultural competence training in medical education is widely recognized. This training is increasingly available in various ven-ues and methods of educational delivery (23-40). Most medical schools report that they have cul-tural competence instruction incorporated into required and elective courses, but few have re-quired courses specifically dedicated to cultural competence (135).
2. Much uncertainty exists regarding the best way to teach cultural competence to medical students and residents, and problems with some cur-rent instructional methods have been reported (25,27,28,33,136-142).
3. Resources from both public and private agen-cies have been devoted to developing curricula and programs to enhance cultural competence in medical school and residency training as well as in practices. Publications, Web sites, audio and sat-ellite broadcasts, and training modules are avail-able to help educate practitioners about becom-ing more culturally competent (24,26,30,31,33-37,143-159).
4. Evaluation is considered critical to any program, yet little information exists regarding cultural competence evaluation outcomes (33,141).
5. Accreditation standards for both undergradu-ate and graduate medical education include cul-tural competency training (38-40). The American Board of Medical Specialties and some special-ties are also committed to cultural competency standards (39,160,161).
6. Although medical licensing boards do not test for cultural competence, Step 3 of the USMLE uses diverse patients as part of the clinical assessment so that examinees must respond to clinical situa-tions that include cultural contexts (162).
7. Continuing medical education (CME) does not require education in cultural competency, but a few medical schools offer CME training in cul-tural competence (163-165).
8. At least three States have pending legislation that will mandate that the medical schools in each State require at least one course in cultural com-petency as part of their curricula. Physicians in those States must also complete cultural compe-tency training for relicensing. Another State will provide for local and State medical societies to offer a voluntary cultural competency program for physicians (166-169).
9. Quality standards, including standards for cul-turally competent care, have been developed for use by health plans contracting to provide health care services for Medicare and Medicaid patients (170-173). The National Committee for Qual-ity Assurance, using the Health Plan Employer Data and Information Set (HEDIS®) measures, requires managed care organizations to address members’ cultural needs, but does not require assessment of providers’ cultural competence (174).

SEVENTEENTH REPORT OF COGME 6
10. Although National standards exist, research sug-gests that State contract language with managed care organizations is vague, making standards difficult to enforce (175-176).
11. Although health plans generally do not collect data on race and ethnicity of patients, research indicates that data acquired from other sources can provide a means for health care organiza-tions to evaluate quality of care for patients and thus determine disparities in health care of mi-nority patients (177-178).
Recommendations
1. The varied definitions of cultural competence and approaches to cultural competency instruc-tion indicate a need for further research and discussion to determine key objectives, desired
outcomes and competencies, and ways to assess progress toward those outcomes in medical edu-cation. A National conference should be held at which these issues can be more fully addressed.
2. Data are needed to determine whether cultural competency training enables medical students, residents, and physicians to become more cultur-ally competent and whether that training affects patient outcomes.
3. The Federation of State Medical Boards should
encourage individual State licensing boards to institute voluntary cultural competency training for physicians.

SEVENTEENTH REPORT OF COGME 7
The Council on Graduate Medical Education (COGME), established by Congress in 1986, advises the Secretary of the United States (U.S.) Department of Health and Human Ser-vices (DHHS), the Senate Committee on Health, Education, Labor and Pensions, and the House of Representatives Com-mittee on Commerce. To ensure health care delivery to the Nation, the Council makes recommendations regarding the supply and distribution of physicians, training issues, and ap-propriate efforts of public and private sectors, including med-ical schools, teaching hospitals, and accrediting bodies. The diversity of the physician workforce, the training of minority physicians, and the contributions made by minority physi-cians in providing health care to medically underserved areas are all-important parts of COGME’s mission.
Since its inception, COGME has expressed concern that minorities are greatly underrepresented in medicine and has made recommendations to address the need for a physician workforce that reflects the Nation’s diversity. In 1998, COG-ME issued its Twelfth Report, which made 21 recommenda-tions for increasing underrepresented minorities (URMs) in medicine and for enhancing the cultural competence of the Nation’s physician workforce. “Underrepresented minori-ties” refers to African Americans, Native Americans, Alaska Natives, Mexican Americans, and Mainland Puerto Ricans—minority groups represented in lower proportions in the health professions than in the U.S. population as a whole (1).
Despite efforts during the past 3 decades to increase minority participation in medicine, some racial and ethnic groups remain underrepresented in medical education and in medicine, from medical school applicants and faculty members to practitioners in some specialties and managed care practices. COGME continues to dedicate its efforts to increasing URMs in medicine both to enhance equity among persons of all cultures and to address one of the Nation’s health priorities: reducing health disparities among racial and ethnic groups.
Healthy People 2010, which summarizes the health ob-jectives for the Nation, has targeted the elimination of health disparities as one of two overarching National health goals (7). Congress, too, has recently introduced the Healthcare Equality and Accountability Act to improve the health care of minorities. This bill establishes a Center for Cultural and Linguistic Competence in Healthcare within DHHS, creates a National Working Group on Workforce Diversity to review and recommend workforce initiatives, and requires health professions schools that receive Federal funding to submit information for a National database on race and ethnicity in the health professions (179).
Responding to the need to improve the health status of minorities, this report reviews the literature since the 1998 COGME recommendations for increasing the number of URM physicians and for promoting cultural competence in health care providers. It assesses progress made through 2003, notes key findings, and recommends ways to support the pipeline to medical school, to strengthen upstream efforts in medical training, and to ensure cultural competence in medicine and medical education.
IMPLICATIONS OF CHANGING DEMOGRAPHICS IN THE U.S.
Racial and ethnic minority populations in the U.S. are growing more rapidly than white populations. U.S. Census Bureau estimates for 2000 indicate that African Americans, American Indians and Alaska Natives, and Hispanics cur-rently represent a quarter of the U.S. population, and Asians and Pacific Islanders compose an additional 4 percent. Whites make up 69 percent of the Nation’s population (see Table 1) (180). However, Census Bureau projections indicate that some racial and ethnic minority populations will steadily outpace whites in growth (see Table 2).
By 2010, Hispanics, African Americans, and American Indians and Alaska Natives are expected to represent 28 per-cent of the U.S. population, and Asian Americans and Pa-cific Islanders will bring that proportion up to almost a third of the total U.S. population. By 2050, non-Hispanic whites will comprise just over half of the Nation’s populace, and Hispanics will represent almost a quarter of the population. Every year from now until 2050, the Hispanic ethnic group is expected to add the largest number of people to the Nation’s population of all racial or ethnic groups. African Americans are also expected to increase, but more gradually, to just over 13 percent of the population. Projections indicate that Asians and Pacific Islanders will more than double to almost 9 per-cent. Native Americans and Alaska Natives are expected to remain about the same at just under 1 percent of the U.S. population (22).1
The expected increase in minority populations has sev-eral implications for the health of the Nation. Estimates for 2000 indicate that over a third of Hispanics are foreign born, suggesting limited language proficiency for a large por-tion of individuals of Hispanic ethnicity. Similarly, 62 per-cent of Asian Americans and Pacific Islanders were foreign born in 2000, indicating another large population group for whom English is a second language (see Table 2) (22). In communicating with health care providers, these individuals
Introduction
1 These expected population trends may be underestimated. The 2000 census shows retrospectively that earlier estimates for 2000 have been underestimated by over 6,000,000. New projections based on 2000 census estimates are currently unavailable.

SEVENTEENTH REPORT OF COGME 8
TABLE 1Population Estimates for Hispanic and Non-Hispanic
Racial/Ethnic Groups and Percentages of Total U.S. Population, 2000 (180)
Population Groups Number Percentage of TotalTotal 281,421,906 100.0Non-Hispanic White 194,552,774 69.1Non-Hispanic Asian/Pacific Islander 10,476,678 3.7Non-Hispanic African American 33,947,837 12.1Hispanic 35,305,818 12.5Non-Hispanic Native American/Alaska Native 2,068,883 0.7Non-Hispanic Other 467,770 0.2Non-Hispanic Multiple Race 4,602,146 1.6
TABLE 2Population Projections for Hispanic and
Non-Hispanic Racial/Ethnic Groups and Percentages of Total Population, by Decade*(U.S. Total in Thousands) (22)
Population Group 2000 2010 2020 2030 2040 2050Total 275,306 299,861 324,926 351,070 377,349 403,686Non-Hispanic White 71.4 67.3 63.8 60.1 56.3 52.8Non-Hispanic Asian/Pacific Islander 3.9 4.8 5.7 6.7 7.8 8.9 Native Born 37.9 40.5 43.8 46.5 49.3 52.5 Foreign Born 62.1 59.5 56.2 53.5 50.7 47.5Non-Hispanic African American 12.2 12.5 12.8 13.0 13.1 13.2Hispanic 11.8 14.6 17.0 19.4 21.9 24.3 Native Born 64.5 66.5 70.5 73.9 76.9 80.0 Foreign Born 35.5 33.5 29.5 26.1 23.1 20.0Non-Hispanic Native American/Alaska Native 0.7 0.8 0.8 0.8 0.8 0.8
*Projections for percent calculations based on 1990 U.S. Census estimates.

SEVENTEENTH REPORT OF COGME 9
experience language barriers affecting whether they will seek care, be properly diagnosed, receive appropriate treatment, and be satisfied with their care (8,9,15-17,181,182).
As racial and ethnic minorities increase, a correspond-ing need exists for increased numbers of minority physicians from those groups underrepresented in medicine. Some mi-norities report more satisfaction with physicians of their own race or with those who speak their language, and they select a physician of their own race or ethnicity when given a choice (8,10,16). Further, differences in health care may result when patients and physicians have different races or ethnicities (11-15).
Despite the growing need for more minority physicians, for the foreseeable future, physicians from non-URM groups will provide care to substantial numbers of patients who dif-fer from them racially or ethnically.
HEALTH DISPARITIES
To help reduce health disparities among racial and eth-nic groups, more URM physicians are needed. An increase in racially and ethnically concordant patient-physician rela-tionships can lead to increased health care and better health outcomes for underserved and vulnerable populations (18).
The National Center for Health Statistics (NCHS) re-ports the following trends regarding health disparities among racial and ethnic groups:
• The gap in the life expectancy between African American and white populations has been narrow-ing, but remains. In 1990, life expectancy at birth was 7 years longer for whites than for African Americans. By 2000, this difference had narrowed to 5.7 years. Preliminary data suggest that the gap has further narrowed to 5.5 years for 2001.
• In 2001, mortality was 31 percent higher for African Americans than for white Americans. This gap rep-resents a decrease from 37 percent in 1990.
• Age-adjusted death rates for 2001 were greater for African Americans than for whites by 40 percent for stroke, 29 percent for heart disease, 25 percent for cancer, and nearly 800 percent for HIV disease.
• Despite similar mammography screening rates for white and African American women, breast cancer mortality for African Americans has risen far above that for whites. In 2000, breast cancer mortality for African American women was 31 percent higher than for whites compared to 15 percent higher in 1990. Preliminary data for 2001 indicate that this gap has widened to 34 percent.
• Rates of death from homicides among both African American and Hispanic males ages 15-24 decreased by about half from the early 1990s. However, these rates remain substantially higher than rates for young non-Hispanic white males.
• Although death rates from HIV disease have de-clined sharply since 1995 for Hispanic and African American males ages 25-44, in 2000, HIV was still the second leading cause of death for Hispanic males in this age group and the third leading cause for Af-rican American males in this age group. HIV death rates remained much higher for African American and Hispanic males than for non-Hispanic white males in this age group.
• Rates of death from motor vehicle-related injury and from suicide for Native American males ages 15-24 were about 45 percent higher than rates for white males in this age group. Despite these dispari-ties, death rates for Native Americans are known to be underestimated, so this difference may be even greater.
• Mortality for Asian males was 40 percent lower than for white males through the 1990s. In 2000, age-adjusted rates for cancer and heart disease for Asian males were 38-41 percent lower than rates for white males. Death rates for the Asian population are known to be underestimated, so this gap may be less than reported.
• Infant mortality rates have declined for all racial and ethnic groups, but disparities remain. In 2000, the highest infant mortality rate was for infants of non-Hispanic African American mothers (13.6 deaths per 1,000 live births), and the lowest was for moth-ers of Chinese origin (3.5 per 1,000 live births).
• Infant mortality increases as the mother’s educa-tion decreases. In 2000, the infant mortality rate for mothers having fewer than 12 years of schooling was 58 percent higher than that for mothers who had 13 or more years of education.
• Early prenatal care (the first trimester of pregnancy) increased among all racial and ethnic groups from 1990-2001 but varied from 69 percent for Native American mothers to 90-92 percent for mothers of Japanese and Cuban origin.
• In 2001, Hispanics and Native Americans under age 65 were more likely to have no health insurance than those in other racial and ethnic groups. Persons of Mexican origin were most likely to lack health in-

SEVENTEENTH REPORT OF COGME 10
surance (39 percent), whereas non-Hispanic whites were least likely to lack insurance (12 percent).
• Among children under age 18, Hispanic children were more likely to lack a usual source of health care than non-Hispanic African American children or non-Hispanic white children (14 percent com-pared to 7 percent and 4 percent, respectively).
• Adults ages 18-64 and living below poverty level were over twice as likely to have no usual source of health care than those living above the poverty level (27 percent versus 12 percent). Of those living in poverty, Hispanic adults were twice as likely to have no usual source of health care as non-Hispanic whites or African Americans (44 percent versus 22 percent and 21 percent, respectively) (183).
INFLUENCES ON HEALTH DISPARITIES
The reasons underlying health disparities among ra-cial and ethnic groups are complex and range from access to health care to the ease with which physicians treating minority patients can admit their patients into hospitals or refer patients to specialists or for tests as needed. However, as Healthy People 2010 notes, education and income levels affect health and influence health disparities. Education and income are closely associated and often serve as a proxy for one another because education levels closely parallel income levels (7).
Death rates vary by education levels. For 2000, the age-adjusted death rate for 25-64 year olds having fewer than 12 years of education was nearly three times that for persons in the same age group having 13 or more years of education (183). More years of education add more years of life. The
average education level in the U.S. population has been in-creasing over the past decades and appears to be contributing to slight increases in life expectancy.
Further, as Healthy People 2010 notes, “For women, the amount of education achieved is a key determinant of the welfare and survival of their children. Higher levels of education also may increase the likelihood of obtaining or understanding health-related information needed to develop health-promoting behaviors and beliefs in prevention” (7).
In addition, those in higher-income brackets experience better health than low-income persons. For example, 65-year-old men having the highest incomes can expect to live 3 years longer than those with the lowest incomes (7). Accord-ing to the U.S. Census Bureau, in 2002, 34.6 million or 12.1 percent of the U.S. population lived in poverty, an increase of 11.7 percent from the previous year. More than a third of those living in poverty (12.1 million) were children under age 18 (184).
Education and income levels differ by race and ethnicity as well as by type of household. Table 3 shows the percentage of families living below the poverty level. Households with married couples have the lowest proportion of poverty for all racial and ethnic groups, and female households (no hus-band present) have the highest proportions of poverty. More families with children under age 18 live in poverty than those families without children under age 18. Among married cou-ple households, Hispanics experience higher proportions of poverty than other groups: 17.7 percent of Hispanic house-holds with children under age 18 live in poverty, compared to 8.5 percent for African Americans and 4.1 percent for whites. Of female households having children under age 18 present, similar proportions for both Hispanic and African Americans live below the poverty level: 41.4 percent and 41.3 percent, respectively, compared to 26.2 percent for whites and 21.2
TABLE 3Percentages of Families Having Children Under Age 18 Living Below Poverty
Level, by Race/Ethnicity and Family Type, 2002* (108)
Race/Ethnicity and Presence of Children
Under Age 18
Percentage of All Families Below Poverty Level
Percentage of Married-Couple Families Below Poverty Level
Percentage of Male Households (no wife present) Below Poverty
Level
Percentage of Female Households
(no husband present) Below Poverty Level
Non-Hispanic White 8.5 4.1 10.4 26.2African American 27.3 8.5 26.5 41.3Asian 9.2 7.0 19.0 21.2Hispanic 24.1 17.7 23.6 41.4
*Percentages are based on total number of families in each group as of March 2003. Data for Native Americans are not available.

SEVENTEENTH REPORT OF COGME 11
percent for Asians. Male households (no wife present) having children under age 18 experience less poverty than female households but more than married-couple households: 26.5 percent for African Americans, 23.6 percent for Hispanics, 19.0 percent for Asians, and 10.4 percent for whites (108).
WHO IS A URM IN MEDICINE?
On June 26, 2003, the Executive Council of the Associa-tion of American Medical Colleges (AAMC) approved a new definition for “underrepresented minorities”: “‘Underrepre-sented in medicine’ means those racial and ethnic populations that are underrepresented in the medical profession relative to their numbers in the general population.” Individual medical schools can use this definition to determine which population groups are underrepresented in their geographic areas. The AAMC will collect data by population groups based on the racial and ethnic categories used by the U.S. Census Bureau (2). Before the new definition, the term “underrepresented minority” referred to African Americans, Native Americans (American Indians, Alaska Natives, and Native Hawaiians), Mexican Americans, and Mainland Puerto Ricans. The re-search reported in this document refers to the racial and eth-nic groups included in the former definition.
TRENDS IN MINORITY PARTICIPATION IN MEDICINE
According to U.S. Census Bureau estimates of U.S. phy-sicians for 2000, 4.4 percent of physicians are non-Hispanic African Americans, 5.1 percent are Hispanic/Latinos, and .002 percent are non-Hispanic Native Americans or Alaska Natives. Thus, these estimates indicate that fewer than 10 percent of U.S. physicians are URMs. Non-Hispanic whites compose 73.8 percent of physicians, and non-Hispanic Asians, Native Hawaiians, and Pacific Islanders make up an-other 14.9 percent of U.S. physicians (see Table 4) (185).
Rates of physicians per 1,000 population in each group reveal that non-Hispanic whites are the most represented population group in medicine: 2.66 physicians per 1,000 population. Hispanic/Latino physicians are available at the rate of just over one per 1,000 Hispanic/Latinos. Non-His-panic African American physicians are available at a rate of fewer than one physician per 1,000 persons in that group. The rate of non-Hispanic Native American or Alaska Native physicians per 1,000 persons in these population groups is .57 (see Table 4) (185).
TABLE 4U.S. Census Estimates of U.S. Physicians, by Race/Ethnicity and Gender and Rates per 1,000 Population in Each Group, 2000 (185)
Population Group Male Female Total
Percentage of Total U.S. Physicians
Rate per 1,000
Population*Total U.S. Physicians 513,923 186,923 700,846 100 2.49Total Non-Hispanic 488,094 177,101 665,195 94.9 2.70Non-Hispanic White 392,732 124,306 517,038 73.8 2.66Non-Hispanic African American 18,172 12,741 30,913 4.4 0.91Non-Hispanic American Indian/Alaska Native 765 406 1,171 .002 0.57Non-Hispanic Asian/ Native Hawaiian/Pacific Islander 68,511 35,891 104,159 14.9 9.94Non-Hispanic Other 848 412 1,260 .002 2.69Non-Hispanic Multiple Race 7,066 3,345 10,411 1.5 2.26Hispanic/Latino 25,829 9,822 35,651 5.1 1.01
*Rates are based on U.S. Census estimates for Hispanic/Latinos and Non-Hispanic/Latinos by race.
SEVENTEENTH REPORT OF COGME 12
According to the AAMC, after a 6-year decline in appli-cations to U.S. medical schools, applicants for the 2003-2004 academic year increased by 3.4 percent to a total of almost 35,000. Included in this increase was a 5 percent increase in African American applicants for a total of 2,736, including a 10 percent increase in female African American applicants for a total of 1,904. Hispanic applicants also increased by less than 2 percent to 2,483. Despite these gains in number of applicants, the number of African Americans and Hispanics who matriculated into medical school decreased. A total of 1,056 African Americans entered medical school for a 6 per-cent decline, and 1,089 Hispanics matriculated, for a decline of almost 4 percent (186).
The number of medical school applicants peaked in 1996 at about 47,000, but since then, that number has decreased by as many as 4,000 applicants each year. The lowest number of applications received was for the 2002-2003 academic year, when 33,625 prospective students applied to medical school. The decline in male applicants appears to have leveled off for 2003-2004, when 17,113 males applied, a slight increase over the 17,069 male applicants for 2002-2003 (187).
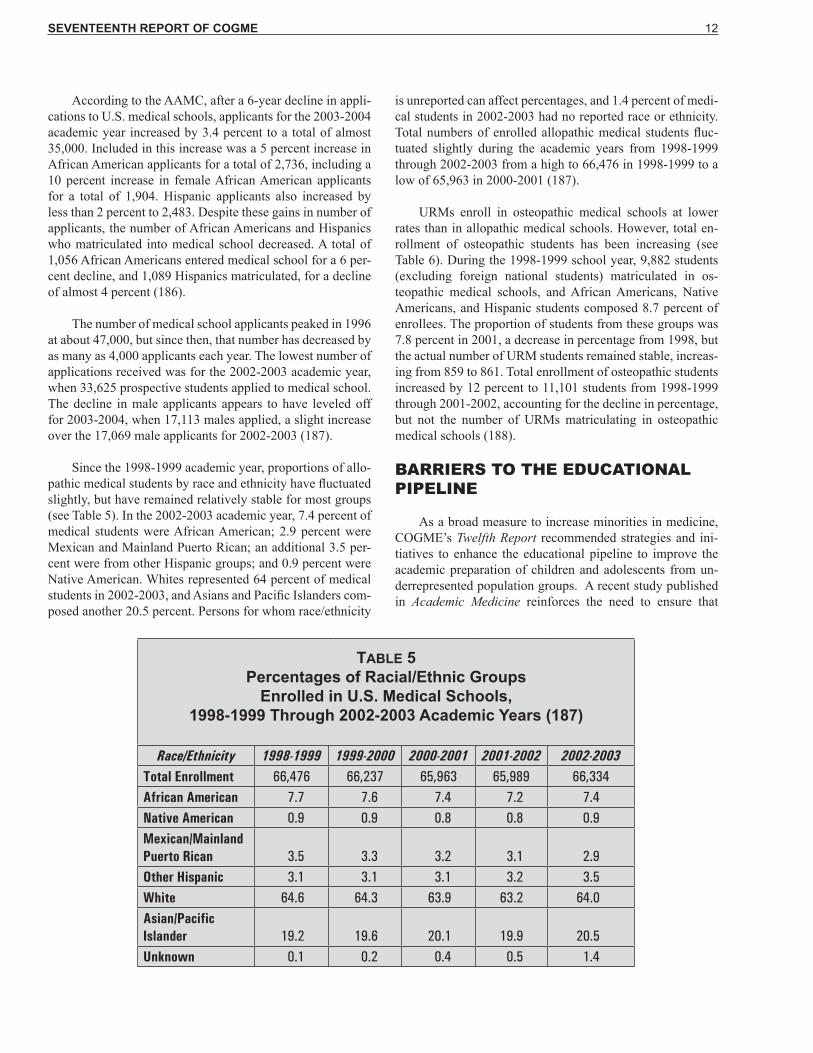
Since the 1998-1999 academic year, proportions of allo-pathic medical students by race and ethnicity have fluctuated slightly, but have remained relatively stable for most groups (see Table 5). In the 2002-2003 academic year, 7.4 percent of medical students were African American; 2.9 percent were Mexican and Mainland Puerto Rican; an additional 3.5 per-cent were from other Hispanic groups; and 0.9 percent were Native American. Whites represented 64 percent of medical students in 2002-2003, and Asians and Pacific Islanders com-posed another 20.5 percent. Persons for whom race/ethnicity
is unreported can affect percentages, and 1.4 percent of medi-cal students in 2002-2003 had no reported race or ethnicity. Total numbers of enrolled allopathic medical students fluc-tuated slightly during the academic years from 1998-1999 through 2002-2003 from a high to 66,476 in 1998-1999 to a low of 65,963 in 2000-2001 (187).
URMs enroll in osteopathic medical schools at lower rates than in allopathic medical schools. However, total en-rollment of osteopathic students has been increasing (see Table 6). During the 1998-1999 school year, 9,882 students (excluding foreign national students) matriculated in os-teopathic medical schools, and African Americans, Native Americans, and Hispanic students composed 8.7 percent of enrollees. The proportion of students from these groups was 7.8 percent in 2001, a decrease in percentage from 1998, but the actual number of URM students remained stable, increas-ing from 859 to 861. Total enrollment of osteopathic students increased by 12 percent to 11,101 students from 1998-1999 through 2001-2002, accounting for the decline in percentage, but not the number of URMs matriculating in osteopathic medical schools (188).
BARRIERS TO THE EDUCATIONAL PIPELINE
As a broad measure to increase minorities in medicine, COGME’s Twelfth Report recommended strategies and ini-tiatives to enhance the educational pipeline to improve the academic preparation of children and adolescents from un-derrepresented population groups. A recent study published in Academic Medicine reinforces the need to ensure that
TABLE 5Percentages of Racial/Ethnic Groups
Enrolled in U.S. Medical Schools,1998-1999 Through 2002-2003 Academic Years (187)
Race/Ethnicity 1998-1999 1999-2000 2000-2001 2001-2002 2002-2003Total Enrollment 66,476 66,237 65,963 65,989 66,334African American 7.7 7.6 7.4 7.2 7.4Native American 0.9 0.9 0.8 0.8 0.9Mexican/Mainland Puerto Rican
3.5 3.3 3.2 3.1 2.9
Other Hispanic 3.1 3.1 3.1 3.2 3.5White 64.6 64.3 63.9 63.2 64.0Asian/Pacific Islander 19.2 19.6 20.1 19.9 20.5Unknown 0.1 0.2 0.4 0.5 1.4

SEVENTEENTH REPORT OF COGME 13
URM youth can overcome educational barriers and succeed academically. Data show that if URMs stay in the academic pipeline, proportions of URM college graduates who apply to medical school are similar to or even higher than propor-tions of white college graduates applying to medical school (3). URM college graduates in 2000-2001 applied to medical school at a rate of 28 per 1,000 graduates compared to a rate of 25 per 1,000 white college graduates applying to medical school that year (4,5).2 Increased efforts are needed to ensure that children from URM groups can succeed in elementary and high school so that they enroll in and graduate from col-lege. Overcoming these early hurdles will facilitate increased application and admission to medical school.
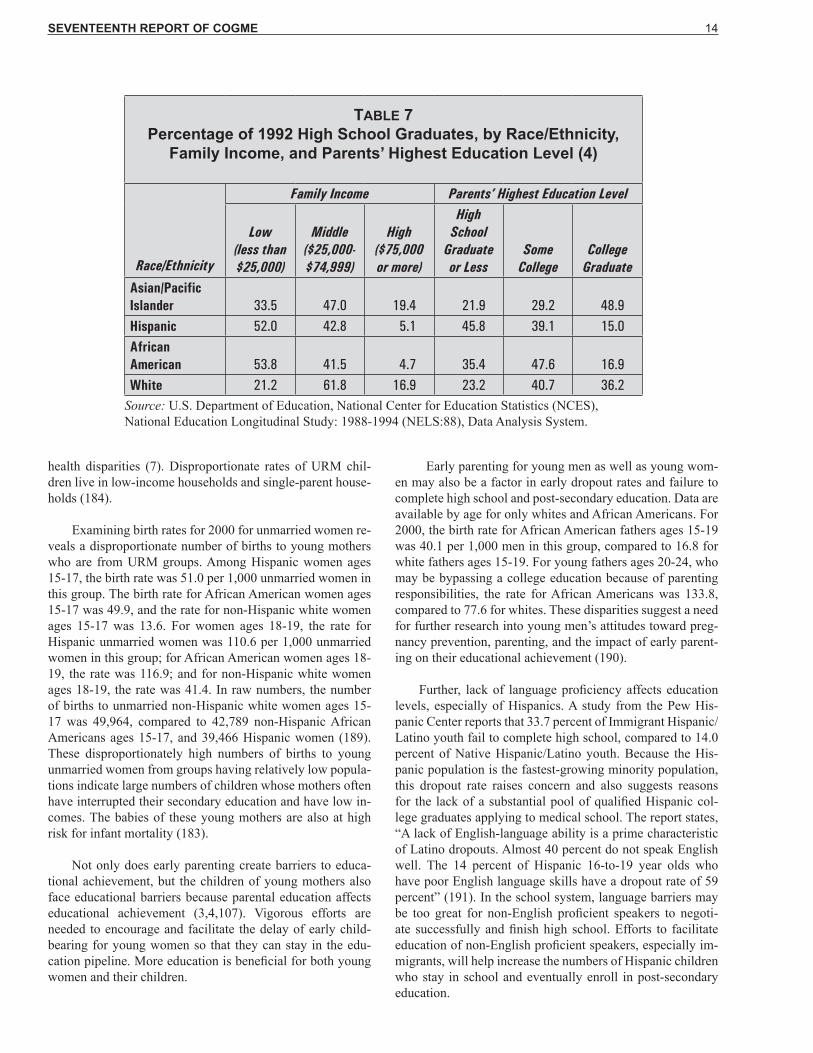
Parental education and parental income affect the aca-demic achievement of students (3,4,107). According to the U.S. Department of Education, over half of both Hispanic and non-Hispanic African American high school graduates in 1992 were from families having incomes under $25,000, compared to a third of Asian high school graduates and 21 percent of white high school graduates (see Table 7). Also, for 1992 high school graduates, 15.0 percent of Hispanics and 16.9 percent of African Americans had parents who had graduated from college, compared to 36.2 percent of whites and 48.9 percent of Asians (see Table 7). Data also show that high school graduates who are African American or Hispanic or who come from low-income families are less likely to be academically well prepared for college. Even among those who are academically prepared, Hispanic and low-income students are less likely to take entrance exams and apply for admission to a 4-year college than other groups (4).
Parents’ income and education are also associated with college enrollment. Data from the U.S. Department of Educa-tion show that 49 percent of 1996 high school graduates from low-income families enrolled in either 2- or 4-year colleges in the same year after graduation, compared to 63 percent of students from middle-income families and 78 percent of stu-dents from high-income families. These data also indicate that 89 percent of 1996 high school graduates whose parents had completed at least a bachelor’s degree were enrolled in either a 2- or 4-year college in the academic year after completing high school, compared to 45 percent of high school graduates whose parents had not completed high school (107).
However, for high school graduates who are academi-cally well prepared, being from a low-income family does not affect college enrollment as much as whether or not low-income students take college entrance examinations and apply to college. One study notes, “. . . if low-income stu-dents have an academic record and aptitude test scores which demonstrate even the minimal qualifications for admission to a 4-year institution, if they take a college entrance exami-nation, and if they submit an application for admission, the majority of low-income students enroll in post-secondary education. . . .” Over 83 percent of academically prepared low-income students who took the college entrance exams and submitted a college application enrolled in a 4-year col-lege or university (4).
In addition to affecting academic achievement, as Healthy People 2010 notes, low education and income levels are associated with poor health outcomes that contribute to
TABLE 6Percentages of Racial/Ethnic Groups Enrolled in
U.S. Osteopathic Medical Schools, 1998-1999 Through 2001-2002 Academic Years (188)
Race/Ethnicity 1998-1999 1999-2000 2000-2001 2001-2002Total Enrollment 9,882 10,388 10,817 11,101African American 4.2 3.8 3.7 3.7Native American 0.7 0.6 0.7 0.6Hispanic* 3.7 3.6 3.7 3.7Non-Hispanic White 76.2 75.6 73.4 72.6Asian/Pacific Islander 14.2 14.8 16.0 16.4Other/Unknown 1.0 1.6 2.7 3.25
*Hispanic includes all groups reporting Hispanic origin.
2Rates were computed using the data sources indicated.
SEVENTEENTH REPORT OF COGME 14
health disparities (7). Disproportionate rates of URM chil-dren live in low-income households and single-parent house-holds (184).
Examining birth rates for 2000 for unmarried women re-veals a disproportionate number of births to young mothers who are from URM groups. Among Hispanic women ages 15-17, the birth rate was 51.0 per 1,000 unmarried women in this group. The birth rate for African American women ages 15-17 was 49.9, and the rate for non-Hispanic white women ages 15-17 was 13.6. For women ages 18-19, the rate for Hispanic unmarried women was 110.6 per 1,000 unmarried women in this group; for African American women ages 18-19, the rate was 116.9; and for non-Hispanic white women ages 18-19, the rate was 41.4. In raw numbers, the number of births to unmarried non-Hispanic white women ages 15-17 was 49,964, compared to 42,789 non-Hispanic African Americans ages 15-17, and 39,466 Hispanic women (189). These disproportionately high numbers of births to young unmarried women from groups having relatively low popula-tions indicate large numbers of children whose mothers often have interrupted their secondary education and have low in-comes. The babies of these young mothers are also at high risk for infant mortality (183).
Not only does early parenting create barriers to educa-tional achievement, but the children of young mothers also face educational barriers because parental education affects educational achievement (3,4,107). Vigorous efforts are needed to encourage and facilitate the delay of early child-bearing for young women so that they can stay in the edu-cation pipeline. More education is beneficial for both young women and their children.
Early parenting for young men as well as young wom-en may also be a factor in early dropout rates and failure to complete high school and post-secondary education. Data are available by age for only whites and African Americans. For 2000, the birth rate for African American fathers ages 15-19 was 40.1 per 1,000 men in this group, compared to 16.8 for white fathers ages 15-19. For young fathers ages 20-24, who may be bypassing a college education because of parenting responsibilities, the rate for African Americans was 133.8, compared to 77.6 for whites. These disparities suggest a need for further research into young men’s attitudes toward preg-nancy prevention, parenting, and the impact of early parent-ing on their educational achievement (190).
Further, lack of language proficiency affects education levels, especially of Hispanics. A study from the Pew His-panic Center reports that 33.7 percent of Immigrant Hispanic/Latino youth fail to complete high school, compared to 14.0 percent of Native Hispanic/Latino youth. Because the His-panic population is the fastest-growing minority population, this dropout rate raises concern and also suggests reasons for the lack of a substantial pool of qualified Hispanic col-lege graduates applying to medical school. The report states, “A lack of English-language ability is a prime characteristic of Latino dropouts. Almost 40 percent do not speak English well. The 14 percent of Hispanic 16-to-19 year olds who have poor English language skills have a dropout rate of 59 percent” (191). In the school system, language barriers may be too great for non-English proficient speakers to negoti-ate successfully and finish high school. Efforts to facilitate education of non-English proficient speakers, especially im-migrants, will help increase the numbers of Hispanic children who stay in school and eventually enroll in post-secondary education.
TABLE 7Percentage of 1992 High School Graduates, by Race/Ethnicity,
Family Income, and Parents’ Highest Education Level (4)
Race/Ethnicity
Family Income Parents’ Highest Education Level
Low(less than $25,000)
Middle ($25,000-$74,999)
High ($75,000 or more)
High School
Graduate or Less
Some College
College Graduate
Asian/Pacific Islander 33.5 47.0 19.4 21.9 29.2 48.9Hispanic 52.0 42.8 5.1 45.8 39.1 15.0African American 53.8 41.5 4.7 35.4 47.6 16.9White 21.2 61.8 16.9 23.2 40.7 36.2
Source: U.S. Department of Education, National Center for Education Statistics (NCES), National Education Longitudinal Study: 1988-1994 (NELS:88), Data Analysis System.

SEVENTEENTH REPORT OF COGME 15
Addressing obstacles to education for URM groups is requisite to increase the proportions of these groups that en-ter medicine. Lack of reading skills and low parental income and education levels influence the academic success of young children (3,4,107). Ensuring that children read well at an ear-ly age can make a positive difference in their later academic success. Encouraging and facilitating completion of high school for adolescents should be a National priority. Ways to reduce barriers for high school graduates to enter and gradu-ate from college, including financial constraints, also need to be addressed. Factors that create barriers at any of these edu-cational levels deserve further attention so that obstacles to and within the educational pipeline can be removed. Through increased education, more qualified URMs will be better pre-pared to apply to and matriculate in medical school. More education among URMs should also facilitate a reduction in health disparities as well as increased life expectancy (7).
IMPLICATIONS OF CULTURAL COMPETENCE
The rapidly changing demographic composition of the U.S. population and the continued underrepresentation of some ethnic and racial groups in medicine compel an ex-amination of the Nation’s future physicians’ competencies. Physicians need to be able to communicate with patients ef-fectively and to overcome any barriers to quality health care that may result from cultural differences between physicians and patients. It is imperative that physicians be aware of how their own background and cultural and economic experiences have influenced their understanding of patients’ needs. When physicians and patients differ in race, ethnicity, language, re-ligion, and values, ensuring equitable and culturally sensitive care is challenging but necessary.
Increasing physician diversity is a desired objective, but many physicians who are not underrepresented (e.g., whites and Asians) will be providing a large portion of care to racial and ethnic groups different from their own. In addition to the need to recruit and retain minorities that are underrepresented in medicine, cultural competence must be a part of medical education and training.
Cultural competence has many definitions, and most agencies or organizations have their own perspective of what cultural competence should be (23,24). Although most medical schools provide some type of cultural competence instruction, training varies in content and in method of edu-cational delivery (25). Some schools require cultural compe-tency training, some have elective courses, and some incor-porate cultural issues into course content (33). However, few
models of effective cultural competency curricula are readily available, and evaluation methods are inconsistent (33,142). Dissemination of effective cultural competency training is needed. This training should measurably illustrate that physi-cians’ interactions with and treatment of patients take into account patients’ cultures, beliefs, values, lifestyles, and fam-ily roles. Further, more efforts are needed to evaluate cultural competence outcomes and to assess the impact of cultural competence on improved patient satisfaction and improved health outcomes.
ASSESSMENT OF COGME’S TWELFTH REPORT
COGME’s Twelfth Report, Minorities in Medicine, notes that the 2 decades before the 1998 report “provided insight into the programs and resources required to facilitate mi-nority entry into medicine.” The report made a number of recommendations to “strengthen and sustain these efforts, and to achieve proportionate minority representation in medicine. . . .”
The continued increase in URM populations, without a comparable increase in the supply of URM physicians, indi-cates three important strategies for ensuring that URM popu-lations have adequate health care: 1) increasing the number of URM students who successfully advance through the el-ementary, secondary, and post-secondary academic pipeline in preparation for entrance into medical school; 2) overcom-ing policy or systemic barriers at the level of medical training institutions, residency programs, licensing boards, specialty certification boards, and practice settings; and 3) providing effective cultural competency training for U.S. physicians to ensure quality health care to people of all cultures.
This report reviews the published literature and other sources to assess the progress made on the 1998 recommen-dations for increasing the numbers of persons from URM groups in medicine. The assessment and review include the following:
1. Findings regarding ways to improve the academic pipeline leading to medical school; to enhance the upstream within medical training institutions, ac-crediting bodies, and licensing organizations; and to ensure cultural competence of U.S. physicians
2. Assessment of 1998 recommendations not yet at-tained
3. Evaluation considerations for future efforts 4. New recommendations

SEVENTEENTH REPORT OF COGME 16

SEVENTEENTH REPORT OF COGME 17
PIPELINE PROGRAMS
One of COGME’s recommendations addressed the need for “public and private organizations to agree collectively upon a Nationwide strategy for duplicating successful mod-els” of pipeline programs to enhance minority representation in medicine and to “develop, implement, and evaluate the impact of these strategies” as well as widely disseminate and publicize successful programs. In another recommendation, COGME also stressed the importance of collaborations be-tween and among institutions at various levels of the educa-tional continuum.
Findings
Numerous pipeline programs have been funded and created by public and private organizations to enhance the academic preparation of URMs. From K-12 through medical school, programs at various stages of the academic process have been implemented to help strengthen URM students academically and to interest them in medical careers.
At the National level, “No Child Left Behind,” signed into law in 2002 by President Bush, attempts to ensure that all students perform successfully in reading and math (54,55). Other programs such as the Mathematics and Science Ini-tiative and the Upward Bound Math and Science Program are specifically designed to enhance math and science skills (56,57).
The White House has also established several initiatives to improve opportunities for URMs to gain a post-second-ary education. President Bush signed the Tribal Colleges and Universities Initiative in 2002 to support tribal colleges’ ac-cess to Federal grants and funding opportunities, to increase the colleges’ participation in Federal programs, and to in-crease awareness of the role these colleges play (58). In 2002, the White House also established the “President’s Board of Advisors on Historically Black Colleges and Universities” to make recommendations to strengthen the capacity of these institutions and to ensure that they can compete effectively for Federal grants (59). Further, the White House Initiative on Education Excellence for Hispanic Americans includes pro-grams to strengthen academic skills and encourage post-sec-ondary education for Hispanic Americans, one third of whom fail to graduate from high school (60,61).
The AAMC’s Project 3000 by 2000 was an important step in increasing diversity among physicians by facilitating pipeline and upstream programs at all levels (62). Also, pri-vate organizations like the Lumina Foundation contribute to programs enhancing the education of disadvantaged and mi-nority youth. This foundation awarded almost $10 million in
grants in 2002 to increase the academic success and college access of underprepared, inner-city, and low-income students (63).
U.S. medical schools have developed numerous pro-grams for academic preparation, enrichment, and retention. The AAMC’s Minority Medical Education Program, funded by the Robert Wood Johnson Foundation, provides intensive 6-week programs at eleven medical schools. Two thirds of the program’s participants are admitted into medical school (64).
Other programs, including numerous post-baccalaureate programs or yearlong academic preparation programs, seek to prepare URM students for admission and matriculation into medical school (65-79) (see Appendix).
Further, numerous collaborative programs exist across educational institutions to enhance the academic preparation and representation of URMs. At the Federal level, the Health Resources and Services Administration’s (HRSA’s) Health Careers Opportunity Program (HCOP) provides assistance to disadvantaged students to help them enter and graduate from allopathic and osteopathic schools of medicine as well as oth-er health professions programs (80). HRSA’s Centers of Ex-cellence program helps fund Centers of Excellence in health professions education for minority students. These Centers may have one of four designations: Historically Black Col-leges and Universities, Hispanic Centers of Excellence, Na-tive American Centers of Excellence, and “Other” Centers of Excellence, which must enroll URMs at rates above the National average (81) (see Appendix).
Many other collaborative programs exist in which medi-cal schools partner with undergraduate, secondary schools, and/or community organizations to promote academic achievement and interest in medical education (66,82-105) (see Appendix). For example, the AAMC’s Health Profes-sions Partnerships Initiative (HPPI), funded by the Robert Wood Johnson Foundation and the W.K. Kellogg Founda-tion, helps increase the participation of URMs in health pro-fessions schools by developing educational partnerships and early academic intervention programs (32).
Learning from Others, a recent publication of the AAMC, reviews the literature on educational partnerships and includes information about HPPI collaborations to dem-onstrate how organizations can form effective educational partnerships (106).
Strengthening the Pipeline to Medical School

SEVENTEENTH REPORT OF COGME 18
1998 Recommendations To Be Attained
1. Although the AAMC has published a review of literature of educational pipeline partnerships (106), no collectively agreed-upon mechanism has been established to disseminate model pipe-line and upstream programs. Several obstacles to such a dissemination strategy exist:
• Reported pipeline/upstream programs have varying degrees of success in help-ing minorities to be admitted and re-tained in medical school.
• Standards are needed to determine which programs should be considered as models.
• Inconsistent methods of evaluating these programs make it difficult to compare program outcomes.
Evaluation Considerations
1. Research is needed to understand better the bar-riers to academic achievement for URMs at all educational levels so that interventions can be developed and implemented for targeted groups. Such barriers include cultural, linguistic, soci-etal, economic, and systemic.
2. Research should be conducted to determine the most effective interventions to achieve academ-ic success for URMs. Programs and curricula producing high rates of academically success-ful URMs should be identified, disseminated as models, and replicated at the local level. Such programs include those producing reading and academic achievement in elementary schools; high enrollment, retention, and achievement in college preparatory, science, and math courses in high school; high enrollment, retention, and achievement in undergraduate schools; and ad-mission, retention, and academic success in med-ical schools.
3. Data on issues of English proficiency in educa-tion need to be collected to increase achievement and retention of racial and ethnic minority youth who lack English proficiency.
4. Additional research is needed to show that suc-cessful partnerships among educational institu-
tions lead to successful educational practices that support the pipeline to medical training.
5. Objectives for pipeline programs as well as eval-uation indicators of success should be established to help determine what constitutes a successful program at the institutional, regional, State, and/or National levels.
OVERCOMING BARRIERS TO INCREASING URM MEDICAL SCHOOL APPLICANTS
COGME also recommended continued progress toward a more representative participation of minorities in medicine, including a goal of 4,500 new URM medical school matric-ulants by the year 2010 and 6,000 by the year 2020. This recommendation stressed the need to apply resources and ef-forts toward “the enormous challenges the Nation will face in reaching these objectives.” Further, COGME advised that “appropriate targets should be met at every point of the edu-cational pipeline, beginning in middle school.”
Findings
The goal of 4,500 new URM matriculants by 2010 and 6,000 by 2020 seems unlikely to be fulfilled, given current trends. In 2001, a total of 1,786, or 10.9 percent of first-year allopathic medical school matriculants, were identified as URMs. An additional 250 students were reported as having “Unknown Race/Ethnicity” and/or “Unknown Citizenship.” The 2001 total of URM matriculants represents a slight in-crease over the previous 2 years—1,739 and 1,741, respec-tively. First-year URM allopathic medical school matricu-lants peaked in 1994 and 1995 with 2,026 and 2,025 students, representing 12.4 percent and 12.5 percent, respectively, of new matriculants in those years (192).
Osteopathic medical schools reported 261 first-year URMs in 2001, the highest number since 1997, when 264 URMs started osteopathic medical training.3 URMs rep-resented 8.6 percent of total first-year enrollment of osteo-pathic medical school students in 2001. An additional 81 (2.7 percent) first-year students in 2001 were classified as “Other and Unknown” (other than URMs, white non-Hispanic, and Asian/Pacific Islander) (193).
Consequently, a total of 2,047 medical students identified as URMs (less than half the target number) began allopathic and osteopathic medical training in 2001. An additional 331 students had no identified race/ethnicity.
A total of 7,394 URMs matriculated in allopathic medi-cal schools in 2002, or 11.2 percent of total matriculants for
3 URM data collected for osteopathic medical students include African Americans, Native Americans, and all students who report an ethnicity of Hispanic origin.

SEVENTEENTH REPORT OF COGME 19
that year. An additional 1,680 students had no reported race/ethnicity and/or known citizenship. Total URM allopathic matriculants peaked in 1997 with a total of 8,254, or 12.3 percent of total matriculants. The number of enrolled URMs has declined since that time, but 2002 also saw the largest number on record with no reported race/ethnicity (1,680) (194). In 2001, 861 URMs matriculated in osteopathic medi-cal schools, and an additional 361 were of “Other and Un-known” race/ethnicity (188).
Providing insight into why more URMs are not applying to medical school, Richard Cooper’s 2003 study of educational trends for the four major U.S. racial and ethnic groups—whites, African Americans, Hispanics, and Asians—indicates that, “for each, the major hurdles to medical school are a high school diploma and a bachelor’s degree soon thereafter.” Once those hurdles have been surpassed, Cooper found, rates of application to medical school are about the same for African Americans, Hispanics, and whites (3). URM college graduates in 2000-2001 applied to medical school at a rate of 28 per 1,000 graduates, compared to a rate of 25 per 1,000 white college graduates applying to medical school that year (5,6).4 Rates are slightly higher for Asians. In fact, higher proportions of Asian college graduates than any other group apply to medical school. Although the other groups have experienced fluctuations, Hispanics have generally had the next highest proportions of college graduates applying to medical school (3).
Even after 1995, after court decisions that challenged af-firmative action, rates of acceptance of applicants into medi-cal school did not decline, but the rate of African American and Hispanic applicants decreased. Data show that, among URM applicants for 2001, 46.0 percent were accepted into medical school compared to 50.6 percent of non-URMs. African Americans had the lowest acceptance rate, 42.8 per-cent, compared to 53.4 percent for Mexican Americans, 60.4 percent for applicants from Mainland Puerto Rico, and 51.0 percent for Native Americans. African Americans also had lower Medical College Admission Test (MCAT) scores than other URM groups (53). Although African Americans and Hispanics represent 30 percent of the college-age population, they compose only 14 percent of medical school applicants, largely due to “progressive attrition along the path from grade school through college” (3).
Since the mid-1980’s, Cooper notes, K-12 achievement levels have slipped, continuing the achievement gap between URMs and whites and Asians. Parental income and paren-tal education affect the academic achievement of students (3,4,107). Over half of both Hispanic and African American high school graduates in 1992 were from families having incomes under $25,000, compared to a third of Asian high school graduates and 21 percent of white high school gradu-ates (4). Cooper observes, “Poverty weighs particularly heav-
ily on single-mother families, which account for 43 percent of black families and 23 percent of Hispanic families but only 13 percent of white and Asian families.” Financial limita-tions contribute to an inability to enroll in college or stay in college as well as matriculate into medical school (3).
For 1992 high school graduates, 15.0 percent of Hispan-ics and 16.9 percent of non-Hispanic African Americans had parents who had graduated from college, compared to 36.2 percent of whites and 48.9 percent of Asians. According to data from the U.S. Department of Education, high school graduates who are African American or Hispanic or who are low income are less likely to be academically well prepared for college than others. Further, even among those who are academically prepared, high school graduates who are His-panic or low income were less likely to take entrance exams and apply for admission to a 4-year college (4).
Research from the U.S. Department of Education also shows that fewer African Americans and Hispanic high school students than whites and Asians take high-level math and science courses. However, students who enrolled in al-gebra in the eighth grade were more likely to take high-level math courses in high school and to apply to a 4-year college than students who did not complete algebra as an eighth-grader even if they took a high-level math course in high school (195).
For high school graduates who are academically well prepared, being from a low-income family does not affect college enrollment as much as whether low-income students take the college entrance examinations and apply to college. A U.S. Department of Education study notes, “. . . if low-income students have an academic record and aptitude test scores which demonstrate even the minimal qualifications for admission to a four-year institution, if they take a col-lege entrance examination, and if they submit an application for admission, the majority of low-income students enroll in post-secondary education. . . .” Most, over 83 percent, enroll in a 4-year college or university (4).
The ability to persist through college is another factor af-fecting applicants to medical school. Cooper notes, “Among students who enroll full-time in 4-year colleges soon after high school, 77 percent of Asians and 67 percent of whites were still enrolled or had graduated three years later” com-pared to 52 percent for African Americans and 53 percent for Hispanics. Low-income affects men more than women. Men enter college less frequently than women immediately after graduating from high school and drop out more frequently as well. The ability to persist through college correlates with family income and the rigor of the high school curriculum. Lower persistence at all levels of rigor characterizes students “whose families are low-income, whose high schools served
4 Rates were computed using the data sources indicated.

SEVENTEENTH REPORT OF COGME 20
a large percentage of low-income children, or whose parents had no education beyond high school” (3).
Cooper further observes that reading proficiency can de-termine later academic success. He adds that cultural factors influence educational achievement and notes characteristics such as a greater number of hours spent watching television among African American and Hispanic adolescents compared to whites and Asians (3).
Increasing the number of qualified African American and Hispanic applicants to medical school will require efforts at many levels. Unless educators address the academic achieve-ment and retention of URM students, both at the high school and undergraduate levels, the pool of URM medical school applicants will not increase. Further, programs such as “A Better Chance,” which targets talented URMs for enrollment in college preparatory schools, are needed to enhance aca-demic opportunities for minority youth (105).
1998 Recommendations To Be Attained
1. Based on current trends, the goals of 4,500 new matriculants by 2010 and 6,000 by 2020 are not achievable in the near future.
2. Appropriate targets for URM educational attain-ment at every point of the educational pipeline need to be set and met.
Evaluation Considerations
1. Efforts need to focus on retaining URMs in the educational pipeline all the way through medical school and on intervening in processes that un-dermine retention and academic achievement.
2. To understand why URMs are not entering medi-cal schools in the numbers previously anticipated, the processes, obstacles, motivators, and facili-tators for individuals going through the educa-tional pipeline need to be better understood and addressed. Interventions are needed to address factors that prevent URMs from completing high school and entering and graduating from college. Dropping out of the educational pipeline is the greatest barrier to URMs’ entry into medicine. Education and income levels of parents affect academic achievement of their children. Dis-proportionate numbers of URM children live in single-parent and/or low-income households, a factor contributing to lack of success in early ed-ucation and influencing achievement at all other levels.
3. Standards of achievement and outcome measures are needed for evaluation of K-12, post-second-ary, and post-baccalaureate programs that seek to increase academic achievement of URMs.
4. Research is needed to determine reasons aca-demically prepared URMs may fail to take en-trance exams and apply to college.
SOCIAL MARKETING TO INCREASE URMs IN THE PIPELINE
COGME’s 1998 report recommended the development of partnerships among National and local media, advertis-ing agencies, and video production companies to create and implement innovative, culturally appropriate campaigns to promote science and health careers for minority and disad-vantaged children.
Findings
Some innovative campaigns have been established to encourage science and health careers for minority and disad-vantaged children:
• Kids into Health Careers is a program sponsored
by DHHS’s HRSA to encourage grant recipients to work with school systems to promote health and science. The program’s objective is to “(1) encour-age and inform minority and disadvantaged teenage students of educational and career opportunities in health professions; and (2) assist minority and disad-vantaged students in planning and preparing for post secondary education in the health care professions.” The Kids into Health Careers’ Web site includes vi-sual aids and talking points to assist volunteers. The program disseminates four basic messages:
Jobs are available in health care. Qualifying for them is achievable. Financial assistance is available. Many minority and disadvantaged people
lack health care (109).
• Another HRSA campaign is the Health Careers Adopt-A-School Program, which encourages part-nerships between schools and businesses to enhance students’ academic performance and career aware-ness. The program provides support for school partners to initiate activities that motivate students, enhance their academic success, build one-on-one relationships, encourage students to adopt safer and healthier lifestyles, and foster career goals in sci-ence, technology, and health. Suggested projects in-clude serving as speakers, mentors, or tutors; host-

SEVENTEENTH REPORT OF COGME 21
ing career fairs; sponsoring awards for academic improvement; providing financial assistance to cultural events; donating school supplies and equip-ment; recognizing outstanding teachers; and provid-ing “mini-grants” for teachers (110).
• The American Medical Association’s (AMA’s) Mi-nority Affairs Consortium sponsors the AMA Doc-tors Back to School program, which encourages physicians, residents, and fellows to serve as models and mentors to children from URM groups. Health providers interact with children in schools and com-munity organizations and share their history and practices to promote interest in health careers and to emphasize that pursuit of a medical career is a worthwhile and attainable goal (111).
• The Association of American Medical Colleges sponsors an annual “Minority Student Medical Ca-reer Awareness Workshop and Recruitment Fair,” during which high school and college students are provided information and encouragement to pursue careers in medicine (112).
• The Society for Advancement of Chicanos and Native Americans in Science (SACNAS) has ini-tiated a number of activities for minority children to encourage interest and achievement in science. Among these activities is the SACNAS Biography Project, which makes available the life stories of minority scientists, mathematicians, and engineers so that students can see their own potential in these individuals’ careers. The K-12 Education program supports educators with teacher workshops that “have grown into a National effort to support supe-rior pre-college education in the sciences for Native American/Alaska Natives, Chicano/Latino, African American and Pacific Island students.” SACNAS receives support from a number of sources, includ-ing the Indian Health Service and the National Insti-tutes of Medicine (113).
• The University of Washington’s Making Connec-tions, Making Choices program has a Brain Power Van that visits schools so that students learn more about neuroscience through the van’s personnel and exhibits. The program also provides a speaker’s bu-reau so that researchers can engage students’ inter-est in science. These programs are part of a larger program to promote science education (114).
• The National Native American Youth Initiative is a weeklong event in Washington, D.C., for Native American students ages 16-18. A cooperative agree-ment between the Office of Minority Health and the Association of American Indian Physicians funds this intense academic enrichment program that seeks
to motivate Native American students to stay in the academic pipeline and pursue a health professions career. Students learn the program material through lectures, field trips, and tutorials and are presented with an overview of health sciences and biomedical research (115).
• The American Association for the Advancement of Science joined with the Nation’s largest African American sorority, Delta Sigma Theta, and the Del-ta Research and Education Foundation, to produce an innovative radio program that targeted minority youth to encourage them to aspire to science careers. Funded by the National Science Foundation, the program, called Delta SEE Connection, conducted radio interviews with scientists and engineers to introduce children to the scientists as role models (116).
1998 Recommendations To Be Attained
1. Although some programs promote children’s
career choices in science and health, part-nerships with media, advertising and mar-keting firms, and video and audio produc-tion companies are needed to help develop and disseminate culturally appropriate mes-sages targeted to minority and disadvantaged children.
Evaluation Considerations
1. Research should be conducted on target audi-ences to determine whether medical and other health professions messages are sufficiently cul-turally specific, whether they are being received by sufficient numbers of the target audiences, whether they are having the desired effect, and whether the channels and media being used are the most effective for the target audiences.
STRENGTHENING THE PIPELINE TO MEDICAL SCHOOL:RECOMMENDATIONS
1. Further efforts are needed to increase the num-ber of URM college graduates to enlarge the pool of medical school applicants and URM physi-cians.
2. Intense efforts should focus on retention of URMs in the educational pipeline from elemen-tary school through secondary school, from entry in and graduation from undergraduate school, to entry in and graduation from medical school.

SEVENTEENTH REPORT OF COGME 22
3. Research is needed to understand better the bar-riers to academic achievement for URMs at all educational levels. Such barriers include cul-tural, linguistic, societal, economic, and systemic. Effective interventions should be developed and implemented to address disproportionately high secondary school dropout rates among URMs to increase their enrollment in college.
4. Standards of achievement and outcome measures are needed to determine which K-12, post-sec-ondary, and post-baccalaureate programs should be considered as models for increasing academic achievement of URMs.
5. More resources are needed to facilitate high school guidance counselors to assist URMs in taking entrance exams and applying to college and to place URMs in college preparatory schools and programs.
6. Organizations interested and involved in medical training should partner with media, advertising and marketing firms, and video and audio pro-duction companies to develop and implement ef-fective communication campaigns targeting mi-nority and disadvantaged youth with messages that encourage academic achievement, persis-tence in school, and interest in medicine.

SEVENTEENTH REPORT OF COGME 23
Many of COGME’s recommendations addressed ways for medical training institutions, accrediting bodies, and li-censing boards to overcome systemic and policy barriers to entry into medicine and to facilitate URM matriculation and graduation from medical school and entry into residency pro-grams and specialties.
Medical training institutions have sought to overcome barriers for URMs in medicine and have made strides in areas such as retention. Data for URM medical school matriculants beginning their training in 1996 show that 93 percent were either still enrolled or had graduated by their sixth year, com-pared to 92 percent of non-URMs who had graduated within 5 years (41). Nevertheless, as a recent Institute of Medicine report discusses, additional strategies and policies are needed to strengthen the enrollment and retention of URMs in medi-cal training (42).
ADMISSIONS
One of COGME’s 1998 recommendations addressed the need to examine the role of standardized test scores and grade point averages (GPAs) in medical school admissions and residency placement. The recommendation also indi-cated the need to develop criteria for determining desirable characteristics in medical students to use in admissions and placement decisions.
Findings
Despite controversy regarding the fairness of affirma-tive action programs (196), considerable published literature stresses the need for medical education programs to use fac-tors other than standardized test scores and GPAs as criteria for admission. The desirability and benefits of a diverse class-room, as well as the inequities of K-12 education, have been cited as reasons to support affirmative action (44,197,198).
In June 2003, the U.S. Supreme Court ruled that race could be used as a factor in admissions decisions, thus ruling in favor of the continued use of affirmative action policies. As the Supreme Court decision affirmed and as research sup-ports, a diverse medical school student body can be consid-ered a compelling State interest: minorities serve minority and underserved communities at higher rates than non-mi-norities do; a diverse student body helps increase sensitivity of non-minority medical students to diverse populations; and more minority physicians help ensure the health care of mi-nority populations (43).
After the 2003 Supreme Court decision, the AAMC produced guidelines to help medical schools assess their ad-
missions policies. These guidelines ask that medical schools consider the extent to which diversity is a “compelling inter-est” for the school, ways that the school can “demonstrate diversity as a compelling interest,” and the framework of the “school’s narrowly tailored policies” (43).
Among the recommendations in the AAMC guidelines is the need to find “workable race-neutral policies” rather than race-conscious policies. Use of qualitative or non-quantita-tive factors in admissions decisions is one such race-neutral policy (43). An important race-neutral reason to include non-quantitative factors in admissions policies is that medical school graduates are increasingly expected to have qualitative competencies (45). For example, the Accreditation Council on Graduate Medical Education (ACGME) emphasizes med-ical education outcomes of communication skills and profes-sionalism, which include ethics, cultural competence, and a committed and responsible relationship to patients and the profession (40).
Use of such factors as GPAs and MCAT scores as the main admissions criteria results in less diverse medical stu-dents or residents. URMs have traditionally not performed as well on quantitative measures as non-URMs (46). Also, use of Step 1 scores from the United States Medical Licens-ing Exam (USMLE) to decide which residency applicants to interview, a practice of some residency program directors, results in a lower number of minority residents in those pro-grams (118).
As one author observes, quantitative measures, such as MCAT scores, do not necessarily predict who will become the best physicians (48). The MCAT was developed in 1928 and has been revised four times since then. These revisions “demonstrate that the definition of aptitude for medical edu-cation reflects the profession’s social mores and values of the time” (199).
Nevertheless, research suggests that quantitative mea-sures are correlated with certain aspects of academic success. One study indicates that scores on the COMLEX exam taken by osteopathic medical students correlated with GPAs as well as performance in medical school coursework (200). Yet an-other study notes that URMs at one medical school answered more exam questions incorrectly in basic science courses than non-URMs did. The author adds that the attrition rate for these URM medical students was four times that for non-underrepresented groups (201).
Debate continues about which factors other than GPAs and test scores should be incorporated into medical school admissions or residency placement. One article notes that
Strengthening Upstream Efforts in Medical Training

SEVENTEENTH REPORT OF COGME 24
“we know that quantitative factors are not good predictors of success, but we don’t know which qualitative ones are bet-ter” (46).
An alternative way to rethink admissions is to examine methods of stratifying population groups. For example, one study advocates use of socioeconomic and disadvantaged sta-tus rather than race or gender as the criterion (49). The Uni-versity of Massachusetts Medical School uses criteria such as oral and written communication skills, community service, and extracurricular activities (47). The AAMC’s Expanded Minority Admissions Exercise suggests such factors as “lead-ership,” “determination and motivation,” “social interest,” and “maturity and coping capability” (50).
The U.S. Department of Education also encourages in-novation in admissions criteria for institutions striving to di-versify their student body. Some examples of such innovative programs include use of socioeconomic status as a preference, recruitment of students from schools not usually considered to be “feeder schools,” “skills development” programs and partnerships to improve academic performance of students at traditionally low-performing schools, and admission plans created for top-ranking high school students. The U.S. De-partment of Education report on race-neutral approaches stresses that until race-neutral criteria are fully implemented and evaluated, the extent of their success remains unknown (52).
Among URM medical school applicants for 2001, 46.0 percent were accepted into medical school, compared to 50.6 percent of non-URMs. African Americans had the lowest acceptance rate, 42.8 percent, compared to 53.4 percent for Mexican Americans, 60.4 percent for applicants from Main-land Puerto Rico, 51.0 percent for Native Americans, 51.7 percent for whites, 51.1 percent for Asians, and 49.7 percent for applicants from the Commonwealth of Puerto Rico (53).
1998 Recommendations To Be Attained
1. Criteria are needed for determining alternative characteristics desirable in medical students other than those characteristics revealed by quantitative measures.
Evaluation Considerations
1. A need exists for documented assessment of vari-ous non-quantitative admissions criteria to indi-cate those most predictive of successful outcomes. Measures could be developed to capture quali-tative or non-quantitative factors being used in medical school admissions/residency placement decisions. For example, data on first-year medi-cal school matriculants might indicate the pro-portion of students who have health care experi-
ence or those who majored in disciplines other than biological sciences. Selected non-quantita-tive criteria could then be reported Nationally along with quantitative measures such as aver-age MCAT scores.
2. Desirable outcome measures should be examined and perhaps redefined to incorporate non-quan-titative or qualitative considerations. “Success” is generally defined in terms of quantitative mea-sures such as proportions of students who pass coursework or board exams or those who per-form well on Step 1 of the USMLE. If a desired outcome is a caring physician, then criteria indi-cating that outcome should be included in admis-sions/residency placement decisions.
MEDICAL SCHOOL DEBT AND FINANCIAL ASSISTANCE
COGME recommended assessing the impact of rising medical student debt on the entry of minorities into medicine; determining the influence of debt on career choice, including choice of practice location; and ensuring the availability of financial assistance to URMs across educational levels, in-cluding medical school.
Findings
Both the AAMC and the American Association of Colleg-es of Osteopathic Medicine (AACOM) collect debt informa-tion through surveys of medical school graduates (AAMC) or seniors (AACOM). Medical school debt has been increasing annually, reaching an average of $103,855 for U.S. graduates of allopathic medical schools in 2002 and $131,200 (includ-ing undergraduate debt) for osteopathic medical seniors in 2001-2002 (120,202). The reality of rising medical school costs may deter students from ever applying to or matriculat-ing in medical school.
Mean educational debt is generally higher for URMs than for non-URMs in public allopathic medical schools (203). However, mean debt is almost equal for URMs and non-URMs who graduate from private medical schools (122). Medical school students, especially URMs, accumulate more debt the more years they spend in medical school. For non-URMs, debt fluctuates according to the number of years in medical school but is consistently lower than debt for URMs. One quarter of URM medical school students matriculate in medical school for more than 4 years, compared to a tenth of non-URMs (204). The greater proportion of URMs than non-URMs who spend more years in medical school increases the likelihood of higher debt levels and higher mean debt for URMs as a group (see Table 8).
Despite the increase in debt, data from the 2001 gradu-ates indicate that debt was not a factor in choice of specialty

SEVENTEENTH REPORT OF COGME 25
for 66.3 percent of URMs and for 69.8 percent of non-URMs. The average debt for these URM respondents was $97,664 and for non-URMs, $89,582 (see Table 9 above) (126).
Similar proportions of both URMs (16.1 percent) and
non-URMs (16.8 percent) indicate that debt had a “minor influence” on their choice of specialty. The average debt for these respondents was $113, 494 for URMs and $100,480 for non-URMs, 16 percent and 12 percent higher, respectively, than debt for those graduates who reported that debt was not a factor in specialty choice.
Almost 12 percent of URMs said that debt was a “mod-erate influence” on their specialty choice, and these physi-cians had an average debt of $123,600. About 9 percent of non-URMs reported that debt was a moderate influence, and the average debt for this group was similar to that of URMs, $122,861.5
Only 5.9 percent of URMs and 4.5 percent of non-URMs indicated that debt was a “strong influence” on their choice
of specialty, and this group had the highest debt of all. URMs for whom debt was a “strong influence” had an average debt of $119,006, and non-URMs in this group had a higher mean debt of $125,265 (126).
The AAMC also reports the amount of debt by prac-tice specialty and anticipated practice location. The amount of educational debt for graduates planning to practice in an underserved area was similar to the debt for those who did not plan to practice in an underserved area: $102,163 versus $103,394 for URMs and $99,532 versus $97,628 for non-URMs (205).
For 2001 graduates planning to practice in an under-served area, those planning to serve in a primary care spe-cialty had the lowest average debt (see Table 10) (205). Data from the AAMC 2001 Graduate Questionnaire indicate that almost half of non-URMs and 39.2 percent of URMs planning to practice in underserved areas selected primary care specialties. Over a quarter of URMs and 17.4 percent of non-URMs intending to practice in an underserved area
TABLE 8Debt for Allopathic Medical School
Graduates, by Years in Medical School, 2001 (204)
Years in Medical School URMs Non-URMsFour $100,000 $99,000Five $117,000 $102,000Six $132,000 $97,000
Source: AAMC 2001 Graduate Questionnaire.
TABLE 9Influence of Debt on Specialty Choice for
Medical School Graduates, 2001 (126)
Degree of Influence
URMAverage Debt
Percentage of
Respondents
Non-URM Average
Debt
Percentage of
Respondents
None $97,664 66.3 $89,582 69.8Minor $113,494 16.1 $100,480 16.8Moderate $123,600 11.7 $122,861 8.9
Strong $119,006 5.9 $125,265 4.5Source: AAMC 2001 Graduate Questionnaire.
5 Data collected from Facts and Figures, AAMC. Lois Colburn. May 11, 2004.

SEVENTEENTH REPORT OF COGME 26
selected surgical specialties (206). Of those graduates plan-ning to locate in an underserved area, support specialties had the highest average debt, $121,692 for URMs and $108,914 for non-URMs (205). Similar proportions of both URMs and non-URMs (just under 16 percent) who anticipated locating in underserved areas chose support specialties (206).
Like allopathic medical students, osteopathic medical students also experience high debt levels. Seniors in 2001-2002 had an average debt of $131,200, a 2 percent increase from 2000-2001, when the average debt for graduating se-niors was $128,700.6 Nevertheless, this debt increase was moderate compared to the prior year when mean debt was $121,000. Thus, during a 2-year period, debt for senior os-teopathic medical students increased by $10,000, or 8 per-cent (190). For senior URMs in 2001-2002, debt averaged $135,400, which represents a decrease from $138,400 the previous year; for whites, the mean debt was $135,700, an increase from $130,300, and for Asians, $107,800, a decrease from $114,000 the previous year (207).
Information regarding factors influencing specialty choice reveals that debt level had very little influence on the choice of specialty for 2001-2002 osteopathic medical school seniors, regardless of race or ethnicity and regardless of whether they were planning to practice in a primary care specialty or a non-primary care specialty. The most impor-tant factor listed by senior osteopathic medical students plan-ning primary care specialties was a preference for working with a “person or patient more than techniques,” followed closely by “intellectual content of the specialty.” Lifestyle ranked third and was an especially high priority for URMs and Asians who were planning to practice in primary care specialties. For seniors planning to practice in non-primary care specialties, “intellectual content” most influenced spe-cialty choice, followed by “skills [and] abilities” required of the specialty (127).
According to the AAMC, almost three quarters of 2001 URM allopathic medical school graduates and slightly fewer than half of 2001 non-URM graduates received scholarship assistance while in medical school. URM graduates received an average of almost $35,000 in scholarships, compared to $25,780 for non-URMs. For 2001 graduates attending private medical schools, URMs received an average of $6,000 more in scholarships than non-URMs, and for 2001 public school graduates, URMs received an average of $7,000 more than non-URMs (124).
Although similar proportions of new allopathic medical school matriculants (60 percent) indicate that their medical education will be financed through loans, 30 percent of URMs stated that scholarships will help pay for their education com-pared to 14 percent of non-URMs. Seventeen percent of non-URMs indicated that family or spouses will help finance their education compared to 6 percent of URMs (123).
Among osteopathic medical school seniors, 42.3 percent of URMs received scholarships, and the average scholarship amount was $38,600. Among whites, 34.7 percent received scholarships at an average of $39,500, and 20.3 percent of Asians received scholarships at an average of $38,000 (208).
According to available survey estimates from the U.S. Department of Education for the 1999-2000 school year, URM undergraduates received more aid of any type, more Federal assistance, and more grants than non-URMs (209). In addition, URM master’s and doctoral students, as well as URM first professional degree students, received more finan-cial assistance in dollars than non-URM students (210).
Further, data collected for 1995-1996 indicate that the percentage of undergraduates who received financial aid was inversely proportional to family income (see Table 11). Sev-
TABLE 10Average Debt by Practice Specialty Choice for
Medical School Graduates Planning To Practice in an Underserved Area, 2001 (205,206)
Specialty Choice
URM Non-URMAverage
DebtPercentage of Respondents
AverageDebt
Percentage of Respondents
Primary Care $97,296 39.2 $95,907 48.8Medical $100,567 19.1 $101,313 18.2Surgical $98,241 25.8 $100,646 17.4Support $121,692 15.9 $108,914 15.6
Source: AAMC 2001 Graduate Questionnaire.
6 These figures include undergraduate debt.

SEVENTEENTH REPORT OF COGME 27
enty percent of students whose families had incomes below $20,000 in 1994 received financial aid, 66 percent of which included grants. In contrast, 28 percent of students whose family income was at least $100,000 received financial aid, 17 percent of which included grants (107).
1998 Recommendations To Be Attained
1. More research is needed to determine the impact of medical school debt on URMs’ decisions to ap-ply to or matriculate into medical school.
Evaluation Considerations
1. Current mechanisms for evaluating the impact of debt on URMs may not fully capture impor-tant considerations. Data are needed to assess the impact of potential indebtedness on select-ing medical school as a career option in the first place. Assessing students who possess the requi-site academic credentials but who elect other ca-reer options may be helpful.
2. Research to assess whether increased scholar-ship assistance rather than loans might encour-age more URMs to elect to pursue medicine as a career would be useful.
URMs IN SPECIALTIES
COGME’s recommendations also included a need to identify and eliminate barriers to URM entry into medical and surgical specialties. COGME encouraged medical and surgical specialty organizations and societies to assist in en-suring that URMs have the same flexibility in selecting spe-cialties that non-URMs have.
Findings
The AAMC collects data by specialties for medical school graduates, and the AACOM collects specialty data for osteopathic medical school graduates (128,211). AAMC data from the 2001 Graduate Questionnaire reveal that, although a higher percentage of URMs than non-URMs graduating in 2001 planned to pursue generalist or surgical specialties, a greater proportion of non-URMs than URMs planned to pur-sue medical specialties. Proportions choosing support spe-cialties were similar for both groups (see Table 12) (128).
TABLE 11Percentages of Undergraduates With Student Financial Aid,
by Family Income and Type of Aid (107)
Family Income (in 1994) Any Aid* Grants LoansLess than $20,000 70 66 35$20,000-$39,900 60 51 38$40,000-$59,900 47 30 32$60,000-$79,900 43 25 27$80,000-$99,900 38 20 23$100,000 or more 28 17 13
*Includes grants, loans, and other types of aid such as work-study.Source: NCES, 1995-1996 National Postsecondary Student Aid Study (NPSAS:96).
TABLE 12Specialty Plans of URM and Non-URM
U.S. Medical School Graduates, 2001 (128)
Type of Specialty Percentage of URMs Percentage of Non-URMsGeneralist 27.0 24.8Medical 21.4 25.5Surgical 29.2 26.2
Support 22.4 23.5Source: AAMC. 2001 Graduate Questionnaire.
SEVENTEENTH REPORT OF COGME 28
Potential barriers to minority entry into some specialties include board exam information and feedback procedures. The USMLE provides standardized feedback to examinees, including strengths and weaknesses, particularly important for those who fail the exam, yet feedback to examinees from specialty board exams is inconsistent or nonexistent. Simi-larly, specialty boards have inconsistent levels of information regarding preparation for board certification exams (212). Minorities and older examinees in one study were more like-ly to fail certification exams, and passing rates are correlated with performance in medical and residency training (213). Inadequate information regarding preparation for board ex-ams, as well as feedback upon failure of these exams, can create obstacles for examinees seeking to become certified in some specialties. Also, a need for more academic support in medical training for both minorities and older students is indicated.
Further, research suggests that some residency program directors use scores from Step 1 of the USMLE to determine which applicants will be interviewed for selection. Depend-ing on the threshold of scores used to select interviewees, African American applicants in one study were three to six times less likely to be interviewed by these programs (118). The use of USMLE scores to screen applicants for residen-cies can create obstacles for minority entry into some resi-dency programs. Also, some residency program directors use the selectivity of applicants’ medical schools to help narrow applicant pools, another factor that may result in fewer mi-norities in those residencies (47).
The results of the American College of Surgeons’ annual survey of residents enrolled in surgical graduate medical edu-cation each year for 1994-1995 and 1995-1996 indicate that few minorities reported entry into surgical specialties in those years. Of the 5,541 residents who were surgical specialists in 1994-1995, 301 (.05 percent) reported that they were Afri-can American and 218 (.04 percent) reported that they were Hispanic. In 1995-1996, 305 (.06 percent) of 5,397 surgical residents were African American, and 226 (.04 percent) were Hispanic. The report noted that “although recruitment of the most highly qualified US and Canadian medical school grad-uates has been a source of pride to the profession,” a strong need exists to increase diversity of surgical residents (214).
However, a recent study of efforts to recruit students into surgical residencies at the Robert Wood Johnson Medical School was extremely successful in increasing the number of students who pursued surgical residencies and who were matched into those residencies. The proportion of students accepted into surgical residencies increased from 18 percent during 1993-1997 to 22 percent from 1999-2003. By 2003, the proportion of graduating seniors matched into surgical residencies increased to 26 percent. Over a quarter of those matched into surgical residencies were URMs, and 19 per-cent spoke English as a second language. Further, the quality of students accepted into surgical residencies remained high (215).
1998 Recommendations To Be Attained
1. A need continues for research into obstacles and motivations for minority entry into residencies or specialties.
Evaluation Considerations
1. Tracking interest in specialties at entry into med-ical school, at the beginning of the clinical year, and at graduation would be helpful to examine factors influencing specialty choices for both URMs and non-URMs. A multivariate analysis can help determine relative influence of various factors.
2. Tracking barriers to and motivators for entering specialties would be helpful to examine factors influencing specialty choices for both URMs and non-URMs.
3. Residency program directors should be encour-aged to use factors other than exam scores or se-lectivity of medical schools in selecting applicants for interviews.
URM FACULTY
One of COGME’s recommendations addressed the need to increase proportions of URM medical school faculty to 10 percent of total faculty. The recommendation also suggested that “every academic medical center should have in place specific programs and a dedicated budget for identifying and supporting underrepresented minority students with an inter-est in academic medicine.”
Findings
According to the AAMC Faculty Roster in 2002, 6.9 percent of allopathic medical school faculty reported that they were URMs. In 1998, 5.9 percent of faculty was URMs. However, these data should be viewed cautiously because of the large proportion of faculty for whom race/ethnicity was reported as “Other/Unknown”: 4.1 percent in 2002 and 6.1 percent in 1998 (130,131).
The number of reported allopathic medical school facul-ty increased from 87,230 in 1998 to 98,802 in 2002. Numbers of faculty increased for all identified racial/ethnic groups ex-cept for Native Americans, who decreased from 123 to 105. The proportion of white faculty members decreased from 78.3 percent to 76.9 percent, whereas the proportion of Asian faculty members increased from 9.6 percent in 1998 to 11.5 percent in 2002 (see Table 13) (130,131).

SEVENTEENTH REPORT OF COGME 29
Data reported for osteopathic medical school faculty for 2001 indicate that 3.5 percent were URMs compared to 3.0 percent in 1998. As for allopathic faculty, large proportions of osteopathic medical school faculty were reported as “Oth-er/Unknown”: 4.6 percent for 2001 and 5.4 percent for 1998. From 1998-2001, total faculty members in osteopathic medi-cal schools decreased 1 percent from 2,586 to 2,561. The re-ported total of African American faculty decreased from 46 to 43, and the number of white faculty decreased from 2,253 to 2,204 (see Table 14) (132).
However, as researchers at a recent conference at Dart-mouth University note, increasing numbers of URM faculty only partly solves the problem of increasing diversity among faculty. A more important issue is the need for exchanging ideas and experiences and for examining tenure criteria, which have been largely determined by tenured faculty, the majority of whom continue to be white and male. Minority faculty is expected to carry out traditional demands of re-search and also to advocate for diversity and to represent minorities. Academic institutions should examine the climate of their institutions to determine whether they truly provide opportunities for minority faculty members to share power with their non-minority colleagues (216).
Research indicates that minority faculty should be re-cruited and mentored early in their careers, but few programs have been reported that focus on supporting URM students
interested in academic medicine. However, one such program is the Fellowship Program in Academic Medicine, support-ed since 1990 by $5 million grants from the Bristol-Myers Squibb Company. This program seeks to increase minority physician representation among medical school faculty and in biomedical research. The Fellows are selected from sec-ond-year, third-year, or fourth-year minority medical students who are nominated by medical school deans. These candi-dates are reviewed and selected by a committee of medical school faculty and biomedical researchers. The Fellows pro-pose and conduct research during an 8- to 12-week period, during which they work closely with a faculty mentor (133).
The Minority Medical Faculty Development Program, established by the Robert Wood Johnson Foundation, offers 4-year postdoctoral research fellowships to minority physi-cians. The program seeks to increase minority faculty who progress successfully through the ranks of academic medi-cine by supporting research opportunities. As many as 12 Fellows are appointed with an annual stipend of $65,000 plus an additional $26,350 to support research expenses. The Fel-lows work with faculty mentors as well as National Advisory Committee mentors and attend an annual meeting where re-search presentations and career development workshops are conducted (217,218).
TABLE 13Number and Percentages of U.S. Medical School Faculty,
by Race/Ethnicity, 2002 and 1998 and Percent Change (130,131)
Race/Ethnicity2002 1998 Percent
ChangeTotal Percent* Total Percent*Native American 105 0.1 123 0.1 –15African American 2,964 3.0 2,348 2.7 +26Mexican American 535 0.5 350 0.4 +53Puerto Rican 915 0.9 703 0.3 +30Other Hispanic 2,328 0.2 1,636 1.9 +42Total URM Faculty 6,847 6.9 5,160 5.9 +33White 76,025 76.9 68,294 78.3 +11Asian 11,408 11.5 8,412 9.6 +36Multiple Races 430 0.4 430 0.5 0Other/Unknown 4,092 4.1 5,364 6.1 –24Total 98,802 100.0 87,230 100.0 +13
*Percentages do not equal 100 because of rounding.Sources: AAMC Faculty Roster, December 31, 2002; AAMC Faculty Roster, December 31, 1998.

SEVENTEENTH REPORT OF COGME 30
Female minorities often have unique obstacles to ad-vancing as faculty members in medical education. To address barriers for minority faculty women, six National Centers of Excellence in Women’s Health use the following strategies to support female minority faculty:
• Funding• Awards• Leadership symposiums• Mentoring programs• Faculty development workshops The Centers also offer assistance in the promotions pro-
cess and in targeted retention and recruitment initiatives and have formed a committee addressing female minority faculty concerns. They stress the need to establish and track diver-sity indicators, provide institutional support as faculty move through the promotion process, commit to institutional strat-egies to recruit and retain minority faculty, and conduct re-search on ways to overcome barriers to advancement (134).
One study indicates that URM medical school faculty are more dissatisfied with their careers than non-URM fac-ulty are (129). Increased efforts are needed to ensure that the institutional climate of medical training institutions fosters career growth and satisfaction for URM faculty.
1998 Recommendations To Be Attained
1. More complete reporting of faculty by race/eth-nicity is needed to determine progress made in increasing URM faculty. Race/ethnicity for a large percentage of faculty is reported as “Other/Unknown.”
2. Recruiting and retaining minority physicians as medical school faculty continue to be impor-tant goals, especially as evidence indicates that minority faculty are more dissatisfied with their careers than non-minority faculty.
Evaluation Considerations
1. Programs like the Centers of Excellence in Wom-en’s Health or the Fellowship Program in Aca-demic Medicine can provide valuable “lessons learned” for institutions attempting to enhance opportunities for minority medical school fac-ulty. Collecting and reviewing data on the out-comes of such programs (e.g., numbers recruited, numbers retained, and satisfaction) are essential for developing new initiatives or refining ongoing ones.
TABLE 14U.S. Osteopathic Medical School Faculty,* by Race/Ethnicity,
2001-2002 and 1998-1999 and Percent Change (132)
Race/Ethnicity2001-2002 1998-1999 Percent
ChangeTotal Percent Total PercentNative American/Alaska Native 8 0.3 6 0.2 +33 African American 43 1.7 46 1.8 –7Hispanic 38 1.5 26 1.0 +46Total URM Faculty 89 3.5 78 3.0 +14White 2,204 86.1 2,253 87.1 –2Asian 134 5.2 116 4.5 +16Multiple Races 15 0.6 † † †
Other/Unknown 119 4.6 139 5.4 –14Total 2,561 100.0 2,586 100.0 –1
*Full- and part-time, all ranks. †Data are not available.Source: AACOM, Annual Osteopathic Medical School Questionnaire, 2001-2002 and 1998-1999 Academic Years.

SEVENTEENTH REPORT OF COGME 31
2. Separating the category “Other” from “Un-known” race/ethnicity of faculty for reporting purposes might provide a better representation of the proportion of faculty who are minorities and would indicate more accurately the propor-tion of faculty who fail to report their race.
3. Establishing and tracking diversity indicators for minority faculty recruitment, tenure, and pro-motion would help foster commitment to having a diverse faculty and would also help document obstacles for minority faculty that should be ad-dressed.
STRENGTHENING UPSTREAM EFFORTS IN MEDICAL TRAINING:RECOMMENDATIONS
1. Desirable outcome measures that include non-quantitative considerations should be established for medical school students and then used in ad-missions decisions.
2. Residency program directors should also consid-er qualitative as well as quantitative factors when deciding which residency candidates to interview and select.
3. Use of qualitative criteria in medical school ad-missions and residency placement decisions should be documented and assessed to determine which ones are most predictive of successful out-comes.
4. More research is needed to assess the impact of medical school debt on URMs’ decision to apply to, matriculate in, and graduate from medical school.
5. Assessment of whether increased scholarship as-sistance rather than loans might encourage more URMs to pursue medicine as a career would be helpful.
6. More research is needed to evaluate obstacles or motivations for minority entry into primary care or specialty residency programs. Medical schools should track medical students’ interest in specialties at entry into medical school, at the be-ginning of the clinical year, and at graduation to assess factors that influence choice of specialties for both URMs and non-URMs.
7. Medical schools should develop and implement plans for recruiting and retaining minority facul-ty physicians, including assessing and enhancing the institutional climate for URM faculty. Indica-tors and targets for recruitment, tenure, and pro-motion of minority faculty should be established and tracked.
8. Minority medical students, residents, and phy-sicians who aspire to serve as faculty should be identified and mentored early in their careers.
9. Interventions should be developed that encour-age physicians to practice in underserved areas for periods that extend beyond the time commit-ment of programs requiring service in exchange for funding opportunities.
10. Research is needed to determine optimal condi-tions and exposure time required for medical students to develop and maintain an interest in serving in underserved communities.
11. Strategies are needed to assess and reinforce the commitment of academic medical centers to pro-vision of care to underserved populations. This commitment should be integral to the academic environment and mission and should be fostered by means other than funding incentives.

SEVENTEENTH REPORT OF COGME 32

SEVENTEENTH REPORT OF COGME 33
Ensuring Cultural Competence in Medicine
CHANGING DEMOGRAPHICS
In its 1998 report, COGME noted that, given the changing demographics of the U.S., physicians will care for increasingly diverse populations. Because the diversity of the physician workforce is not keeping pace with the diversity of the Nation, physicians need to have competencies that promote high-quality care of culturally, racially, and ethnically diverse populations. COGME also made recommendations addressing ways to ensure cultural competence in physicians, including the need to arrive at a consensus regarding the definition of cultural competency in medicine; to develop, implement, and assess cultural competency training; and to incorporate cultural competency in accrediting standards for medical academic institutions, licensing board criteria, and quality standards for managed care.
Findings
Although no formal panel has been convened to reach a consensus definition of cultural competence, much discus-sion has occurred during recent years regarding what cultural competence is or should be. Indeed, based on the complex-ity and variety of perspectives of cultural competence, the possibility of reaching a single consensus seems unlikely. As the National Center for Cultural Competence at Georgetown University States, “many definitions of cultural competence are emerging in the literature yet none is accepted as the ‘gold standard’” (23). Further, Lisa Tedesco, in an essay published in The Right Thing to Do, The Smart Thing to Do, states that a consensus on definitions of cultural competence is “a distant goal” (219). Cindy Brach and Irene Fraser with the Agency for Healthcare Research and Quality (AHRQ) also state, “Every organization and author define cultural competency somewhat differently” (24).
Nevertheless, some definitions of cultural competence have emerged. The most common definition used is one de-veloped by T.L Cross and associates in a 1989 report (220). DHHS’s Office of Minority Health (OMH), in its National Standards for Culturally and Linguistically Appropriate Ser-vices in Health Care, borrows Cross’s concept of “cultural and linguistic competence”: “a set of congruent behaviors, attitudes, and policies that come together in a system, agency, or among professionals [and] that enables effective work in cross-cultural situations” (26).
Other definitions include one from the National Center for Cultural Competence, which defines cultural competence as effective provision of services to individuals within a larger family, community, and cultural milieu. This organiza-tion stresses the need for physicians to understand their own culture, to acknowledge a “patient’s different culture, value
systems, beliefs, and behaviors,” to be aware that “cultural difference is not synonymous with cultural inferiority,” and to learn about patients’ culture in order to provide optimal health care (23).
Despite the lack of uniformity in definitions of cultural competence, the desirability of cultural competency train-ing in medical education is recognized, and this training is increasingly available in various courses and educational delivery methods (23-40). However, the limitations of some methods of incorporating cultural competence into medical training curricula are also apparent. As Michael Whitcomb, Editor of Academic Medicine, states, “it is not yet clear how best to teach students how to begin acquiring the knowledge, skills, and attitudes they need” to develop relationships with culturally diverse patients (25).
The various perspectives expressed in the published literature affirm that approaches to teaching and assessing cultural sensitivity, cultural awareness, and other key issues involved in being “culturally competent” are in a pioneering stage. Much discussion in the literature revolves around the best means to change attitudes and the best way to measure those changes, both in the medical school environment and in practice settings (27-29,136-142,221-224).
Since the 1998 COGME report, private and public orga-nizations have sponsored numerous initiatives to develop and implement curricula and programs promoting cultural com-petency. A brief summary of cultural competence initiatives include many developed or sponsored by HRSA:
• The Provider’s Guide to Quality and Culture, an electronic resource that includes a self-assessment, cultural competence information and pointers, in-formation about patient-provider relationships, au-dio clips of providers’ perspectives, and resources (143).
• The Cancer Diagnostic Guide, which addresses culturally competent approaches to cancer preven-tion and treatment and assists providers in effective cross-cultural communication (225).
• The Minority AIDS Initiative, which provides fund-ing for organizations to help fight AIDS. Funded programs incorporate cultural competent activities (225).
• Be Safe, a cultural competence guide for African Americans, which provides information about the management and treatment of African American pa-tients with HIV/AIDS (225).

SEVENTEENTH REPORT OF COGME 34
• “Cultural Workshops for Providers” to meet specific needs of the AIDS Education and Training Centers (225).
• A 2003 Satellite Broadcast, entitled “Cross-Cultural Communication in Health Care: Building Organi-zational Capacity,” which focuses on language ser-vices in health care and provides a six-step model for planning and managing these services (144).
• Indicators of Cultural Competence in Health Care Delivery Organizations: An Organizational Cultur-al Competence Assessment Profile, which offers a systematic approach to cultural competence in com-munity-oriented organizations (145).
• A review of literature that examines information to help assess cultural competence in health care deliv-ery settings (146).
• A cultural competency program that seeks to pro-mote cultural competence and demonstrate its ef-fectiveness in increasing health care access and de-creasing health disparities (147).
• “Cultural Competence Workshops and Technical Assistance” (148).
• A 2002 conference, entitled “Bridging Cultures & Enhancing Managed Care,” at which presentations were made addressing provision of cultural and lin-guistic competence in managed care (149-153).
• A “Cultural Competence Works” competition for HRSA grantees that have successfully made cultural competence an integral part of their organizations (154).
The AHRQ has also produced reports on cultural com-petence: Can Cultural Competency Reduce Racial and Eth-nic Health Disparities? A Review and Conceptual Model, Reducing Disparities through Culturally Competent Health Care: An Analysis of the Business Case and, recently, the Na-tional Healthcare Disparities Report (24,155,156).
In addition to Federal efforts, private organizations have launched numerous cultural competence initiatives:
• An online cultural competence-training module at the National Center for Cultural Competence at Georgetown University (157).
• The California Endowment’s report Principles and Recommended Standards for Cultural Competence Education of Health Care Professionals, which in-cludes standards for content, methods, and evalua-tion of cultural competency training (30).
• The Committee on the Health Professions Educa-tion Summit’s report, which advocates five basic competencies in health professions education (31).
• The AAMC’s “Tool for Assessing Cultural Compe-tency Training,” which is being developed to help medical schools assess their cultural competency curricula (32).
• The Commonwealth Fund’s report Cultural Compe-tence in Health Care: Emerging Frameworks and Practical Approaches, which helps health care or-ganizations improve health care by overcoming cul-tural barriers (33).
• The AMA’s Cultural Competence Compendium, a compilation of efforts, tools, presentations, reports, and articles promoting cultural competence (34).
• The American Association of Health Plans’ (AAHP’s) 2003 audio conference entitled “The Case for Cultural Competencies in Health Care” (35).
• Kaiser Permanente’s A Provider’s Handbook on Culturally Competent Care: African American Population and A Provider’s Handbook on Cultur-ally Competent Care: Latino Population and train-ing modules entitled “Introduction to Diversity,” “Culturally Competent Care: Cultural Awareness,” “Culturally Competent Care: Cultural Knowledge,” and “Culturally Competent Care: Cultural Skills” (36,37,158).
• An initiative launched in 2002 by the National Medical Association, the AMA, and other specialty groups to educate physicians about health care dis-parities, particularly for heart disease (159).
Information from the Liaison Committee on Medical Education, Part II of the Annual Medical School Question-naire, reveals that almost all U.S. medical schools provide required and/or elective training in cultural competency or topics related to cultural competency. Of the 125 academic health centers reporting for 2000-2001, however, only three required a separate course in cultural diversity, 112 incorpo-rated cultural diversity as part of a required course, 21 offered an elective course in cultural diversity, and 43 included cul-tural diversity as part of elective coursework (135). Studies also indicate that some residency programs are incorporating training that promotes cultural competence in residents (227-229). Further, continuing medical education (CME) courses in cultural competence are emerging (164,165).
Much progress has been made toward including cultural competence in accreditation standards for both undergradu-ate and graduate medical education. The Licensing Commit-tee on Medical Education (LCME) has explicit accreditation

SEVENTEENTH REPORT OF COGME 35
standards that include cultural competency for medical edu-cation (38). Also, the ACGME has developed an Outcomes Project that stresses six areas of competency for residents, one of which, “Professionalism,” includes demonstrating “sensitivity and responsiveness to patients’ culture, age, gen-der, and disabilities” (39,40). The American Board of Medi-cal Specialties supports these outcomes, and some specialty organizations have adopted guidelines that include cultural competency training (160,161).
Although licensing boards do not test for cultural com-petence, Step 3 of the USMLE uses diverse patients as part of the clinical assessment so that examinees must respond to clinical situations that include cultural contexts (162). The Accreditation Council for Continuing Medical Education does not require specific competencies (163).
New York has pending legislation that mandates that the medical schools in the State require at least one course in cul-tural competency and that physicians must complete cultural competency training for relicensure (166). New Jersey has pending legislation that requires cultural competency training for physicians to be licensed or relicensed (167). California and Illinois have bills pending that provide for State medical societies to offer voluntary cultural competency programs for physicians (168,169).
Although some managed care plans have developed strategies for increasing minority physician representation and culturally competent care in their practices, continued efforts to increase minority physician representation in man-aged care are needed.
Kaiser Permanente has established a National Diver-sity Department, but this large managed care organization acknowledges difficulty in recruiting minority physicians (230). To facilitate cultural competence in its organization, Kaiser Permanente has created its own Institute for Cultur-ally Competent Care and has Centers of Excellence for Afri-can Americans, for Latinos, and for linguistic services. This health plan also has received an AAHP grant for Innovation in Quality Improvement (35).
As managed care increasingly provides health care for large portions of the U.S. population, much effort has been made to develop, implement, and assess cultural competence strategies and to evaluate cultural competence in managed care organizations. The Centers for Medicare and Medicaid Services (CMS) commissioned the AHRQ to develop guide-lines to provide assistance to managed care plans: “Oral, Linguistic, and Culturally Competent Services” and “Provid-ing Oral Linguistic Services” (171-172). In addition, CMS has established and updated its Quality Improvement System for Managed Care Standards and Guidelines (173).
Further, the George Washington University Center for Health Services Research and Policy, in consultation with
HRSA and Resources for Cross Cultural Health Care, has de-veloped a technical assistance document, “Optional Purchas-ing Specifications: Cultural Competence in the Delivery of Services Through Medicaid Managed Care,” to help States that contract with managed care organizations for provision of services for Medicaid-eligible individuals (175).
Other efforts also seek to ensure that managed care orga-nizations respond to the cultural needs of enrollees in health care plans. According to the National Committee for Qual-ity Assurance, the Health Plan Employer Data and Informa-tion Set (HEDIS®) has no measures that assess the cultural competence of providers, but the “accreditation standards require organizations to address members’ cultural needs and preferences.” Further, an organization must assess “the cul-tural, ethnic, racial and linguistic needs of its members and adjust the availability of practitioners within its network if necessary.” Organizations must also “have quantifiable and measurable standards for the number and geographic distri-bution of primary care providers and specialty care provid-ers” (174).
However, the lack of data on race and ethnicity in health plans creates a barrier to assessing the quality of care for mi-nority patients. The Minority Health Report Card Project, a collaborative effort of Michigan State University, the Henry Ford Health System, Lovelace Clinic Foundation, the Uni-versity of Texas School of Public Health, and eight health plans, was developed in 1998 to assess health care disparities among different racial/ethnic groups in managed care. Man-aged care plans usually do not collect data by race, but the project determined other ways to assess health care quality for racial and ethnic groups (177,178).
Research also shows that, although Federal regulations require each State to submit a cultural competence plan for provision of services, States have varying contract require-ments for their Medicaid managed care organizations. Some States collect data, but do not use this information to assess compliance with cultural competence standards. In some States, no specific penalties exist, and compliance is not en-forced (176).
1998 Recommendations To Be Attained
1. A need exists to determine desired outcomes for cultural competence instruction as well the most effective methods to teach and assess cultural competence for medical students and residents.
2. Evaluation is considered critical to any program, and much information is available regarding evaluation of cultural competence and cultural competency training. Nevertheless, a lack of in-formation exists regarding results of evaluation.

SEVENTEENTH REPORT OF COGME 36
Lack of evaluation or training outcomes contrib-utes to the uncertainty about how and what to teach medical students regarding cultural com-petence and about whether and to what extent cultural competency training improves health care.
3. Few medical schools have required courses spe-cifically dedicated to cultural competence. Stan-dards are needed for incorporating cultural com-petence training into medical school curricula.
4. The extent and kind of cultural competency training in residencies and CME need to be iden-tified.
5. Not only are specific targets for increasing mi-nority physician representation in managed care not being met, but managed care plans appear to have difficulty recruiting minority physicians because of low numbers of minority physicians entering the health care workforce.
6. Although National standards exist, State con-tract language requiring cultural competence in managed care organizations needs to be specific and enforced.
Evaluation Considerations
1. The varied definitions of cultural competence and approaches to cultural competence instruc-tion suggest a need for further research and discussion to determine key objectives, desired outcomes, and ways to measure progress toward those outcomes in medical education. A National conference should be held at which these issues can be more fully addressed.
2. A need exists for more models that can be applied to classroom and other training venues for health care providers. Such models might include sam-ple cultural competence courses, course syllabi, or other modes of education delivery; methods of implementing cultural competence training and practice; and more assessment of problems with and successes of various methods of cultural competency training.
3. Evaluation data need to be collected and dis-seminated regarding the impact of cultural com-petence curricula and training. Several kinds of evaluations are needed:
• Assessment of participants’ responses to cultural competence programs: To what extent do educators encounter student
resistance to the importance of cultural competency training, particularly when such training must compete with other training priorities, including basic sci-ences and clinical clerkships?
• Assessment of learners’ perceptions of their training: Have they attained the knowledge, skills, and attitudes that will help them provide culturally competent care?
• Assessment of the impact of cultural competency training program: Do pa-tients believe they have been treated in ways that indicate culturally competent providers and organizational policies that reduce cultural or language barri-ers to health care?
• Prioritization of the objectives of cultur-al competency training to determine the most appropriate outcomes measures: Is the objective to provide better care, to attract more patients from certain cul-tural groups, to retain patients already receiving care, or some combination of these outcomes?
4. A need exists to identify desired competencies for cultural competency training across the con-tinuum of medical education (undergraduate through CME). Also, the best ways to ensure that medical students and physicians attain these competencies and the most effective ways to as-sess the extent to which they achieve those com-petencies need to be identified.
5. The “hidden curriculum” should be assessed. What are learners’ attitudes about the impor-tance of cultural competence? A well-established formal curriculum may be undermined in the in-formal networks of student life, and those factors should be recognized and assessed.
6. Health care organizations that manage care need to have aggressive plans for recruiting minority physicians.
7. The National Committee for Quality Assurance requires managed care organizations to address members’ cultural needs and desires. A summary of how those standards are being met would be helpful.
8. More research is warranted to assess the extent that States evaluate their cultural competence
SEVENTEENTH REPORT OF COGME 37
monitoring and enforcement procedures. Clear indicators for accountability and penalties in their contracts with managed care organizations need to be developed.
9. Health care organizations should be encouraged to use existing data from other sources to identify and address disparities in access to care and qual-ity of care for patients at these organizations.
ENSURING CULTURAL COMPETENCE IN MEDICINE:RECOMMENDATIONS
1. The varied definitions of cultural competence and approaches to cultural competence instruc-
tion indicate a need for further research and discussion to determine key objectives, desired outcomes and competencies, and ways to assess progress toward those outcomes in medical edu-cation. A National conference should be held at which these issues can be more fully addressed.
2. Data are needed to determine whether cultural competency training enables medical students, residents, and physicians to become more cultur-ally competent and whether that training affects patient outcomes.
3. The Federation of State Medical Boards should encourage individual State licensing boards to institute voluntary cultural competency training for physicians.

SEVENTEENTH REPORT OF COGME 38

SEVENTEENTH REPORT OF COGME 39
1. United States Department of Health and Human Services (DHHS). Council on Graduate Medical Education. Minorities in medicine. Rockville(MD): DHHS; 1998:3-4.
2. Association of American Medical Colleges (AAMC). Frequently asked questions and answers about the new underrepresented in medicine definition. Washington: AAMC; 2003:1.
3. Cooper RA. Impact of trends in primary, secondary, and postsecondary education on applications to medical school. II: considerations of race, ethnicity, and income. Academic Medicine 2003;78:864-76.
4. United States Department of Education. National Center for Education Statistics. Access to postsecondary education for the 1992 high school graduates. Washington: Department of Education; 1997. Retrieved April 25, 2004, from URL: http://nces.ed.gov/pubsearch/pubsinfo.asp?pubid=98105
5. AAMC. AAMC data book: statistical information related to medical schools and teaching hospitals. Table B2. Washington: AAMC; 2003:9-11.
6. United States Department of Education. Digest of education statistics, 2002. Chapter 3. Postsecondary education. Retrieved April 19, 2004, from URL: http://www.nces.ed.gov/programs/digest/d02/tables/ dt264.asp
7. United States DHHS. Office of Disease Prevention and Health Promotion. Healthy People 2010. A systematic approach to health improvement. Retrieved November 16, 2003, from URL: http://www.healthypeople.gov/Document/html/uih/uih_bw/uih_2.htm
8. Ferguson WJ, Candib LM. Culture, language, and the doctor-patient relationship. Family Medicine 2002;34(5):353-61.
9. Flores G, Abreu M, Olivar MA, Kastner B. Access barriers to health care for Latino children. Archives of Pediatric Adolescent Medicine 1998;152:1119-25.
10. Saha S, Taggart SH, Komaromy M, Bindman AB. Do patients choose physicians of their own race? Health Affairs 2000;19(4):76-83.
11. Phillips KA, Mayer ML, Aday LA. Barriers to care among racial/ethnic groups under managed care. Health Affairs 2000;19(4):65-75.
Bibliography
12. Todd KH, Deaton C, Adamo AP, Gee L. Ethnicity and analgesic practice. Annals of Emergency Medicine 2000;35(1):11-16.
13. Schneider EC, Zaslavsky AM, Epstein AM. Racial disparities in quality of care for enrollees in Medicare managed care. Journal of the American Medical Association 2002; 287(10):1288-94.
14. Collins KS, Tenney K, Hughes D. Quality of health care for African Americans: Findings from the Commonwealth Fund 2001 Health Care Quality Survey. New York: The Commonwealth Fund; 2002. Factsheet. Pub #524. Retrieved July 23, 2003, from URL: http://www.cmwf.org/programs/minority/collins_africanamerican_fs_524.pdf
15. Weech-Maldonado R, Morales LS, Elliott M, Spritzer K, Marshall G, Hays RD. Race/Ethnicity, language, and patients’ assessments of care in Medicaid managed care. Health Services Research 2003;38(3):789-807.
16. Carrasquillo O, Orav J, Brennan TA, Burstin HR. Impact of language barriers on patient satisfaction in an emergency department. Journal of General Internal Medicine 1999;14:82-87.
17. Baker DW, Hayes R, Fortier JP. Interpreter use and satisfaction with interpersonal aspects of care for Spanish-speaking patients. Medical Care 1998;36(10):1461-70.
18. Kington R, Tisnado D, Carlisle D. Increasing racial and ethnic diversity among physicians: an intervention to address health disparities? The right thing to do, the smart thing to do: enhancing diversity in the health professions. Washington: National Academy Press; 2001:57-90.
19. Brotherton SE, Stoddard JJ, Tsang, SS. Minority and nonminority pediatricians’ care of minority and poor children. Archives of Pediatric Adolescent Medicine 2000;154:912-17.
20. Fryer GE, Green LA, Vojir CP, Krugman RD, Miyoshi TJ, Stine C, et al. Hispanic versus white, non-Hispanic physician medical practices in Colorado. Journal of Health Care for the Poor and Underserved 2001;12(3):342-51.
21. Bach PB, Pham HH, Schrag D, Tate RC, Hargraves JL. Primary care physicians who treat blacks and whites. New England Journal of Medicine 2004;351(6):603-05.
SEVENTEENTH REPORT OF COGME 40
22. United States Census Bureau. Projections of the resident population by race, Hispanic origin, and nativity: Middle Series. Retrieved November 16, 2003, from URL: http://www.census.gov/population/projections/nation/summary/np-t5-a.txt
23. National Center for Cultural Competence. Georgetown University. Module 2: Cultural competence. “Definitions.” Retrieved June 6, 2003, from URL: http://www.gwu.edu/~iscopes/Cultcomp.htm
24. United States DHHS. Agency for Healthcare Research and Quality (AHRQ). Can cultural competency reduce racial and ethnic health disparities? A review and conceptual model. Rpt. Medical Care Research and Review 2000;S57:181-217.
25. Whitcomb ME. Preparing doctors for a multicultural world. Academic Medicine 2003;78(6):547.
26. United States DHHS. Office of Minority Health. National standards for culturally and linguistically appropriate services in health care. Executive summary. Washington: DHHS; 2001:ix. URL: http://www.omhrc.gov/omh/programs/2pqprograms/finalreport.pdf
27. Pridaux D. Cultural identity and representing culture in medical education: who does it? [editorial]. Medical Education 2001;35:186-87.
28. Kagawa-Singer M, Kassim-Lakha S. A strategy to reduce cross-cultural miscommunication and increase the likelihood of improving health outcomes. Academic Medicine 2003;78:577-87.
29. Tervalon M. Components of culture in health for medical students’ education. Academic Medicine 2003; 78:570-76.
30. The California Endowment. Principles and recommended standards for cultural competence education of health care professionals. Woodland Hills(CA): California Endowment; 2003. Retrieved July 23, 2003, from URL: http://www.calendow.org/pub/publications/principles_standards.pdf
31. The National Academy of Sciences. Health professions education: a bridge to quality. Washington: The Academy; 2003:4.
32. AAMC. Diversity Initiatives. Retrieved July 22, 2003, from URL: http://www.aamc.org/diversity/ initiatives.htm
33. Betancourt JR, Green AR, Carrillo JE. Cultural competence in health care: emerging frameworks and practical approaches. Field Report. New York: The
Commonwealth Fund; 2002. Retrieved October 27, 2003, from URL: http://www.cmwf.org/programs/minority/betancourt_culturalcompetence_576.pdf
34. American Medical Association (AMA). Cultural competence compendium. Retrieved July 19, 2003, from URL: http://www.ama-assn.org/ama/pub/printcat/4848.html
35. American Association of Health Plans. Audio conference. Making the case for cultural competencies in health care. April 10, 2003.
36. Kaiser Permanente. A provider’s handbook on culturally competent care: African American population. Oakland(CA): Kaiser Permanente; 1999.
37. Kaiser Permanente. A provider’s handbook on culturally competent care: Latino population. Oakland(CA): Kaiser Permanente; 2000.
38. Liaison Committee on Medical Education. LCME Accreditation Standards. Functions & structure of a medical School, part 2. Retrieved July 19, 2003, from URL: http://www.lcme.org/functionslist.htm
39. Batalden P, Leach D, Swing S, Dreyfus H, Dreyfus, S. General Competencies and Accreditation in Graduate Medical Education. Health Affairs 2002;21(5):103-11.
40. Accreditation Council on Graduate Medical Education. ACGME outcome project. General competencies. Retrieved July 19, 2003, from URL: http://www.acgme.org/outcome/comp/compFull.asp
41. AAMC. Minority students in medical education: facts and figures XII. Washington: AAMC; 2002:44.
42. Institute of Medicine. In the nation’s compelling interest: ensuring diversity in the health care workforce. Prepublication Copy. Washington: The Institute; 2004.
43. AAMC. Assessing medical school admissions policies: implications of the U.S. Supreme Court’s affirmative-action decisions. Washington: AAMC; 2003:9-12. Retrieved November 20, 2003, from URL: http://www.aamc.org/meded/urm/urmfaq.pdf
44. Deville K. Trust, patient well-being and affirmative action in medical school admissions. The Mount Sinai Journal of Medicine 1999;66(4):247-56.
45. Edwards JC, Elam CL, Wagoner NE. An admission model for medical schools. Academic Medicine 2001;76:1207-12.

SEVENTEENTH REPORT OF COGME 41
46. Tekian A. Minority students, affirmative action, and the admission process: a literature review, 1987-1998. Teaching and Learning in Medicine 2000;12(1):33-42.
47. Gonzalez P, Stoll B. The color of medicine: strategies for increasing diversity in the U.S. physician workforce. Boston: Community Catalyst; 2002:11-12.
48. Clawson DK. Challenges and opportunities of racial diversity in medical education. Clinical Orthopaedics and Related Research 1999;362:34-39.
49. Magnus SA, Mick, SS. Medical schools, affirmative action, and the neglected role of social class. American Journal of Public Health 2000;90(8):1197-1201.
50. AAMC. Expanded Minority Admissions Exercise. Retrieved August 18, 2003, from URL: http://www.aamc.org/meded/minority/emae/start.htm
51. United States Department of Education. Race-neutral alternatives in postsecondary education. Retrieved November 22, 2003, from URL: http://www.ed.gov/about/offices/list/ocr/edlite-raceneutralreport.html
52. United States Department of Education. Race-neutral approaches to diversity. Retrieved November 22, 2003, from URL: http://www.ed.gov/about/offices/list/ocr/raceneutral.html?exp=0
53. AAMC. Minority students in medical education. Table 4a:95.
54. White House. President highlights progress in education reform. Retrieved August 8, 2003, from URL: http://www.whitehouse.gov/news/releases/2003/06/20030610-4.html
55. United States Department of Education. Office of Public Affairs. Paige marks 18-month anniversary of No Child Left Behind Act with update to Congress [press release]. July 8, 2003.
56. United States Department of Education. Mathematics and Science Initiative. What organizations are doing to improve mathematics and science education. Retrieved July 21, 2003, from URL: http://www.ed.gov/inits/mathscience/descriptions/index.html
57. United States Department of Education. Upward Bound Math and Science Program. Retrieved July 18, 2003, from URL: http://www.ed.gov/offices/OPE/HEP/trio/math-sci.html
58. United States Department of Health and Human Services. Office of Minority Health. About the Tribal Colleges and Universities Initiative. Retrieved July
23, 2003, from URL: http://www.omhrc.gov/omh/tribal%20colleges/2pgTCU/Aboutthe.htm
59. White House. Advisors for Historically Black Colleges and University. February 2002. Retrieved November 8, 2003, from URL: http://www.whitehouse.gov/news/releases/2002/02/20020212-3.html
60. White House. White House Initiative on Educational Excellence for Hispanic Americans. Retrieved November 8, 2003, from URL: http://www.yic.gov/wwa/index.html
61. White House. The road to a college diploma: the complex reality of raising educational achievement for Hispanics in the United States. Initiative on Educational Excellence for Hispanic Americans. Retrieved November 8, 2003, from URL: http://www.yic.gov/paceea/press/interim.html
62. Butler WT. Project 3000 by 2000: progress during tumultuous times. Academic Medicine 1999;74(4):308-09.
63. Lumina Foundation. Lumina Foundation announces nearly $10 million in grants to improve college access [news release]. Retrieved July 23, 2003, from URL: www.luminafoundation.org/newsroom/archive_2002/index.html
64. AAMC. Minority Medical Education Program. Retrieved July 20, 2003, from URL: http://www.aamc.org/students/minorities/mmep
65. Blakely AW, Broussard LG. Blueprint for establishing an effective postbaccalaureate medical school pre-entry program for educationally disadvantaged students. Academic Medicine 2003;78:437-47.
66. Jackson WE, McGlinn, Rainey M, Bardo H. MEDPREP—30 years of making a difference. Academic Medicine 2003;78:448-53.
67. Giordani B, Edwards AM, Segal SS, Gillum LH, Lindsay A, Johnson N. Effectiveness of a formal post-baccalaureate pre-medical program for underrepresented minority students. Academic Medicine 2001;76: 844-48.
68. Strayhorn G. A pre-admission program for underrepresented minority and disadvantaged students. Academic Medicine 2000;75(4):355-61.
69. Tekian A, Jalovecky MJ, Hruska L. The impact of mentoring and advising at-risk underrepresented minority students on medical school performance. Academic Medicine 2001:76:1264.

SEVENTEENTH REPORT OF COGME 42
70. Abernathy AD. A mentoring program for underrepresented students at the University of Rochester School of Medicine. Academic Medicine 1999;74(4):356-59.
71. Fang WL, Woode MKA, Carey RM, Apprey M, Schuyler JM, Atkins-Brady TL. The Medical Academic Advancement Program at the University of Virginia School of Medicine. Academic Medicine 1999;74(4):366-69.
72. Girotti JA. The Urban Health Program to encourage minority enrollment at the University of Illinois at Chicago College of Medicine. Academic Medicine 1999;74(4):370-72.
73. Hardy VD. Premedical enrichment program at East Carolina School of Medicine. Academic Medicine 1999;74(4):373-75.
74. Segal SS, Biordani B, Gillum LH, Johnson N. The Academic Support Program at the University of Michigan School of Medicine. Academic Medicine 1999;74(4):383-85.
75. Thompson HC, Weiser MA. Support programs for minority students at Ohio University College of Osteopathic Medicine. Academic Medicine 1999:74(4):390-92.
76. Whitten CF. Postbaccalaureate Program at Wayne State University School of Medicine: a 30-year report. Academic Medicine 1999:74(4):393-96.
77. Williams MT. Pre-matriculation program at the University of Florida College of Medicine. Academic Medicine 1999:74(4):397-99.
78. Soto-Greene M, Wright L, Gona OD, Feldman LA. Minority enrichment programs at the New Jersey Medical School: 26 Years in Review. Academic Medicine 1999;74(4):386-89.
79. Carline JD, Patterson DG, Davis LA, Irby DM. Precollege enrichment programs intended to increase the representation of minorities in medicine. Academic Medicine 1998;73(3):288-98.
80. United States DHHS. Health Resources and Services Administration (HRSA). Health Careers Opportunities. Retrieved August 8, 2003, from URL: http://bhpr.hrsa.gov/grants/applications/03hcop.htm
81. United States DHHS. HRSA. Centers of Excellence. Retrieved August 8, 2003, from URL: http://bhpr.hrsa.gov/grants/applications/03coe.htm
82. Fincher RME, Sykes-Brown W, Allen-Noble R. Health Science Learning Academy: a successful “pipeline” educational program for high school students. Academic Medicine 2002;77:737-38.
83. Thomson WA, Ferry PA, King JE, Martinez-Wedig C, Michael LH. Increasing access to medical education for students from medically underserved communities: one program’s success. Academic Medicine 2003;78:454-59.
84. Newman PR, Newman BM. What does it take to have a positive impact on minority students’ college retention? Adolescence 1999;34(135):483-92.
85. Ramsey PG, Coombs JB, Hunt DD, Marshall SG, Wenrich MD. From concept to culture. The WWAMI program at the University of Washington School of Medicine. Academic Medicine 2001;76:765-75.
86. Carline JD, Patterson DG. Characteristics of health professions schools, public school systems, and community-based organizations in successful partnerships to increase the numbers of underrepresented minority students entering health professions education. Academic Medicine 2003;78:467-82.
87. Harvard University. Four Directions Summer Research Project. Retrieved August 14, 2003, at URL: http://www.hms.harvard.edu/dms/diversity/fdsrpintro.html
88. University of Minnesota. The Center of American Indian and Minority Health. Native Americans into Medicine. Retrieved July 19, 2003, from URL: http://www.d.umn.edu/medweb/caimh/NAM.htm
89. University of Minnesota. The Center of American Indian and Minority Health. UM INMED. Retrieved July 19, 2003, from URL: http://www.d.umn.edu/medweb/caimh/preceptorship.htm
90. Crump R, Byrne M, Joshua M. The University of Louisville Medical School’s comprehensive programs to increase its percentage of underrepresented-minority students. Academic Medicine 1999;74(4):315-17.
91. Curran-Everett D, Collins S, Hubert J, Pidick T. Science education partnership between the University of Colorado and a Denver high school. Academic Medicine 1999;74(4):322-25.
92. DeRosa DA, Phillips C. Boston University’s Biosciences Education Program for Boston-area students. Academic Medicine 1999;74(4):326-28.

SEVENTEENTH REPORT OF COGME 43
93. Doyle HJ. UCSF partnership to enrich science teaching for sixth graders in San Francisco. Academic Medicine 1999;74(4):329-31.
94. Goodell E, Visco R, Pollock P. A program to enhance K-12 science education in ten rural New York school districts. Academic Medicine 1999;74(4):332-35.
95. Helm EG, Parker JE, Russell MC. Education and career paths of LSU’s Summer Science Program Students from 1985 to 1997. Academic Medicine 1999;74(4):336-38.
96. Little D, Izutsu S, Judd N, Else I. A medical school-based program to encourage native Hawaiians to choose medical careers. Academic Medicine 1999;74(4):339-41.
97. Moore CJ, May VL, Abusharbain E. Partnership to engage St. Louis high school students in investigative Genetics. Academic Medicine 1999;74(4):342-44.
98. Moreno NP, Tharp BZ. An interdisciplinary national program developed at Baylor to make science exciting for all K-5 Students. Academic Medicine 1999;74(4):345-47.
99. Palacio-Cayetano J, Kanowith-Klein S, Stevens R. UCLA’s outreach program of science education in the Los Angeles Schools. Academic Medicine 1999;74(4):348-51.
100. Rye JA, Chester AL. WVU-community partnership that provides science and math enrichment for underrepresented high school students. Academic Medicine 1999;74(4):352-55.
101. Castro GA, Bouldin PH, Farver DW, Maugans LA, Sander LC, Booker J. The Intercon Network: a program for education partnerships at the University of Texas-Houston Health Science Center. Academic Medicine 1999;74(4):363-65.
102. Wilson JE, Murphy L. Premedical and predental enrichment program for minority students, 1969-1996, at Meharry Medical College. Academic Medicine 1999;74(4):400-02.
103. Anderson S. Pipeline programs: looking forward to promote diversity. AAMC Reporter. Washington, DC;September 2003. Retrieved November 20, 2003, from URL: http://aamc.org/newsroom/reporter/sept03/pipeline.htm
104. Malloy, Michael. Filling the pipeline: a “Doctor’s Academy” high-school program in California graduates its first class. AAMC Reporter. Washington: AAMC; June 2003. Retrieved November 20, 2003, from
URL: http://aamc.org/newsroom/reporter/june03/pipeline.htm
105. A Better Chance. Retrieved August 12, 2004, from URL: http://www.abetterchance.org
106. AAMC. Learning from others: a literature review and how-to guide from the Health Professions Partnership Initiative; 2004.
107. United States Department of Education. National Center for Education Statistics. Findings from the condition of education 1998. College access and affordability. Washington: Department of Education; 1999:5-6. Retrieved April 25, 2004, from URL: http://nces.ed.gov/pubs99/1999108.pdf
108. United States Census Bureau. Historical poverty tables. Table 4. Poverty status of families, by type of family, presence of related children, race, and Hispanic origin: 1959 to 2002. Retrieved November 17, 2003, from URL: http://www.census.gov/hhes/poverty/histpov/hstpov4.html
109. United States Department of Health and Human Services. Health Resources and Services Administration. Kids into Health Careers: history. Retrieved August 8, 2003, from URL: http://bhpr.hrsa.gov/kidscareers/introduction.htm
110. United States Department of Health and Human Services. Health Resources and Services Administration. Health Careers Diversity and Development. Weiss S, Gatling A. Health Careers Adopt-A-School Program. PowerPoint Presentation. April 2002.
111. American Medical Association. Doctors Back to School. AMA Doctors Back to School program inspires new generation of physicians. Retrieved July 19, 2003, from URL: http://www.ama-assn.org/ama/pub/category/7131.html
112. AAMC. Medical career fairs. Retrieved August 17, 2004, URL: http://www.aamc.org/students/minorities/medicalcareerfair.htm
113. Society for Advancement of Chicanos and Native Americans in Science. Retrieved July 20, 2003, from URL: http://www.sacnas.org
114. Cunningham SL, Kunselman MM. University of Washington and partners’ program to teach middle school students about neuroscience and science careers. Academic Medicine 1999;74(4): 318-321.
115. Association of American Indian Physicians. National Native American Youth Initiative. Retrieved July 19,

SEVENTEENTH REPORT OF COGME 44
2003, from URL: http://www.aaip.com/activities/nnayi/nnayi.html
116. Sirica C. Scientists use radio to reach out to kids. Science 27 June 2003; 300(5628): 2050-2051.
117. Gonzalez P, Stoll B:19.
118. Edmond MB, Deschenes JL, Eckler M, Wenzel, RP. Racial bias in using USMLE Step I scores to grant internal medicine residency interviews. Academic Medicine 2001;76:1253-56.
119. AAMC. Minority students in medical education. Table 7:99.
120. AAMC. AAMC data book:47.
121. AAMC. Minority students in medical education. Table 17a:116.
122. AAMC. Minority students in medical education. Table 17c:118.
123. AAMC. Minority students in medical education:35.
124. AAMC. Minority students in medical education:54.
125. AAMC. Minority students in medical education:119.
126. AAMC. Minority students in medical education: 59.
127. American Association of Colleges of Osteopathic Medicine (AACOM). Tables on factors affecting specialty choice. Lorrie Van Akkeren. Chevy Chase(MD): AACOM; 2003.
128. AAMC. Minority students in medical education: 49.
129. Palepu A, Carr PL, Friedman RH, Ash AS, Moskowitz MA. Specialty choices, compensation, and career satisfaction of underrepresented minority faculty in academic medicine. Academic Medicine 2000;75:157-60.
130. AAMC. AAMC Faculty Roster. December 31, 2002. Retrieved July 14, 2003, from URL: http://www.aamc.org/data/facultyroster/usmsf02/table3.xls
131. AAMC. AAMC Faculty Roster. December 31, 1998. Retrieved July 14, 2003, from URL: http://www.aamc.org/data/facultyroster/usmsf98/table3.xls
132. AACOM. Tables on U.S. osteopathic medical school faculty by race/Hispanic origin, 2001-2002 and 1998-1999. Lorrie Van Akkeren. Chevy Chase(MD): AACOM; 2003.
133. Bristol-Myers Squibb. Newsroom. Minority students from the nation’s top medical schools discuss health disparities and medical careers with high school students. Retrieved July 29, 2003, from URL: http://www.bms.com/news/press/data/fg_press_release_3430.html
134. Wong EY, et al. Promoting the advancement of minority women faculty in academic medicine: the National Centers of Excellence in Women’s Health. Journal of Women’s Health & Gender-based Medicine 2001;10(6):541-50.
135. AAMC. Liaison Committee on Medical Education Part II Annual Medical School Questionnaire for 2000-2001. Number of U.S. medical schools teaching selected topics. Compiled by the AAMC Institutional Profile System. Retrieved from URL: http://services.aamc.org/currdir/section2/LCMEHotTopics.pdf
136. Dogra N, Karnik N. First-year medical students’ attitudes toward diversity and its teaching: an investigation at one U.S. medical school. Academic Medicine 2003;78:1191-1200.
137. Beagan B. Teaching social and cultural awareness to medical students: “it’s all very nice to talk about it in theory, but ultimately it makes no difference.” Academic Medicine 2003;78:605-14.
138. Wear D. Insurgent multiculturalism: rethinking how and why we teach culture in medical education. Academic Medicine 2003;78(6):549-54.
139. Taylor JS. Confronting “culture” in medicine’s “culture of no culture.” Academic Medicine 2003;78(6):555-59.
140. Wright SM, Carrese JA. Serving as a physician role model for a diverse population of medical learners. Academic Medicine 2003;78:623-28.
141. Donini-Lenhoff FG, Hedrick HL. Increasing awareness and implementation of cultural competence principles in health professions education. Journal of Allied Health 2000;29(4):241-45.
142. Dolhum EP, Munoz C, Grumbach, K. Cross-cultural education in U.S. medical schools: development of an assessment tool. Academic Medicine 2003;78:615-22.
143. Electronic Resource Center. Management Sciences for Health. The provider’s guide to quality and culture. Retrieved on July 2, 2003, from URL: http://erc.msh.org/mainpage.cfm?file=1.0.htm&module=provider&language=English
SEVENTEENTH REPORT OF COGME 45
144. United States DHHS. HRSA. Center for Health Care Services Financing and Managed Care. Satellite broadcast—cross-cultural communication in health care. Retrieved on August 7, 2003, at URL: http://www.hrsa.gov/financeMC/broadcast
145. United States DHHS. HRSA. Indicators of cultural competence in health care delivery organizations: an organizational cultural competence assessment profile. April 2002. Retrieved August 13, 2003, from URL: http://www.hrsa.gov/OMH/cultural1.htm
146. United States DHHS. HRSA. Health Resources Services Administration study on measuring cultural competence in health care delivery settings: a review of the literature. September 2001. Retrieved October 16, 2003, from URL: http://www.hrsa.gov/OMH/cultural/cultural.htm
147. United States DHHS. HRSA. Bureau of Primary Health Care. Some facts about cultural competency. Bethesda(MD): DHHS; 2001.
148. United States DHHS. HRSA. Managed Care Technical Assistance Center. Cultural competence workshops and technical assistance. Retrieved July 23, 2003, from URL: http://www.jsi.com/hrsamctac/documents/Cultural_Competence.pdf
149. Franklin, G. California’s approach to ensuring cultural competent healthcare services in Medicaid managed care and SCHIP health plans. Bridging cultures and enhancing managed care. Conference proceedings. Rockville(MD): HRSA and American Public Human Services Association; 2002:19-22.
150. Hall G, Nieri P. Arizona Health Care Cost Containment System (AHCCCS) plans and the provider pocket guide. Bridging cultures and enhancing managed care: 22-24.
151. McNeil J. Model of cultural competency for working with African American patients with HIV. Bridging cultures and enhancing managed care: 26-28.
152. Arao-Nguyen, S. Enhancing family-centered care in managed care organizations. Bridging cultures and enhancing managed care: 29-30.
153. McNees M. Addressing cultural and linguistic diversity in the community health center environment: The Sunset Park Family Health Center Network. Bridging cultures and Enhancing Managed Care:31-33.
154. United States DHHS. HRSA. Cultural competence works: using cultural competence to improve the quality of health care for diverse populations and add value to managed care arrangements. Rockville(MD): DHHS; 2001:1.
155. United States DHHS. AHRQ. Reducing disparities through culturally competent health care: an analysis of the business case. Bethesda(MD): DHHS; 2000; rpt. Brach C, Fraser I. Medical Care Research and Review 2000;57(S1):181-217.
156. United States DHHS. AHRQ. National healthcare disparities report. Bethesda(MD): DHHS; 2003. Retrieved January 19, 2004, from URL: http://www.qualitytools.ahrq.gov
157. National Center for Cultural Competence. Georgetown University. Module 2: Cultural competence. “Learning objectives.” Retrieved June 6, 2003, from URL: http://www.gwu.edu/~iscopes/Cultcomp.htm
158. Kaiser Permanente. Community Wellness Library. Clinical videoconferencing network. Retrieved August 20, 2003, from URL: http://www.crewnoble.com/KPWellness/ceu_order.html
159. Adams D. NMA, AMA, other groups launch initiative to cut health care disparities. Amednews.com. Retrieved August 2, 2003, from URL: http://www.ama-assn.org/sci-pubs/amnews/pick_02/prsc1028.htm
160. Ambulatory Pediatric Association. Pediatric General Competencies. Retrieved on August 3, 2003, from URL: http://www.ambpeds.org/egtest/pedicompquad.htm
161. Ambulatory Pediatric Association. Update on revision of the APA. Educational guidelines for residency training in general pediatrics (as of 6-3-02). Retrieved on August 3, 2003, from URL: http://www.ambpeds.org/guidelines/index.cfm
162. United States Medical Licensing Examination. Step 3 purpose and content. Clinical context of Step 3. Retrieved July 25, 2003, from URL: http://www.usmle.org/step3/clincon.htm
163. Accreditation Council for Continuing Medical Education. Accreditation policies. Definition of CME. Retrieved August 4, 2003, from URL: http://www.aacme.org/incoming/pol_05_def_cmd.pdf
164. University of California Continuing Medical Education. Retrieved August 6, 2003, from URL: http://cme.ucop.edu/listing.php?event_id=492
165. University of Vermont. College of Medicine. Continuing Medical Education. Third annual cultural conference workshop. April 28, 2003. Retrieved August 6, 2003, from URL: http://cme.uvm.edu/sell.asp?s=Sell&EventId=2857
SEVENTEENTH REPORT OF COGME 46
166. State of New York. New York State Assembly. Bill Summary A07991. E-mail Correspondence. Hoferer J, Cain, F. Federation of State Medical Boards. Retrieved August 17, 2004, from URL: http://www.senate.state.ny.us
167. State of New Jersey. Bills 2004-2005. Bills S144 and A492. E-mail Correspondence. Hoferer J, Cain F. Federation of State Medical Boards. Retrieved August 17, 2004, from URL: http://www.njleg.state.nj.us
168. State of California. 2003 Sessions. CA Assembly Bill 801. E-mail Correspondence. Hoferer J, Cain F. Federation of State Medical Boards. Retrieved August 17, 2004, from URL: http://www.leginfo.ca.gov/pub/bill/asm/ab_0801-0850/ab_801_bill_20030630_amended_sen.html
169. State of Illinois. Illinois General Assembly. Bill SB3067. E-mail Correspondence. Hoferer J, Cain F. Federation of State Medical Boards. Retrieved August 17, 2004, from URL: http://www.legis.state.il.us
170. United States DHHS. AHRQ. Planning culturally and linguistically appropriate services: a guide for managed care plans. Summary. February 2003. Retrieved on July1, 2003, from URL: http://www.ahrq.gov/about/cods/plancias.htm
171. United States DHHS. AHRQ. Oral, linguistic, and culturally competent services: guides for managed care plans. Retrieved on July1, 2003, from URL: http://www.achcpr.gov/about/cods/cultcomp.htm
172. United States DHHS. AHRQ. Providing oral linguistic services: a guide for managed care plans. Summary. February 2003. Retrieved on July1, 2003, from URL: http://www.ahrq.gov/about/cods/oralling.htm
173. United States DHHS. Centers for Medicare & Medicaid Services. Conditions of participation. Conditions for coverage. Quality improvement system for managed care. Retrieved July 1, 2003, from URL: http://www.cms.hhs.gov/cop/2d.asp
174. National Committee for Quality Assurance. Policy technical support. Gitimu C. E-mail correspondence. August 7, 2003.
175. George Washington University Medical Center School of Public Health and Health Services. Optional purchasing specifications: cultural competence in the delivery of services through Medicaid managed care—a technical assistance document;2001:1,5-6.
176. Stork E, Scholle S, Greeno C, Copeland VC, Kelleher K. Monitoring and enforcing cultural competence in
Medicaid managed behavioral health care. Mental Health Services Research 2001;3(3):169-177.
177. Nerenz DR, Gunter MJ, Garcia M, Green-Weir RR, Wisdom K, Joseph C. Developing a Health plan report card on quality of care for minority populations [field report]. New York: The Commonwealth Fund; 2002. Retrieved August 10, 2003, from URL: http://www.cmwf.org/publist/publist2.asp?CategoryID=13
178. Nerenz DR, Bonham VL, Green-Weir R, Joseph C, Gunter M. Eliminating racial/ethnic disparities in health care: can health plans generate reports? Health Affairs 2002;21(3):259-263.
179. AAMC. Government Affairs and Advocacy. Democrats introduce minority health bill. November 14, 2003. Retrieved November 16, 2003, from URL: http://www.aamc.org/advocacy/library/washhigh/2003/111403/_4.htm
180 United States Census Bureau. Detailed Tables—American FactFinder. P4. Hispanic or Latino, and not Hispanic or Latino by race. Census 2000 Summary File 1. Retrieved November 16, 2003, from URL: http://factfinder.census.gov/serlet/DTTable?_ts=87297641703
181. Rivadeneyra R, Elderkin-Thompson V, Silver RC, Waitzkin H. Patient centeredness in medical encounters requiring an interpreter. American Journal of Medicine 2000;108:470-74.
182. Jacobs EA, Lauderdale DS, Meltzer D, Shorey JM, Levinson W, Thisted RA. Impact of interpreter services on delivery of health care to limited-English-proficient patients. Journal of General Internal Medicine 2001;16:468-74.
183. United States DHHS. Centers for Disease Control and Prevention (CDC). National Center for Health Statistics (NCHS). Highlights: major findings. Health, United States, 2003. Retrieved November 17, 2003, from URL: www.cdd.gov/nchs/products/pubs/pubd/hus/highlits.pdf
184. United States Census Bureau. Poverty in the United States: 2002. Washington: Census Bureau; 2003. Retrieved November 19, 2003, from URL: http://www.census.gov/prod/2003pubs/p60-222.pdf
185. United States Census Bureau. American Factfinder. Census 2000 Summary File 4. Detailed Tables. PCT86. Sex by occupation for the employed civilian population 16 years and older. Retrieved November 10, 2003, from URL: http://factfinder.census.gov/servlet/DTTable

SEVENTEENTH REPORT OF COGME 47
186. AAMC. Newsroom. Applicants to U.S. medical schools increase. Retrieved November 16, 2003, from URL: http://www.aamc.org/newsroom/pressrel/2003/031104.htm
187. AAMC. AAMC data book. Table B5:16-18.
188. AACOM. 2002 Annual report on osteopathic medical education. Table 6. Chevy Chase(MD): AACOM; 2003:25.
189. United States DHHS. CDC. NCHS. National Vital Statistics Report. Table 17. Number, birth rate, and percent of births to unmarried women by age and race, and Hispanic origin of mother: United States, 2000. Hyattsville(MD): DHHS; 2002;50(5):46.
190. United States DHHS. CDC. NCHS. National Vital Statistics Report. Table 20. Birth rates by age and race of father: United States, 1980-2000. Hyattsville(MD): DHHS; Revised July 3, 2002;50(5):50.
191. Fry R. Hispanic youth dropping out of U.S. schools: measuring the challenge. Washington: Pew Hispanic Center; June 8, 2003.
192. AAMC. Minority students in medical education. Table 10a. Table 10b:104.
193. AACOM. 2002 Annual Report of Osteopathic Medical Education. Table 5. Chevy Chase(MD): AACOM; 2003:24.
194. AAMC. Minority students in medical education. Table 12a. Table 12b:107.
195. United States Department of Education. National Center for Education Statistics. Do gatekeeper courses expand education options? Washington: Department of Education; 1999. Retreived April 25, 2004, from URL: http://nces.ed.gov/pubsearch/pubsinfo.asp?pubid=1999303
196. American Medical Association. Amednews.com. Doctors divided over use of affirmative action by medical schools. Retrieved August 3, 2003, from URL: http://www.ama-assn.org/sci-pubs/amnews/pick_03.prsb0602.htm
197. Bollinger LC. The need for diversity in higher education. Academic Medicine 2003;78:431-36.
198. Whitla DK, Orfield G, Silen W, Teperow C, Howard C, Reede J. Educational benefits of diversity in medical school: a survey of students. Academic Medicine 2003;78:460-66.
199. McGaghie WC. Assessing readiness for medical education. 2002;288(9):1085-90.
200. Baker HH, Cope MK, Fisk R, Gorby JN, Foster RW. Relationship of preadmission variables and first- and second-year course performance to performance on the National Board of Osteopathic Medical Examiners’ COMLEX-USA Level 1 examination. Journal of the American Osteopathic Association 2000;100(3):153-61.
201. Tekian A, Han Y, Hruska L, Krainik AJ. Do underrepresented minority medical students differ from nonminority students in problem-solving ability? Teaching and Learning in Medicine 2001;13(2):86-91.
202. AACOM. Debts, plans and opinions of osteopathic medical students in 2002. Chevy Chase(MD): AACOM; 2003:13.
203. AAMC. Minority students in medical education. Table 17b:117.
204. AAMC. Minority students in medical education. Table 18:119.
205. AAMC. Minority students in medical education:60.
206. AAMC. Minority students in medical education:51.
207. AACOM. Debts, plans and opinions of osteopathic medical students in 2002:24.
208. AACOM. Debts, plans and opinions of osteopathic medical students in 2002. Table 6:21.
209. United States Department of Education. National Center for Education Statistics.1999-2000 National Postsecondary Student Aid Study. Percentage of undergraduates receiving financial aid for postsecondary education and among those receiving aid, the average amount of aid received: 1999-2000. NPSAS; 2000.
210. United States Department of Education. National Center for Education Statistics.1999-2000 National Postsecondary Student Aid Study. Average amount of financial aid received by aided full-time, full-year graduate and first-professional students, by source of aid, type of degree, and selected student characteristics: 1999-2000. NPSAS; 2000.
211. AACOM. Debts, plans and opinions of osteopathic medical students in 2002:40-41.
212. American Medical Association. Report of the council on medical education: USMLE—feedback on failing
SEVENTEENTH REPORT OF COGME 48
scores. Retrieved August 1, 2003, from URL: http://www.ama-assn.org/ama1/upload/mm/annual02/cme5a02.doc
213. Xu G, Veloski JJ, Hojat M. Board certification: associations with physicians’ demographics and performances during medical school and residency. Academic Medicine 1998;73:1283-89.
214. Kwakwa F, Jonasson O. The longitudinal study of surgical residents, 1994 to 1996. Journal of the American College of Surgeons 1999;188(6):575-85.
215. Rettie CS. Recruiting students into surgery. Journal of Surgical Research 2003;114(2):258.
216. Race matters in the university of the 21st century: report of the proceedings, October 4-5, 2002; Dartmouth College; 2003. Retrieved August 12, 2004, from URL: http://www.dartmouth.edu/~news/releases/2003/june/062503.html
217. Minority Medical Faculty Development Program, established by the Robert Wood Johnson Foundation. Retrieved from URL: http://www.mmfdp.org/about.htm
218. Pechura, CM. Programs of the Robert Wood Johnson Foundation to develop minority medical careers. American Journal of the Medical Sciences 2001;322(5):290-92.
219. The role of diversity in the training of health professionals. The right thing to do, the smart thing to do. Institute of Medicine. Washington: National Academy Press; 2001:52.
220. Cross TL, Bazron BJ, Dennis KW, Isaacs MR. Towards a culturally competent system of care: a monograph on effective services for minority children who are severely emotionally disturbed. Washington: CASSP Technical Assistance Center, Georgetown University Child Development Center; 1989.
221. Betancourt JR. Cross-cultural medical education: conceptual approaches and frameworks for evaluation. Academic Medicine 2003;78:560-69.
222. Crandall SJ. George G. Marion GS. Davis S. Applying theory to the design of cultural competency training for medical students: a case study. Academic Medicine 2003;78:588-94.
223. Drouin J, Rivet C. Training medical students to communicate with a linguistic minority group. Academic Medicine 2003;78:599-604.
224. Crampton P, Dowell A, Parkin C, Thompson C. Combating effects of racism through a cultural immersion medical education program. Academic Medicine 2003;78:595-98.
225. United States DHHS. HRSA. Office of Minority Health. Gwen Clark. E-mail correspondence. August 18, 2003.
226. Kaiser Family Foundation. Help understand why. Retrieved August 2, 2003 from URL: http://kff.org/whythedifference
227. McGravey AR, Bithoney WG, Nethersole S, Carrillo JM. Serving the underserved: residency training issues. Ambulatory Child Health 1996;1(3):244-49.
228. Ambulatory Pediatric Association. Training residents to serve the underserved: a resident education curriculum. Retrieved September 10, 2003, from URL: http://www.ambpeds.org/publications.cfm
229. Culhane-Pera KA, Like RC, Lebensohn-Chialvo P, Loewe R. Multicultural curricula in family practice residencies. Family Medicine 2000;32(3):167-73.
230. Kaiser Permanente. Culturally competent health care. Retrieved August 20, 2003, from URL: http://www.kp.org/medicine/permjournal/winter00pj/competent.html
231. The Leadership Alliance. Retrieved August 12, 2004, from URL: http://www.theleadershipalliance.org
232. Annual Biomedical Research Conference for Minority Students. Retrieved August 12, 2004, from URL: http://abrcms.org

SEVENTEENTH REPORT OF COGME 49
APPENDIX: A Review of Educational Pipeline Programs and Collaborations
PIPELINE PROGRAMS
Project 3000 by 2000
The Association of American Medical Colleges’ (AAMC’s) Project 3000 by 2000 helped increase diversity in medical schools by facilitating and encouraging pipeline and upstream programs at all levels. Together with the Na-tional Science Foundation (NSF), the National Institutes of Health (NIH), and other organizations, Project 3000 by 2000 promoted the need and opportunities for minority students in science and health. Based on surveys from the 125 United States (U.S.) allopathic medical schools, medical school part-nerships and opportunities for high school students increased between 1990 and 1995, as excerpted below:
• Science education partnerships with local school districts increased from 8 to 72.
• Magnet health science high schools increased from 8 to 44.
• Classroom-based academic enrichment programs for high school students increased from 44 to 82.
• Laboratory internships for high school students re-mained high at 102.
• Academic enrichment programs for college students increased from 59 to 77.
• Postbaccalaureate programs increased from 26 to 47.
• Articulation agreements coordinating curriculum and/or admissions with an undergraduate college and/or a high school increased from 3 to 59 (62).
Further, this project helped increase diversity in medi-cal schools. When the program began in 1991, a total of 1,584 underrepresented minorities (URMs) matriculated in medical school, and in 1994, that number had increased to 2,024. Further, surveys from the 125 U.S. allopathic medical schools indicate that, between 1990 and 1995, the number of postbaccalaureate programs increased from 26 to 47; and “articulation agreements coordinating curriculum and/or ad-missions with an undergraduate college and/or a high school increased from 3 to 59” (62).
Lumina Foundation Programs
The Lumina Foundation offers assistance to increase opportunities for minorities in undergraduate colleges and universities. Among the Lumina Foundation’s 2003 projects are many that enhance the pipeline to medical school:
• The Council of Independent Colleges received a $67,300 grant to commission a collection of essays from college presidents discussing effective ways to recruit and educate disadvantaged students.
• A $329,100 grant was awarded to Berea College to study the relationship between “labor, work and ser-vice in student persistence and success.”
• Brevard College received $1.4 million to support “Hallmarks of Excellence in the First College Year,” a program that seeks to “establish standards for suc-cess in first-year programs” and to design an evalu-ative process for colleges to reach those standards.
• The National College Access Network, which iden-tifies successful college access programs and estab-lishes a “national blueprint” for similar programs, was awarded $124,500.
• The American Association for Higher Education re-ceived $4,515,200 to improve academic achievement for African American, Hispanic/Latino, and Native American students attending institutions that serve minorities. These institutions will use information from the National Survey of Student Engagement to enhance teaching, curricula, and learning environ-ments for improving those students’ academic suc-cess.
• The American Association of Community Colleges was awarded $305,200 to help community college students complete baccalaureate degrees.
• The Indiana Humanities Council was awarded $436,300 to test a family-intervention program ad-dressing the “college-going behavior of low-income and first-generation students and students of color.”
• The Regents of the University of California received $250,000 “to document the relationship between ac-cess program intervention and success in college.”
SEVENTEENTH REPORT OF COGME 50
• Indiana University and Purdue University were awarded $100,000 for programs aiming to increase the success of African American and Latino fresh-men in introductory courses.
• Purdue University won a $100,000 grant for a “mul-ticultural learning” communities project and for evaluation of its success in increasing the persis-tence of participating students.
• The Trustees of Indiana University received a $100,000 grant to enhance student success through engaging first-generation students in “service learn-ing” projects in introductory courses.
• A $100,000 grant was awarded to the University of Notre Dame to increase student persistence by creat-ing intensive interactive learning in an introductory genetics class. The program emphasizes historically underserved students (63).
Health Careers Opportunity Program
The Health Resources and Services Administration’s (HRSA’s) Health Careers Opportunity Program (HCOP) pro-vides assistance to disadvantaged students to help them enter and graduate from a health or allied health professions school. Grants are available to allopathic and osteopathic schools of medicine, allied health programs, and public or private non-profit health and educational organizations. To meet HCOP objectives, grantees must conduct the following activities:
• Recruit disadvantaged individuals.
• Facilitate entry of disadvantaged individuals.
• Provide counseling, mentoring, and other services.
• Disseminate financial aid information.
• Expose students to primary health care in public or private community-based facilities.
• Partner with other institutions of higher education, school districts, and other community-based orga-nizations to develop a more competitive applicant pool.
Grantees are expected to take a “comprehensive ap-proach” that includes formal partnerships with a network of entities working together in a geographic region. The part-nership plan must include a health or allied health program, an undergraduate institution, school districts, a community-based organization, formal signed agreements, and activities fostering cultural competence. The HCOP provided approxi-mately $1.58 million to support five 3-year grants at an aver-age of $316,000 per year (80).
Centers of Excellence
HRSA’s Centers of Excellence program helps fund centers of excellence in health professions education for mi-nority students. Schools of medicine, dentistry, pharmacy, and graduate programs in behavioral or mental health are eli-gible for support for 3-year projects. The grants support the enhancement of diversity in the health professions through six legislative requirements that applicants must address:
• Creating a competitive applicant pool
• Improving academic performance
• Supporting faculty development to train, recruit, and retain URM faculty
• Attending to minority health issues in clinical train-ing, curricula, and information resources
• Supporting faculty and student research in minority health
• Providing community-based training in clinics serv-ing large numbers of minority patients
Grants may also be used to provide stipends for minority stu-dents underrepresented in the health professions (81).
Centers of Excellence may have four designations: Historically Black Colleges and Universities (HBCUs), His-panic Centers of Excellence, Native American Centers of Ex-cellence, and “Other” Centers of Excellence, which must en-roll URMs at rates above the National average. The Hispanic and Native American Centers of Excellence are required to form alliances with other community-based organizations that serve those minorities or to partner with other institu-tions of higher education that have high enrollments of those minority groups. The HBCUs and the “Other” Centers of Excellence are encouraged to partner with appropriate enti-ties to conduct program activities. The Centers of Excellence program provides approximately $15.2 million in FY 2003 for 10 grants, each an estimated $640,000 annually, to help fund programs of excellence in health professions education for minority students (81).
Health Professions Partnerships Initiative
Grants from the Robert Wood Johnson Foundation and the W.K. Kellogg Foundation helped create the Health Pro-fessions Partnerships Initiative (HPPI), an AAMC initiative to increase the participation of URM students, especially Af-rican Americans, Hispanics, and Native Americans, in health professions schools. The initiative develops educational partnerships and early intervention programs among medi-

SEVENTEENTH REPORT OF COGME 51
cal schools, other health professions schools, undergraduate colleges, and K-12 schools with the intent of improving stu-dents’ academic performance and developing their interest in health careers (32).
Minority Medical Education Program
The Minority Medical Education Program (MMEP) is a pipeline initiative sponsored by the AAMC and funded by the Robert Wood Johnson Foundation to facilitate the admis-sion of promising minority students into medical schools by providing an intensive 6-week enrichment summer program. The success of the program is indicated by the admission of 63 percent of participants into medical school. Eleven medi-cal schools conduct the MMEP:
• University of Alabama School of Medicine
• Baylor College of Medicine and Rice University
• Case Western Reserve University School of Medi-cine
• Chicago Summer Science Enrichment Program
• Columbia University College of Physicians and Surgeons
• Duke University School of Medicine
• Fisk University and Vanderbilt University Medi-cal Center (The College Fund/UNCF Summer Pre-medical Institute at Fisk University and Vanderbilt University Medical Center)
• New Jersey Medical School
• University of Virginia School of Medicine
• Western Consortium (University of Washington School of Medicine and the University of Arizona College of Medicine)
• Yale University School of Medicine (64)
University of California, Davis, Postbaccalaureate Program
A replicable 10-week summer postbaccalaureate program to assist disadvantaged students, including URM Californians who were rejected by all medical schools to which they applied, has been established at the University of California, Davis (UC-Davis) . The program targets those students likely to practice in medically underserved com-munities or among disadvantaged populations. The curricu-lum addresses study skills, test-taking skills, Medical Col-
lege Admission Test (MCAT) and math review, and critical reasoning and problem-solving skills. Students also identify their two weakest areas on the MCAT and work on those top-ics in review sessions. Participants take the Summer MCAT exams and confer with a counselor regarding their progress. They then enroll at UC-Davis for the next academic year as limited-status students taking courses uniquely suited to each student’s needs. The program has improved students’ MCAT scores, and from 1991-1999, 104 of the 115 participants were accepted by various medical programs, 93 of which were ma-jor U.S. medical schools (65).
Southern Illinois University’s Medical/Dental Education Preparatory Program
The Medical/Dental Education Preparatory Program of the Southern Illinois University (SIU) School of Medi-cine has provided a yearlong academic preparation course for more than 1,000 minority and disadvantaged students since 1972. Of current students, 95 percent are URMs. During its history, 68 percent of students have been accepted into pro-fessional schools, 92 percent of which were medical schools. The core curriculum focuses on basic chemistry, physics, and biology along with more advanced science courses. Students also improve reading, writing, test-taking, and interview skills. After completing the core curriculum, students take advanced premedical courses at the SIU Carbondale campus. The program is funded through State allocations and Federal grants (66).
University of Michigan’s Postbaccalaureate Pre-medical Fellowship Program
The University of Michigan’s Postbaccalaureate Pre-medical Fellowship Program (UM-PB) is a yearlong aca-demic enrichment program that provides opportunities for enhancing the academic preparation of those desiring to ma-triculate in medical school. Program participants must be either URMs or disadvantaged persons. The success of the program was evaluated by examining the academic outcomes of enrolled students at the University of Michigan Medical School from 1993-1996. Of these students, 15 had completed the UM-PB, 58 had finished postbaccalaureate work else-where, and 443 were traditional medical school students. The traditional students had significantly higher GPA’s than the other two groups, and the UM-PB students had lower scores on the MCAT exam than the other groups. However, both postbaccalaureate groups demonstrated competency in the first year of medical school coursework consistent with the traditional students (67).

SEVENTEENTH REPORT OF COGME 52
URM students. Of the 23 students in the first cohort, 16 (70 percent) completed the survey, and 11 (73 percent) of the 15 mentors replied to the survey. Twelve of the students evalu-ated the reflection groups and had attended an average of six sessions. Using a scale of 1 (not at all valuable) to 7 (very valuable), students’ assessment resulted in a mean score of 4.2 for the overall value of the meetings, 5.0 for valuable in-sights from faculty presentations, 4.9 for discussions during faculty presentations, and 4.8 for discussions during clinical students’ presentations. The lowest mean score was 3.8 for helpfulness in handling racial or cultural bias, a rating that prompted a shift in emphasis of discussions the following year. Students met with mentors an average of three times during the academic year. Mentors stated that they had dis-cussed a range of topics, including racial issues, with some success, and students considered mentors’ “openness and honesty as critical factors in facilitating discussion of this po-tentially sensitive issue” (70). University of Virginia’s Medical Academic Advancement Program
To increase its minority and disadvantaged medical school matriculants, the University of Virginia created the Medical Academic Advancement Program, a 6-week summer residential program enrolling approximately 130 students an-nually in a program designed to help prepare students for the MCAT exams. The program has admission requirements, including a minimum 3.0 GPA, and uses lectures, problem solving, simulated MCAT examinations, and small-group ac-tivities such as clinical visits. Between 1984 and 1999, of the 1,497 participants, 80 had graduated from the University of Virginia School of Medicine, and 174 were currently attend-ing the medical school (71).
University of Illinois at Chicago’s Urban Health Program
The Urban Health Program at the University of Illi-nois at Chicago attempts to increase the number of URMs who graduate from the College of Medicine. The program has four goals: “1) identify a potential qualified pool of mi-nority students and nurture . . . [them], 2) increase the ac-ceptance and enrollment rates for qualified minority students, 3) . . . facilitate the graduation of qualified minority students, and 4) train . . . culturally sensitive physicians dedicated to health care delivery in medically underserved areas.” The program uses the AAMC’s MedMAR list to identify Illinois students taking the MCAT and recruits them for application. It monitors the application process and provides an “open house” to promote the school to URMs. Upon admission, a pre-matriculation program helps prepare them for the rigors of medical school, and additional academic support is offered in the form of small group review sessions and preparation for the USMLE Step 1 and Step 2. The program’s success is indicated by the 695 URMs who matriculated between 1989 and 1998 with a 90 percent retention rate (72).
University of North Carolina’s Medical Education Development Program
The Medical Education Development Program (MEDP), a joint program of the University of North Car-olina’s medical and dental schools, is an intensive 9-week program for URMs and economically disadvantaged students who have shown potential to complete medical or dental school. A follow-up study of 371 participants in the program between 1980 and 1989 revealed that 76 percent were ac-cepted into medical school, and 88 percent of those graduated from medical school. The acceptance rate of the MEDP URM participants was significantly higher than the National accep-tance rates for both URMs and non-URMs (68).
University of Illinois at Chicago College of Medicine’s Program for At-Risk Students
Eighty-nine URMs who matriculated in the University of Illinois at Chicago College of Medicine as “at-risk” stu-dents were studied to determine the influence that advisors or mentors may have had on them. “At risk” was defined as likely to experience academic difficulty. These students were later classified either as “no delay” (having passed all cours-es as well as Step 1 and Step 2 of the USMLE) or as “de-lay/withdrawn.” Twenty students from each of these groups were randomly selected, and those agreeing to participate were interviewed about their mentors. Of the nine “no delay” respondents, seven had physician mentors, and two had no mentors. Of the 13 “delay/withdrawn” respondents, three had physician mentors, five had other mentors, and five had no mentors. Although conclusions were inconsistent, those who had physician mentors experienced less academic difficulty (69).
University of Rochester School of Medicine’s Medical Student Mentoring Program
The Medical Student Mentoring Program at the Uni-versity of Rochester School of Medicine was funded by the New York State Department of Health in response to the needs of URM and non-URM faculty to help facilitate the success of URMs in medical school. The program was con-ducted during the 1995-1996 and 1996-1997 academic years. Of the 28 URM students in the first- and second-year classes, 23 were assigned a mentor, and 21 met with their mentors at least once. Mentors attended two mentor development work-shops. Students were invited to attend monthly discussion meetings or “reflection groups” at which URM faculty, resi-dents, and advanced students shared their experiences as mi-norities. An average of eight students attended each meeting. The program was evaluated by surveys of both mentors and

SEVENTEENTH REPORT OF COGME 53
East Carolina University School of Medicine’s Summer Program for Future Doctors
The Summer Program for Future Doctors at East Car-olina University School of Medicine helps URMs and dis-advantaged students prepare for entry into medical school. The program admits as many as 24 students into an intensive 8-week summer program that focuses on science instruction, MCAT preparation, learning skills, and communication and writing skills. From 1994-1997, the program had 69 partici-pants, 51 of whom applied to medical school. Twenty-four of these were accepted, and 17 of this group were URMs. Twelve other participants chose other health professions (73).
University of Michigan School of Medicine’s Academic Support Program
The University of Michigan’s School of Medicine has created an Academic Support Program designed to intervene when a student has academic difficulties. Referrals into the program may come from the student, academic advisor, or faculty member. Reasons for intervention include failed aca-demic coursework or failure of Step 1 of the USMLE exam. Once a student is referred, an assessment is conducted at the Office of Services for Students with Disabilities. The student is interviewed by a clinical psychologist, completes behav-ioral screening checklists, and sometimes takes an academic achievement test. Action is recommended based on the eval-uation. The student is sometimes referred to other agencies within the university, such as the University Health Center, and ultimately referred back to the medical school for aca-demic support. During 1994-1998, 28 students, 24 of whom were URMs, were referred to the program. The difficulties arose during either the first year in coursework or the third year with the USMLE testing. Of the 28 students, 26 either graduated or continued progress with their studies. None re-ceived probation again. Two discontinued the program for academic reasons (74).
Ohio University College of Osteopathic Medicine Programs
The Ohio University College of Osteopathic Medicine has one of the strongest minority representations of all os-teopathic medical schools. Enrollment of URMs increased from 11 percent in 1982-1983 to 23 percent in 1997-1998. The College has six programs that support minority students in undergraduate school and medical school. The Summer Scholars Program seeks to strengthen the academic prepa-ration of URMs for medical school admission. Of the 210 students who participated by 1998, 78 had matriculated in the medical school, and 33 had graduated. The Academic En-richment Program assists matriculating students with issues
ranging from academic difficulties to financial aid. Approxi-mately 22 students per class participate. The Prematricula-tion Program enrolls students admitted to the medical school and helps them prepare for their first year. In 1998-1999, all but 6 of the 28 eligible students participated. Program Ex-CEL supports URMs at Ohio University to enhance their academic preparation and increase interest in going to medi-cal school. The Summer Enrichment Program is an optional 6-week program to assists URMs who plan to study premed at Ohio University. The Postbaccalaureate Program provides academic enrichment for students who have applied to medi-cal school but were not admitted. Each program targets a dif-ferent group, but all attempt to increase the number of URM physicians (75).
Wayne State University’s Postbaccalaureate Program
The first postbaccalaureate program in the Nation was created in 1969 at Wayne State University specifically to as-sist African American students who had applied but failed to be admitted to medical school. Students were guaranteed admission to the medical school if they maintained a B aver-age as a postbaccalaureate student. The yearlong program has evolved as successes and failures have been analyzed. Par-ticipants take courses in inorganic chemistry, biochemistry, and other sciences and also improve their academic skills. By 1997, the medical school had graduated 493 African Ameri-can students, 30 percent of which (160 students) had entered the program through the postbaccalaureate program (76).
University of South Florida College of Medicine’s Summer Pre-Matriculation Program
The University of South Florida College of Medicine initiated the Summer Pre-Matriculation Program (SPP) in response to the academic difficulties experienced by URMs entering in 1995. Of 13 matriculating URMs, 6 failed at least one course in the first semester. All URMs of the 1997 enter-ing class were encouraged to attend, and all entering students were eligible. Of the 14 participating students, 5 were URMs. After the first semester, all but one SPP student received a B or better in gross anatomy, compared to 80 percent of the class as a whole. The one student received a C, whereas 17 percent of the class received a C and two failed. In biochem-istry, both the SPP and class average was 87. Again, all but one SPP student received a B or better, and the one student received a C. In human embryology, all but two SPP students received a B or better, and the two made a C, whereas 37 percent of the class received a C and two failed. The program seeks to strengthen the academic preparation of students so that they can successfully navigate their first year of medical school (77).

SEVENTEENTH REPORT OF COGME 54
comparison or control groups also limited conclusions about causal effects of these programs (79).
COLLABORATIVE PROGRAMS
The AAMC’s Health Professions Partnerships Initiative
Grants from the Robert Wood Johnson Foundation and the W.K. Kellogg Foundation helped create the Health Pro-fessions Partnerships Initiative (HPPI), an AAMC initiative to increase the participation of URM students, especially Af-rican Americans, Hispanics, and Native Americans, in health professions schools. The initiative develops educational partnerships and early intervention programs among medi-cal schools, other health professions schools, undergraduate colleges, and K-12 schools with the intent of improving stu-dents’ academic performance and developing their interest in health careers (32).
The AAMC has published Learning from Others, a lit-erature review of HIPPI partnerships and guide to forming partnerships to enhance academic opportunities for URMs (106). Another study assessing the qualities of successful HIPPI programs revealed the following criteria as predictive of successful HIPPI collaborations:
• “Vision and commitment to community”
• “Willingness to listen to partners and respect them”
• “Leaders and staff who foster the program through commitment and consistency”
• “Prior experience in diversity programs”
Characteristics of school districts and individual schools involved in successful partnerships include the fol-lowing:
• “Vision and leadership”• “Selection of strong schools”• “Support of teachers”• “Strategies to involve parents and families”
The study concludes that more research is needed to show that successful partnerships lead to successful educational practices that support the pipeline to health professions edu-cation (86).
University of Medicine and Dentistry—New Jersey Medical School Programs
The University of Medicine and Dentistry—New Jer-sey Medical School has 11 different programs to increase the number of URMs entering medical school, several of which target students from eighth through twelfth grades. Programs exist for academic enrichment and promotion of interest in health careers for levels extending from the eighth grade to first-year medical and dental students. In addition, a Saturday Science Academy is open to students from eighth through twelfth grades. Two programs target Hispanic students, the Hispanic Center of Excellence Summer Youth Program and Infomed, which offer informational seminars and monthly workshops to help Hispanic students improve their chances of success in medicine and health professions. Undergradu-ates have an opportunity to participate in the Students for Medicine and Dentistry Program to enhance academic and non-academic skills, and first-year medical students make the transition between undergraduate school and medical or den-tal school with the assistance of the Freshman Introduction to Resources, Skills, and Training course. From 1972-1998, a total of 1,722 students were involved in the pre-college pro-grams; 1,875 participated in the college programs, and 683 participants attended the pre-matriculation programs (78).
Other Precollege Programs
A 1998 article discusses 27 precollege programs seek-ing to increase diversity in medicine. These programs are classified by five characteristics:
• “Academic enhancement”: programs that enhance students’ academic skills
• “Motivation”: programs that encourage students to consider a medical career
• “Mentorship”: programs that provide students with a mentor in a medical student, physician, or other health care worker
• “Research apprenticeship”: programs that offer students laboratory research experience
• “Academic partnership”: alliances between medi-cal schools and school systems to improve stu-dents’ prospects for success in health careers
Of the 27 programs described in the article, most are academic enhancement programs. Evaluation is an important component of any program, and only 12 of the 27 programs had evaluation components. Further, only five programs at-tempted to assess the quality of the program using formative research methods such as pre- and post-test scores. A lack of

SEVENTEENTH REPORT OF COGME 55
Medical College of Georgia’s Health Science Learning Academy
A Health Professions Partnership Initiative at the Medical College of Georgia’s (MCG’s) Schools of Medicine and Nursing has created an alliance consisting of the College, two Augusta high schools attended primarily by URMs, three HBCUs, the Fort Discovery National Science Center of Au-gusta, community service organizations, and MCG student organizations. The high school science program, called the Health Science Learning Academy (HSLA), seeks to enhance students’ academic preparation and interest in science and health. The HSLA began with ninth graders and expanded during its second year to include ninth through twelfth grad-ers. Enrichment classes, offered for 3 hours on 18 Saturday mornings during the academic year, include work in SAT preparation, English composition, math, and biology. Since its inception in 1996-1997, 203 students have participated, and the 38 students who completed all 4 years have enrolled in college. The mean SAT score for those students was 1,066, compared to the mean of 923 for all college-bound students at the participating high schools (82).
Southern Illinois University’s Summer Programs
Southern Illinois University offers two summer pro-grams to pre-college minority and disadvantaged students. The Health/Science Careers Pathway (HSCP) Program pro-vides high school minority students opportunities to increase their awareness and interest in health and science professions. The Summer Research Apprenticeship Program matches dis-advantaged high school students with faculty mentors in a research laboratory. Students learn lab safety, conduct hands-on research, collect data, and produce and present a research paper. A Science on Saturday program was also initiated for middle school students who received tutoring from students in the MEDPREP program, a postbaccalaureate preparation program to facilitate admission to medical school (66).
Baylor College of Medicine and University of Texas-Pan American’s Premedical Honors College
Baylor College of Medicine (BCM), together with and the University of Texas-Pan American (UT-PA), has created the Premedical Honors College (PHC), a combined Bachelor of Science-Medical Doctor (B.S.-M.D.) program that seeks to increase the number of physicians providing care to Tex-as’s underserved communities. Since its beginnings in 1994, the program has had 159 matriculants and 71 graduates, and 60 of these have matriculated in medical school. By compari-son, in 1994, only four students from all five South Texas col-leges (30,000 students) were accepted into medical school.
The Texas legislature has acknowledged the program’s suc-cess and has passed a bill to replicate the program in the Joint Admission Medical Program (JAMP). PHC students are 95 percent Mexican American, indicating that, as of 2001, the PHC produced over 40 percent of the 386 Mexican American medical school matriculants nationwide.
The program targets 13 South Texas counties, all of which are designated as medically underserved, and 11 of which are designated health professions shortage areas. The program is open to all high school students, who, upon accep-tance into the program, attend college at UT-PA and receive conditional acceptance to BCM. The students must meet cer-tain requirements, such as maintaining an overall GPA of 3.2 and a science GPA of 3.0. In addition to coursework, they receive tutoring and support services, enrichment activities, clinical activities, and mentoring. They also attend summer enrichment programs throughout their college years. Since the program’s initiation, declared premed majors at UT-PA have doubled, and graduates matriculating in medical school have increased seven-fold (83).
Ohio State University’s Young Scholars Program
The Young Scholars Program seeks to motivate URMs and disadvantaged youth of Ohio to enroll in post-secondary school. Students are nominated for the program when they are in the sixth grade, when students and parents sign a con-tract that promises admission into Ohio State University as a freshman and a loan-free financial aid package that stipulates a GPA requirement of 2.0 or better to maintain the assistance. Students must participate in year-round and summer activi-ties, complete college preparation courses, and maintain a minimum 3.0 GPA in high school. Participants attend the University’s Summer Institute for 1 to 3 weeks to complete coursework and career exploration. The first group of Young Scholars enrolled in 1994. After 2 academic years, their re-tention rate was 72 percent. The rate for the campus as a whole was 70 percent. A comparison group adjusted for fam-ily income, race, gender, and high school GPA had a retention rate of 62 percent (84).
University of Washington School of Medicine’s Washington, Wyoming, Alaska, Montana, Idaho Program
The Washington, Wyoming, Alaska, Montana, Idaho (WWAMI) program, which provides regional medical educa-tion for States nearest to the University of Washington School of Medicine, attempts to increase primary care physicians in this largely rural and underserved region. The program has established collaborative programs with K-12 and undergrad-uate students to enhance recruitment of students. The Minori-ty Medical Education Program allows students to come to the University of Washington campus every summer for 6 weeks

SEVENTEENTH REPORT OF COGME 56
ner Schools in this county participate in the Comprehensive Partnership for Minority Student Achievement, an NSF proj-ect that focuses on science and math preparation for URM students. The HPP enhances science education across the continuum, including math and chemistry instruction at the high school level. HPP students attend a summer enrichment program before they enter undergraduate school. When stu-dents prepare to take the MCAT exam, they participate in the MCAT Undergraduate Training Conference. All URM stu-dents are invited to participate in a prematriculation program during the summer before their medical school coursework begins. They can also participate in a structured preparation course for the USMLE Step 1 exam (90).
Colorado Medical Explorers Program
Manual High School in Colorado, a school with a high minority population, reformed its science education curricu-lum with assistance from the University of Colorado’s Health Sciences Center. This partnership promotes science education and has components to stimulate interest in science and ca-reers in medicine. The Medical Explorers program provides ninth graders with a weekly yearlong experience in science and health. All students are invited to participate, and in its first year, the program had 16 applicants. In addition, sixth graders have an opportunity to do hands-on activities during 10 yearly outreach trips. This medical partnership promotes science education and “a rich diversity of students who pur-sue careers in medicine” (91).
Boston University School of Medicine’s CityLab
CityLab, a centralized biotechnology learning labo-ratory at the Boston University School of Medicine, assists in promoting science education for students and teachers in Boston area junior high and high schools. Funded by NIH, the lab’s goal is to provide students with first-hand experi-ence in science. Students working in the lab learn that they can understand science and pursue careers in science and health. Able to accommodate 200 students weekly, CityLab served 16,000 students and 1,200 teachers between 1992 and 1999. Some teachers have even started CityLab satellites at their own schools. Students and teachers have responded pos-itively to CityLab, and satellites have been replicated across the U.S. (92).
University of California, San Francisco’s Medteach Program
Medteach, a partnership of the University of Cali-fornia, San Francisco (UCSF), and San Francisco’s public middle schools, is a program in which three to five volun-teer first-year medical students teach lessons on biology and health to assigned classes 10 to 12 times during an academic year. Coordinated by UCSF’s Science and Health Education
of science courses, health care lectures, MCAT preparation, and information about application and admission to medi-cal school. The Medical Scholars Program began outreach work with students from rural areas and from URM groups. This program promotes health careers through “a week-long ‘immersion in medicine’.” Further, Federal grant funds and matching funds from the University developed enrichment courses for high school minority, disadvantaged, and rural students. The University of Washington is also a designated Center of Excellence for Native Americans and recruits this URM group into health care careers, conducts research in Native American health issues, and provides faculty develop-ment for Native American physicians (85).
Four Directions Summer Research Project
The Four Directions Summer Research Project is a summer program designed for Native American undergradu-ate students to perform research at Harvard Medical School. The program is designed and run by Native American physi-cians and medical students within the Harvard Medical com-munity. The program, which has had over 75 participants in 10 years of existence, seeks applicants interested in improv-ing the health status of Native Americans (87).
University of Minnesota’s Native Americans into Medicine Programs
Native Americans into Medicine is a 6-week sum-mer enrichment program of the Center of American Indian and Minority Health at the University of Minnesota (UM). Open to college students or high school graduates preparing to enter college, the program provides a curriculum in intro-ductory science courses like anatomy and microbiology and allows students to explore careers in medicine and health (88). The UM INMED program is a summer Preceptorship open to students who are at least 14 years old and who are planning to enroll in post-secondary education. It is a 4- to 6-week program in which students work with health care providers and gain an overview of Native American health from the provider’s perspective (89).
University of Louisville School of Medicine’s Professional Education Preparation Program
The University of Louisville School of Medicine started activities to increase minority matriculation as early as 1981 through the Professional Education Preparation Program, en-hanced in 1996 by a Health Professions Partnership (HPP) grant. In this program, the medical school has increased its partnership with the Jefferson County Public Schools, which educates large numbers of African American students. Part-

SEVENTEENTH REPORT OF COGME 57
Partnership (SEP), the medical students align their lessons with the teacher’s classroom plans and receive feedback from the teachers as well as advice from the SEP staff. The program has been popular, as indicated in the number of requests by teachers for a Medteach team. The program served approxi-mately 350 sixth graders in 1997-1998. Some key reasons for its success include a sustained relationship between teachers and medical student teams; consistency of teams to facilitate small groups; access to materials, tools, and models; financial support; and a committed SEP coordinator who provides les-son plans, support, and feedback. Those desiring to replicate the program should consider the following advice:
• Become familiar with the local public schools.• Identify a committed group of volunteers.• Seek out resources for support.• Visit teachers and classrooms (93).
New York’s Rural Partnership for Science Education
The Rural Partnership for Science Education is an al-liance of rural students and teachers in 10 New York State school districts and several New York institutions: the Re-search Institute of Bassett Healthcare (an academic medi-cal center affiliated with the Columbia University College of Physicians and Surgeons), Hartwick College, the State University of New York at Oneonta and its biological field station, the Science Discovery Center in Oneonta, Corning Science Products Division in Oneonta, the Clark Scholarship Foundation, and the New York Academy of Sciences. The program is designed to stimulate the interest of students and teachers in science and to enhance the teaching and learn-ing of science. One-week summer workshops are offered to approximately 70 teachers each year. Students from grades three through eight also participate in weeklong summer ex-ploration camps. Surveys of elementary students of teachers who have attended Partnership workshops indicate that these students’ rating of science is significantly higher than ratings of students of non-attendees. Another instrument, the Chil-dren’s Academic Intrinsic Motivation Inventory, measures student motivation in five areas—general studies, science, reading, math, and social studies. Partnership schools admin-istered these surveys to seventh graders each year from 1992-1996, and results consistently showed that science had the highest mean score. Further, the program coordinator visits classrooms during the year to present lessons, and pre- and post-tests for these lessons show that students move from pre-test averages of 54-66 percent correct to post-test mean scores of 76-93 percent correct (94).
Louisiana State University School of Medicine’s Enrichment Activities for Minority Youth
The Louisiana State University (LSU) School of Med-icine’s Office of Community and Minority Health Education,
supported by HRSA’s Health Careers Opportunity Program, provides enrichment activities for minority high school stu-dents in the New Orleans area. The initiative includes out-reach to science clubs; “Awareness Days,” when health pro-fessionals make presentations and science demonstrations or provide tours of the medical school or labs; “Competition Day,” when students compete in academic skills events; and an 8-week High School Summer Science Program. Students must be admitted to the summer program, and 70-118 stu-dents have participated annually since 1990; 90 percent of participants are African American. Students each have a fac-ulty mentor from the LSU School of Medicine and, based on the student’s interest, is assigned to clinical or basic science research sites. Students work at the sites for 8 hours Monday through Thursday and for 4 hours on Friday, when they spend the afternoon at lectures covering such topics as the admis-sions process and financial aid. A 1997-1998 survey of partic-ipants from 1985-1997 revealed that 282 of 594 respondents had science or pre-health professions undergraduate majors, and 31 were enrolled in or had graduated in medicine (95).
John Burns School of Medicine’s Summer Program for the Enhancement of Basic Education
The John Burns School of Medicine, Hawaii’s only medical school, houses the Ho’ola Post Baccalaureate Pro-gram and the Native Hawaiian Center of Excellence, both funded by HRSA’s Division of Disadvantaged Assistance. The center targets Native Hawaiians in public schools to try to increase their enrollment in medical school. In 1992, the center initiated a 6-week Summer Program for the Enhance-ment of Basic Education, but only one Native Hawaiian was admitted during the first 3 years because of lack of competi-tiveness. With additional funding, six positions were set aside for Native Hawaiians, who, upon admission, are required to fulfill the program’s academic requirements. After special recruitment of Native Hawaiians, the six set-aside positions were utilized, and soon thereafter, Native Hawaiians were admitted into the program through the regular admissions process. In 1995, 1996, and 1997, eight Native Hawaiians participated each year. Of the 1995 group, all went to college, three in pre-med; of the 1996 group, all went to college, five in pre-med. All members of the 1998 group were attending college at the time the program was reported; two were plan-ning to major in pre-med. One received a prestigious Regents Scholarship by the University of Hawaii at Manoa. The pro-gram illustrates the need to develop a pathway for Native Ha-waiians and other URMs as early as elementary school (96).
Modern Genetics Program
The Modern Genetics Program is a hands-on science education program conducted through a partnership of Wash-ington University scientists, “implementation specialists” at the Mathematics and Science Education Center of the Coop-

SEVENTEENTH REPORT OF COGME 58
and UCLA faculty and staff together to create software that will enable students to gain problem-solving skills. Teach-ers receive a stipend to attend and receive unlimited use of the software. From 1993 to July 1998, 275 teachers from 67 schools participated in activities. Preliminary testing showed that students who performed IMMEX problem solving as part of classroom activities scored significantly better “on an independent test of problem-solving skills” than a class not exposed to IMMEX problems (99).
West Virginia University’s Health Sciences and Technology Academy
The Health Sciences and Technology Academy was formed to help increase the number of health professionals in the State of West Virginia, most of which is rural. The academy is a partnership among West Virginia University (WVU) (including the Health Sciences Center, the College of Arts and Sciences, and the College of Human Resourc-es and Education) and secondary-school teachers, health care professionals, and other community leaders. Targeting URMs in high school, the academy sponsors community-based extracurricular activities and a Summer Institute on the WVU campus. The institute recruits students to participate in leadership development and science activities during 1- to 3-week periods during the summer. Clubs meet during the school year either weekly or bi-weekly, and secondary sci-ence teachers coordinate activities and are a major influence in academic enrichment for students. Retention of students in the academy increased from 54 percent to 75 percent from the 1995 group to the 1996 group. Of the original cohort, 26 students were retained, and 11 more were recruited to add to this group. At the time the program was reported, all 37 stu-dents had applied and been accepted to college. Responding to whether the academy had increased their interest in health careers, approximately 72 percent responded “yes” for each year’s program activities, and 80 percent responded “yes” for the Summer Institute. The West Virginia Legislature has passed a bill that will allow tuition and fee waivers for stu-dents who complete the academy (100).
University of Texas at Houston Health Science Center’s Intercon Network
The University of Texas at Houston (UT-Houston) Health Science Center has partnered with other post-second-ary institutions throughout Texas, such as the University of Texas at El Paso, the University of Texas Pan-American, and Texas Southern University, to increase the enrollment in medicine of disadvantaged persons, who are often Afri-can American or Hispanic in Texas. In 1998, 108 students from those universities enrolled in research or professional internships at UT-Houston. The university has also partnered with inner-city, suburban, and rural K-12 school districts in
erating School Districts of St. Louis, project evaluators from Southern Illinois University at Edwardsville, and high school biology teachers in St. Louis, Missouri. Participating schools represent diverse student bodies. Project staff include a part-time scientist, a full-time implementation specialist, and a half-time evaluator. The implementation specialist meets weekly with teachers and provides supplies and logistical support. Teachers and key personnel participate in monthly workshops and also attend a 2-week summer workshop. Pre- and post-tests that assessed knowledge and knowledge gains of students indicate that, in 1995-1996, of 62 biology classes having 1,275 participants, 60 classes showed statistically sig-nificant gains. During the following year, 64 classes having a total of 1,322 students participated, and all classes showed significant increases in knowledge. All classes also showed gains in positive attitudes toward science (97).
Baylor College of Medicine’s My Health My World Project
Baylor College of Medicine’s My Health My World Project seeks to improve science education and to close the achievement gap in science that appears early in elementary school for URM groups, who were outperformed by whites and Asians at all grades tested (fourth, eighth, and tenth) in the 1996 National Assessment of Academic Progress sci-ence evaluation. Modeled on the National Science Education Standards, the project makes materials available and trains teachers in elementary science education. The project unit materials are age appropriate and focus on the relationship of the environment and health. They include “an adventure storybook, a language arts supplement, a guide to hands-on science activities, and a colorful mini-magazine, Explora-tions. . . .” At the time the program was reported, one project unit had been field tested each year by over 1,000 students from kindergarten through grade five, and 1,380 teachers had attended workshops. Teachers’ ratings of the field testing are uniformly high, and when students are asked to draw or write about something they have learned, 87 percent of students responded with key content points either in drawings or in writing (98).
University of California, Los Angeles, School of Medicine’s Interactive Multi-media Exercises Project
The University of California, Los Angeles (UCLA), School of Medicine has developed an Interactive Multi-me-dia Exercises (IMMEX) Project to facilitate teachers’ work in developing students’ problem-solving skills. Most students in the project are in the Los Angeles Unified School District, an urban educational system with an enrollment of over 800,000 students, 60 percent of whom have limited language profi-ciency, and 70 percent are URMs. The goal of IMMEX is to increase students’ interest and achievement in science and math. A 4-week IMMEX Training Institute brings teachers

SEVENTEENTH REPORT OF COGME 59
an “InterCon” network and conducts a high school science internship, a professional development program for teachers, a curriculum development program for high school medical sciences and technologies, and other innovative program-ming. The projects to promote science education in K-12 will help meet the goal of the UT-Houston Health Sciences Center to recruit more minorities into medicine and the goal of the Texas Higher Education Coordinating Board to enroll more disadvantaged Texans in graduate and professional schools (101).
Meharry Medical College’s Health Careers Opportunity Pre-Baccalaureate Program
Meharry Medical College has had an academic enrich-ment program to improve the academic preparation of under-graduate students for medical school since 1969. In 1997, the Biomedical Sciences Program merged with other programs and now functions as the Health Careers Opportunity Pre-Baccalaureate Program. The original program is described as targeting sophomores and prejuniors to provide them with scientific knowledge to consider medical and dental training, to facilitate their admission into health professions programs, to foster awareness of these programs, and to provide minor-ity role models. Students for the program were recruited from feeder schools from which most of the matriculating medical students graduate. Information was mailed to health career advisors at all HBCUs. Applications included faculty letters of recommendation and career goals expressed in writing, and program participants had to have a B average overall and a B in science and math. Pre-tests, post-tests, and weekly exams were conducted to measure the effect of coursework on performance. Tracking was used to evaluate long-term ef-fects of the program. Of 1,025 former participants to whom evaluations were mailed, 445 (43 percent) responded to the survey. Seventy percent had applied to professional schools, 83 percent of which were medical schools, 15 percent were dental schools, and 2 percent were graduate schools. Of those applying to medical school, 198 (77 percent) were admitted, and all had graduated. The 46 who applied to dental schools were all admitted, and all graduated. Of those applying to graduate schools, all had received Ph.D.’s in biomedical sci-ences (102).
Trinity College’s Consortium on High Achievement and Success
Trinity College in Hartford, Connecticut, has joined with over 30 other colleges and universities to form the Consortium on High Achievement and Success, a group dedicated to facilitating the success of minority students at predominantly white college campuses. Trinity College has created the Barrier Course Project, which provides supple-mental instruction for students struggling in science classes. The program also trains teachers to provide encouraging
feedback, and students also learn to study and work collab-oratively (102).
University of Alabama at Birmingham School of Medicine’s Bridge to Health Care
The Center for Community Outreach Development at the University of Alabama at Birmingham School of Medi-cine has created the Bridge to Health Care, a project that seeks to increase minority participation in medicine by providing academic enrichment and laboratory and clinical setting ex-periences for fifth-, seventh-, and ninth-grade students in the Birmingham City Schools. The medical school credits the program’s success to the strong partnership with the school system and also the school’s dedication to the community. For example, students learn about such diseases as diabetes and sickle cell disease, which affect their own communities disproportionately. The students are exposed to health infor-mation and to medical career information that can influence their future (103).
Mount Sinai School of Medicine’s Pre-College Programs
The Mount Sinai School of Medicine collaborates with the Gateway Institute for Pre-College Education to encour-age students living in the school’s New York City community to attend college and pursue professional careers. The insti-tute works with 10 high schools, targeting the preparation of minority and low-income students for professional careers, including science and medicine. The medical school also pro-vides college preparatory curriculum to the Queens Gateway to Health Sciences Secondary Schools and the Life Sciences Secondary School in east Harlem. The program enables stu-dents who may not have high academic qualifications, but who are highly motivated, to pursue careers in science or health (103).
Doctor’s Academy
Sunnyside High School’s “Doctor’s Academy” is a program initiated in 1999 by the Latino Center for Medical Education and Research, which is on the Fresno campus of the University of California, San Francisco. The program helps disadvantaged students primarily from minority backgrounds to get intensive academic preparation for college and, eventu-ally, medical careers. Students in the academy take an extra class at the end of the day and focus on college preparatory courses. They also have after-school, weekend, and summer internships. During the summer before their senior year, they intern with a physician mentor. The $1.2 million funneled into the program by the Latino Center comes from such sources as HRSA grants, California State funds and California Endow-ment funds, the AAMC’s Health Professions Partnership Ini-tiative, and W.K. Kellogg Foundation donations. This highly

SEVENTEENTH REPORT OF COGME 60
competitive program graduated its first 32 students in June 2003 (104). The Leadership Alliance
The Leadership Alliance, a consortium of 31 U.S. re-search and teaching academic institutions, seeks to promote the participation of underserved and underrepresented stu-dents in graduate studies, including doctoral programs, and in research. The alliance provides educational opportunities through undergraduate internships and mentoring, graduate support and fellowships, faculty development opportunities, and research exchanges (231).
Annual Biomedical Research Conference for Minority Students
The Annual Biomedical Research Conference for Mi-nority Students is a National conference that promotes ad-vanced studies in the biomedical sciences to minority stu-dents. The conference is sponsored by The National Institute of General Medical Sciences, Division of Minority Oppor-tunities in Research Program, and is managed by the Ameri-can Society for Microbiology. At the conference, students participate in scientific sessions, professional development workshops, and poster sessions and exhibits. The students also have opportunities to network and to benefit from fac-ulty mentoring (232).