Mestrado em Finanças Do Insiders Time Their Trades ...
59
UNIVERSIDADE TÉCNICA DE LISBOA INSTITUTO SUPERIOR DE ECONOMIA E GESTÃO Mestrado em Finanças "Do Insiders Time Their Trades? Evidence from Euronext LisborT Pedro Gonçalves de Sousa Carvalho Orientação: Doutor João Luís Correia Duque Júri: Presidente: Doutor João Luís Correia Duque Vogais: Doutor Miguel Luís Sousa Almeida Ferreira Doutor António Manuel Gonçalves da Silva Saragga Seabra Maio / 2007
Transcript of Mestrado em Finanças Do Insiders Time Their Trades ...

UNIVERSIDADE TÉCNICA DE LISBOA
INSTITUTO SUPERIOR DE ECONOMIA E GESTÃO
Mestrado em Finanças
"Do Insiders Time Their Trades? Evidence from Euronext LisborT
Pedro Gonçalves de Sousa Carvalho
Orientação: Doutor João Luís Correia Duque
Júri:
Presidente: Doutor João Luís Correia Duque
Vogais: Doutor Miguel Luís Sousa Almeida Ferreira
Doutor António Manuel Gonçalves da Silva Saragga Seabra
Maio / 2007

Do Insiders Time Their 1 rades? Evidence trom Luronext Idshon
GLOSSARY OF TERMS AND ABBREVTATIONS
AR - Abnormal return
CAR - Cumulative abnormal return
CM\ M — Comissão do Mercado dc l olores Mobiliários
CNMV - Coniision .\acional dei Mercado de I olores
CVM - Código dos lãlores Mobiliários
EPS - Earnings per share
ETSE 100 - London Stock Exchange índex
LSE - London Stock Exchange
OLS - Ordinary least squares
P/B - Price to book ratio
P/E - Price earnings ratio
PS1-20 - Portuguese Stock Index 20
SEC - Securities and Exchange Commission
TWSE - Taiwan Stock Exchange
aCÂR,.)- Abnormal return conditional variance
Ti and i: - Cumulating periods
Cu - Disturbance term of abnormal return
cr; - Disturbance variance
t - Event time
Rmx - Log return in event period x for the market portfolio
R,t - Log return in event period x for security i
Ho - Null hypothesis
N - Number of events
a,, p,. and cr; - Parameters of the market model
0l and 9, - Test statistics
) - Variance of the cumulative abnormal return
Do Insiders Time Their Trades? Evidence from Euronext Lisbon
Do Insiders Time Their Trades? Evidence from Euronext Lisbon
Pedro Gonçalves de Sousa Carv alho
Mestrado em: Finanças
Supervisor: Prof. Doutor João Luis Correia Duque
Coneluded in: May 2007
abstract
If an insider trades on prixáleged information. then one vvould expect to see insiders
purchase in days before the security price increases and sell them in the days before the
security price declines. This is the main study hypothesis on which we have based our
investiuation. Numerous studies in different countries have found that insiders do trade
around events or news that intluence firm value and that on average they do abnormal
profits. We try to replicate those investigations in the Portuguese stock market.
Our investigation aims to detect and measure the existence ot insider trading abnormal
profits during the period from January 2001 to December 2005. It covers. vvhen available.
ali insider transactions from companies belonging to the Eurolist írom Euronext Lisbon.
To decide whether or not insiders time their trades, we use the traditional methodology of
event studies to test the existence of abnormal returns around the days vvhen insiders
purchase or sale their company shares. We also tested it the magnitude and duration oí
abnormal profits depend signifícantly on firm-specifíc and transaction-specific factors
(such as industry classification. firm size, firm valuation and relative trading volume of
the insider transactions).
The practical objective of our research is to answer the following question; Do insiders
buy (sell) shares prior to stock price raise (decline)?
Keywords: insider trading; information and market efficiency; event studies; abnormal
retum; corporation and securities law; asymmetric and private iníormation.
JEL Classification: G14. K22. D82.

Do Insiders Time Their Trades? Evidence from Euronext: Lisbon
"Do Insiders Time Their Trades? Evidence from Euronext Lisbon"
Pedro Gonçalves de Sousa Carvalho
Mestrado em: Finanças
Orientador: Prof. Doutor João Luís Correia Duque
Provas concluídas em: Maio de 2007
RESUMO
A questão subjacente a esta investigação é a de saber se os "insiders das cotadas
portuguesas usam informação privilegiada para negociarem acções das empresas às quais
estão liuados. A investigação procura replicar, para Portugal, estudos académicos já
realizados noutros mercados mundiais, muitos dos quais, mesmo em mercados
regulamentados, chegaram à conclusão que os "insiders lucram com a informação
privilegiada de que dispõem ou a que podem ter acesso.
O objectivo final da tese é responder à seguinte questão: será que os designados
"insiders" compram (vendem) acções das empresas a que estão ligados antes de uma
subida (queda) das cotações dessas firmas?
Para isso iremos aplicar a metodologia do estudo de eventos e testar se o ganho
"anormal" nos períodos à volta das transacções dos "insiders é signiíicatix amente
diferente de zero. A metodologia é aplicada às empresas admitidas à negociação no
mercado regulamentado da Euronext Lisbon no período compreendido entre 2001 e 200^.
Nesta investigação também procuramos testar se a magnitude e a duração da
rendibilidade "anormal" dependem de íactores especiticos da empresa ou das transacções
(tais como a classificação sectorial, a dimensão e a avaliação da empresa e o volume de
transacções subjacente a cada compra ou venda por parte dos "insiders ).
Palavras-chave: "insider trading"; informação e eticiència do mercado; estudo de
eventos; retorno anormal; regulação; informação privada e assimétrica.
Código de classificação JEL: G14. K.22, D82.
4

Do Insiders Time Their Trades? Evidence from Euronext Lisbon
INDEX
1. INTRODUCTION
2. LITERATURE REV1EW
2.1. Decomposing Insider Trading
2.2. Differences in the Regulation
2.3. Differences in the Methodology
3. THE PROBLEM IDENTIFICATION
3.1. Legal Framework
3.2. Evidences of Illegal Inside Trading
3.3. The Study Hypothesis
4. DATA CONSTRUCTION
4.1. Final Sample
4.2. Sample Adjustments
5. METHODOLOGY
5.1. Market Model
5.2. Abnormal Return and its Statistical Properties
5.3. Aggregation Through Time and Across Securities
6. EMPIRICAL FINDINGS
6.1. Firm and Transaction-Specific Factors
6.2. Methodology Adjustments
7. CONCLUSIONS
8. REFERENCES

Do Insiders Time Iheir Trades? Evidence from Euronext Lisbon
listoftables
-I -1 Table 1; Enquiries Carried Out by CMVM" Enforcement Department
O "7 Table 2: Transactions Excluded from lhe Sample
Table 3: Frequency Distribution of Insider Trading by Industry Classiíication 29
Table 4: Cut offof insider trading events by firm size. P/B. P/E and relative trading
, 30 volume
Table 5; Results of Tests to Abnormal Retum 41
Table 6; Cumulative Daily Abnormal Returns for Insider Trading Events 41
Table 7: Cumulative Daily Abnormal Returns for Insider Trading by Industry 1 ^
Classification J
Table 8; Cumulative Daily Abnormal returns for Insider Trading Events by Firm Size...44
Table 9; Cumulative Daily Abnormal Returns for Insider Trading Events by Relative
Trading Volume
Table 10; Cumulative Daily Abnormal Returns for Insider Trading Events by Pnce to
Book Ratio
Table 11; Cumulative Daily Abnormal Returns for Insider Trading Events by Price
Earnings Ratio ^
Table 12: CAR for Insider Trading Events Using the Mean Adjusted Retum Model 48
Table 13: CAR Taking into Account the Clustering Issue 49
Table 14; CAR Taking into Account the Clustering Issue and a Non-Overlapping
Approach ^
Table 15; Cumulative Daily Abnormal Returns Using the Market Adjusted Return 51
LIST OF FIGURES
Figure 1: Average Abnormal Return 40
Fisure 2; Cumulative Abnormal Return 42
6

Do Insiders Time Their Trades? Evidence from Euronext Eisbon
Acknowledgements
We appreciate the helpful suggestions and insightful comments made by João Duque.
Marco Bonomo. Qinglei Dai. Victor Cardoso and Ana Sousa. We would also like to
thank Niã, Dinho and Carla for their encouragement throughout this project.
7

Do Insiders Time Their Trades? Evidence from Euronext Eishon
1. 1NTRODUCTION
"Unless [...] insiders just happcned to posscss superior uncdytical ahility. their excess
return nmsl he due to thc i lie pai exploilalion of insider informalion .
Insider trading literature deals with the following question: do insiders make use ot non-
public information to earn profits larger than they vvould have had if they traded on the
available public-information? Numerous studies in different countries have tound that
insiders do trade around events or nevvs that influence firm value and that on average they
do abnormal profits.
We investigate the profitability and information content of insider trading in the
Portuguese stock market. The practical objective of our research is to ansvver the
following question: Do insiders buy (sell) shares prior to stock price raise (decline)'?
In our study we assume insiders to be those individuais who are compelled to intorm the
Portuguese Securities Market Commission (CMVM - Comissão do Mercado de l alares
Mobiliários) about the purchase and disposal of shares from the company with which
they are related. CMVM is responsible for the regulation and supervision of the
Portuguese stock market and tries to guarantee its integrity and transparency. Therefore
the regulator, through the Portuguese Securities Code (CVM - Código dos Valores
Mobiliários) imposes a rule set to prevent insiders from using privileged information
while trading stocks of their own firms. The Portuguese Securities Code (article 378.
n.03) describes privileged information as ali non-public information that. being accurate
and with respect to any issuer or securities or other financial instruments, would he
capable, if it was given advertising, of influencing in a sensitive manner its price in the
market.
1 Elfon and Gruber (1995)
8

Do Insiders Time Their Frades? E\ idenee trom Euronext Lisbon
Xotwithstandine. throuehout our sample period CM\'M lias deteeted oeeasional
suspieious situalions in lhe da>s immediaiel> preeeding the diselose ot intormalion likel>
to have a sienitieani eíteet on share pnees.
Our in\estiealion aims to deteet and measure the existenee ot insider trading abnormal
profits durine lhe period from Januaip 2001 to Deeember 2005. It will co\er. uhen
a\ailable. ali insider transaelions on eompanies trom Euronext Lisbon belonging to the
Eurolist.
Fo decide uhether or not corporate insiders time their trades. \ve use the traditional
methodolog\ ot' e\ ent studies to lest the existenee ot' abnormal returns around the da> s
uhen insiders purehase or sale their comparo shares. According to MacKinlay (1997), a
major success of this methodologç is the implicit acceptance ot event study by the U.S.
Supreme Court tor determining malerialitç in insider trading cases and tor determining
appropriate disgorgement amounts in cases ot traud. Foliouing the literature, vve also
lested iF tire magnitude and duration of abnormal protits depend signiticantly on tirm-
specific and transaction-specific tactors (such as industry classiticalion. tirm size, tmn
ealuation and relatic e trading volume of the insider transactions).
Event studies also serve an important purpose in capital market research as a vvay ot
testing market efficiency. Systematically nonzero abnormal security returns that persist
after the insider transaclion are inconsistent with market etticiency.
The remainder of this work is organized as follows. Chapter 2 presents the literature
review. Chapter 3 presents the problem identification. vvhere we summarize the legal
framework regarding insider trade activity in Portugal. Chapter 4 describes the data and
provides the summary statistics and chapter 5 the methodology applied. Chapter 6
discusses the empirical results and chapter 7 concludes the study.
9

Do Insiders Time Their Trades? Evidence from Euronext Lisbon
2. LITEFLATURE REVIEVV
Man> studies conclude that insiders can earn abnormal profits through trading stocks ol
their own firms. Nevertheless. the intensity, pattem. duration and significance ot those
profits have varied substantially across countries and markets. The magnitude oí
abnormal profits depends on firm-specific and transaction-specific tactors (such as firm
size, trading volume, etc.). and the conclusions may also depend on whether insiders are
purchasing or selling shares. The conclusions can be affected by moditying the standard
event studv methodology assumptions. and the regulation and enforcement ot insider
trading lavvs can also play a major role. This particular aspect turns this research very
market dependent since in each market a different regulation is applied.
Early investigations conducted in the U.S. showed that insiders are able to earn
significant exceptional returns. around 5%, during the first tive months after trading.
Jaffe (1974) found evidence that insiders can predict price movements in their own
securities. testing the information content of the Ofíicial Summary. the Securities and
Exchange Commission (SEC) monthly report listing the transactions of corporate
officials. For ali the samples in bis study, he concluded that SEC" publication contains
information on the future stock price. However. after adjustment for transaction cost. only
intensive trading samples (the only ones that possessed residuais greater than the cost of
transaction) vvere earning statistically large returns.
Following Jaffe, Baesel and Stein (1979) tested the profitability of insider trading
activities in Canada, but they chose to divide the trading activities into two subgroups: a
set of trades by ordinary insiders and a set of insider trades made by bank directors. Their
results also contrasted vvith the classically stated strong form of the efficient market
hypothesis. Indeed, they found that both ordinary insiders and bank directors earned
positive premium returns relative to an uninformed trading strategy. Bank directors
earned larger premiums than ordinary insiders. This was particularly true for purchases,
which the authors believe better represent trades relying on information. The reason.
10

Do Insiders Time Their Trades? Evidence trom Euronext Lisbon
accordinc to the research. is the fact that bankers have information sets v\hich contain
those of ordinary insiders as subsets.
Also in Canada. Heinkel and Kraus (1987) vvent beyond the traditional event study
approach and developed a portfolio performance measures tor the aggregate insider and
his her trading partner (outsider) that measure portfolio return over the entire sequence ot
insider (and outsider) trades. They analysed just small companies vvhere insiders account
for a larue fraction of ovvnership and transactions. According to their study. insiders vvill
choose to trade on superior information onl\ it they can earn abnormal proíits (i.e.. abo\ e
a risk-adjusted market rate of return) by their trading. Any such abnormal proíit may
implv abnormal losses to the parties on the opposite sides ot the trades. The latter parties
vvere termed ""outsiders"". The major conclusion was that. despite being able to identiiy
particularly profitable transactions. the insiders do not. over ali their trades, outperform
the outsiders. While cumulative abnormal return results indicate that some insider trades
are profitable. the portfolio results do not support the hypothesis ot superior insider.
Moss and Kohers (1990) chose to examine just those insiders trading in U.S. in events
occurring prior to earning and dividend announcements. Their investigation tried to íind
if corporate insiders are able to profit enough from their transactions so as to outperform
the stock market by buying their company"s stock prior to favourable earning and
dividend announcement of their firm. Similarly. they were expecting insiders to avoid
losses by selling their company"s stock prior to untavourable earning and dividend nevvs.
Following Jaffe (1974). they used data from the Official Summary of Securities
Transactions and Holdings published by SEC. during the years 1982 and 1983. Their
results clearly indicate that insiders were able to outperform the market for each one of
the four types of announcements examined. In the case of the two positive news
announcements (earning greater than expected and dividend increases). they vvere able to
generate risk-adjusted excess returns, while they used the negative announcement
(earning lower than expected and dividend decreases) to time their selling in order to
prevent significam losses in the market value of their stock holdings. The authors suggest
that SEC has not been effective in bringing total efficiency to the market.
11

Do Insiders Time Their Trades? Evidence from Euronext Lisbon
Kabir and Veanaelen (1996) also analysed the relationship between insider tradirm and
earnina announcements, but have used liquidity (measured by trading volume) rather than
stock return to detect the existence of inside trading activity. Erom 1987 onwards.
insiders at Amsterdam Stock Exchange vvere no longer allowed to trade two months
before an annual earnings announcement. The study proposed to find ií. as a result oí the
reaulation. trading volume prior to the restricted period increased (since insiders might
vvant to liquidate their positions prior to the start oí the restricted period). The results
demonstrate that stocks became less liquid vvhen insiders vvere not allowed to trade. The
studv also found some evidence that the introduction oí insider trading restrictions
reduced the stock market's speed of adjustment to positive earnings nevvs.
More recently. Calvo and Lasfer (2002) tested insiders" abnormal return using data from
203 U.K.. companies listed on the London Stock Exchange (LSE). over the period írom
January 1997 to December 2001. Considering an event vvindow oí 10 days beíore and
after the insider trading, they found that insiders" purchases (sales) are preceded by
negative (positive) abnormal returns during the ten days beíore the transaction date. The
cumulative abnormal returns over the [-10. -1] period amount to -2.18% íor the buy
transactions and to 1,74% for the sell trades. Over the [+1. +10] period. the buy
transactions are followed by positive returns of 1.56% vvhile after the sales share prices
decrease by 1.94%.
2.1. Decomposing Insider Trading
Several authors show that the magnitude and duration of abnormal profits may also
depend significantly on firm-specific and transaction-specific factors. Furthermore.
profits may also depend on vvhether insiders are buying or selling their firm securities.
Some authors like Seyhun (1986) argue that the quality of information also varies from
insider to insider. Insiders vvho are expected to be more knovvledgeable vvith the overall
affairs of the firm. such as chairmen of the boards of directors or officer-directors. are

Do Insiders Time Their Trades? Evidence trorn Euronext Lisbon
more successful predictors of future abnormal stock price changes than oííicers or
shareholders alone. Evidence also suggests that insiders can discern the ditterences in the
value of their information and trade greater volumes of stock to exploit more valuable
information. Tvvo years latter, Seyhun (1988) discovered that insiders in small firms, who
are more successful predictors of their firms" performance, tend to trade mostly on hrm-
specific information. Insiders in large firms, on the other hand. are more likely to trade on
the basis of economyw ide factors rather than firm-specific factors.
Besides the traditional sample division between buying and selling activities. Jeng eí al.
(1999) decomposed insider trading along several dimensions: trade volume, size oí the
firm. insider"s position in the frm. and whether the trade is executed directly íor an
insider or indirectly for another party. They tirst constructed a rolling "purchase
portfolio"" that holds ali shares purchased by insiders for a six-month period; an analogous
"sale portfolio" holds ali shares sold by insiders for six months. The six-month horizon
vvas chosen to coincide vvith the "short-svving"" rule of the Securities and Exchange Act oí
1934 (a rule that prohibits profit taking by insiders for ofísetting trades vvithin six
months). The authors then employ performance-evaluation methods to analyse the returns
to the purchase and sale portfolios. The results show that the purchase portíolio eams
abnormal returns of more than 50 basis points per month. On the other hand. the sale
portfolio does not earn abnormal returns. They also found that the abnormal returns to
insider trades in small hrms are not significantly different trom those in large firms, and
that top executives do not earn higher abnormal returns than do other insiders. The
conclusions contrast with the Seyhun (1986) finding. The authors suggested a positive
relationship between trade volume (fraction ot firm equity traded in each insider
transaction) and insider informativeness, showing that abnormal returns tor the high-
volume and medium-volume purchase portfolios are economically large and statistically
signifícant. Performance measures for the sale portíolios are íound to be economically
small and statistically insignificant.
The pattern of stock prices being more dependent on purchases than sales is common in
U.K. and U.S. insider trading literature. One possible explanation. advanced by

Do Insiders Time Their Irades? Evidence írom Euronext Lisbon
Friederich et ai. (2000). is that block purchases convey more information than block
sales. They argue that decisions to buy should. on average. be more inlormation-based
and decisions to sell should be more liquidity-based. They analysed data on the trades
executed bv executive directors for the period 1986-1990 in the LSE. It was chosen not to
focus on the most liquid stocks (FTSE 100 companies) since previous vvork shovved
hiaher uross abnormal returns in less-liquid securities. It was found that lor diiector
purchases, abnormal returns are significantly negative in the twenty days betore the net
purchase. implying that directors purchase shares on average after a dovvnvvard run in
share price (of about 3%). After the insider transaction, the share price clearly recovers
and abnormal returns are positive on most days, so that abnormal return over the 20 days
after the director"s trade averages a significant +1.9%. The patterns are symmetrical in
the case of director sells. though the magnitude of abnormal returns is lower. as stated
above. Directors typically sell shares after a run of positive price movements over twenty
days of about +1,25%. and abnormal returns are predominantly negative after the
directors" sale. so that excess returns have averaged about -1.5% twenty days after the
event.
Calvo and Lasfefs (2002) findings also suggest that insider purchases convey more
information into the market. Besides the examination ot stock price abnormal
performance around insider trading activity described early, they provided evidence oí a
relationship between insider trading and news released after each transaction. They
searched ali the news items over the period ot íour months (80 trading days) after the
insider transaction. finding a total of 67 ditferent types ot news, which they have
classified as good, bad or neutral according to prior market expectations. They found that
most purchases are followed by good news while sales are not necessarily followed by
bad news. The probability that an insider purchase is followed by firm-specific good
news amounts to 70,9%. In contrast, insiders" sales followed by bad news represent only
24% of the cases.
Cheuk et ai (2006) reached different conclusions when studying price movements of
legal insider transactions in Hong Kong. Contrary to the U.S. and U.K., where corporate
14

Do Insiders Time Their frades? Evidence trom Euronext Lisbon
insiders make larger profits from their insider purchases than from sales. they found that
Hong Kong insiders actually obtain more profits from sales. One possible explanation is
that insider sales in Hong Kong are far less common than insider purchases. Thereíore. it
is understandable that vvhen insiders self outsiders are more likely to perceive that the
activities are driven by valuable private Information than vvhen insiders buy. They
conjecture that since a larger proportion of Hong Kong insiders are owner-managers
relative to the case of U.S. companies, they sell relatively less frequently for fear of
losinc corporate control. The abnormal performance of stocks traded by insiders in Hong
Kong was examined according to industry classification. tirm size. book to market ratio,
price earnings ratio and relative trading volume oí the insider transactions. The results
show that some insider purchases produced large and persistent abnormal retums. These
purchases have some common denominators: the tirm concerned is usually a finance or
industrial company. the firm is small in terms of market value. the book to market ratio ot
the firm is large. the price earnings ratio of the íirm is small, and the relative trading
volume of the purchase is large. This last result confirms Jeng et ai (1999) fmdings. For
insider sales. the post-event cumulative average abnormal retums are significantly
negative in the aggregate. as vvell as for sub-groups that are formed according to tirm and
transaction specific characteristics.
2.2. Differences in the Regulation
The results may also depend on the country and exchange under scrutiny. since different
insider trading laws may affect the ability of insiders to take advantage of their privileged
information. Many studies detecting abnormal profits from insiders suggest that insider
regulations during the sample period were unable to curb insider abnormal profits.
Different insider trading laws and enforcement of those laws throughout different
countries and time can help explaining why not ali investigations reached similar results.
Bhattacharya and Daouk (2002) made a survey on the existence and the enforcement of
insider trading laws around the world. The study ot the 103 countries (including Portugal)
that have stock markets reveals that inside trading laws exist in 87 of them. but
15

Do Insiders Time Their Trades0 Evidence from Euronext Lisbon
enforcement - as evidenced by prosecutions - has taken place in only 38 of them. Before
1990. the respective numbers vvere 34 and 9. This led them to conclude that the existente
and the enforcement of insider trading laws in stock markets is a phenomenon of the
1990s. The authors tried to find oul if inside trading laws affect the cost oí equity. To put
it in another way, if insider trading is found to increase the cost ot equity. corporations
would pav stock exchanges a premium to limit insider trading. everything else being
constam. If equity markets are informationally efficient, and it insider trading laws affect
the cost of equity, it follows that there will be an immediate impact on trading statistics
on the day insider trading laws are changed. Using the asset pricing model and the
dividend discount model as an approximation method to compute the cost oí equity. they
found that the cost of equity in a country. after controlling a number ot other \ ariables,
does not change after the introduction of insider trading laws. but decreases significantly
after the first prosecution. Beny (2005) complemented Bhattacharya and Daouk s (_00_)
vvork. The author tested whether differences in specific legal elements ot countries
insider tradina laws are associated vvith ditterences in the structure and performance oí
their stock markets. using financial, legal, and institutional data from a cross-section of
33 countries. It was found that countries with more prohibitive insider trading laws have
more diffuse equity ownership. more accurate stock prices and more liquid stock markets.
2.3. Differences in the Methodology
Event study methodology is typically applied to examine the profitability of insider
transactions. This methodology. still in use today, has a long history and accordmg to
MacKinlay (1997) perhaps the first published study is Dolley (1933). In this work. he
examines the price effects oí stock splits, studying nominal price changes at the time ot
the split. Over the decades ranging from the early 1930s until the late 1960s the levei of
sophistication of event studies increased. In the late 1960s seminal studies by Ray Ball
and Philip Brown (1968) and Eugene Fama et al. (1969) introduced the methodology that
is essentially the same as the one in use today. Ball and Brown considered the
information content of earnings. while Fama et al. studied the effects ot stock splits.
16

Do Insiders Time Their Trades? Evidence from Euronext Lisbon
The vvorks published by Brown and Warner in 1980 and 1985 tested various
methodologies used for calculating the normal or expected returns in the event studies.
Given a sample based on randomly securities and event dates, a partieular levei of
abnormal return was artificially introduced into the aforementioned sample. transforming
the actual return data. The study hypothesis is based on the fact that randomly selected
securities should not. on average. exhibit any abnormal return. The 1980 paper considers
monthly data vvhile the 1985 paper deals with daily security data. The 1980 investigation
found that a simple methodology based on the market model performs well under a vvide
variety of conditions. In some situations. even simpler methods. which do not explicitly
adjust for marketwide factors or for risk. perform no worse than the market model. They
tried in 1985 to test the applicability of these conclusions to event studies using daily
data. The results from simulations with daily data generally reinforce the tindmgs oí their
previous work with monthly data; methodologies based on the ordinary least squares
(OLS) market model and using standard parametric tests are well-specified under a
variety of conditions. They also discovered that daily data generally present few
difficulties in the context of event study methodologies. for instance in cases involving
variance increases or unusually high autocorrelation.
More recently MacK-inlav (1997), on which we have based our investigation. reviewed
and summanzed the event study methodology. The author also used the market model
and found evidence strongly supporting the hypothesis that eaming announcements do
convey Information useful for the valuation of firms.
Traditionally, the market model relating security returns to market portfolio returns is
employed in the event study literature, and abnormal returns are residuais obtained from
the market model around the event window. Notwithstanding. not considering a time-
varying svstematic risk property and autocorrelation in the return series mav be an
importam drawback of the market model. Chiang et al. (2004). analysing performance of
insider trading on the Taiwan Stock Exchange (TWSE) have chosen to follovv the
conditional Jensen's alpha approach proposed by Eckbo and Smith (1998) that considers
a multi-factor model, instead of traditional market model. The multi-factor model

Do Insiders Time Their Frades? Evidence trom Euronext Lisbon
includes information and risk tactors. and accounts for autocorrelation in the return series
in the estimation using the generalized method of moments. Hence. this method is able to
erab ali those effects not accounted for in the market model. Chiang ct al. (2004) have
employed the conditional Jensen"s alpha approach and the market model as well. but the
resulls from both approaches were similar, showing that insider trading does not gain any
abnormal returns in the TWSE.
Del Brio ct al. (2002) also analysed whether the measure of abnormal returns is sensitive
to charmes in the return-generating model. They studied the proíitability and intormation
content of insider trading in the Spanish stock market. They estimated two diíferent
expected-returns models to measure the sensitivity ot measured excess retuins to changes
in the model. They used the traditional market model and a modified market model
adjusted bv conditional-heteroskedasticity. This second model attempts to remove some
of the deficiencies of the market model vvhen describing the stochastic behaviour ot asset
returns. Conditional heteroskedasticity has widely been found vvhen vvorking vvith high
frequency financial data. Therefore. efficient estimating methods must take such a
phenomenon into account. In this sense, they modify the market model bv incorporating
an accurate measure of volatility through a GARCH model that also accounts for some
specifíc characteristics of their study (i.e.. large sample size, unknown transaction prices
and relatively short estimation periods). The period under study ranged trom January
1992 to December 1996. and the firms selected were ali non-financial firms listed on the
Madrid Stock Exchange and the Spanish continuous market. They found that return size
is very similar and the conclusions dravvn by the diíferent models are very close.
supporting Brown and Warner"s (1985) findings. Nonetheless, Del Brio et al. (2002)
found that in specifíc dates, the "traditional" market model underestimates the variance of
the returns. favouring the acceptance of the null hypothesis". Traditional test statistics
assume stable variances. meaning that there is no change in variance between the
estimation period and the event period.
: One possible solution is to use non-parametric tests that do not depend on the assumption of normality. Because non-parametric test do not use the return variance, this test can be more appropriate in case of event-induced variance.
18

Do Insiders Time Their Trades? Evidence from Euronext Lisbon
3. THE PROBLEM IDENTIFICATION
If an insider trades on privileged information. then one vvould expect to see insiders
purchase in days before the security price increases and sell them in the days betore the
security price declines. This is the main hypothesis on vvhich we have based our
investication. If non-informed investors are avvare of the wealth transfer induced by
insider tradinsz. they refrain from trading. resulting in illiquidity. and therefore
inefficiency in the markets. Beny (2005) found that countries vvith more prohibitive
insider trading lavvs have more accurate stock prices and more liquid stock markets. Thus.
examining the profitability of insiders is both an examination of the usefulness oí msider
information and the effectiveness of the Portuguese Securities Code regulations regarding
market abuse.
As a result, regulators tried to impose a rule set to enhance investor s contidence about
the fairness of trading in the financial market. The Portuguese Securities Code (article
378. n.0l) imposes that whoever holds privileged information due to its capacity as
member of a managing or supervisory body of an issuer or holder oí a holding in the
respective capital, and transmits this information to someone outside the regular scope of
its functions or. based on this information, trades or advises someone to trade in securities
or other financial instruments, or orders their subscription. acquisition. sale or exchange.
directly or indirectly, for itself or someone else. should be punished by imprisonment for
a maximum of three years or by a tine.
3,1. Legal Framework
In the Portuguese financial market there are two legal frameworks to control and pre\ent
inside trading activities that compel companies to release information about insider
trading data.
On one hand, companies must comply vvith the "Commercial Company Code" (Chapter
VII - Publicity of Ownerships and Market Abuse, article 447. 0). This code imposes that
19

Do Insiders Time Their Trades? Evidence from Euronext Lisbon
board members and supervisor members of a public company should declare to lhe
company the number of shares and bonds held. as vvell as ali company shares and bonds
sold and bought. This is also extended to those firms controlled by the company . This
communication must be done 30 days follovving the event and must be published as an
appendix to the company annual report. The "Commercial Company Code (Chapter \ II
- Publicity of Ownerships and Market Abuse, article 448. c) also establishes that if an
insider buys or sells shares and bonds based on Information about the company. vvhich is
not yet public and is susceptible of having an intluence on the security value. he must
compensate for the damages. In this situation. any shareholder could request for his
judicial resignation.
On the other hand, inside trading is also regulated by the "CMVM Regulation N . 7 _001
Corporate Governance (vvith the amendments introduced and re-published b\ CM\ \I
Resulation NT 11/2003)"". According to the article 3 of this regulation. CMVM must be
informed of the purchase and disposal of shares admitted for trade in a regulated market
involving: a) Members of the board of directors of the company issuing the shares; b)
Members of the board of management of a parent company of the issuer of the shares; c)
A company controlled by one of the persons mentioned in items a) and b). and d) A
person actiníi on behalí oí the persons mentioned in items a) and b). In our in\ estigalion,
we assume these individuais to be insiders. They are required to notify the in\ ested
company of the transactions vvithin seven working days after the exent. The in\ ested
company shall immediatelv notify CMVM ot the information receixed. The notilication
mentioned above must include; i) The legal nature ot the tact that originated the
acquisition or disposal and the date vvhen the transaction took place. n) The number oí
shares purchased or disposed oí and the number oí shares held b\ the declarer after the
trade; iii) The purchase or sale price ot the shares. The items described on i) (date) and ii)
(number of shares bought and sold) are the basis ot our database research.
The article 2 Io of the CVM establishes that control is deemed to exist between a natural or legal individual and a company when, regardless ot whether the domicile or headquarters is located in Portugal or abroad. that said individual is capable ot exerting, directly or indirectly, a dominant intluence o\er said company.

Do Insiders Time Their Frades? Evidence trom Euronext Lisbon
Aside from those tvvo "nationaF" legal framevvorks, there was a legislative authorization
in 2005 in order to revievv the Portuguese Securities Code. This had in mind the
transposition of the "Directive 2003/6/EC of the European Parliament and of the Council
of 28 January 2003 on insider dealing and market manipulation (market abuse) . The
•"Directive 2003/6/EC" was transposed into Portuguese lavv on the 31 st of March _006.
The "White Book about Corporate Governance in Portugal" published in 2006 by IPCP -
Instituto Português cie Corporate Governance. regarding this directive. highlights as a
new disposition the one allowing to "apprehend the patrimonial advantages that have
their origins in the crime of insider dealing and market manipulation. and use those
patrimonial advantages in favour of those who have suttered damages. and ha\ e
judiciallv complained . The Government, on the other hand. emphasizes the íirms dutv
of creating a list of ali persons who have access to privileged Information, as well as the
financial intermediaries" responsibility to iníorm the authorities about any suspicious
transactions regarding information abuse.
3.2. Evidences of Illegal Inside Trading
In spite of the leual framework, CMVM has detected various illegal insiders trading
activities as reported on its annual reports. The activities reported by the regulator are
onlv related to illegal inside trading, which means the acquisition or disposal of financial
Instruments by a person who knows, or should knovv, that the intormation possessed is
inside information. The article 3 of the "CMVM Regulation N .7/2001 carne into force
on 1 Eebruary 2002. Thus, for the financial year commencing on January 2001. ali
companies vve have included in our sample have already started disclosing their annual
reports with information in appendixes regarding inside trading actions.
Table 1 shows that in 2001. before the article 3 of the "Regulation NT7/2001" carne into
force, inside trading activity (16 enquiries) represented 35% of the enquiries carried out
by the Enforcement Department of CMVM (46 enquiries). It was the biggest percentage
of the enquiries investigated by the CMVM. Ten inquines of inside trading were brought
forward and six new ones were received, totalling 16 inquines.

Do Insiders Time Their Trades? Evidence from Euronext Eisbon
Table I: Enquiries Carried Out by CMWrs Entorcement Department Passed on Received Total Completed Pendiím Jud. Auth.
tnqun icí i i Abuse of Information 10 6 16 13 3 4
Market manipulation 6 9 6 j j 0 Unauthorised intennediation 4 0 4 4 0
Other misdemeanours 0 12 12 7 D 1
0 0 8
Cooperation with judiciam authorities
Request for intemational assistance
Total
0 0 17
j D
29
j D
46
j n
35
0 0 11
Enquiries (2002) Inside trading Market manipulation Unauthorised performance ot intermediation Other criminal offences Other breaches of regulations Cooperation with judiciary authorities Request for intemational assistance Total
3 3 o o 5
0 0 11
4 4
15 1 7
1 o
34
3
6 5 1
10 1
n
45
10 0
0 o
o o o 6
Enquiries (2003) Inside trading •> 7 9 5 4 ->
Market manipulation 1 8 9 6 3 0
Unauthorised financial intennediation 10 5 15 7 8 0
Other criminal offences 0 1 1 1 0 1 0 Other breaches of regulations n 4 4 0
Cooperation with judiciary authorities 0 4 4 3 1 0
Request for intemational assistance 0 1 1 0 1 0
Total 15 28 43 26 17 3
F.nauiries (2004) Inside trading 4 7 11 6 5
Market manipulation 3 4 7 4 3
Unauthorised financial intennediation 8 8 16 14
Other criminal offences 0 1 1 1 0
Other breaches of regulations 0 3 3 -> 1
Cooperation with judiciary authorities 1 1 -i 0
Request for intemational assistance 1 3 4 4 0
Total 17 27 44 33 11
F.nauiries P005)
Abuse of Information 5 6 11 6 5
Market manipulation 3 4 7 4 3
Unauthorised financial intennediation -) 4 6 3 3
Other criminal offences 0 0 0 0 0
Other breaches of regulations 1 7 8 4 4
Cooperation with judiciary authorities 0 4 4 3 1 0 Request for intemational assistance 0 4 4 4
Total 11 29 40 24 16
Source: The table compiles data from CMVM annual reports in 2001.2002. 1 J
O
o
2004 and 2005.
Cases reported bv CMVM' Enforcement Department to the judicial authorities.

Do Insiders Time Their Trades? Evidence from Euronext Lisbon
Out of these. four cases were reported by the Entorcement Department to the judicial
authorities. As a result. without the regulation into torce, 2001 was the year with the most
intense illegal inside trading activities in the period analysed in our investigation. In
2002 with the renulation alread_\ into torce, the illegal inside trading cases dropped to
less than a half. representing just lò0o of the total inquines carried out hy the
Entorcement Department. Only three proceedings with evidence ot inside trading were
passed on to the Director of Public Prosecutions. In 2003. 2004 and 2005 the weight ot
inside trading activity on the total enquiries carried out by the Entorcement Department
increased again to 210o. 25% and 28%. respectively.
In the meantime. Portugal witnessed the first condemnatory sentence for the crime ot
inside trading. pronounced by the Criminal Court in Lisbon on 25 July 2003. The Court
convicted a non-executive member of lhe Board ot Directors and shareholder in the
company "Vidago. Melgaço & Pedras Salgadas. SA", as the mastermind of the crime of
inside tradinn. In short. the material tacts proved that in July 1996. the accused had been
aware of his fathefs intentions to sell "Vidago" to "Jerónimo Martins". It was also
proved that the accused monitored the negotiations between the two companies.
Simultaneously, he bought severa! blocks ot shares in "Vidago between July and
October of 1996. which he then sold in the special stock market section with the intention
of determining the outcome of the public sale oftering. carried out in January 1997,
which allowed him to obtain capital gains of around 4 millions euros.
According to the CMVM 2004 annual report. investigations into potential insider trading
show "that many suspicious situations arise in the days immediately preceding the
disclosure of information likely to have a significam effect on share prices in the
securities market. especiallv with regard to the ventication ot annual or quarterly results
(favourable or unfavourable to the issuer), mergers. cessations or transformation and,
more frequently. announcements of public acquisition offerings". This is the reason why
the "White Book about Corporate Governance in Portugal" recommends that "members
of the board and the partners of a company should refrain themselves from trading the

Do Insiders Time Their Trades? Evidente from Euronext Lisbon
companv" securities in an interx al of time defined around lhe dates ot the publieation ot
^ --4 pnee sensitive events .
3.3. The Study H\ pothesis
In our in\eslieation. \ve anal> se the abnormal return for eaeh companv to identiiy these
(illeaal) and other potential insider trading activities. Therelore, our sample includes not
only those illegal inside trading activity reported by the regulator in its annual reports. but
other transactions (cases in vvhich the regulator considered that an investigation vvas not
justified) dropped b\ the CMVM"s Enforcement Department as vvell. We have based our
inv estiuation on one main hypothesis: that an insider earns abnormal returns it after
purchases (sales) stock prices rise (decline) abnormally. We try to answer the questions
using the traditional event study methodology. vvhere the null hypothesis to be tested is
whether abnormal returns in the event day and for the surrounding period are
significantly different from zero.
Abnormal returns are also analysed tor industry classiíication, as vvell as tor samples
grouped bv firm size. relative trading volume, price to book ratio (P/B) and price earnings
ratio (P/E).
Wong (2002) found that vvhen cumulative daily excess returns are separated by firm size
according to each firnTs market capitalization. only the smallest capitalization shows
significam returns within the post event period. Small firms are found to generate the
largest and most persistent abnormal profits.
Trading volume is found to be positively associated vvith the quality of information.
Relative trading volume is therefore used as an indicator of the quality of information
associated with each insider transaction.
4 CMVM does not impose any restrictions forbidding insiders from trading around the publieation of price sensitive events. Some companies, however, have internai rules forbidding trading before and after the publieation of annual or quarterly results.
24

Do Insiders Time Their Trades? Evidence trom Euronext Lishon
The sample is also grouped and ranked by P B and P E to examine if insiders take into
account their company valuation while trading shares ot their own tirms. lt is
hypothesized that high P B may predict bad performance, while low P B value predicts
cood performance. ' The literature also documented (see Cheuk et ai. (2006)) a negative
relationship between P E and future stock returns. W ilh this \ aluation hypothesis. ue aie
expecting to see purchases with high (low) P B and P E to perform worse (better). On the
other hand. we do expect to see sales with high (low) P B and P E to pertorm well
(poorly).
5 Cheuk et ai (2006) assume this hypothesis, using the book to market ratio. We assume the same hypothesis using the inverse ratio; the price to book ratio.

Do Insiders Time Their Frades? Evidence from Euronext Lishon
4. DATA CONSTRUCTION
Our oriíiinal sample included the 55 shares listed in the Eurolist from Euronext Lisbon at
lhe end of 2005. We excluded three foreign companies from lhe sample. since those vvere
cross-lisled shares. The sample vvas therefore reduced to 52 issues. Four olher companies
had listed two different classes of shares. For each one of those companies. we decided to
select onlv the most liquid class. which reduced the sample to 48 issues. matching 48
companies. We then collected the inside trading information (the date and the amount ot
shares bought and sold by insiders). The sample vvas afterwards reduced to 31 secunties.
since 17 companies had no record oí inside trading activity or their trades did not fulfil
some of the criteria that vvill be described later.
The sample period of this study is January 2001 to December 2005, covering two years oí
market slump (Portuguese benchmark PSI-20 dropped 24.73% in 2001 and 25.62°o in
2002), and three years of market rally (PS1-20 gained 15.84% in 2003: 12.64% in 2004
and 13,40 %in 2005).
Each company"s data was manually collected from their annual reports available at the
Portuguese watchdog Internet website. Data on daily cash-dividend-adjusted stock
returns vvere obtained from the Bloomberg terminal database. For each companv. as vvell
as for the benchmark index, we have extracted daily closing prices to calculate their daily
returns. Our analysis only considered insider transactions dealing vvith shares, which led
us to drop ali transactions vvith bonds and other company s related securities. such as
derivatives. The transactions upon treasury"s stocks vvere also dropped.
Within the sample period, we initially collected 2.426 insider transactions. Then.
following Del Brio et al. (2002). we excluded a number of transactions that are not likely
to be driven by privileged information. To assure that our sample consisted only of
insider transactions motivated by the possession of private information, we dropped ali
transactions made for non-informational reasons. As a result. we eliminated ali trades
related to inheritances, gifts, bonuses, acquisitions or disposals by conversion or

Po InMdcrv 1 une I hcir 1 rade-N l \ idenee troni l uroncxt 1 isbon
c\erv;>e et uptior,> and nelus l\Mi>equcml\. 1 Md vibsciA alions werc
kvm the -araria W c -eparated lhe e\Puded data into cipht catcponcs as
1 ubie d. wh;eh \\e -uaac-t should bc cxplorcd lalar in turther imcsliçation.
I " i r.iio.wtion- 1 sahuks! trom lha s.implc Inara.oa Paaia.oa 1 olnl
: ' , i xnwrooio lo - le
.oa.vH'»' l-l - 1
i % i K cnuins'(Ali u1
.-O 1 r.notaraiKa To pklDs ''"S - 1 'IP
r t: :o
, s , 1 .iPaoaar i i lo - 1 (<
i " i \o >1 Ha . S i 1 .•mar,Ha in
r io
a.lar. ar "i vas IomI -11"
ha-a ^alapai ia- ara
In-idar tran-aatu-ns ihat rasullad troin aoiu arsiuns (aoin arliblc bonds nr
axatianpa al tar- i.
i d i Sharas aaquirad m a aapital maraasc or subsanbad ai li'* ) opcralions;
i P Sharas raaai\ad and sold b\ iiisidars as a aonsequanaa of lha axaraisa M
sioak aptians and olhar maanliaas or raiminaration piaus;
Mi Sharas transfarrad bat\saan msidars (suah as hantapas);
l 5 i Sharas sold or bouphl b\ msidars on lakaoa ar oparalions;
i (, | Sharas raaaiaad as a aonsasiuanaa ol a ahanpa ot a aonipanv s aapilal
(ahanpa in lha nominal \alua or stoak splil):
Mi l ransaalioris mada h\ msidars llmt slid not spaaitv lha praaisa ala\ valiau
lha irada oaaurrad.
Follouina lha hlaralura. wa also lati oul savaral iradas mada by aorporata msidars (H)
sinaa wa prasuma lhal thair iransaations ara mosl likaly to ha drivan by sharaholdar
ounarship raasons. ralhar lhan axploilation of privilapad Informalion. As a rasull, wa
ha\a asiablished to rula oul ali iransaclions mada h\ aorporala msidars wilh a qualifying
holdina. In aaaordanae wilh arliala 16 (aommuniaation dulias) of lha Porluguasa
Saaurilias Coda. 2"o is lhe firsl qualifying holding limil whara il is aompulsory to inform
Do Insiders Time Their Frades? Evidence from Euronext Lisbon
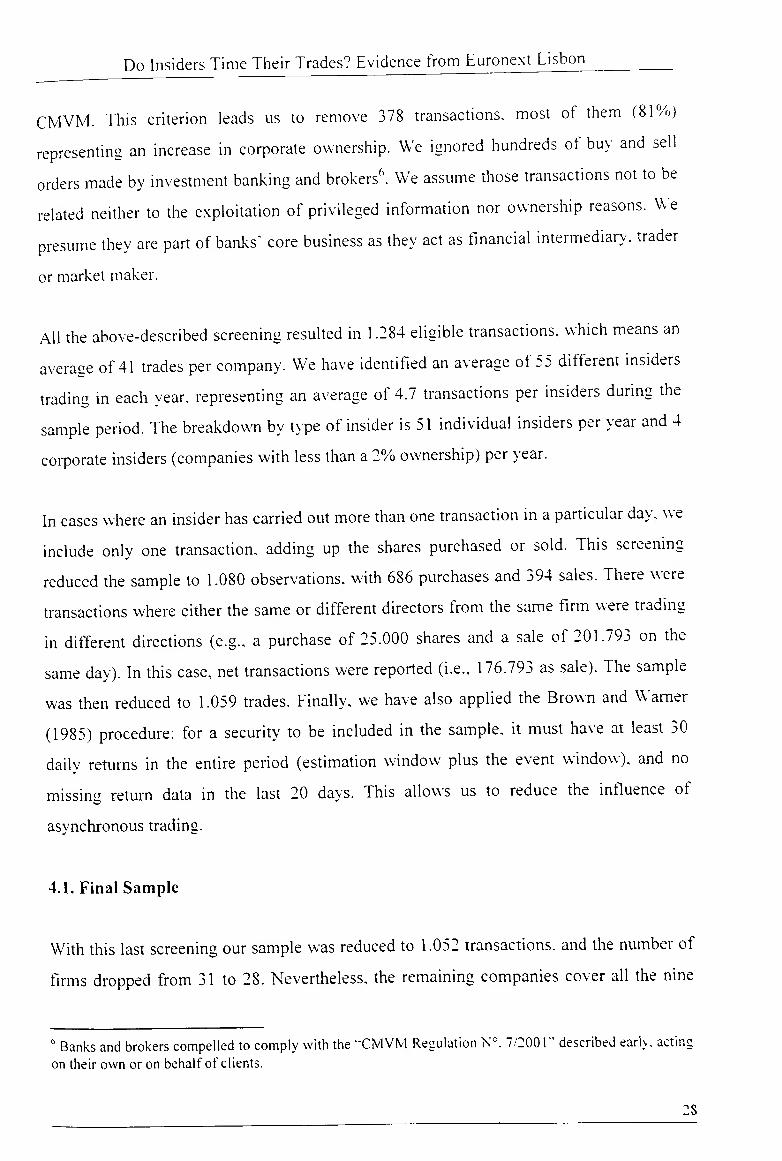
CMVM. This criterion leads us to remove 378 transactions. most of them (81/o)
representing an increase in corporate ovvnership, We ignored hundreds ot buy and sell
orders made by investment banking and brokers6. We assume those transactions not to be
related neither to the exploitation of privileged information nor ovvnership reasons. W e
presume they are pait of banks" core business as they act as íinancial intermediary. trader
or market maker.
Ali the above-described screening resulted in 1.284 eligible transactions. which means an
averace of 41 trades per company. We have identitied an average oí 55 ditíerent insiders
trading in each year. representing an average ot 4.7 transactions per insiders during the
sample period. The breakdown by type of insider is 51 individual insiders per year and 4
corporate insiders (companies with less than a 2% ovvnership) per vear.
In cases vvhere an insider has carried out more than one transaction in a particular day. we
include only one transaction. adding up the shares purchased or sold. This screening
reduced the sample to 1.080 observations. with 686 purchases and 394 sales. There vvere
transactions vvhere either the same or different directors from the same firm vvere trading
in different directions (e.g.. a purchase of 25.000 shares and a sale oí 201.793 on the
same day). In this case. net transactions vvere reported (i.e.. 176.793 as sale). The sample
was then reduced to 1.059 trades. Finally, we have also applied the Brown and Warner
(1985) procedure: for a security to be included in the sample. it must have at least 30
daily returns in the entire period (estimation window plus the event window), and no
missing return data in the last 20 days. This allovvs us to reduce the influence oí
asynchronous trading.
4.1. Final Sample
With this last screening our sample was reduced to 1.052 transactions. and the number of
firms dropped from 31 to 28. Nevertheless. the remaining companies cover ali the nine
b Banks and brokers compelled to comply with the "CMVM Regulation Kv 7 2001 described early, acting on their own or on behalf of clients.
28

Do Insiders Time Their Frades? Evidence from Euronext Lisbon
industry sectors quoted at Eurolist (as repoiled in Table 3) and cD0o ot the Portuguese
market capitalization at the end of 2005.
Table 3: Frequenc v Distribution of Insider Tradine b\ Industrv Classification
Purchases Sales Ali Ratio of purchases Number ot
T ransactions to sales companies *
Financial 247 144 391 1.72 s
Basic Materials 58 31 89 1.87 s
Communications 142 1 14 256 1.25 5
Consumer. Cvclical 154 25 179 6.16 4
Consumer. Non-cyclical 8 10 18 0.80 j
Diversified 1 0 1 - 1
Industrial 47 55 102 0.85 j
Technolorzv 3 1 4 3.00 1
Utilities 7 5 12 1.40 1
Total 667 385 1.052 1.73 28
Note: * The figures in the column reter to the number of companies in that industry classification at the end of December 2005. Industry classifrcation is assigned by the
Stock Exchange according to the nature of the business of the company.
OveralE insiders from financial and communication industries are the most active in
trading the stocks of their own firms. From those 28 securities preserved. 17 belonged to
PS1-20 index at the end of the sample period. representing 98% oí the benchmark value.
Purchases outnumher sales. split into 667 (63%) purchases and 385 (37%) sales. The ratio
of insider purchases to insider sales is 1,73; E such that almost tvvo out ot three insider
transactions are purchases. This can lead us to conjecture, betorehand, that insiders may
seek benefits of corporate control instead oí short term trading profits.
Although there are far more purchases than sales in each year of the sample period, the
average number of shares per transaction is larger íor sales (64.945) than for purchases
(26.152). The ratio between the average number of shares sold by transaction and the
number of shares purchased by transaction is 2.48, which suggest that shares are usually
sold in larger blocks. Seyhun (1998) also found that insiders in the U.S. are likely to
break up purchases into smaller transactions for fear of insider trading sanctions. Ele
suaaested that an insider purchase provides a stronger signal to both the authority and the
general public than does an insider sale. Hovvever, insiders are not as concerned vvith
insider trading regulations in sales transactions. It might be taken by the authority that the
29

Do Insiders Time Their Trades0 Evidence from Euronext Lisbon
motivations for profiting from the private information behind insider sales are le^s
obvious.
Table 4 summarizes inside trading activities cut ofí by íirm size. P B. P/E and relative
trading volume, following Cheuk et aí. (2006) procedure. We use three cutoffs to classify
ali transactions in each group.
Table 4: Cut offof insider trading events bv firm size. relative tradina volume. P B and P E A - Firm size
Purchases Sales
Smallest 1/3 Médium 1/3 Largest 1 3 j Smallest 1/3 Médium 1 '3 Largest 1 3
From 12 245 2.822 1 13 245 2.822
to DDD 2.809 12.597 1 DD") 2.809 12.597
N D D D 222 223 1 128 128 129
B - Relative tradine volume Purchases Sales
Lowest 1/3 Médium 1 /3 Hitthest 1/3 Lowest 1/3 Médium 1/3 Highest 1/3
From 0.0000°0 0.0008% 0.0037% 0.0000% 0.0016% 0,0093%
to 0,0008% 0,0037% 1,4308% 0.001 5° o 0.009 l0o 1.4767%
N "OD 223 128 128 129
C - Price to book value Purchases Sales
Lowest 1/3 Médium 1/3 Flishest 1/3 Lowest 1/3 Médium 1/3 Flighest 1/3
From 0.32 1,61 2.46 0.34 1.75 2.49
to 1.60 2,45 25.69 1.75 2,49 15.48
N 210 210 209 127 127 127
D - Price earninszs ratio
Purchases Sales
Lowest 1/3 Médium 1/3 Hiszhest 1/3 Lowest 1/3 Médium 1/3 Highest 1/3
From 1.55 11.11 15,46 3.10 12.90 17,98
to 1 1.01 15,46 94.86 12,90 17.96 100.86
N 141 141 141 99 99 99
■m size is measured in mi lions of euros. Data regardim the market capitalization. the total number
of shares outstanding, the P/B and P/E ratios were obtained from the Bloomberg terminal database.
In order to tesl for the differences by firm size. companies in the sample are segregated
into three groups according to their market capitalization at the time oí the insider
transactions (small. médium and large size íirms). The size of an inside trading íirm is
calculated for every transaction based on the month-end figures of the month prior to
vvhen the insider trading occurred.
30

Do Insiders Time Their Trados? Evidence trom Euronext Lisbon
As in Cheuk et ul. (2006) and other studies. relativo trading volume is given as lhe ratio
between total number of shares traded in the insider transaction and the total number ot
outstanding shares of the stock ai that moment. Total number of outstanding shares is
based on the month-end figure of the month prior to the month vvhen the insider trade
occurred. Each transaction is then ranked by the relative trading volume (low, médium
and hiuh) and is assigned to one of three groups: low relative trading volume, médium
relative trading volume, and high trading volume.
The P B is equal to a stock's price divided by its book value (i.e.. total stockholders
equity) per share. The book value of the insider-trading firm, for every transaction, is
based on the data from the most recent reporting period betore trading (quarterly. semi-
annual or annual). In our sample. each transaction is ranked by the P/B ot the stock
concerned and is assigned to one of the three groups; low P/B, médium P/B. and high
P/B. In this particular analvsis we have dropped 42 transactions from our sample, since
book value information was not available .
The P/E is the ratio of the current share price to earnings per share (EPS) ot the past year.
The EPS of the inside trading firm for every transaction is based on the tiscal year-end
qaure of the year prior to that vear vvhen insider trading occurred. Similar to the analvsis
vvith the previous ratio, each transaction is ranked by the P/E of the stock concerned and
is assiuned to one of three groups; low P/E. médium P/E, and high P/E. In this
examination. the sample ot 1.052 transactions was reduced to 720. since there were ja_
transactions where the respective EPS was negative and theretore P/E was not computed.
4.2. Sample Adjustments
Throughout this research, we have done some sample modifications and adjustments
related to complications arising from violations of the statistical assumptions, being able
to accommodate more specific hypotheses.
7 This is the reason why in Table 4 the number of purchases and sales (N) drops vvhen section C is compared vvith N in sections A and B.
31

Do Insiders Time Their Trades? Evidence trom Euronext Lisbon
The first one vvas brought forward by MacKinlay (1997) vvho states that while
acereeatina the abnormal retums across tirms it is assumed that there is no clustering.
meaning that the event windows of the included securities do not overlap in teims ot
calendar time. This assumption allows us to calculate the variance ot the aggregated
sample cumulative abnormal retums without concerning about the co\ariances across
securities because they are assumed to be null. It this assumption is incoirect. then the
parametric tests may be biased. Thereíore. distributional results presented at the section 5
for the aeureiíated abnormal returns will no longer be valid. Brown and Warner (1985)
point out that, in general, the use ot daily or vveekly data makes clustering of events on a
sinele day much less severe than the use of monthly data. But diversification across
industries mitigates the problem, as stated by Bernard (1987). Since our sample is highly
diversified (ali industry sectors are present in our data) we hope to overcome the referred
problem. Following the portfolio approach suggested by MacKinlay (1997). the abnomial
retums for those securities that share the same event day were aggregated into a single
portfolio. We have build up 171 different portfolios. with an average of 2.15 securities
per portfolio. As a result our sample vvas thereafter reduced to 855 (522 purchases and
333 sales). from the previous 1.052 transactions.
Following Calvo et ed. (2002). we also built a non-overlapping sample in order to
cuarantee that the abnormal retum calculation of an inside transaction is not influenced
by the abnormal return oí an early event. We assume that vvhen insiders purchase or sell
on consecutive davs. they are trading with the same pnvileged bit of information. In order
to prepare our sample, we follow Duque and Pinto s (2004) piocedure to remove
overlapping of event windows. Therefore. vvhen transactions occurred on consecutive
days, or vvithin less than a íive-day time interval, it vvas assumed as a single inside
transaction. and the "event day vvas assumed to include the entire time interval betvveen
the day of the first event and the day of the last event. The use of such a procedure
reduced our sample even further. From 855 we carne out with 450 transactions (_55
purchases and 195 sales).

Do Insiders Time Their ITades? Evidence from Euronext Eisbon
5. METHODOLOGY
The methodology and notation for the modelling of abnormal returns (AR,-) follovv
larcely MacKinlay (1997) and Campbell et al. (1997). We have done few additional
adjustments in Une with the insider trading literature.
The AR,- is computed by subtracting expected returns E [Ru | XT] from the actual returns
Rit (the log return of company i at time t).
ARit =Rit-E{R,t\Xt). (1)
Xt stands for the conditioning set oí information íor the expected retuin. Event time (a
counter) is denoted by x. with the event date corresponding to x = 0. Different authors use
different models to estimate expected returns. However, Brown and Warner (1980) after
comparinu different methodologies used in event studies shov\ed that bevond a simple.
one factor market model, there is no evidence that more sophisticated methodologies
convey any benefit.
5.1. Market Model
The market model is a statistical model, which relates the return of any given security to
the return of the market portíolio. This method takes into account both market-wide
factors and the systematic risk ot each sample security. We used the PSI-_0 index as a
proxy to the market portfolio. For any security / the market model is
£{£„ = 0) var(í„) = cr;.
Sit is the zero mean disturbance term and a„ p,. and cr; are the parameters of the market
model.

Do Insiders Time Their Trades? Evidence irom Euronext Lisbon
The OLS8 estimators of the market model parameters for an estimation window of
obsen ations are
P, O:
r = /'„ +1
à, = //. - /? (4)
^ =T^T IsiK-á.-p.KrY (5)
L - 2 T~l
vvhere
L\ T=ru+\
and
Pm =7- Z^r- L\ T = l„ + \
R1T and Rmx are the log retums in event period t for security i and for the market
portfolio. respectively.
Following the Brown and Warner"s (1985) procedure to compute the ARIT we have firstly
considered an event window of eleven days [-5. +5]. which includes five days before the
s Under general conditions OLS is a consistem estimation procedure for the market model parameters.
34
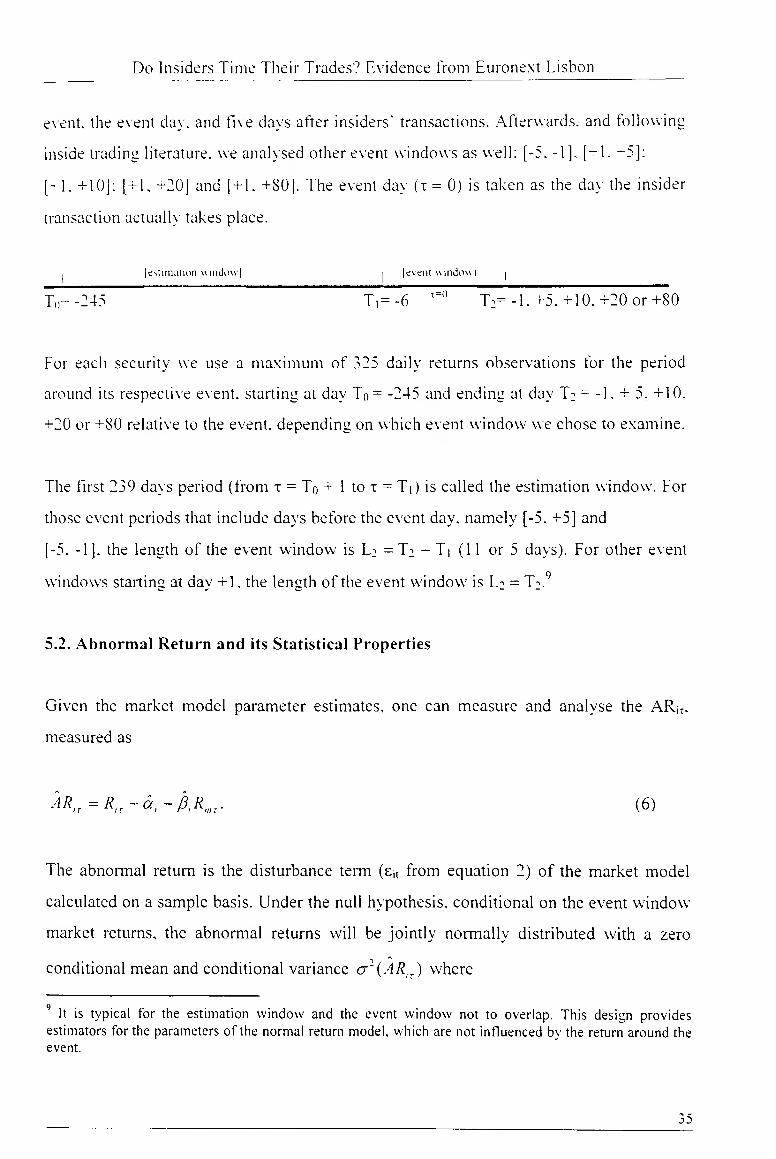
Do Insiders Time Their Frades'? Evidence from Euronext I.ishon
event. the event da\ . and fi\e days after insiders" transactions. Afterwards. and tollowina
inside trading literature. \ve analysed other event w indous as well: [-5. -1 ]. [-1. -5];
[+1. +10]; [+1, +20] and [+1. +80]. The event day (x = 0) is taken as the day the insider
transaction actually takes place.
[eslimation windovv] I [event window ) i
T(r -245 T,= -6 T=,, T:=-1,+5.+10.+20 or+80
For eaeh security v\e use a maximum of 325 daily relurns observations for the period
around its respective event. stailing at day To= -245 and ending at day T: = -1, + 5, +10.
+20 or +80 relative to the event. depending on vvhich event windovv \ve chose to examine.
The first 239 davs period (from x = To + 1 to x = T|) is called the estimation windovv. For
those event periods that include days before the event day. namely [-5. +5] and
[-5. -1]. the length of the event windovv is L: = T2 - Ti (11 or 5 days). For other event
windows starting at day +1. the length of the event windovv is L2 = T2.g
5.2. Abnormal Return and its Statistical Properties
Given the market model parameter estimates, one can measure and analyse the AR1T.
measured as
ÀR,r=R.r-à,-/3lRmr. (6)
The abnormal return is the disturbance term (slt from equation 2) of the market model
calculated on a sample basis. Under the null hypothesis. eonditional on the event windovv
market retums, the abnormal returns will be jointly normally distributed vvith a zero
eonditional mean and eonditional variance cj2{ÂRit) where
' It is typical for the estimation vvindow and the event windovv not to overlap. This desien provides estimators for the parameters of the normal return model, vvhich are not intluenced by the return around the event.
35

Do Insiders Time Their Trades? E\ idence from Euronext Lisbon
cr ' (AR .) - cr: + (A' . ■ u )■
L cr' 7)
The conditional \ariance has two components. One component is the disturbance
variance cr~ (see equation 2) and a second component is the additional variance due to
the sampling error in a, and (3,. 0 Under lhe null hçpothesis. Ho. that the event has no
impact on the behaviour of returns (mean or \ariance) the distributional properties of the
abnormal returns can be used to dravv inferences o\er any period within the event
window. Under Hq the distribution of the sample abnormal return of a gi\ en observation
in the event window is
ÀRir - X(0.c7:(ÂR,r)). (8)
If abnormal returns are independem, identically distributed and normal, the test statistic is
distributed as StudenTs t under the null hypothesis. Brown and Warner (1985) show that
as the degrees of freedom increase the distribution converges to a normal distribution.
Since the degrees of freedom in our research exceed 200. the test statistic is assumed to
be unit normal.
5.3. Aggregation Through Time and Across Securities
It is usual to aggregate the individual securities abnormal returns through time and across
securities in order to draw overall inferences for the event under scope. We cumulate
these abnormal over time to analyse the pre- and post-event period returns. Define CÀR
(ti,!;) as the sample cumulative abnormal return (CAR), where X| and t: are the
cumulating periods. Following Calvo eí al. (2002) and Cheuk et al. (2006) we analyse
10 As the length of the estimation window L, becomes large, the second term approaches zero. This is to be expected, since in this case the sampling error of the parameters vanishes. The variance of the abnormal return will be ay, and the abnormal return observations will be independem. In practice. in agreement with MacKinlay (1997), the estimation window can usually be chosen to be large enough to make it reasonable to assume that the contribution of the second component to the variance of the abnormal return is zero.
36

Do Insiders Time Their Trades'.' Evidence trom Euronext Lisbon
CAR for the [-5. -1] event window to assess signiíicance ot lhe CAR immediately hefore
the event took place. and also CAR íor the [+1. +5]; [+1. ~10]; [ + E -20] and [-E -80]
periods to evaluate the significance ot the excess returns after the transactions and íor
how long il lingers.
The CAR from x, to i: is the sum of the included abnomial returns.
CAR (rrTC = y]ÀRir. (^)
Asymptotically (for large Li) the variance of CÂR, is
= (r:-r,+l)crt:. (10)
The distribution of the cumulative abnormal return under Ho is
Cd^(rpr:)~A'(0.a,:(rpr2)). O D
Given the null distributions of the abnormal return and the cumulative abnormal return.
tests of the null hypothesis can be performed.
The abnormal return observations must be aggregated for the event window and across
observations of the event." The individual securities" abnormal returns can be aggregated
using ÀRIT from equation (6) for each event period x = T, + 1 T:. Given N events, the
sample aggregated abnormal returns for period x is
" We normally iook at the average effect of the announceinent rather than examine each firm separately, because other events are occurring and averaging across ali the firms should minimized the effect of these other events, thereby allowing a better examination of the event under study, according to Élton and Gruber (1995). For this aggregation. it is assumed that there is not any clustering. That is. there is not any overlap in the event windows of the included securities.
37

Do Insiders Time Their 'Frades? Evidence from Euronext Lishon
AR:=-ZÂR':- A ( = |
and for laree Li, its variance is
;m[ARr) = —7^ ct] . 03) 3v ,=i
The average abnormal returns can aftervvards be aggregated over the event window using
the same approach as that used to calculate the cumulative abnormal return for each
1 ^ securitv /. For an\- interval in the event window '
CAR{t,.tz) = Y.AR^ 04)
var(C/)/?(r,. r1)) = ^ var( AR -). (15)
Inferences about the cumulative abnormal returns can be drawn usim
CAR{t^T. ) ~ N O, var(C4??(r, ,rD), (16 )
to test the null hypothesis that the abnormal returns are zero. In practice. because cr; is
unknown. an estimator must be used to compute the variance of the abnormal returns as
in (13). The usual sample variance measure of cr; from the market model regression in
the estimation window is an appropriate choice. according to MacKinlay (1967).
Using this to calculate var(.4??r) in (13). Ho can be tested using the following statisticsL,
12 For the variance estimators the assumption that the event windows of the N securities do not overlap is used to set the covariance terms to zero. '' This distributional result is asymptotic with respect to the number of securities N and the length of estimation window /.,.

Do Insiders Time The ir Frades? Evidence írom Euronext Ldshon
AR r x ' / A i 0, = , ~ A (Qd).
var(AR r)':
\ar(CAR(rrr:)) 2
(18)
In order to test if our conclusions could be biased as a consequence ot an inadequate
model for testing abnormal relurns. \ve also used the mean adjusted return and the market
adjusted return models in the return-generating process. For the mean adjusted retum.
abnormal return is taken as
Mean adjusted retums are computed by subtracting the average return for stock i during
the estimation period from the stock"s return during the event period. This method does
not explicitly takes into account the risk of the stock and the return oí the market
portfolio.
For the market adjusted return. abnormal return is taken as.
ARir=RIT~R,. (19)
AR,r=Rir-R,llr. (20)
Market adjusted returns are computed by subtracting the return on the market portfolio
from the stocks return during the event windovv.

Do Insiders Time Their Trados'? Evidence trom Euronext Lisbon
6. EMPIRICAL FINDINGS
\\'e have initialh applied the e\enl study methodolog\ described earlier to ali the 1.052
transactions reported previously. Following Brown and Warner s (1085) methodology v^e
started by eonsidering an event window ot eleven days [-5. +5]. After computing the
abnormal returns (AR) \ve ean draw conclusions regarding the priees" performance at the
event day and on each day surrounding the insiders" transactions as well. W'e apply the
methodology for the purchases and sales samples. but also íor the aggregated
transactions. As stated by Del Brio et al (2002). if we believe that both purchase and sale
returns should be measured as positive abnormal returns in the overall sample. excess
returns for insiders" sales should be multiplied by -1 for the purpose ot aggregation. The
aggregated results we have obtained analysing 1.052 transactions are largely consistent
with the literature providing evidences that a security return around insiders" trades
follows a pattern. as shown in Figure 1.
0.20%
0.10%
0.00%
^ -0.10%
-0.20%
-0.30%
-0.40%
□ AR
□ -4
Fiszure 1: A vera se Abnormal Retum
□
Event Time
□ □ □
This finding can be confirmed by analysing the statistical test described earlier, with the
results being presented in Table 5.
40
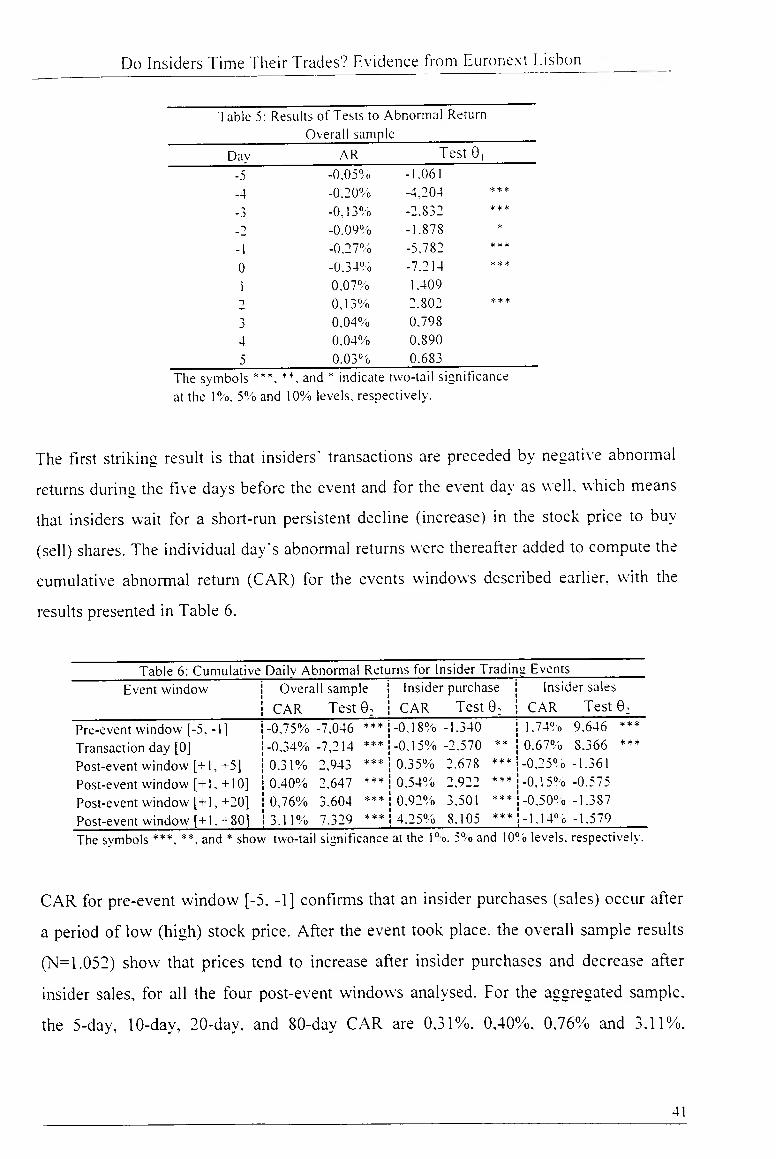
Do Insiders Time Their Frades? Evidence from Euronext Lisbon
Table 5: Results of Tests to Abnormal Return Overall sampE
Day AR Test 0,
-5 -0,05° o -1.061
-4 -0.20% -4,204 * * *
-3 -0.13° o -2.832 * * *
-0.09% -1.878 *
-1 -0,27° o -5,782 * *
0 -0.34° o -7,214 * * *
1 0.07° o 1.409
0.13% 2.802 * * *
3 0,04% 0.798
4 0.04° ó 0.890
5 0.03% 0.683
The symbols **, and * indicate two-tail significance at the 1%. 5o o and I00/o leveis, respectively.
The first striking result is that insiders" transactions are preceded by negative abnormal
retums during the five days before the event and íor the event day as vvell. vvhich means
that insiders wait for a short-run persistent decline (inerease) in the stock price to buy
(sell) shares. The individual day's abnormal returns were thereafter added to compute the
cumulative abnormal return (CAR) for the events windovvs described earlier, with the
results presented in Table 6.
Table 6: Cumulative Dailv Abnormal Returns for Insider Tradinu Events Event window Overall sample Insider purchase Insider sales
CAR Test 6; CAR Test 0: CAR Test 0;
Pre-event window [-5, -1] -0.75% -7,046 *** -0.18% -1.340 1.74° o 9,646 ***
Transaction day [0J -0.34% -7,214 *** -0.15°o -2.570 ** 0.67° o 8.366 ***
Post-event window [+1, +5] 0,31% 2,943 *** 0.35% 2.678 *** -0,25° o -1.361
Post-event window [+1, +10] 0.40% 2,647 *** 0.54% 2.922 *** -0.15° o -0.575
Post-event window [+1, +20] 0.76% 3.604 0.92% 3,501 *** -0.50° o -1.387
Post-event window [+1. +80] 3.11% 7.329 *** 4.25°o 8.105 *** -1.14% -1.579
The symbols ***. **, and * show two-tail significance at the IV 5% and 10oo leveis, respectively.
CAR for pre-event window [-5. -1] confirms that an insider purchases (sales) occur after
a period of lovv (high) stock price. After the event took place. the overall sample results
(N=1.052) show that prices tend to inerease after insider purchases and decrease after
insider sales, for ali the four post-event windows analysed. For the aggregated sample.
the 5-day, 10-day, 20-day, and 80-day CAR are 0,31%. 0.40%, 0,76% and 3.11%.
41

Do Insiders Time Their Frades? Evidence from Euronext Lisbon
respectively. and ali are statistically significam. The null hypothesis is therefore rejected
vvith a 99% confidence levei.
Breaking up the overall sample between purchases and sales. we found that tor lhe shares
bought (TI=667). the patterns and results remain identical to those from the aggregated
sample. Insiders are able to make profits from their purchases. since CAR is significantly
positive within ali the event vvindows analysed. Since the abnormal return lingers for a
period of at least 80 days (as illustrated in Figure 2). outsiders are capable of making
abnormal profit by following insider purchases. Nevertheless. and according to
Portuguese laws. Information regarding insider transactions is only available to the public
at the time a company releases its annual reports. Therefore. although our fmdings
succest the possibility of making abnormal profits by mimicking insider purchases. this
strategy is not practicable due to the lack of Information immediately after the
transactions take place.
Fijzure 2; Cumulalive Abnomial Reluni
hu\
r-
-1,50%
Event Time
From the sales sample (N=385), CAR is positive and significam before the insider
transactions happen, which means that insiders wait for a short-run increase in the stock
price to sell shares. After the event day and for ali post-event vvindow, although being
always negative, CAR points towards the absence of significam excess return. because
the hypothesis that the variable is null is always accepted. Previous researches suggest

Do Insiders Time Their Irades'? Evidence trom Euronext Idsbon
insider buN Íng is a slronger indicalor than selling. Insiders ma\ sell shares to invest lhe
mone\ elseuhere. to pa\ ott loans. pay ott morlgages. etc. Insiders would ha\e little
other ineentixe to bu\ unless the thought the stock price would inerease in the future.
6.1. Firni and Transaction-Spccific Factors
In order to studx an\ induslrx specitic ettect. \\e split the sample into industries. Table 7
presents CAR according to industrç classitications tor the entire sample.
íahle 7:Cumulali\e DaiK Ahnomial Kelurns tor Insider IraJinu b> InJustiA C lassilication 1 Financial 1 Basic Materials
1 Insider purchase Insider sales Insider purchase Insider sales
Fa ent u indou CA R Test 0: CAR Test 0: CAR Test 0: CAR Test 0;
[-5.-1] -0.74° o -5.015 *** 0,65° u 3,004 * + * 0,00% -0,008 3.56% 6,810 * + *
[01 -O.ICo - ^ 1 s * + * 0.23% 2.355 * * 0.23° o 1,315 0.36% 1.528
hl.-5] 0.14o o 0.951 0.02% 0.101 0.42" o 1,089 -0,36° o -0,695
hl.-101 -o.o:0 o -0,090 0,06° o 0.204 0,54" o 0,989 -0,25% -0.336
hl.^0] 0,1 l0o 0.358 -0.08° o -0.175 0.31% 0,403 0.89% 0.853
[-1. -80] -1 .o:0 o -3.265 *** -0.03° n -0.033 1.75% 1.127 4.48° o 2 14S * +
Communications Consumer. Cvclieal
Insider purchase Insider sales Insider purchase Insider sales
E\ ent \\ indow CAR Test 0: CAR Test 0: CAR Test 0; CAR Test 0:
[-5.-1] 1.11% 3.004 1.60° o 4.332 *** -0,04% -0,143 6.91° o 6,254
[0] -0,13% -0.817 0,88% s,342 * * ^ -0,13% -0.920 3,88% 7.856 ***
[-1.-5] 0,97° o * * * -0.61% -1,648 * -0.12% -0,377 1.410 o 1.275
hi.-io] 1.96% 3,755 * * * 0,39% 0.744 0,25% 0,566 -1,90° o -1.218
hl.-20] 3.08% 4,179 *** 0.92% 1.246 1,11% 1.777 * -10.67% -4,827 ***
hh+80] 13.61% Q J * * * 0.81% 0.547 5.51% 4.410 + -6.12o o -1.384
Consumer, Non-cvclical Industrial
Insider purchase Insider sales Insider purchase Insider sales
Event window CAR Test 0: CAR Test 0: CAR Test 0: CAR Test 0:
E-T-l] -2.13% -1.407 4.65% 4,404 * + * -1.16% -2 839 ^ * 0.99° o 1,919 *
[0] -0.66% -0.979 0,49% 1.027 -0,11% -0.607 0
1 J
5§
O •
1,260
hl.-5] 0,02% 0,010 0.15% 0.140 0.44° o 1,084 -0,90°» -1,728 *
hh+10] -0.62% -0,289 1,31% 0.879 -0.58o» -0,999 -0,71° o -0,965
E 4- l J
O
-2,06% -0.679 9.11% 4.314 *** -0,50% -0.605 -1.62% -1,558
[-1.+80] -0.65% -0.108 -8.41% -1.991 ** 5.50% 3.356 *** -6.32% -3.049 ♦**
The svmbols w. and "mdicate t\w-tail s ignitkance at the 1% 5%and 10%levels, respectiveK
We refrain from analysing diversified. technology and utility industries, since each one
had only one company (as shown in Table 3). The analysis of the six remaining sectors
shows that only insiders from Communications industry are able to make significam
43

Do Insiders Time Their ITades? Evidence trom Euronext Lisbon
profits through insider purchases at ali the post-e\ent windows. lhe CAR ot Insider
purchases over lhe 5-days. IQ-days. 20-days. and 80-days alter the transaction da> are ali
sianificanlh posili\e at 0.97° o. 1.96%. 3.08% and 13.61%. respectively. The purchases
made by insiders from the financial sector have the worst performance among the
industries analysed. This contrasts with the conclusion of Baesel and Stein (1979) vvho
found that bank directors earn larger premiums lhan ordinary insiders. In terms ot sale
transactions. insiders of the consumer (cyclical) and industrial sectors tend to pertorm
much better.
As observed before. Wong (2002) and Seyhun (1998) noticed that insiders" benefít might
vvell be a result of some size effect. Hax ing this in mind vve started by testing the inside
trades split up by firm size. Table 8 shows the CAR grouped by the frm size.
Table 8: Cumulative Dailv Abnormal returns for Insider Tradiniz Events by Firm Size Small 13
Insider purchase Insider sales
Event window CAR Test e2 CAR Test 0;
[A.-l] 0,10% 0.390 3.36% 8.989 * * *
[0] 0.03% 0.236 1,53% 9,160 * * *
[+1-5] 0,49% 1.845 * 0.66% 1,770 *
Dl. AO] 0.98% 2.640 * * * 0.38% 0,718
O
r i T -f 1,48% 2.809 * * * -0,68% -0,903
[+1, -80] 6.61% 6.269 * * * 1.17% 0.784
Médium 1/3
Insider purchase Insider sales
CAR Test 02 CAR Test 0.
[-5.-1] 0,20% 0.808 1.57% 4,901 * * *
[0] -0.21% -1.888 * 0.39% 2.737 * * *
[+1.+5] 0.49% 1.980 * * -0.95% -2.962 * * *
[+1,+10] 0.72% 2.047 * * -0.07% -0.155
[+1, +20] 1.56% 3.127 * * * 0.60% 0.936
[+1, +80] 8.92% 8.961 * * * -1.67% -1.303 Larse 1/3
Insider purchase Insider sales
CAR Test 0. CAR Test 02
[-5,-1] -0,83% -5.495 *** 0.26% 1.192
[0] -0.27% -3.994 * * * 0.09% 0,904
[+1.+5] 0,07% 0,481 -0,45% -2.068 * *
[+1,+10] -0.08% -0,385 -0,75% -2,428 * *
[+1, +20] -0.29% -0.952 -1,42% -3.239 * * *
[+1, +80] -2.80% -4.626 * * * -2.93% -3.339 * * *
The symbols ***. and * Indicate two-tail significance at the l0o. 50o and 10% leveis, respectively.
44

Do Insiders Time 1 heir Trades? Evidence trom Euronext Lisbon
For insider purchases. onlv the small and médium capitalisations sho\\ signiticantlv
positive post-e\ent CAR. Cheuk et ai. (2006) argue that in many cases, especially in
small firms. the separation oí management and ownership is rare. Since manager—o\\neis
are. in ueneral. more informed about the business prospects of their own tirms. insider
trading which imolves the directors of small corporations is likely to be the most
profitable. Relatinu tlrm size to insider sales. the results show that only targe tums
insiders are taking any abnomial benetit trom selling their stocks, lhe CAR tor ali the
four post-event windows is negati\e and statistically signiticant.
Following the conclusions of Jeng et ai (1999) \\e wonder whether insider trades are
anvhow related to trade volume. Table 9 shows the CAR grouped by the relative trading
volume of the transactions.
Table 9: Cumulative DaiK Ahnormal Returns lor Insider Trading hvents b> Relative Tradina Volume Low 1/3
Insider purchase Insider sales
Event window CAR TestG. CAR Test 6.
[-5.-1] -0,17% -0.774 1,18% 4,038 * * *
[0] -0.04% -0,430 0,35% 2.702 * * *
[+I.+5] 0.1 7% 0,767 -0.75% -2.549 * *
[+1, +10] 0.22% 0,684 -0,73% -1.756 *
Di,+20] 0,76% 1,689 * -1,53% -2.608 * * *
[+1, +80] 4.04% 4.510 * * * -3,5 8o'o -3.060 * * *
Médium 1/3
Insider purchase Insider sales
CAR Test 0. CAR Test 9.
[-5.-1] -0.26% -1,212 2,07% 6.991 * * *
[0] -0.14% -1,462 0.83% 6.243 * * *
[+1.+5] 0,10% 0.457 -0.05% -0,177
Db+10] 1.01% 2.401 * * 0,25% 0,594
[+1, +20] 1,01% 2,401 * * 0,34% 0.581
Db-80] 2.56% 3.032 * * * 0.43% 0.364
Hitzh 1 h
Insider purchase Insider sales
CAR Test 0. CAR Test e;
[-5,-1] -0.10% -0,397 1,96% 5.696 * * *
[0] -0.27% -2.481 * * 0.84% 5.470 * * *
DE+5] 0,78% 3,214 * * * 0.07% 0.193
[+1. +10] 1.00% 2,907 * * * 0,04% 0,086
[+1. +20] 0.98% 2.008 * * -0,31% -0.450
f+l.+SO] 6.13% 6.283 * * * -0.25% -0.179
The svmbols ***, **. and * indicate two-tail signitlcance at the l"o. 50'o and 10oo leveis, respectively.
45

Do Insiders lime Iheir Irades'? F:\idence trom luroncxt 1 ishon
Purchases in the high relati\e trading volume group predict better pertormanee tor ali the
event windows. Por sales transactions. post-e\ent CAR is statisticallv signiticant onl_\ tor
small relative trading volume, Phis means that larger ahnormal protlts are achieved vvhen
insiders purchase in lareer hlocks or vvhen thev seli shares in smaller lots. Previouslv vve
showed that insiders in Porluguese market usuallv sell shares in larger blocks. and now
we tound that onlv shares sold in small lots bring the greatest protlts. Phis result is in line
with tlndmes that insiders mav sell shares not to avoid losses through the exploitation ot
private mtormation. but to invest the money elsevvhere or to supplv any consumptions
need. Jeng a ul (lbbc)) also argue that insiders with si/eable eorporate holding may
undertake high v olume sales to diversiheation or liquidity purposes.
T he relationship betvveen the tvvo valuation ratios and abnormal return is examined next.
Fable Itb Ci imulative 1 )aiK Ahnormal Rctums tor Insider Tradine T.venB b\ Price to Book Ratio Lovs 1 ' -»
Insider purchase Insider sales
l:\cut vsindi ( AR Test 0, CAR Test 0.
b-A-ll 0,39" o 1,545 3,24% 9,166 * + +
[OJ -0,06° o -0,556 1,42% 8,967 + * +
[-1-5J 0,93"o 3,696 *** 0,54% 1,539
[-1, -10] 1.73° o 4,877 *** 0,24% 0,476 [-1,-201 2,46° o 4,897 *** -0,54% -0,759
[-1,-80] 6,61% 6,577 4,60° o 3.253 Médium 1/3
Insider purchase Insider sales
CAR Test e: CAR Test 0,
1-5,-1] -0,30% -1,282 0,51% 1,81 1 *
[0] -0,07% -0,697 0,15% 1,223
Dl.-?] -0.05% -0,214 -0,47% -1,684 +
[-1,-10] -0,35% -1,051 -0,19% -0,465
[-1,-20] 0,19% 0,41 1 -0,40% -0,717
Dl,+80] 4,81% 5,144 *** -1,89° „ -1.679 Hiiih 1 / J
Insider purchase Insider sales
CAR Test e; CAR Test 02
[-5,-1] -0,84% -3,730 *** 1,50% 4,998 * + *
[0] -0.33% -3,281 *** 0,44% 3,253 * + *
Dl.+5] 0,09% 0,405 -0,84% -2,780 * * *
[+1.-10] 0.09% 0,280 -0,54% -1,272 Dl,+20] -0,07% -0,166 -0,59% -0,973 Dl, -80] 0,15% 0,169 -6,14% -5,104 * * *
The iynibols •"X and * i ndieate tvvo-lail significance at the 1%, 50ó and 10% leveis, respeclively.
46

Do Insiders Time Their Trades? Evidence írom Euronext Lisbon
As noticed before. inside trading beneíits may well be related lo P B and P E ratios (see
see Cheuk et al. (2006)). It is hypothesized that insiders tend to buy at periods of low P B
and low P/E and sell at periods of high P/B and high P/E. Table 10 shows that stocks
bought by insiders wilh the lowest P/B perform better than the stocks bought with
médium and high ratio. Contrarily. íor stocks sold by insiders. the CAR is significantly
neeative only for those shares with the highest P/B. This is consistent with the hypothesis
that a high P/B predicts bad future performance.
A low P/E ratio is also associated with a high future stock return. while high P E is
associated with a low future stock return. Table 11 illustrates this relationship.
Table I I: Cumulative Daily Abnormal Returns lor InsiJer Trading Events by Price Earmngs Ratio Low 1 /3
Insider purchase Insider sales
Event vvindow CAR Test 6; CAR Test 0:
[-5.-1] -0.27oo -1.333 1,70% 5.548 ***
[0] 0,07% 0.809 0,39% 2,830 ***
[+1, +5] 0,39% 1.941 * -0,28% -0,920
[+1,+10] 0,37% 1.286 -0,19% -0.449
[+1, +20] 1.25% 3.098 *** -0.42% -0.690
[+1.-80] 1.41 % 1.741 * -1.13% -0.928
Médium 1/3
Insider purchase Insider sales
CAR Test 0: CAR Test 0:
[-5.-1] -0.58% _"> 313 * * 0.21% 0.819
[0] -0,30% 914 * * * 0,31% 2,701 ***
[+1, +5] 0.06% 0.242 -0.23% -0,922
[+1,+10] -0.15% -0,472 -0.41% -1,149
RI.+20] -0.19% -0.414 -0.71% -1.394
[+1, +80] -0.30% -0.326 -0.76% -0.751
Hiizh 1 ;3
Insider purchase Insider sales
CAR Test 0; CAR Test 0:
[-5--1] -1,13% -4.558 *** 1,54% 4.448 ***
[0] -0.23% -2,049 ** 0,40% 1.058
[+1-+5] 0,59% 2.387 ** -0.43% -1.242
[+1,+10] 0,36% 1.017 -0.62% -1,274
[+1, +20] -0.51% -1,032 -1.38% -1.990 **
[-1. +80] -1.06% -1.072 -4.1 1% 953 ***
The symbols ***■ **. and * indicaie tvvo-tail significance at the 1%. 5oo and 10oo leveis, respectively.
47

Do Insiders Time Their Trades? Ex idence from Euronext Lisbon
Therefore, as stated by Cheuk et al. (2006). it is likely that insiders. vxho are more able to
assess the value of their firms, bux vvhen the P/E ot the stock is loxx. and sell xxhen the
P/E is high. Table 11 shows that for the purchase sample. positive post-event CAR is only
found in the loxx P/E group. Contrarily. for the sales transactions. post-event CAR is
sianificantly negative only for the high P/E group. Both results are signihcant only for
[+1. +20] and [+1. +80] event xvindoxvs.
Overalk our results confirm that insiders take into account their company valuation
before buying or selling stocks of their oxvn firms.
6.2. Methodology Adjustments
As explained before. xxe also used txvo altemative strategies in order to control the results.
Abnormal returns xvere also computed using the mean adjusted return (equation 19) and
the market adjusted return (equation 20). For the mean adjusted return. the pattems
remain identical, as shovvn in Table 12 (xvhich compares xxith the results from Table 6).
Table 12; CAR for Insider Tradine Events Usine the Mean Adjusted Return Model Event Windoxv Overall sample
CAR TestG:
Insider purchase
CAR Test 0:
Insider sales
CAR Test0;
Pre-event vvindow [-5, -1] Transaction day [0] Post-event vvindow [+1, +5] Post-event window [+1, +10] Post-event window [+1, +20] Post-event window f+1, ^-80]
-1,08% -8.862 *** -0,46% -8,441 *** 0.29% 2,401 ** 0,3V+o 2,161 ** 0,92% 3,771 *** 4.41% 9.060 ***
-0,54% -3.595 *** -0,26% -3,928 *** 0,42% 2.754 *** 0,72% 3.358 *:,t +
1,43% 4.751 *** 7.10% 11.767 ***
2.01% 9.756 *** O.SO+o 8.654 -0.08% -0.384 0,22% 0.770 -0.03% -0.063 0.24% 0.296
The svmbols **+ and * indicate two-tail sienificance at the 1%. 5% and 10% leveis, respectively.
Previously, vve have done some sample modifications and adjustments related to
complications arising from violations of the statistical assumptions. These complications
arise vvhen event xvindoxvs of the included securities overlap in terms of calendar time or
vvhen abnormal return calculation is influenced by the abnormal return of an early event.
These adjustments, hoxvever, did not modify our main conclusions and fmdings.
48

Do Insiders Time Their Trades? Evidence trom Euronext Lisbon
Table 13 reports the results. already taking into account the clustering issue. \\ e have go
back to the market model.
Tahle 13: Cumulative Dail\ Abnormal Returns Takin<i into Account the Clustering Issue Event Window Overall sample
CAR Test O.
Insider purchase
CAR Test e:
Insider sales
CAR Test 0;
Pre-event window [-5, -11 Transaction day [0] Post-event window [+1. ^5] Post-event window [+1, +10] Post-event window [+1, +20] Post-event window f-H. +80]
-0.75% -6.593 *** -0,35% -7,011 ***
0,35% 3,103 *** 0.46% 2.870 *** 0.86% 3.803 *** 3.36°o 7.438 ^
-0.1 1% -0.798 -0.16% -2.557 ** 0.46% 3.271 *** 0.64°ó 3.211 ***
1.05% 3.758 *** 4.85% 8.657 ^
1,74% 9.150 ***
0.66% 7.757 *** -0.1 8% -0.963 -0,18% -0,677 -0,56% -1.470 -1.04% -1.366
The symbols ***. **. and * indicate two-lail signitlcance at the 1%. 50o and 10 '»leveis, respectively.
Althouah we have reduced the sample size and chosen a nevv approach for those
transactions vvhere the clustering was noticeable in the event dates, the results remain
mostly identicak and for the three samples, the statistical significant regions remain
unchanged. Friederich et al. (2000) argue that although event clustering can affect the
results through cross-sectional correlation of the excess returns. this is not necessarily a
strons limitation vvhen different industries and daily data are used because the probability
of events being clustered decreases under those circumstances. As the events in our
research are relatively evenly distributed across the sample period. we are not expecting
any bias relating to clustering.
This portfolio approach allows us also to achieve a better fitting for the market model
parameters. Using lhe initial sample (N=1.052). the average value for the coefficient of
determination R: is 0,20. higher than the estimation found by Duque and Pinto (2004)14.
The authors have used the PSI Geral index to compute the market return parameters,
rather than the PSI-20 index that we use in our research. After the portfolio approach, R"
coefficient average was slightly improved to 0,22. The average p, (0.70 for the 1.052
sample or 0.72 for the 855 sample) differ substantially from 1, but the average beta was
computed as a non-weight average of 28 securities (only 17 belonged to PSI-20 index at
the end of the sample period, although they count for 98% of the benchmark value).
14 The higher the R-squared the larger the variance reduction of abnormal return.
49

Do Insidcrs l ime 1 heir 1 rades? I \ idcncc trom l uroncxt 1 ishon
lablc 14 reports the resulls taking mio account lhe elustenng issue and lhe non-
oxerlappine approaeh simultaneousl).
1 ablc 14; C AR 1 akinii into Accounl the C kisterini: Issue and a Non-l tverl appine Approaeh
1 \ ciit \\ iikIou 1 Oeerall sample i Insider purchase 1 Insider sales l ; ( AR IcslO, 1 CAR lesl 0, 1 PAR festt).
Rrc-cvent u indou |-5 .-11 1 -0,71"., -4 7o: -0,2 1 " n -I.0S7 1 1.37" „ 5,633 +
i 1 ransaclmn da\ 101 1 -0,74" -in.sss -0,40"., -5,370 ; i io"„ lo.i 11 t + t
i Piist-cv cnl iiid(i\s | 1, '51 i 0.47"u 3.144 "D 0,50"., 2,601 1-0,45"., -1,838 *
1'osl-cvcnt window | • 1, • 10| i 0,40"o 2.:so ++ i 0,67" „ 2.4 S4 ** • -0,25".. -0,730
PosI-lwcnl w indow 1 ■ 1 ' 20| 1 0.5 1"„ I.OSl * 1 i 0,74" o 1,042 t !-0,20"., -0,417 l Post-c\cnt window | • 1, • S01 1 0,40" „ 0.S07 1 0.70" „ 0.02 1 1-0,21"., -0,212
1 hc s\ mbols * *t, *t. and f indicale iwo- ■tail siunificaiKc at the 1"» , 5" ., and 1 0' leveis, respectively.
I he DAR for lhe signifieant lesl lor lhe first three shorter post-event vvindovvs and the AR
tor the e\enl dav remain rohust and praetieally identieal. h AR lor hoth 1-5, -1 j and | • I,
+51 windows. where we ha\e eompletely eliminated lhe overlappina, are -(),710'o (O^ -
4,704) and 0.47°,• (Oj ' 3,143). In lhe previous sample, DAR for [-5, -1| and 1 + 1, +5|
event windows were -0.75% (0: = -6,503) and 0,35% (0: = 3,103). For longer periods,
namely for lhe 1 + 1. +801 event window. lhe lesl 0; eease from being significam. Larger
event windows eould rellect other taclors that lead shares lo rally or slump lhal is externai
and outside the firm eontrol. and news or events that are unknovvn hy insider at the time
the transaction is executed.
One potential prohlem that can arise from using hoth lhe mean adjusted return and market
model is that the results can he sensitive to the inclusion (or exclusion) of other event
periods into the estimation period. Brown and Warner (1980) argue that it high leveis ot
ahnormal performance are present. then including observations trom around the time ot
the event gives more weight to apparent "Outliers", tending to increase the variance ot the
security-specific performance measures, and lowering the power ot the tests. To cope
with th is potential prohlem. we have redone the analysis using the market adjusted return
model. This method allows for ahnormal return not to he contaminated by other events
taking place during the estimation period.
50

Do Insiders Time lheir frades? Evidence from Euronext Lisbon
The results are presented in Table 15.
Table 1 5: Cumulative Dailv Abnormal Returns Usine the Vlarket Adjusted Return
Event Window Overall sample Insider purchase Insider sales
CAR Teste. CAR Test 6; CAR TestG;
Pre-event window [-5, - 1] -0.58% -3.548 *** 0.02% 0.097 1.36% 5.246 ***
Transaction day [0] -0.82% -1 1,226 *** -0.66% -7.087 *** 1.02% 8.836 ***
Post-event window [+1, W5] 0.37% 2.255 ** 0.42% 2.010 ** -0.30% -1.159
Post-event window [-1 -10] 0.25% 1.101 0.49% 1.684 * 0,06% 0.171
Post-event window [+1. +20] 0.28% 0.860 0.73% 1.761 * 0.31% 0.602
Post-event window [^1 -80] -0.51% -0.789 0.72% 0.872 2.13% 2.060 **
The symbols ***, **, and * indicate two-tail significance at the 1%. 50o and 10oo leveis, respectively.
For the aggregate sample, the pattern and significance of the abnormal returns persist
until the [+1. +5] event window, but vve loose the effect for the remaining post-event
windows.
51

Do Insiders Time lheir Trades? Evidence from Euronexl Lisbon
7. CONCLUSIONS
This study focused on insider trading in the Euronexl Lisbon stock market betvxeen
January 2001 and December 2005.
Although there exist other studies on the subject using similar methodologies and data
treatment, this type of research is particularly sensitive to differences in jurisdiction. As
noticed by Bhattacharya and Daouk"s (2002) and Beny (2005). inside trading legislation
varies widely around the world vvith different impact on trading activity and míormation
release. Even vvithin the European Union, that issued the "Directive 2003/6/EC". the rules
and regulations do not provide a completely uniform set of practices. resulting on a
country dependent effect. This is vvhy the results for the Portuguese market become
relevant.
Our overall results show that. although there exists legislation to regulate insiders"
transactions in Portugal, they still seem to be able to make abnormal profits when trading
shares of their own firms. We find patterns in abnormal retums that are consistem with
directors engaging in short-term market timing: they sell (buy) after an increase (decline)
in prices. and their trades are followed by a partial price reversal.
We find that insiders time their trades and they convey information when they buy or sell
securities in their own firms. but our results suggest that insider buying is a stronger
indicator than insider selling. After the purchases take place, prices increase in ali the
post-event windows analysed and the test 0; is always signiticant. After selling. prices
decline, but the results point towards the absence of significam negative excess return. In
Portugal, insiders seem to do far more buying than selling in the sample period.
Therefore. when analysing the aggregated sample. the positive excess returns from
purchases are more than enough to compensate the absence of significam negative return
(multiplied by -1 for the purpose of aggregation) from insider sales.
Do Insiders Time Their Trades? Evidence from Euronext Lisbon
Since the abnormal return linyers for a period ot at least 80 days. outsiders are capabk ot
makine abnormal profit by mimicking insider trading. This is particular!) true tor insider
purchases. Therefore. the results otter evidence inconsistent vvith the strong and semi-
stronn form of efficient market hvpothesis. Ehe íirst one asserls that insiders should not
be able to eam excess returns from privileged asymmetric intormation. and the second
one alio ws for the existence of abnormal returns immediately after the inside transactions.
bui not on other da\ s.
A possible explanation for this lies in the fact that companies operating in Portugal do not
immediately disseminate their insider transactions intormation to the public. According to
Baesel and Stein (1979). if the market was efficient in the semi-strong sense. insiders
could use their information profitably, but once the intormation or intormation on the
insider tradinn actixit) is released to the pubhc it will have no turther trading \alue. In
Portuaak lhe public only gets access to the insider trading intormation at the moment a
companv releases its annual report. This means that outsiders do not have access to
information allowing them to mimic an insider transaction immediately after it took
place. When the information finally arrives at the public. it is already worthless m tems
of trading value. Therefore, vve conjecture that the ineffrciency in the Portuguese stock
market arises from the lack of information at the right time. rather than from the inability
of security prices to adjust quickly to fully reflect new information. The "Directive
2003/6/EC" of the European Parliament, regarding the release of insider trading
information recommends that member States shall ensure that issuers inform the public as
soon as possible of inside information1". In Portugal, this recommendation has not up till
novv being followed.
In Spain. for instance. Comision Nacional dei Mercado de Valores (CNMV). which is the
Spanish version of the Portuguese CMVM, requires insiders to report their trading within
fifteen davs following the trade, but unlike Portugal, the tiles remitted by the insiders are.
from that moment on. available to the public. Even though for the Spanish stock markets.
Del Brio et ai (2002) results suggest a semi-strong efficient market, where insiders are
15 Article n. 0 6 from the ""Directive 2003/6/EC"
53

Do Insiders Time Their Frades? Evidence from Emronext Lisbon
able to beat the market by investing using their private information. vvhile outsiders
cannot earn abnormal profits by using the publicly available information concerning
insider trades compiled by the CNMV.
Even if outsiders in Portugal had access to insider information vvithout dela\. our results
succest that some insiders transactions may comprise more information than others.
For the shares bouuht. \ve íind that the largest and persistent abnormal retums are íound
in purchases that have some common denominators: the firm belongs preferentially to the
communication industry; the firm is small or médium in terms ot market capitalization;
the relative tradinu volume of the purchase is high and the price to book ratio and the
price earnings ratio of the security is small.
For the shares sold. although the results trom analysing the entire sample point towards
the absence of significam negative excess returns. there are some íirm and transaction-
specific factors that lead abnormal returns to fali within the statistical significam regions.
These sales have some common features: the íirm is usually a consumer (cyclical) or an
industrial companv; the íirm is large in terms of market value; the relative tradmg volume
of the sales is lovv and the price to book ratio and the price earnings ratio of the shares
sold are typically high.
We have previously shovved that insiders in the Portuguese market usually sell shares in
larger blocks, and novv we found that only shares sold in small lots (measured by relative
tradinc volume) bring the greatest abnormal profits. W e presume that insiders are
compelled to sell shares in larger blocks to invest the money elsevvhere. vvithout concem
to beat the market by timing their sales. On the other hand. vvhen insiders sell small
amounts of shares, they care about the best moment to trade.
54

Do Insiders Time Their Trades? Evidence from Euronext Lishon
8. REFERENCES
Baesel. J. B, and Stein. G. R. (1979). The Value of Information: Inferences from the
Profitability of Insider Trading. Journal of Financial and Quantitative Analysis. 14. pp.
553-571.
Ball. R. and Brown, P. (1968). An Empirical Evaluation of Accounting Income Numbers.
Journal of Accounting Research. 6(2). pp. 159-178.
Beny. L. N. (2005). Do Insider Trading Laws Matter? Some Preliminary Comparative
Evidence. Working Paper. The University of Michigan Business School.
Bernard. V. L. (1987). Cross-Sectional Dependence and Problems in Inference in Market-
Based Accounting Research. Journal of Accounting Research. 25. pp. 1-48.
Bhattacharya. U.. and Daouk. H. (2002). The World Price of Insider Trading. Journal of
Finance. 57. pp. 75-108.
Brown, S. and Warner J. (1980). Measuring Security Price Performance. Journal of
Financial Economics. 8. pp. 205-258.
Brown. S. and Warner. J. (1985). Using Daily Stock Returns; The Case of Event Studies,
Journal of Financial Economics. 14. pp. 3-31.
Calvo, E. and Lasfer, M. (2002), Why do Corporate Insiders Trade? The UK Evidence.
Working Paper. Cass Business School.
Campbell, J. Y.. Lo. A. and MacKinlay A. C. (1997). The Econometrics of Financial
Markets. Princeton; Princeton University Press.

Do Insiders Time Their Trades? Evidence from Euronext Lisbon
Cheuk. M.-Y.. Dennis. K. F. and Raymond. W. (2006). Insider trading in Hong Kong:
Some Stylized Facls. Pacific-Basin Finance Journal. 14. pp. 73-90.
Chiang. M.-EL Hwang. L.-J.. Wu. Y.-C. (2004). Insider Trading Performance in lhe
Taiwan Stock Market. International Journal of Business and Ecnnomics. 3. pp. 239-256.
CMVM. "Regulation N0 7/2001 (with lhe amendments introduced and re-published by
CMVM Regulation No. 1 1/2003. CMVM Regulation No. 10/2005 and CMVM
Regulation No. 3/2006)"" 20 Oclober 2006 <http;//v\ww.cmvm.pt/NR/exeres/D6BBE:oa-
D610-42ED-9858-5DDD37E222DA.htm>.
CMVM. "Decree-Law No. 52/2006. of 15 March"" 20 October 2006
<http;//www.cmvm.pt/NR/exeres/E736007D-EFBF-4F7B-91E8-49F3BA9FA050.htm>.
(Contents in Portuguese)
CMVM. "Portuguese Securities Code, Section II. Qualifying holdings, article 16
(Communication duties)"" 20 October 2006
<http://www.cmvm.pt/NTR/rdonlyres/7F744DB2-D365-4552-8AF6-
8EB931 B99C69/3529/c vm_tituloI.pdf >.
CMVM. "Portuguese Securities Code. article 378 (Insider trading) 20 October 2006
<http://www.cmvm.pt/NR/exeres/7195446F-FE74-4595-9F7B-F05Ca 1687777.htm>.
CMVM. "Annual report on the situation of the Portuguese securities markets - 2001"
20 October 2006 <http://\\ww.cmvm.pt/NTR/rdonlyres/99958CD2-349C-4BBB-AC91-
B2D2FC275C AD/3410/RA2001 Ing.pdf>.
CMVM, "Report on the General Situation of the Securities Markets - 2002"
20 October 2006
<http://www.cmvm.pt/NR/exeres/5068D076-9D25-4533-819D-CC87770F 51D3.htm>.
56
Do Insiders Time Their Trades9 Evidence from Euronext Lishon
CMVM, "Report on the General Situation of the Securities Markets - 2003
20 October 2006
<httP://ww\v.cmvm.pt/TSIR/exeres/C2F9EE9E-0011 -4767-992 l-9C298A0432BB.htm>.
CMVM. "Report on the General Situation of lhe Securities Markets - 2004
20 October 2006
MittpE/vvxvxv.cmvm.pt/NR/exeres/7D6475Ba-8C4B-4BE6-A650-A1 j_6877—D7.htm>.
CMVM. "Report on the General Situation of the Securities Markets - 2005""
20 October 2006 <http;://ww\v.cmvm.pt/NR/exeres/99958CD2-349C-4BBB-AC91-
B2D2FC275CAD.frameless.htm>.
Código das Sociedades Comerciais. "Chapter VII - Publicity of Ownerships and Market
Abuse: article 447. 0 and article 448.0" 20 October 2006
<http;//\\v\vv.apdt.org/guia/L/CSC/csca.htm>. (Contents in Portuguese)
Del Brio. E. B., Miguel. A.. Perote, J. (2002). An Investigation of Insider Trading Protits
in the Spanish Stock Market, The Quarterly Review of Economics and Finance. 42. pp.
73-94.
"Directive 2003/6/EC of the European Parliament And Of The Council of 28 January
2003 on insider dealing and market manipulation (market abuse)". Official Journal of the
European Union. L 096. 12/04/2003 P. 0016 - 0025. 20 October 2006
<http;//wrw\v.europarl.eu.int/comparl/econ/lamfalussy_process/market_abuse_directive/m
arket_abuse.pdf>.
Dolley, J. C. (1933), Characteristics and Procedure of Common Stock Split-Ups. Marrar d
Business Reriew. 11. pp. 316-326.
Duque. .1. and Pinto. I. (2004). How Sensitive are Price Sensitive Events. Working Paper.
Departamento de Gestão do 1SEG.

Do Insiders Time Their Trades? Evidence trom Euronexl 1 isbon
Eekbo. B, E. and Smith. D. C. (D)d8). The Conditional Performanee of Insider
Trades. Journal of Financc. 53. pp. 467-4L)8.
Élton. E. J. and Gruber. NE J. (Idd5). Modem Porrfolio llicory and Invcsímcni Analysis,
New N'ork; John \\'ile> N Sons.
kama. E. E.. Eisher. I .. Jensen. M. and Roll. R. (IdbP). The Adjustment of Stock Erices
to New Information. Inicrnalional Economic Rcvicw. 10, pp. 1-21.
Eriederich. S.. Gregorv, A.. Matatko. J. and Tonks. 1. (2000). Stock Erice Eatterns around
Directors" Frades on the London Stock Exchange. 11 orkmy Paper. London School of
Economics.
Heinkel. R. and Rraus, A. (1087). The Effect of Insider Trading on Average Rates of
Return. The Canadian Journal of Eeonoiuies. 20. pp. 588-61 1.
Instituto Eortuguês de Corporate Governance (2006). "White Book about Corporate
Governance in EortugaE", 20 October 2006
<http://www .clion .pt, cLtov/images/pdf/LivroBrancoCGov.pdt>. (Contents in Eortuguese)
Jaffe. J. (1074). Special Information and Insider Trading, Journal of Business. 47, pp.
163-103.
Jeng. L. A.. Metrick, A., and Zeckhauser. R. (1090). The Profits to Insider Trading: A
Performance-Evaluation Perspective. NBER Working Paper. No. 6913.
Rabir. R. and Veanaelen, T. (1996). Insider Trading Restrictions and the Stock Market;
Evidence from the Amsterdam Stock Exchange, European Econumic Review. 41, pp.
1591-1603.
58
Do Insiders Time Their Frades? Evidence from Euronext Lisbon
MacKinlay. A. C. (1997). Event Studies in Economics and Finance. Journal of Economic
Literuture. 35. pp. 13-39.
Moss. J. D. and Kohers. T. (1990). Abnormal Gains for Insiders Tradina Prior to
Unexpected Corporate Eamings and Di\idend Announcements. Akron Business and
Economic Reriewc 21. pp. 63-74.
Seyhun. N. (1986), Insiders" Profits. Costs of Trading and Market Efficiency. Journal of
Financial Economics, 16. pp. 189-212.
Seyhun. N. (1988). The Information Content of Aggregate Insider Trading. Journal of
Business, 61, pp. 1-23.
Seyhun. N. (1998). Investment Intelligence from Insider Trading, Cambridge. Mass: MIT
Press.
Wong. M.. Cheung. Y., Wu. L. (2000). Insider Trading in the Hong Kong Stock Market.
Asia-Pacific Financial Markets, 7. pp. 275-288.
Wonn. E. (2002), Investigation of Market Efficiency: An Event Study ot Insider Trading
in the Stock Exchange of Hong Kong. Stanford University Department of economics,
unpublished.
59